Crypto markets entered the new week on the back foot as a wave of macro uncertainty sparked heavy liquidations across major digital assets.
Key Takeaways:
Macro uncertainty triggered over $550 million in crypto liquidations as bitcoin and ether came under pressure.
Tariff threats, US shutdown risks, and yen volatility are driving a broader risk-off shift toward safe-haven assets.
Derivatives markets have turned defensive, with rising volatility and increased demand for bitcoin downside protection.
After trading in a tight range over the weekend, prices slid during early Asian hours, triggering more than $550 million in leveraged long liquidations, according to market data cited by QCP Asia.
Bitcoin briefly dipped to the $86,000 level before stabilizing, while Ethereum fell toward the $2,785 area.
Tariff Threats, Shutdown Fears, and FX Uncertainty Weigh on Markets
Market participants point to a cluster of macro developments driving the move, according to QCP.
Chief among them were comments from President Donald Trump on the possibility of imposing 100% tariffs on Canadian imports, renewed concern over a looming partial shutdown of the US government, and ongoing uncertainty around potential US-Japan coordination to arrest further weakness in the yen.
Currency markets remain a key pressure point. A “rate check” on USD/JPY by the New York Fed late last week signaled growing sensitivity to yen depreciation, with the 160 level widely viewed as a threshold that could prompt intervention.
While the pair has since pulled back, it continues to trade near two-month highs around 154, prompting investors to unwind short-yen positions rather than risk sudden policy action.
QCP analysis notes that crypto assets traded in a narrow range over the weekend before coming under pressure in early Asian hours, triggering over $550 million in leveraged long liquidations. BTC briefly tested $86K before finding support, while Ethereum fell to the $2,785 area.…
US domestic politics are adding another layer of tension. Although broader risk sentiment found some relief after Canadian Prime Minister Mark Carney said Ottawa has no plans to pursue a free trade deal with China, fiscal negotiations in Washington remain unresolved.
House Republicans have advanced spending bills that include roughly $64.4 billion for border security and the Department of Homeland Security, while Senate Democrats have indicated they will block the measures.
With current government funding set to expire on January 30, failure to reach an agreement would result in a partial shutdown.
Markets appear to be taking that risk seriously. Polymarket odds currently imply roughly a 75% chance of a shutdown by January 31, a dynamic that echoes last autumn’s fiscal standoff, which coincided with a sharp drawdown in crypto prices.
Bitcoin Options Signal Rising Downside Protection as Volatility Climbs
Derivatives markets are already reflecting a more cautious stance. Put skews and implied volatility have risen across maturities, with traders rolling downside protection in bitcoin options from the 88,000 level toward 85,000, according to QCP.
Alongside ongoing geopolitical and fiscal headlines, markets face a busy week that includes major technology earnings and a Federal Reserve policy decision.
While the Fed is expected to hold rates steady, investors will be watching closely for any shift in Chair Jerome Powell’s guidance.
“With multiple macro risks unresolved, crypto prices are likely to chop around in the near term, pending greater clarity, particularly around the risk of a US government shutdown,” QCP said.
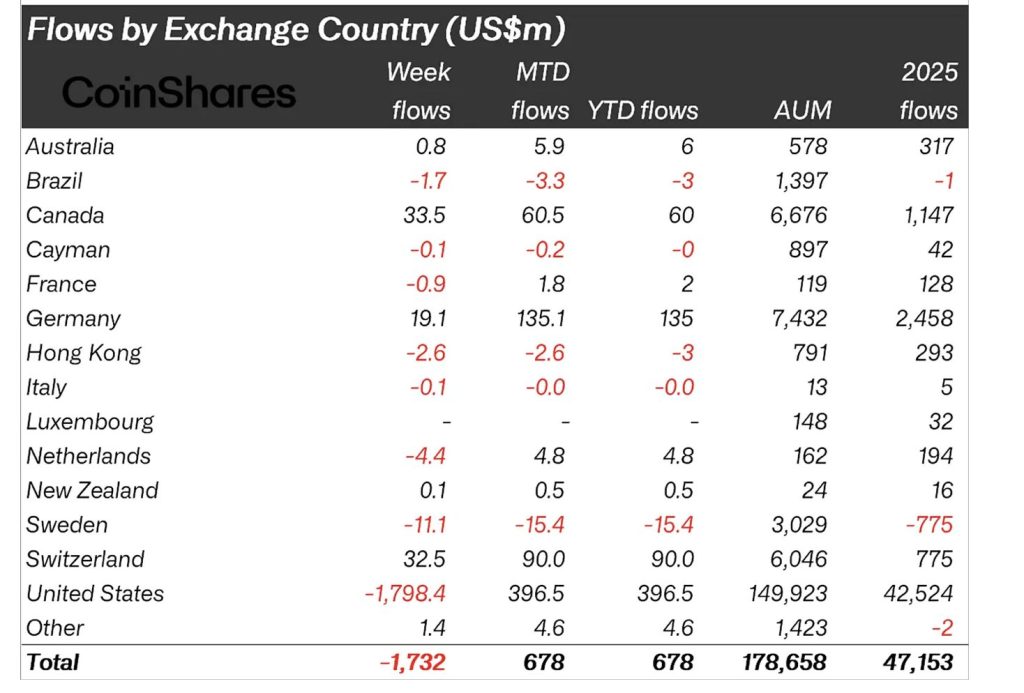
Digital asset investment products saw sharp outflows last week with investors pulling $1.73 billion, the largest weekly decline since mid-November 2025, according to CoinShares report authored by head of research James Butterfill.
CoinShares notes that the wave of redemptions reflects persistent bearish sentiment, driven by fading expectations for interest rate cuts, negative price momentum and growing disappointment that digital assets have not yet benefited from the broader “debasement trade.”
Outflows were heavily concentrated in the United States, which accounted for nearly $1.8 billion, while sentiment was more mixed across Europe and Canada.
Bitcoin and Ethereum Lead Weekly Redemptions
Bitcoin products recorded outflows of $1.09 billion, the largest since mid-November 2025, showing that investor confidence has yet to recover following the October 2025 price crash.
Ethereum followed with $630 million in outflows while XRP investment products saw an additional $18.2 million exit the market — highlighting broad-based weakness across major assets.
Butterfill addes that minor inflows into short-Bitcoin products — totalling just $0.5 million — suggest bearish positioning remains limited, but overall sentiment has not meaningfully improved.
Solana was also a notable exception attracting $17.1 million in inflows and bucking the wider negative trend. Smaller altcoins such as Binance-linked products ($4.6 million) and Chainlink ($3.8 million) also posted modest gains.
Regional Flows Diverge Outside the US
While the US dominated the outflows, CoinShares reports that other regions saw investors take advantage of price weakness to add to long positions.
Switzerland recorded inflows of $32.5 million, Canada added $33.5 million, and Germany saw $19.1 million in inflows. Sweden and the Netherlands both posted smaller outflows of $11.1 million and $4.4 million respectively.
The divergence suggests that while US-based investors are reducing exposure some international allocators continue to view pullbacks as entry opportunities.
Long-Term Adoption Model Points to $317K Bitcoin Floor by 2029
Despite near-term bearishness in fund flows CoinShares Research maintains a bullish long-term outlook based on its updated adoption-based valuation model.
The framework models Bitcoin as a global savings asset competing with deposits, gold, real estate, and bonds. Using conservative assumptions — including sub-1% disposable income allocation and a reduced flow-to-market-cap multiple of 3.5x — CoinShares projects Bitcoin ownership could rise from roughly 560 million owners in 2025 to 1.16 billion by 2029.
Under this scenario Bitcoin’s valuation floor could reach approximately $317,000 by 2029 implying a potential 3.2x return from mid-November 2025 levels, notes the firm.
CoinShares stressed that the model is designed to estimate price-supporting bottoms rather than speculative cycle peaks with ETF growth and emerging-market adoption continuing to accelerate global participation.
A nine-year-dormant Ethereum wallet moved 50,000 ETH to a Gemini-linked address, reviving 2017‑era coins and raising questions over potential selling pressure. A previously inactive Ethereum wallet transferred 50,000 units of the cryptocurrency to an exchange wallet associated with Gemini, marking…
Litecoin and ONDO have slipped into corrective territory after sharp early‑January gains, with lower highs, fading volumes, and stretched valuations forcing traders to reassess entries and focus on projects with clearer supply, timelines, and real product usage. Litecoin and ONDO…
How to hack Bitcoin? How does the blockchain calculate time? How does mining difficulty change? What happens if two miners mine a block simultaneously? Where are transactions stored before confirmation, how are fees calculated, and is it possible to send a transaction with zero fee? What types of nodes exist in the blockchain, and how do they differ? When can you use mining rewards?
This is roughly how I studied all the information around these topics.
Here I provide deeper answers to these questions because popular materials about Bitcoin either don’t explain these things at all or do so very superficially. To understand this article, you need a minimal understanding of how blockchain works, which you can get here: https://vas3k.com/blog/blockchain/
TL;DR
How to hack Bitcoin? A quantum computer will only be able to derive a private key from a public key after a transaction has been sent. If no transaction has occurred, the wallet is protected. A 51% attack only provides the ability to cancel your own or others’ transactions to double-spend your own coins; gaining control over others’ coins is impossible.
How does mining difficulty change? Difficulty is recalculated every ~2 weeks based on the mining time of the previous two weeks.
What happens if two miners mine a block at the same time? The chain temporarily splits until one branch becomes longer. The longer branch becomes the main one.
When can mining rewards be used? After 100 blocks.
How does the blockchain calculate time? Based on the median time of the past 11 blocks and the system time of the nodes.
Where are transactions stored before confirmation, how is the fee calculated, and can you send without one? They’re stored on nodes for no more than two weeks. A zero-fee transaction is theoretically possible but practically almost impossible to get confirmed.
What nodes are in the blockchain and how do they differ? Full nodes — hold the blockchain data and enforce the rules. Miners — query full nodes for data and build new blocks. Light nodes — often used in wallets on weak devices; they query full nodes for what they need.
What’s the point of Bitcoin (besides speculation), in plain English
At the end of researching.
Bitcoin is an alternative financial system that does not require user trust. When using traditional banks, we must trust them not to steal or lose our money, and if that happens, we must trust the state to be able to return it. We also have to hope that money won’t be blocked at the whim of authorities or bank employees.
The point of Bitcoin is the opposite: everything is tied to strict mathematics that removes the probability of all these potential problems (or drastically reduces), provided you store Bitcoin in a personal non-custodial wallet.
Non-custodial wallet: A wallet controlled only by whoever has the private key; essentially just a small file/program that stores keys and signs transactions.
Custodial wallet: An account on an exchange that controls your assets and stores your funds in its own non-custodial wallets. This allows the exchange to block or seize your funds if you violate its rules or national laws, though the exchange offers more convenient and expanded functionality in return.
Interesting fact: A Bitcoin wallet is not an object inside the blockchain, but a program that stores keys and signs transactions.
The blockchain stores UTXOs (Unspent Transaction Outputs). Each UTXO is “locked” by a condition (program), usually tied to an address (practically, a hash of a public key).
To spend a UTXO, the wallet creates a transaction referencing that UTXO as an input and adds a signature. Network nodes verify the signature and the script’s execution. As a result, the old UTXO becomes spent, and the transaction creates new outputs — new UTXOs for the recipients.
A private key is a number. A public key can be calculated if you have the private key, but the reverse is practically impossible (how that’s attacked is discussed later in the “attacks” section). Using a private key, you can sign data, but this signature cannot be forged with a public key. Meanwhile, the public key can verify that the signature was produced by the corresponding private key.
— — — — —END-PRIVATE-KEY — — — — —
In early versions, the wallet address was the public key. But later, addresses derived as a hash/encoding of the key or script began to be used. This is a crucial point for the section on quantum computer attacks.
Once a transaction is signed, it must be embedded in a block. First, it goes into a general pool of unconfirmed transactions (mempool), where any miner can take it to create a block.
But a transaction can exist only once in the blockchain, so the network can’t allow every miner to create their own block with the same set of transactions and have them all accepted.
Block Header
Each block has a header containing version data, the previous block’s hash, the merkle root (hash of all transactions in the current block), time, bits (mining difficulty), and a nonce.
All of these fields are combined and then hashed via SHA-256.
SHA-256 is a hashing technology: take some data and turn it into a different set of numbers that you can’t convert back into the original data if you only know the hash. But you _can_ verify it, because for a fixed input X the result is always the same output Y. So knowing X gives you Y; knowing Y does not practically give you X back — even with a quantum computer.
You can try hashing any data here. SHA-256 is also one of the core tools in the HTTPS connections we use every day, and it plays a key role in hundreds of internet protocols.
The nonce is needed to find out whose block to record. Miners change the nonce so the header’s hash is less than the target. In our example, the hash has 19 zeros.
Finding such a hash is hard. It takes roughly ~10 minutes of the entire Bitcoin network’s mining power. Blocks should appear roughly every 10 minutes — that’s how Satoshi Nakamoto designed it.
Why exactly this many zeros, and how does mining difficulty change?
Proof of Work in real life
It’s not actually about the zeros, but about the **target**. The target determines mining difficulty: the smaller the target, the higher the difficulty. A valid block header hash must be ≤ the target. Because small target numbers in hexadecimal start with zeros, hashes often appear with many leading zeros (e.g., ~19 or more). The smaller the target, the rarer it is for a random hash to land below it, so mining becomes harder.
Difficulty Calculation Hack: If the difficulty increases by 16 times, the required threshold becomes 16 times lower— often resulting in one additional leading hex-zero.
Difficulty adjustments (retarget) occur every 2016 blocks (roughly 2 weeks, 1 block ~10 minutes). The blockchain uses a simple formula:
Target_new= target_old*T_act/T_exp, 4Texp
Target_new = new target (new difficulty) Target_old = old target T_act = actual time it took to mine the last 2016 blocks T_exp = expected time for 2016 blocks: 2016*600 seconds (10 min = 600 sec) 4T_exp= The change is limited: difficulty can’t shift more than 4× either way.
If, since the last difficulty retarget, the network’s total hash rate (the combined power of all miners) has increased over the past 2,016 blocks, then with near-certainty the average time to mine a block will decrease. That means the actual time to produce those 2,016 blocks T_act will be less than the expected time T_exp, so T_act/T_exp < 1. As a result, the new target Target_new will go down: and the lower the target, the higher the difficulty and the harder it is to mine.
But what to do if two different miners mine a block at the same time?
That happens,and there’s a safety mechanism for it.
In theory, they can make practically identical blocks if the same transactions in the same order fall into each block. But blocks still won’t be identical because the first transaction in every block is the coinbase (the miner reward), and it pays to the miner’s address — so two miners can’t have the exact same block because their addresses differ.
But it is possible that two miners almost simultaneously mine different blocks. If the delay between the creation of a block and its distribution among nodes is 2 seconds, then this means that after the creation of the first block, there is a two-second gap in which a second block can be created. The longer this time, the higher the probability, but with each year this time is reduced. The probability of creating three blocks is almost negligible, but the protection system is the same.
If two blocks are created, they are saved in nodes, and these two chains are passed further. Miners then choose which block to build on — usually the one they saw first. And when they find the next block for one of the chains, it is distributed further and the nodes agree with it, and the shorter version is forgotten. This is the rule of the longer chain. Even if 2, 3, or more blocks in a row are formed in two chains, sooner or later one branch outpaces the other.
Transactions have 3 probable paths:
1. Fall into the chain that wins, then they remain in the blockchain. 2. Fall into both chains, then only the version in the winning chain remains relevant. 3. Fall into the chain that loses, then they go again into the pools of unconfirmed transactions (more on this below).
A few numbers:
Approx. probability of a fork given ~1s delay: 0.17%
A second block on the same competing branch: 0.00028%
Third: 4.6*10^⁻⁹
Fourth: 7.7*10^⁻¹²
That’s why exchanges don’t credit your deposit after 1 confirmation. Typically they wait for 6 confirmations — ~1 hour on average (6 blocks × 10 minutes).
There is no limit to the length of the second/third chain because they disappear quickly. Not counting these two cases:
Reorganization through 53 blocks due to a bug in the software (source).
Another incident with reorganization through 24 blocks (source).
And there is also the possibility of an attack through a second chain, but about this at the very end.
From this follows the next question:
Since the miner receives a reward for mining a block, what happens when two blocks are mined?
Simple: a miner can spend the reward only after 100 blocks.
If you are a miner and mined block № 1000, you will be able to use the reward for this block only starting from block №1100. This looks like a time-lock transaction, but technically it is not one. I will write about the time-lock technology next time, this is already turning into too much text.
Miners add transactions to the blockchain, receiving a fee for this. And from this follow a few more questions:
Where and for how long are unconfirmed transactions stored, and can a transaction with a zero fee pass in theory?
The fee in Bitcoin depends not on the number of tokens sent in the transaction, but on the size of the transaction and the occupancy of the network at the given moment. After sending your transaction from a non-custodial wallet, it goes to the nearest node(s), these nodes decide based on several characteristics whether to accept your transaction or not:
1. Does it comply with the rules and did you not assign yourself non-existent tokens or something else? 2. Is the specified transaction fee sufficient?
If the answer to one of these questions is no, the node will not take the transaction and it will not fall into the blockchain, and your balance will not change. It turns out that a zero fee, in most cases, will not pass into the blockchain, although theoretically a miner can include such a transaction in a block, it is extremely unlikely.
How does a node assign a fee?
The node has a certain amount of memory where it stores such unconfirmed transactions after receiving them, but until the moment they are recorded in the blockchain.
By default, it is limited to 300 MiB of RAM memory and 336 hours of storage. However, if the blocksonly setting is enabled in Bitcoin-Core 25.0, the RAM memory will be reduced to 5 MiB; this is often done for validating the blockchain.
All these data can be changed when setting up the node, but this is often not done, as for most it would be a simple waste of extra resources.
And what will happen if you send a transaction with the minimum allowable fee?
If the node does not throw it out after adoption due to overflow, and if miners will not take this transaction due of small fee, it will be deleted after 336 hours = 2 weeks.
After the transaction is accepted, nodes distribute it to other nodes, and miners insert transactions with the highest fees into the block.
Considering the limits on transaction size of 400,000 weight units ≈ 100KB (but it could be more with SegWit, but those are already too small details). A maximum of 10 such large transactions can fit into 1 block, and ≈ 10,000 of the smallest. But on average it comes out to 2500 transactions per 1 block.
The fee itself is calculated by the formula: fee (sat) = vsize (vB) * feerate (sat/vB)
fee = commission.
vsize = transaction size.
sat = satoshi, in one Bitcoin there are 100,000,000 satoshis.
vB = Virtual Byte.
Your wallet can find out the minimum feerate from the nodes, but this is the lower boundary of whether the transaction will be distributed, not a guarantee of its confirmation. To estimate how much you need to pay now, wallets use mempool statistics and confirmation history.
An average transaction weighs 150vB; if at the given moment the average sat/vB = 2, then the transaction will cost 300 sat. And it will cost $0.27.
For example, for this transaction of 45,177 BTC (several billion $), the fee was less than $1.
The highest sat/vB was in April 2024 during the halving and was from 1795 to 2751 sat/vB (source). On that day, an average transaction would have already cost from $160 to $245, depending on how quickly it needed to be processed.
The busier the network, the higher sat/vB. If you want your transaction to get confirmed faster, you set sat/vB above the current average.
Nodes define the fee as: fee = sum(inputs) — sum(outputs), then they look at the transaction size to check if it fits their internal policies.
Don’t forget about UTXO: if over time you received 10 separate incoming transactions, and now you want to send the entire balance in one transaction, the blockchain sees that as 10 inputs — meaning the transaction is larger and therefore more expensive.
To save on fees in the future, it is useful to sometimes do “consolidation” — sending yourself all small remnants in one transaction when the network is calm and sat/vB is minimal.
Returning to the first topic and the block header, the following question may arise:
How does the blockchain know that ~10 minutes passed, and that miners aren’t lying?
The blockchain receives information about the time from miners and nodes (nodes that store information but do not mine) in UTC format.
Miners write the time in the block header. Nodes have their own clocks and verify the median time received from other nodes.
Bitcoin is a closed system, so the blockchain cannot connect to ntp.org to check if the miners are writing the truth in the block header and the nodes or not.
How can the blockchain check if the nodes and especially the miners aren’t lying?
For this, there is MTP — Median Time Past.
Median Time Past is easier to understand than Past Simple.
Not the average, but precisely the median.
It is calculated from the last 11 blocks arranged in order. For example:
18, 2, 12000 (liar), 14, 6, 20, 10, 4, 16, 12, 8
If we take the average value, then we need to sum all these numbers and divide by 11, we get 1100. Because of the liar who put 12000, everything has changed a lot.
But if we take the median, then first we arrange them in order:
2, 4, 6, 8, 10, 12, 14, 16, 18, 20, 12000 (liar)
And we take the value from the middle, that is, 12. This is how MTP is calculated.
The time of a new block is always greater than the MTP; otherwise, the block will not be accepted by other miners/nodes and will not be inserted into the blockchain.
But if someone wants to go to the future, at what time gap should blocks be rejected?
What will affect my future more, 10 push-ups or this article?
In the past Bitcoin used NAT — Network Adjusted Time (time adjusted by the network), which compared median time from peers. Later NAT was removed as a consensus component.
Now nodes use their own system UTC time to check how far “into the future” a new block is. If a block’s timestamp is more than 2 hours ahead of a node’s local time, that node rejects it.
If some node’s time differs significantly from other nodes, then NAT warns about it — that’s basically the only remaining use.
Miners and other nodes, how do they differ and why are they needed?
There are 3 main types of nodes in Bitcoin: a full node with two variations (archival and pruned), a light node, and a miner.
The other nodes are superstructures on top of these three pillars of the blockchain.
Full archival node: a server that has all the information about the blockchain for all time. Validates or rejects blocks in accordance with the rules of the blockchain.
Full pruned node: also checks blocks but does not store all data, only the UTXO and part of the last blocks.
Relay node: a superstructure on top of a full node, which is connected to other nodes with a large number of peers for fast distribution of information. Like torrent seeders.
Light node: stores only block headers to check their hashes. For transactions, it ask information from full node. Great for phone wallets or weak devices where storing dozens/hundreds of GB is inconvenient.
Miner: takes information from a full node or is one; based on this information, searches for a nonce to produce a valid block, then broadcasts it to the network.
If you need a non-custodial wallet on a PC, then perhaps a full pruned node for this would be the best option. You can choose the one you need here: bitcoin.org/en/choose-your-wallet?step=1
How to hack Bitcoin?
There are many possible attack vectors. If I described all of them, the article would be longer than it already is. But someday I will write. For now, let’s briefly look at two hack variants that are often talked about.
Quantum Computer VS Bitcoin
A quantum computer could derive a private key from a public key — but there’s already partial protection. If you’ve never spent from your address, your wallet is protected because outsiders see only the hash of your public key, not the public key itself.
Even with a quantum computer, it is practically impossible to brute-force the hash of a public key. But after the first outgoing transaction, the public key becomes visible to everyone. Therefore, to protect against quantum attacks, you should use addresses once.
However, there’s still a possible “interception” scenario: if a quantum computer could, after you broadcast a transaction but before it’s confirmed, derive your private key from your revealed public key — it would have very little time, but that’s the idea.
But there are wallets (outputs) of old formats, where the public key is visible immediately, and such wallets can be hacked even if there was not a single transaction from them.
And there are also many “lost” wallets; transactions were made from some, but that was many years ago. And with the help of quantum computers, coins from these wallets will probably fall back into circulation and possibly crash the Bitcoin price. But let’s leave these speculations to analysts who were perfectly described by one satirical channel:
”Last week’s target for Bitcoin at 34 thousand dollars has been revised and now stands at 240 thousand.”
So, a quantum computer will not destroy Bitcoin in this way.
But they are already thinking about creating a reusable quantum-protected wallet. This will require a soft-fork (change of rules), which has been done more than once.
If 1 person has more than 51% of the mining power, it will be easy for him to create a second chain of blocks as he wants. In this case, he will be able to cancel transactions and rewrite the history of his spending.
But even in this case, he will not be able in any way to steal someone else’s coins that were never on his wallet. The older the transactions that need to be rewritten, the longer and harder it will be, and there is no 100% guarantee that it will work and he will be able to make his chain longer and faster than the other 49%.
Such an attack is possible even with 30% and 40%, but the probability is much lower.
How much money will be needed for such an attack? If we attack from scratch, then we essentially have to have a power 0.5% more than the entire power of Bitcoin miners. The hashrate today is approximately 1 ZH/s = 1,000,000,000,000,000,000,000 SHA-256 hash findings per second.
Modern ASICs (mining devices) have a power of approximately 200 TH/s, meaning 5,000,000 of them will be needed. Their efficiency is ≈ 17–20 J/TH. Multiply by 10⁹ and you get 17–20 GW. A bit less than the power of the largest hydroelectric dam in the world.
To this, we add the prices for the ASICs themselves, which comes out to ≈ $7.5 billion. Not counting extra infrastructure which will also be very expensive.
Even all these costs will lead at most to double spending of own coins in the blockchain and censorship of transactions. And even then, it will be visible to everyone and the price will probably crash and the game will not be worth the candle.
Ethereum is more likely to revisit the $2,000 level than stage a decisive move back above $4,000, according to Bloomberg Intelligence Senior Commodity Strategist Mike McGlone.
Key Takeaways:
Ethereum faces higher downside risk toward $2,000 than a breakout above $4,000, according to Mike McGlone.
Long-term analysts argue ETH is in an accumulation phase despite weak price momentum.
Ethereum’s roadmap points to renewed focus on self-sovereignty and user experience beyond 2025.
In a recent post on X, McGlone pointed to persistent range-bound trading and rising macro risks weighing on the asset.
He said Ether has remained trapped in a $2,000–$4,000 range since 2023, but momentum appears to be shifting toward the lower end.
Rising Market Volatility Could Keep Ethereum Below $2,000
McGlone argued that the risks of Ethereum staying below $2,000 are greater than the chances of a sustained breakout above $4,000, especially if volatility in global equity markets rebounds.
His accompanying chart highlights repeated failures near the upper boundary of the range, alongside multiple tests of support closer to $2,000.
McGlone’s view contrasts with a more optimistic narrative circulating among crypto-focused analysts.
BullifyX, a widely followed market commentator, recently compared Ethereum’s long-term price structure to that of gold.
According to BullifyX, Ethereum is undergoing an extended accumulation phase characterized by gradual higher lows and compressed price action, a pattern that historically preceded strong rallies in traditional safe-haven assets.
Every time I look at the #Ethereum chart, it mirrors #GOLD a little too perfectly.
Long accumulation. Relentless structure. Explosive moves after patience is rewarded.
That’s not weakness that’s strength building quietly.
The analyst described Ethereum’s current behavior as a period of quiet positioning rather than fading demand, suggesting that prolonged consolidation could ultimately lay the groundwork for a sharp upside move once conditions shift.
In a recent post, he said the community is entering a phase focused on restoring personal autonomy and improving user experience, arguing that earlier compromises made in pursuit of adoption no longer need to define the network’s future.
“2026 is the year that we take back lost ground in terms of self-sovereignty and trustlessness,” Buterin said in an X post.
Together, record activity, falling fees, and rising participation suggest Ethereum is entering a new phase, one where scale no longer comes at the expense of accessibility.
Ethereum Foundation Makes Quantum-Resistant Security a Strategic Priority
As reported, the Ethereum Foundation has elevated post-quantum security to a core strategic focus, forming a dedicated Post Quantum team and committing $2 million to the effort.
Announced by Ethereum researcher Justin Drake, the initiative will be led by Thomas Coratger alongside Emile, a contributor to leanVM.
Drake said the foundation has been working on quantum-resilience research quietly for years, dating back to early discussions in 2019, before formally making it a top-level priority.
The foundation’s plan spans research, development, and ecosystem coordination.
This includes new developer calls focused on user-facing security, two $1 million cryptography prize programs, active multi-client post-quantum testing networks, and a series of global workshops aimed at accelerating collaboration and readiness across the Ethereum ecosystem.
Crypto traders often assume that meaningful gains need long timelines to take place, and they often give up during the wait and silence. However, crypto has a habit of shattering that belief without warning. History shows that when conditions line up, altcoins do not grind higher over years. They release and erase multiple years of drawdowns in a matter of weeks.
That memory was highlighted by a crypto commentator known as Waterman on the social media platform X, who noted a familiar seasonal window between February and late April to early May for an altcoin explosion.
Speed Matters More Than Time
The most notable example of an altcoin rally season was in 2021, when the entire altcoin market went on a rally to new all-time highs, many of which are still unbroken for some cryptocurrencies.
The 2021 cycle delivered some of the clearest reminders of just how fast capital can rotate once momentum takes hold. Solana moved from roughly $20 to $200 in about 50 days, a clean tenfold run. Although Solana has since broken above this peak to register a new all-time high of $293 in January 2025, this was still Solana’s most explosive rally to date.
Dogecoin followed an even sharper trajectory, climbing from $0.07 to a peak of $0.73 in under a month due to speculative interest that flowed into other memecoins like Shiba Inu. Unlike Solana, Dogecoin is yet to reclaim or surpass this peak price.
Avalanche went further, rallying from around $3 to $60 in less than 40 days, a twentyfold expansion that unfolded faster than most long-term projections ever anticipate. None of these moves required years of development or prolonged accumulation.
A Timeframe To Watch Closely
Notably, February through late April or early May has more often than not been the period where altcoin performance increases the most. If that pattern repeats, the coming weeks may matter far more than the years that came before them.
At the time of writing, the notion of an altcoin season is still impeded by strong Bitcoin dominance. Much of that comes down to how the entire crypto industry ecosystem has changed massively since 2021, especially after the launch of crypto-based ETFs. That steady demand has kept capital inflows concentrated around Bitcoin and slowed the usual rotation into altcoins.
At the same time, investors have become more selective, favoring cryptocurrencies tied to clearer utility. As a result, many crypto communities have been working to create utility for their meme coins.
Nonetheless, as noted by Waterman, you only need about four to six weeks for an altcoin to wipe out three to four years of suffering. You don’t need one to two years for altcoins to make massive gains.
Featured image from YouHodler, chart from TradingView
Technical analysis of XRP’s price action on the 3-week candlestick timeframe chart shows that the cryptocurrency is about to play out a road to the double-digit threshold based on its long-term structure.
The analysis, which was shared on the social media platform X alongside a multiyear chart, points to XRP trading in what is labeled Phase 4. At the center of this setup is a clear technical target of a break above the previous all-time high and a run to at least $21.5
XRP Price Action In Phases
Technical analysis of XRP price action shows that the cryptocurrency has been trading in a series of four phases for more than a decade. One full sequence of four phases unfolded between mid-2013 and mid-2017 as the foundation for XRP’s first rally to price peaks. Since then, a second set of four phases has been developing and following a similar pattern.
XRP transitioned into a new phase 1 and phase 2 sequence that led to a 2018 peak for phase 1 and then a pullback for phase 2 between 2018 and 2020. This was followed by an unusually long p3 that stretched from 2019 to mid-2024, visible on the chart as a broad, multi-year consolidation with converging trendlines of lower highs and higher lows. During this time, XRP’s price action was trapped inside the compression structure, just like the behavior seen during phase 3 of the first cycle.
According to the technical analysis, phase 4 began in 2025, when XRP finally broke above the compression range in mid-2024. This breakout was the same structural transition seen in mid-2017, when XRP exited consolidation and entered expansion.
Phase 4 has already been in progress for several months and includes the period when XRP rallied to new all-time highs in mid-2025, eventually topping out at $3.65 in July. Since that peak, however, XRP’s price action has been playing out a corrective downward trend and is down by roughly 48% at the time of writing.
Despite the ongoing correction, the projection is that XRP is still in phase 4 and is going to break into new all-time highs soon. This shows that phase 4 could unfold over an extended period and not with a single impulse move. The current all-time high of $3.65 is the first major technical hurdle, and a break above it will serve as confirmation that XRP is back into price discovery.
Based on this technical analysis, past expansion ratios from the previous cycle are applied and a 6.618 Fibonacci extension is measured from the phase 3 support low. This points to a projected price level near $21.5. At the time of writing, XRP is trading at $1.89, meaning a move to that level would represent an increase of roughly 1,040% from current prices.
Featured image from Pexels, chart from TradingView
A truly inclusive financial system does not reward people for navigating cross-chain friction; it removes friction, and that is the path to democratization.
XRP is trading near $1.89–$1.91 as January draws to a close, holding a well-defined triple-bottom support around $1.88 after slipping below the $2.00 mark earlier this week. The pullback has coincided with ETF outflows and a sharp drop in trading volume, but price action suggests stabilization rather than renewed selling pressure.
With volatility compressing and buyers repeatedly defending the same demand zone, XRP is approaching a technical decision point that could define its next directional move.
ETF Outflows Ease Short-Term Momentum Without Breaking the Thesis
Short-term pressure has been driven largely by institutional flows. According to data reported by CryptoQuant, U.S. spot XRP ETFs recorded their first weekly net outflows, totaling approximately $40.6 million toward the end of January. Trading volume has also declined sharply, with some estimates showing a 50%+ drop in 24-hour activity, signaling trader hesitation rather than aggressive selling.
That said, the flow data points to rotation and profit-taking, not abandonment. XRP remains one of the few large-cap tokens with clear regulatory positioning in the US, and earlier ETF inflows north of $1 billion underscore that institutional interest hasn’t disappeared. The current reset appears more about leverage clearing than confidence breaking.
Fundamentally, Ripple’s long-term thesis remains unchanged. XRP continues to underpin on-demand liquidity (ODL) across Ripple’s global payments network, offering faster and cheaper settlement compared to legacy systems.
More than 300 financial institutions remain connected to RippleNet, and ongoing regulatory clarity following 2025 rulings continues to distinguish XRP from many peers.
While no major partnership headlines have emerged this week, the absence of negative ecosystem news reinforces the view that the current weakness is market-driven, not fundamental.
XRP Price Prediction: Volatility Shrinks at $1.90 – Breakout or Breakdown Ahead?
From a technical perspective, XRP price prediction remains cautiously neutral near term. On the 2-hour chart, price is stabilizing inside a descending channel, capped by a falling trendline near $1.95. XRP is trading below the 50-EMA and 100-EMA, while the 200-EMA near $1.99 continues to act as firm resistance.
XRP Price Chart – Source: Tradingview
Support is clearly defined between $1.88 and $1.85, where repeated long lower wicks suggest responsive buying. RSI has recovered into the mid-40s after oversold readings, indicating easing downside pressure. Volatility has contracted, forming a descending wedge, a structure that often resolves higher if support holds.
A successful break above $1.95 would expose $2.03–$2.06, signaling structural repair. Conversely, a decisive loss of $1.85 would open downside toward $1.80 and $1.77.
Bitcoin Hyper: The Next Evolution of BTC on Solana?
Bitcoin Hyper ($HYPER) is bringing a new phase to the BTC ecosystem. While BTC remains the gold standard for security, Bitcoin Hyper adds what it always lacked: Solana-level speed. The result: lightning-fast, low-cost smart contracts, decentralized apps, and even meme coin creation, all secured by Bitcoin.
Audited by Consult, the project emphasizes trust and scalability as adoption builds. And momentum is already strong. The presale has surpassed $30.9 million, with tokens priced at just $0.013635 before the next increase.
As Bitcoin activity climbs and demand for efficient BTC-based apps rises, Bitcoin Hyper stands out as the bridge uniting two of crypto’s biggest ecosystems. If Bitcoin built the foundation, Bitcoin Hyper could make it fast, flexible, and fun again.
Ethereum is trading in the $2,930–$2,950 range as of January 25, 2026, consolidating after a broader pullback from January highs above $3,400. The move lower reflects near-term macro caution and heavy ETF-related selling rather than a breakdown in network fundamentals.
With Bitcoin hovering near $89,000 and risk sentiment mixed, ETH has shifted into a range-bound phase where price is lagging underlying activity.
ETF Pressure Weighs on Price, Not Structure
Short-term pressure has largely come from spot ETH ETF outflows, which exceeded $600 million between January 20–23, led in part by a single-day $250 million exit from BlackRock’s ETHA. This selling has cooled momentum and kept ETH capped below the $3,000 handle.
However, the flow data points more toward rotation and profit-taking than institutional abandonment. On-chain tracking shows whales accumulating roughly $1 billion worth of ETH during the recent correction, while funding rates and open interest have reset from crowded long conditions. That combination suggests leverage is being flushed, not confidence.
On-Chain Activity Tells a Different Story
Beneath the price, Ethereum’s network activity remains strong. Daily active addresses have climbed toward 1.3 million, while transaction counts are holding between 1.9 million and 2.2 million per day.
Validator behavior reinforces this trend: exit queues are near zero, entry queues are rebuilding, and staking participation continues to rise, tightening circulating supply.
Low fees and improved efficiency post-upgrades are also driving sustained DeFi and app usage, reinforcing a “price weak, fundamentals firm” dynamic that has historically preceded larger trend moves.
Ethereum Rises Despite U.S.-Iran Tensions
On the geopolitical front, the tensions are rising between the U.S. and Iran as Iran’s Revolutionary Guard warns it is “more ready than ever” amid U.S. warships moving toward the Middle East. The warning comes after Iran’s recent crackdown on protests, which left thousands dead, and Trump has set strict red lines for military action, including preventing mass executions and violence against civilians.
Despite these geopolitical tensions, Ethereum (ETH) continues to rise. This shows that investors remain confident in Ethereum’s growth, likely supported by strong developments like the Ethereum Foundation prioritizing post-quantum security.
Today marks an inflection in the Ethereum Foundation's long-term quantum strategy.
We've formed a new Post Quantum (PQ) team, led by the brilliant Thomas Coratger (@tcoratger). Joining him is Emile, one of the world-class talents behind leanVM. leanVM is the cryptographic…
Ethereum Price Prediction: Compression Builds Near $2,950 as ETH Eyes Its Next Leg
Technically, Ethereum price prediction is bearish as ETH is holding above $2,850–$2,900, a key support zone aligned with prior demand and Fibonacci confluence. RSI remains subdued near 35–40, signaling caution but not capitulation.
A reset toward support followed by a reclaim of $3,060 would reopen upside toward $3,190–$3,400, while a clean break below $2,800 would risk a deeper retracement toward $2,700.
Ethereum Price Chart – Source: Tradingview
Looking ahead, Ethereum’s 2026 roadmap adds weight to the longer-term case. The upcoming Glamsterdam upgrade and later Hegota phase focus on scalability, efficiency, and sustainability, building on blob infrastructure progress and accelerating Layer-2 adoption.
With over 8.7 million new contracts deployed entering the year, analysts increasingly view 2026 as a potential breakout period if macro conditions stabilize.
Bitcoin Hyper: The Next Evolution of BTC on Solana?
Bitcoin Hyper ($HYPER) is bringing a new phase to the BTC ecosystem. While BTC remains the gold standard for security, Bitcoin Hyper adds what it always lacked: Solana-level speed. The result: lightning-fast, low-cost smart contracts, decentralized apps, and even meme coin creation, all secured by Bitcoin.
Audited by Consult, the project emphasizes trust and scalability as adoption builds. And momentum is already strong. The presale has surpassed $30.9 million, with tokens priced at just $0.013635 before the next increase.
As Bitcoin activity climbs and demand for efficient BTC-based apps rises, Bitcoin Hyper stands out as the bridge uniting two of crypto’s biggest ecosystems. If Bitcoin built the foundation, Bitcoin Hyper could make it fast, flexible, and fun again.
Bitcoin is trading near $88,700 as markets weigh a pullback from $97K against rising regulatory clarity in the US, internal network debates, and shifting technical momentum. Senate crypto reforms, growing BIP-110 adoption, and rumors around GameStop’s BTC transfer have added noise, but price action suggests consolidation, not collapse. The $88K zone now stands as the key pivot for Bitcoin’s next directional move.
Bitcoin Governance Debate Resurfaces as BIP-110 Node Adoption Expands
Bitcoin’s long-running governance debate has resurfaced as adoption of Bitcoin Improvement Proposal 110 (BIP-110) edges higher. Roughly 2.38% of Bitcoin nodes are now running BIP-110, a temporary soft fork designed to limit non-monetary data, or “spam,” embedded in transactions.
The proposal restores restrictions on OP_RETURN data and output sizes that were loosened in recent Bitcoin Core updates.
Facilitating Spam is incompatible with Bitcoin’s sound money mission via decentralization.
Facilitating Spam makes it more expensive/cumbersome to use Bitcoin in a self sovereign manner than it otherwise would without Spam.
The issue has divided the community. Critics argue that allowing excessive arbitrary data risks turning Bitcoin into a data-storage network, raising node costs and pushing out smaller, home-run operators, which could increase centralization. Supporters counter that usage should not be artificially limited and that existing spam filters are ineffective.
While the debate may create short-term noise, it has little direct price impact. Over time, efforts like BIP-110 reinforce Bitcoin’s decentralization, strengthening its credibility as resilient, trust-minimized money.
GameStop Moves 4,700 BTC to Coinbase Prime, Raising Sale Speculation
GameStop has moved its entire Bitcoin holding, roughly 4,710 BTC worth over $420 million, to Coinbase Prime, sparking speculation that a sale may be imminent. According to CryptoQuant, the company acquired its Bitcoin at an average price near $107,900, meaning a full exit at current levels around $90,800 would imply an unrealized loss of roughly $76 million.
GameStop throws in the towel?
Their on-chain wallets just moved all BTC holdings to Coinbase Prime, likely to sell.
Between May 14–23, 2025, they bought 4,710 BTC at an avg. price of $107.9K, investing ~$504M.
Large transfers to institutional trading platforms often precede selling, but the move alone does not confirm liquidation. GameStop has not issued any public statement, leaving markets to interpret the intent.
The broader impact on Bitcoin appears limited. More than 190 publicly listed companies now hold Bitcoin on their balance sheets, underscoring continued institutional participation.
Even if GameStop were to exit, it would represent an isolated corporate decision rather than a shift in overall institutional confidence. Short-term volatility is possible, but longer-term demand remains intact.
Bitcoin Price Prediction: BTC Tests $88K Support as Breakout Pressure Builds
Bitcoin price prediction remains bearish as BTC is trading near $88,600, entering a corrective phase after failing to hold the $97,300 swing high earlier this month. On the 4-hour chart, price has slipped back into a rising channel that guided the move from the $83,800 low.
The rejection at channel resistance marked a momentum shift, reinforced by long upper wicks and a bearish engulfing candle that broke short-term support.
BTC is now testing a key confluence zone between $88,000 and $87,300, which aligns with prior demand and the lower boundary of the ascending channel. Recent candles show smaller bodies with lower wicks, suggesting selling pressure is easing rather than accelerating. However, price remains below the 50-EMA and 100-EMA, while the 200-EMA near $91,200 continues to cap rebounds, keeping near-term bias cautious.
RSI has rebounded from oversold levels near 30 and is stabilizing around 40–42, signaling balance but not strength. The structure resembles a descending flag within a broader uptrend. If $87,300 holds, a reclaim of $90,000 could open $92,400–$94,500. A clean break below risks $85,600.
Bitcoin Hyper: The Next Evolution of BTC on Solana?
Bitcoin Hyper ($HYPER) is bringing a new phase to the BTC ecosystem. While BTC remains the gold standard for security, Bitcoin Hyper adds what it always lacked: Solana-level speed. The result: lightning-fast, low-cost smart contracts, decentralized apps, and even meme coin creation, all secured by Bitcoin.
Audited by Consult, the project emphasizes trust and scalability as adoption builds. And momentum is already strong. The presale has surpassed $30.9 million, with tokens priced at just $0.013635 before the next increase.
As Bitcoin activity climbs and demand for efficient BTC-based apps rises, Bitcoin Hyper stands out as the bridge uniting two of crypto’s biggest ecosystems. If Bitcoin built the foundation, Bitcoin Hyper could make it fast, flexible, and fun again.
A growing number of analysts believe Ethereum’s current price action is being misunderstood. Although frustration is growing due to Ethereum’s inability to hold above $3,000, some technical analysts are quick to point out that the structure forming beneath the surface tells a very different story. According to one analyst, the real risk right now is not being bullish on Ethereum and trying to short in anticipation of a downside breakout.
Higher Lows And A Structure That Keeps Tightening
The analyst’s technical view on Ethereum is focused less on short-term momentum and more on the structure developing on the chart, which he argues is even clearer than what is currently visible on Bitcoin’s chart.
Notably, Ethereum’s price action is carving out a series of higher lows on the daily candlestick timeframe chart to form a tightening triangular pattern since December 2025. This kind of behavior shows that each pullback is being absorbed at progressively higher levels, which is how strong trends reset before continuation.
Ethereum needs to avoid a breakdown below key support zones in order for this trend continuation setup to still be valid. According to the analyst, a dip under $2,860 would begin to weaken the pattern, while a close below $2,780 would invalidate the higher-low structure.
At the time of writing, Ethereum is trading around $2,950, which is dangerously close to the lower boundary of this setup. Therefore, some traders will be tempted to short Ethereum at this level, but the analyst called it the dumbest thing to do here.
As long as those levels ($2,860 and $2,780) hold, the analyst sees no technical justification for betting against ETH, especially near the lower boundary of the channel where buyers have repeatedly stepped in.
If support holds, the next move would be a gradual return to the upper trendline of the channel, which is just below $3,340. A move into that region would bring price back into direct contact with overhead resistance and set the stage for a breakout if buying pressure continues to increase.
Ethereum is entering 2026 without clear bullish momentum, a reality that has dampened sentiment across the spot and derivatives markets. Spot ETF inflows into Ethereum and Bitcoin have slowed down, and issuers have been highlighted with consistent days of outflows.
Speaking of staking, BitMine Technologies recently amped up its ETH staking to over $5.71 billion worth of Ethereum. On-chain data from Arkham Intelligence shows that the firm has staked an additional 171,264, worth $503.2 million, pushing its total stake to over 1.94 million ETH.
Featured image from Unsplash, chart from TradingView
XRP has spent most of the past few months trading with lower highs since July 2025, frustrating traders and compressing price action into an increasingly tight range.
However, a technical breakdown shared by crypto analyst ChartNerd argued that what looks like stagnation may actually be the final preparation phase before a historic move. The price structure suggests something far bigger that sends XRP on its most aggressive rally in eight years, but the implications only become clear when the full setup is examined.
A 400-Day Rectangular Reaccumulation Still Holding Structure
According to technical analysis done by ChartNerd, XRP’s price action has been locked inside a rectangular reaccumulation zone for about 400 days, and this has led to the formation of what looks like a rectangular bull flag on a macro timeframe. The technical chart shows a strong impulsive move from July 2024 to December 2024 acting as the flagpole, right when XRP peaked at the $3.4 price zone back then.
This impulsive flagpole has been followed by a long period of sideways trading where XRP’s price has repeatedly respected a clearly defined support around $1.8 and resistance boundaries around $3.6. This type of structure is associated with reaccumulation within the support and resistance zones, especially when it is playing out after a sharp expansion move and holding for this length of time.
Each dip into reaccumulation support has been absorbed, preventing any sustained breakdown and keeping the broader pattern intact. ChartNerd noted that the rectangular flag will be valid as long as this support level is defended, and this will activate the expansion journey.
Macro Breakout Projection Puts XRP Price Target At $23
According to ChartNerd, bearish participants are increasingly pressured by the fact that this fractal is still holding despite repeated attempts to invalidate it. The longer XRP’s price action is trapped inside the rectangle without breaking down, the more likely it becomes that the eventual resolution favors the dominant trend that preceded the consolidation. In this case, that trend was bullish, which strengthens the case for an upside breakout once resistance is cleared.
If the rectangular bull flag resolves to the upside as projected, the chart outlines a breakout trajectory that would carry XRP into double-digit territory, with a long-term target region near $23. This price target projection is derived from the height of the flagpole extended from the top of the reaccumulation range.
ChartNerd labelled this possible move as one of the most aggressive rallies XRP could see in seven to eight years. At the time of writing, XRP is trading around $1.92, meaning a move toward the $23 region would represent a gain of over 1,000% from current levels, which is a type of percentage expansion XRP has played out well in the past.
Featured image from Unsplash, chart from TradingView
Solana is trading near $126, slipping modestly over the past 24 hours but holding a price zone that traders are watching closely. While short-term price action reflects broader market caution, Solana’s underlying activity tells a very different story. Network usage, institutional interest, and upcoming protocol upgrades are all accelerating, creating a widening gap between price and fundamentals as the market heads deeper into 2026.
This divergence is shaping Solana’s near-term outlook and its longer-term investment narrative.
Solana Finds Balance Near $126 After January Pullback
Solana ended the session near $126.72, with daily trading volume around $2.74 bn and a market capitalization just under $72 bn, ranking the token #7 globally. The recent pullback follows a rejection near $147.50, with price now consolidating inside a defined support band between $124 and $127.
On the technical side, SOL remains below its 50-EMA near $134 and 200-EMA around $136, confirming that short-term momentum has cooled. However, candlestick behavior has shifted.
Recent sessions show smaller bodies and reduced downside follow-through, suggesting selling pressure is fading rather than accelerating. As long as $125 holds, the move looks corrective, not structural.
While price has softened, Solana’s network activity continues to expand at record speed.
Key on-chain metrics stand out:
DEX volume reached $107 bn, surpassing Ethereum, Base, and BSC combined in recent periods
Stablecoin transfer volume climbed to $312 bn, highlighting real payment and settlement use
Active addresses surged to 27.1 million, up more than 50% week over week
Staking participation hit all-time highs, signaling long-term confidence rather than speculative churn
These figures point to real demand rather than short-term trading flows, reinforcing Solana’s role as a high-throughput settlement layer.
Real-World Asset Tokenization Gains Momentum on Solana
Institutional adoption is quietly reshaping Solana’s positioning. Enterprise blockchain firm R3 is building Solana-native infrastructure focused on private credit and trade finance, while Coinbase completed full Solana chain integration, expanding liquidity access across major regions.
At the same time, Solana has crossed $1 bn in tokenized real-world assets, supported by flows tied to BlackRock’s BUIDL initiative and rising USDC velocity. This shift is reframing Solana from a speculative trading chain into an institutional-grade platform for tokenized finance.
Solana (SOL/USD) Technical Outlook: $125 Support Tested as $136 Comes Into Focus
From a price perspective, Solana price prediction seems bearish as SOL is testing a rising trendline that originates from December lows. RSI remains subdued near 38–40, reflecting caution but not exhaustion. A clean break below $124 would expose $120.90, while a reclaim above $131.50 would signal renewed upside toward $136 and $141.60.
Looking further ahead, the upcoming Alpenglow upgrade, targeting faster finality and expanded block capacity, reinforces Solana’s long-term thesis. If fundamentals continue to outpace price, the current range may prove to be a positioning phase rather than a peak.
Bitcoin Hyper: The Next Evolution of BTC on Solana?
Bitcoin Hyper ($HYPER) is bringing a new phase to the BTC ecosystem. While BTC remains the gold standard for security, Bitcoin Hyper adds what it always lacked: Solana-level speed. The result: lightning-fast, low-cost smart contracts, decentralized apps, and even meme coin creation, all secured by Bitcoin.
Audited by Consult, the project emphasizes trust and scalability as adoption builds. And momentum is already strong. The presale has surpassed $30.9 million, with tokens priced at just $0.013625 before the next increase.
As Bitcoin activity climbs and demand for efficient BTC-based apps rises, Bitcoin Hyper stands out as the bridge uniting two of crypto’s biggest ecosystems. If Bitcoin built the foundation, Bitcoin Hyper could make it fast, flexible, and fun again.
Bitcoin (BTC) is mirroring the same setup from its 2022 bull cycle, which led to a massive price crash to $20,000. According to market expert Crypto Bullet, this recurring structure could signal another major correction for BTC ahead. However, this time the leading cryptocurrency could give up almost a quarter of its current value.
2022 Bitcoin Chart Pattern Signals Over 20% Crash
In his technical analysis released on X, Crypto Bullet revealed that Bitcoin is currently repeating a 2022 structure that could lead to a more than 20% decline in its value. To support his bearish outlook, the analyst presented a parallel chart comparing Bitcoin’s price action from 2023-2022 and 2025-2026, highlighting similar technical patterns, price behavior, and Moving Averages (MA).
During the 2022 cycle, Bitcoin experienced a similar pattern, beginning with a test of the 100-day Moving Average (MA100), highlighted as the blue trendline on the chart. After facing rejection at that level, the price pulled back to a nearby support zone inside a rising channel. From there, BTC staged a sharp rally, surging to fresh highs around $48,500, where it aligned with the 200-day Moving Average (MA200), marked in orange.
However, the recovery proved short-lived. Bitcoin soon reversed course and failed to reclaim the MA200 as support. Once the cryptocurrency’s price structure was lost, downside momentum accelerated, pushing the price into a much deeper correction toward the $20,000 level.
According to Crypto Bullet, Bitcoin is repeating this exact pattern in 2026. It has already retested the MA100, gotten rejected, and moved lower into a support zone within a similar ascending channel. The chart also showed that in both cycles, BTC reached a “market cycle top,” first around December 2023 and then again in November 2025, before breaking down and entering a consolidation phase.
Given how closely Bitcoin is mirroring its 2022 setup, Crypto Bullet has forecast another dramatic price crash, predicting a more than 23.5% drop from its current price near $89,500 to $68,450. Before this decline happens, the analyst expects BTC to experience a short-term recovery, potentially climbing back above the $100,000 psychological level to reach $102,000.
Bitcoin Could Still Rally To $92,000
Crypto analyst Tyrex has stated that Bitcoin has been consolidating for the past 48 hours, with price holding above $89,000 for most of that period. Despite the muted price action, he believes that BTC could soon rally to $92,000. The analyst also noted that the broader market is in a state of fear, with many traders anticipating further declines in Bitcoin.
However, the analyst cautions that this expected drop may be a trap. He points out that an ascending channel is forming on Bitcoin’s chart, prompting him to adopt a more bullish outlook despite the prevailing bearish sentiment and sideways price movement.
Featured image from Unsplash, chart from TradingView
XRP is trading near $1.92, with 24-hour volume around $1.92 bn and a market cap of $116.6 bn, keeping it ranked #5 among cryptocurrencies. After January’s pullback, price has stabilized, pointing to a shift from active selling toward positioning. Recent sessions show XRP consolidating in a tight range, with buyers consistently stepping in around $1.88–$1.90.
That support has limited further downside while volatility narrows, putting focus on whether this consolidation resolves higher or gives way to renewed pressure.
RLUSD Gains Traction on Binance as XRP Liquidity and Institutional Use Expand
Ripple’s USD-backed stablecoin RLUSD is quickly emerging as a key catalyst. On January 22, 2026, Binance listed RLUSD for spot trading, including an XRP/RLUSD pair, alongside a temporary zero-fee promotion. Initially launched on Ethereum, RLUSD’s upcoming integration with the XRP Ledger is expected to enhance settlement efficiency and on-chain activity.
The stablecoin’s regulatory positioning stands out:
Approved by NYDFS and cleared by the OCC
Designed for institutional and compliance-first use
Positioned as a bridge between traditional finance and crypto rails
Analysts see this as a structural positive for XRP, as increased RLUSD usage ties liquidity flows more closely to the XRP ecosystem.
Leadership and Institutional Momentum: Why XRP’s Long-Term Case Is Strengthening
Ripple CEO Brad Garlinghouse remains optimistic about 2026, pointing to regulatory progress and institutional demand as drivers for the next growth phase. He has highlighted momentum around US crypto legislation and framed regulatory clarity as a long-term unlock for enterprise adoption.
Spirited dialogue during today’s WEF session (to say the least), but one important point of agreement across the panelists was that innovation and regulation aren’t on opposite sides.
I firmly believe this is THE moment to use crypto and blockchain technology to enable economic… https://t.co/4d3jNeNC4h
Beyond stablecoins, Ripple continues expanding its banking footprint. Recent partnerships, including DXC Technology’s integration with Ripple infrastructure, aim to support custody, payments, and tokenization for institutions managing trillions in assets. These developments reinforce XRP’s role beyond speculation, anchoring it in real financial use cases.
XRP Technical Outlook: $1.90 Support Tested as XRP Nears a Breakout Decision
Technically, XRP price prediction is neutral as XRP is compressing inside a symmetrical triangle, formed by lower highs from $2.40 and higher lows near $1.87. The 50-EMA around $1.97 caps short-term rallies, while the 200-EMA near $2.02 reinforces resistance. RSI near 48–50 signals balance rather than exhaustion.
XRP Price Chart – Source: Tradingview
A confirmed break above $1.96 could open a move toward $2.05–$2.15, while a loss of $1.88 would expose $1.83. Until then, XRP remains in decision mode.
XRP Trade setup: Buy on a confirmed break above $1.96, target $2.10–$2.15, stop below $1.88.
Bitcoin Hyper: The Next Evolution of BTC on Solana?
Bitcoin Hyper ($HYPER) is bringing a new phase to the BTC ecosystem. While BTC remains the gold standard for security, Bitcoin Hyper adds what it always lacked: Solana-level speed. The result: lightning-fast, low-cost smart contracts, decentralized apps, and even meme coin creation, all secured by Bitcoin.
Audited by Consult, the project emphasizes trust and scalability as adoption builds. And momentum is already strong. The presale has surpassed $30.9 million, with tokens priced at just $0.013625 before the next increase.
As Bitcoin activity climbs and demand for efficient BTC-based apps rises, Bitcoin Hyper stands out as the bridge uniting two of crypto’s biggest ecosystems. If Bitcoin built the foundation, Bitcoin Hyper could make it fast, flexible, and fun again.
Hiring the right minds and skill sets in marketing in today’s age is vital to laying the right foundations for any company, let alone a crypto company.
Bitcoin is trading near $89,500, locked in a tight range that reflects consolidation rather than weakness. While price action remains compressed, a series of institutional and regulatory developments this week is reshaping how the market views Bitcoin’s longer-term role.
South Korea’s $48M Bitcoin Custody Breach Raises Alarms
South Korean authorities are investigating the disappearance of roughly 70 bn won ($48 mn) worth of seized Bitcoin from official custody. The issue surfaced during a routine audit by the Gwangju District Prosecutors’ Office, according to local reports.
Preliminary findings suggest the loss resulted from a phishing attack, after a staff member reportedly accessed a fake website, leading to leaked credentials. While details remain limited due to the ongoing investigation, the case has reignited debate around how governments store and protect confiscated digital assets.
South Korean prosecutors investigate disappearance of seized Bitcoin following phishing attack
Multiple Bitcoins went missing in mid-2025 after private key credentials were exposed in a phishing attack, resulting in irreversible transfers
Importantly, the incident does not reflect a failure of the Bitcoin network itself. Instead, it underscores weaknesses in human processes and custody frameworks. Long term, this type of breach may push governments toward stricter crypto custody standards, ironically strengthening institutional confidence rather than weakening it.
You can't make this up.
"an agency worker accessed a scam website"
Nearly $50M in seized Bitcoin was stolen in a phishing attack.
What could have gone to a national strategic bitcoin reserve has now fallen into the hands of bad actors.
In a separate but related signal, UBS is reportedly evaluating plans to offer cryptocurrency investing to select private banking clients, beginning with Bitcoin and Ether for wealthy Swiss customers. According to Bloomberg, the bank is assessing third-party partners to support the rollout.
UBS plans to make cryptocurrency investing available for some private banking clients in what could become a significant move into digital assets for the wealth manager https://t.co/pWi6Inm9AP
If successful, UBS could later expand the service into the US and Asia-Pacific, aligning with similar initiatives from Morgan Stanley and JPMorgan. The move reflects growing demand among high-net-worth investors for crypto exposure through trusted, regulated institutions, rather than exchanges alone.
Bitwise’s Bitcoin-Gold ETF Signals Macro Thinking
Adding to the institutional theme, Bitwise Asset Management has launched the Bitwise Proficio Currency Debasement ETF (BPRO) on the NYSE. Unlike spot Bitcoin ETFs, BPRO is actively managed and blends Bitcoin, gold, precious metals, and mining equities, with at least 25% allocated to gold at all times.
The fund carries a 0.96% expense ratio and targets long-term investors focused on capital preservation. By pairing Bitcoin with gold, Bitwise frames BTC as a macro hedge against currency debasement, not a speculative trade.
Bitcoin Price Forecast: $89,500 Range Tightens as Breakout Pressure Builds
Bitcoin is trading near $89,500, holding inside a narrowing range after a sharp rejection from the $97,000 peak earlier this month. On the 2-hour chart, price action points to compression rather than breakdown. BTC continues to defend the $87,300–$88,000 support band, an area repeatedly tested and protected by buyers.
Long lower candlestick wicks around this zone suggest sellers are struggling to gain follow-through, signaling thinning supply at lower levels.
From a structural view, Bitcoin remains anchored to a rising trendline that has guided price higher since the $83,800 low. While price briefly slipped below the 50-EMA and 100-EMA, it has stabilized near the 200-EMA, which is flattening instead of rolling over.
This behavior typically reflects a transition phase, not a confirmed trend reversal. The broader setup resembles a descending flag within an ascending channel, a formation that often resolves in the direction of the prevailing trend.
Momentum supports this outlook. RSI has rebounded from oversold levels near 30 and is now hovering around 48–50, signaling balance rather than renewed selling pressure. Recent candles show smaller bodies and reduced volatility, often seen before range expansion. If BTC dips, $87,400 remains key support. A push above $90,980 would open the path toward $92,400 and $94,250.
Trade setup: Buy near $88,000–$87,500, target $94,000, stop below $85,500.
Bitcoin Hyper: The Next Evolution of BTC on Solana?
Bitcoin Hyper ($HYPER) is bringing a new phase to the BTC ecosystem. While BTC remains the gold standard for security, Bitcoin Hyper adds what it always lacked: Solana-level speed. The result: lightning-fast, low-cost smart contracts, decentralized apps, and even meme coin creation, all secured by Bitcoin.
Audited by Consult, the project emphasizes trust and scalability as adoption builds. And momentum is already strong. The presale has surpassed $30.9 million, with tokens priced at just $0.013625 before the next increase.
As Bitcoin activity climbs and demand for efficient BTC-based apps rises, Bitcoin Hyper stands out as the bridge uniting two of crypto’s biggest ecosystems. If Bitcoin built the foundation, Bitcoin Hyper could make it fast, flexible, and fun again.