The US crypto market has welcomed a new entrant as 21Shares rolls out its Spot Dogecoin ETF, giving investors another avenue to engage with the infamous dog-themed meme coin. Trading kicked off amid a mix of curiosity and caution, with on-chain data already showing how much the DOGE ETF has performed so far.
21Shares Launches Dogecoin ETF
In a press release on Thursday, January 22, 21Shares announced the official launch of its Spot Dogecoin ETF, TDOG, which began trading on NASDAQ the same day. The new ETF provides investors with direct exposure to Dogecoin through a fully backed, regulated, and transparent vehicle. Each ETF share is also backed 1:1 by DOGE held in institutional-grade custody.
Notably, the launch of the new TDOG ETF brings the total number of US Dogecoin ETFs to three, joining Grayscale’s GDOG and Bitwise’s BWOW. 21Shares is also the only ETF provider endorsed by House of Doge, the official corporate arm of the Dogecoin foundation, highlighting the global asset manager’s close ties to the meme coin.
As one of the largest crypto ETF issuers, 21Shares continues to expand its crypto product lineup with the introduction of TDOG. This follows the investment company’s previous ETF offerings, including TSOL, a Solana ETF released in November 2025; ARKB, a Spot Bitcoin ETF launched in January 2024; and TETH, an Ethereum ETF introduced in July of the same year. Together, these products demonstrate 21Shares’ commitment to providing institutional-grade access to high-demand digital assets.
Federick Brokate, Global Head of Business Development at 21Shares, highlighted DOGE’s large and active global community, calling it a unique digital asset with constantly growing use cases. He added that the new TDOG ETF will give investors regulated, physically backed exposure through a familiar ETF structure they know and trust.
Marco Margiotta, the CEO of House of Doge, also shared comments on the recently launched 21Shares ETF. He said that TDOG is a step toward making Dogecoin easier to access through traditional financial systems. He also disclosed that House of Doge’s partnership with 21Shares will help more people get involved as the Dogecoin ecosystem grows.
How 21Shares Dogecoin ETF Has Performed So Far
Contrary to expectations, 21Shares’ recently launched Dogecoin ETF saw weak performance on the first day of trading, signaling investors’ lack of interest in the investment product. Data from SoSoValue shows that TDOG experienced no inflows on January 22 and instead declined by about 0.07%. Despite it being the second day of trading, the DOGE ETF has still not registered any flows.
This lackluster performance has been observed across all Dogecoin ETFs this week. Grayscales’ GDOG and Bitwise BWOW have reported zero inflows over the last week. The last time GDOG saw positive activity was on January 8, when it received around $333,083 in investments. Before that, the ETF recorded its highest inflows on January 2, totaling roughly $2.3 million. Since its launch in November 2025, GDOG ETF inflows have been unstable, with more days of inactivity than significant investment.
Over 200 tokenized U.S. stocks and ETFs just landed on Solana, boosting bullish Solana price predictions as its ecosystem evolves into the go-to platform for on-chain capital markets.
The altcoin is earning its keep as Wall Street’s blockchain of choice, now offering near-complete TradFi portfolio access through its partnership with Ondo Global Markets.
Today, Solana goes TradFi.
Hundreds of tokenized stocks & ETFs are now live on @solana, bringing the full TradFi portfolio to crypto’s largest trading ecosystem.
Millions of Solana users can now access Wall Street-grade liquidity across 200+ assets, including tokens tracking:… pic.twitter.com/JRZxcScOXj
While Ondo featured on Ethereum and BNB first, Solana’s throughput makes it a closer match for the demands of traditional capital markets. It is uniquely positioned as the infrastructure layer to bridge TradFi and DeFi.
Solana has already proven itself in tokenized equities, accounting for a dominant 46% share of the $1 billion tokenized stock market through platforms like xStocks.
Tokenised Stock assets under managment (AUM) by platform ($). Source: Dune Analytics.
Until now, however, growth has been constrained by limited liquidity depth and asset selection.
That ceiling may be lifting. With regulation pushing tokenization deeper into the mainstream, even a small fraction of the U.S. stock market’s massive trading volume could send SOL significantly higher.
Solana Price Prediction: Could Ondo Help Fuel a SOL Surge?
As the bull market matures, sticky adoption of RWAs could bring the demand Solana needs to finally realise a year-long descending channel.
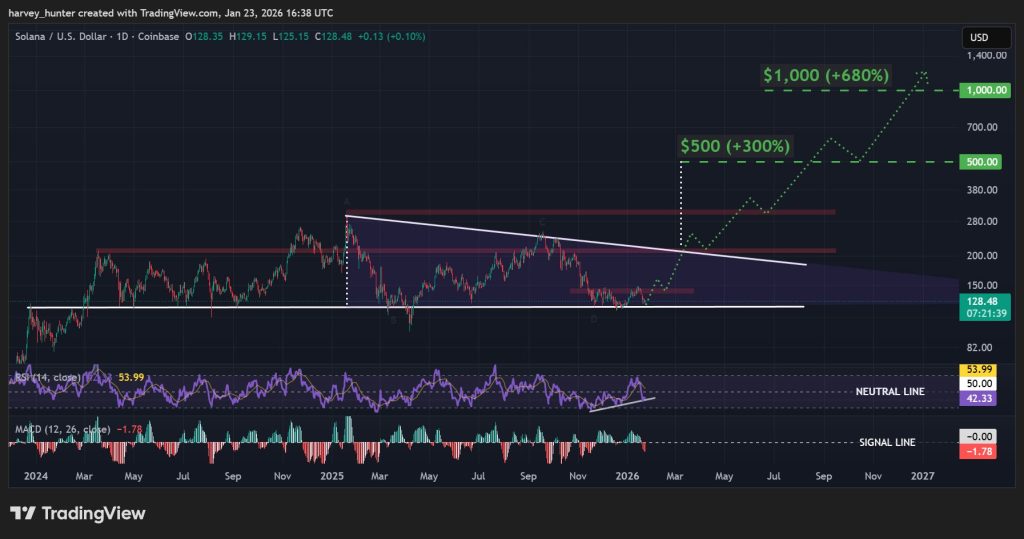
Momentum indicators suggest the shift may already be underway, with a potential higher low setting focus on a breakout attempt.
The RSI has once again affirmed its uptrend with another higher low after falling below the 50 neutral line, a sign of strength beneath the surface.
The MACD shows a potential trend shift, levelling off below the signal line around bottoms that previously marked the end of consolidation within the structure.
The recent bounce from the patterns $120 support could be the last, but the resistance that has capped upside since September at $145 will be the key proving grounds.
From there, the key breakout threshold sits at $210.
And with that level confirmed as support, a breakout push eyes past all-time highs at $300 for a 300% push into new price discovery targeting $500.
However, as Solana permeates deeper into the mainstream TradFi markets and infrastructure, fresh liquidity and use cases could send the altcoin much higher, eying a 680% move to $1,000.
Bitcoin Hyper: Don’t Back Solana Until You’ve Seen This
Those who chose Solana over the leading cryptocurrency may soon need to reconsider, as the Bitcoin ecosystem finally tackles its biggest limitation: scalability.
Bitcoin Hyper ($HYPER) is bridging Bitcoin’s security with Solana tech, creating a new Layer-2 network that unlocks scalable, efficient use cases Bitcoin couldn’t support on its own.
Whatever Solana can do, Bitcoin can now do – top-performing narratives like DeFi and real-world assets could be Bitcoin’s for the taking.
The project has already raised almost $31 million in presale, and post-launch, even a small fraction of Bitcoin’s massive trading volume could send its valuation significantly higher.
Bitcoin Hyper is fixing the slow transactions, high fees, and limited programmability that have long capped Bitcoin’s potential – just as the market turns bullish.
Crypto researcher Axel has provided insights into why the Bitcoin, Ethereum, and Solana prices are still crashing. This comes as BTC continues to see a supply overhang, which threatens to put more downward pressure on crypto prices.
Why The Bitcoin, Ethereum, and Solana Prices Are Still Crashing
In a research report, Axel noted that anomalous exchange inflows accompanied the BTC breakdown below the $90,000 zone as sellers prepared in advance. The market is also still at risk of further selling pressure as the 1.0 level of the short-term holders’ SOPR is now acting as a resistance rather than support. As such, there is a possibility that Bitcoin, Ethereum, and Solana prices will decline further.
Further commenting on Bitcoin netflows into exchanges, Axel noted that between January 20 and 21, almost 17,000 BTC flowed into exchanges, coinciding with BTC dropping to as low as $87,000, while Ethereum and Solana prices also dropped. The crypto researcher explained that these anomalously high values followed a period of predominantly negative netflow in the first half of this month.
In the context of the falling Bitcoin price, Axel stated that such a spike is more likely to reflect supply preparation than neutral transfers. In other words, the breakdown below $90,000 appears to be structural rather than emotional. Meanwhile, Bitcoin netflow returned to neutral levels yesterday, but the accumulated inflow still creates a supply overhang, which could lead to further declines in the prices of Bitcoin, Ethereum, and Solana.
Axel noted that a signal of improvement would be if netflow turns negative again amid rising prices, which could indicate that the overhang has cleared. However, with the short-term holders’ 7-day SMA SOPR below 0.996, the crypto researcher suggested that BTC faces increased selling pressure on every recovery as these holders look to sell at breakeven. He added that a reversal trigger could be confirmed if the SOPR breaks above 1.0 from below, with the 7-day SMA holding unity for three to five days to filter out false spikes after the selloff.
Why A Break Above $100,000 Looks Unlikely For Now
In its latest research report, on-chain analytics platform Glassnode explained that a Bitcoin rally above $100,000 looks unlikely for now as the supply overhang persists. They noted how this overhang supply above $98,000 remains the dominant sell-side force capping short to mid-term rebounds.
Alluding to the Unspent Realized Price Distribution metric, Glassnode noted that the recent BTC rally has partially filled the prior air gap between $93,000 and $98,000, driven by redistribution from top buyers into newer market participants.
However, the unresolved supply overhang is expected to likely cap attempts above the $98,400 short-term holders’ cost basis and the $100,000 level. A meaningful and sustained acceleration in demand momentum is said to be required for a clean breakout above $100,000 to occur.
As the crypto market faces uncertainty and continues in a consolidation phase, market expert Sam Daodu has issued a report examining the potential for XRP, Ethereum (ETH), and Solana (SOL) to emerge as frontrunners if a new altcoin season arises in 2026.
XRP, ETH, And SOL Price Forecasts
Daodu began his analysis by pointing out that Bitcoin’s (BTC) dominance is currently hovering around 59%, alongside an Altcoin Season Index reading of 55. These indicators suggest that 2026 could herald a substantial rotation towards altcoins, mirroring significant shifts experienced during cycles in 2016-2017 and 2020-2021.
The expert outlines several bullish scenarios for each. For XRP, he envisions a potential surge past the $6-$8 range if exchange-traded fund (ETF) inflows maintain a monthly average exceeding $400 million and RippleNet continues to expand its influence in global banking.
ETH, on the other hand, could see itself climbing toward $12,000-$18,000 if Layer 2 (L2) adoption unlocks broader usage and ETF inflows rebound.
Daodu highlights that active addresses are at cycle highs, indicating organic demand that may translate to higher prices once institutional sentiment shifts positively.
For SOL, the outlook is similarly optimistic. Solana might rocket to the range of $500-$800 if its transaction finality of 150 milliseconds and low fees attract a new wave of applications. Additionally, the rise in ETF filings could lead to significant capital inflows.
Potential Risks Ahead
In more stable scenarios, Daodu suggests that XRP might consolidate between $2.50-$3.50 if institutional adoption progresses steadily without dramatic catalysts.
He also speculates that Ethereum could trade within the range of $5,000-$9,000, benefiting from consistent demand driven by staking yields and decentralized finance (DeFi) growth.
Meanwhile, Solana might trend between $200-$350, assuming that developer growth and retail adoption continue at their current pace without major breakthroughs.
However, Daodu cautions that XRP could fall below $1.50 if demand for ETFs wanes or if regulatory uncertainties arise. Similarly, ETH could fall below $2,500 if scalability issues arise or if regulatory challenges become more pronounced. SOL could drop below $100 if outages persist or if it faces increased competition from other Layer 1 platforms.
What AI Models Anticipate
AI predictions provide additional insight into the expected performance of these altcoins. For XRP, forecasts vary significantly, with ChatGPT estimating a range of $0.80-$3.00, while Grok presents a more bullish outlook with a target of $1.50-$6.00.
Ethereum’s AI predictions show a range of $3,000-$9,000 from ChatGPT, while Gemini anticipates a high of $7,000-$18,000 through increased tokenization.
Lastly, Solana’s predictions range from $120-$350 from ChatGPT to a more optimistic $300-$800 from Gemini, depending on the growth of consumer applications.
XRP was trading at $1.93 at the time of writing, down 2% in the previous 24 hours. ETH traded at roughly $2,952, while SOL traded at $128, both experiencing comparable declines during the same time period.
Featured image from DALL-E, chart from TradingView.com
SOL may have received its strongest corporate vote of confidence yet, with Forward Industries (FWDI) now betting almost $908 million on bullish Solana price predictions.
The new year has seen fresh capital rotation into altcoins, and SOL is once again proving its worth at TradFi play of choice with fresh institutional demand.
In its latest press release, the Nasdaq-listed company revealed that its treasury holdings have grown by 60,000 SOL since mid-December, now totalling over 6.97 million SOL.
Forward Industries’ SOL Holdings total over 6.97 Million SOL
"Since initiating our Solana treasury strategy in September 2025, we have generated over 133,450 SOL in staking rewards and compounded our SOL-per-share." – Ryan Navi, Chief Investment Officer of Forward Industries… pic.twitter.com/3wddDNgMTc
The report also sheds light on the contribution of Solana-native yield opportunities, crediting 133,450 SOL to staking rewards on existing holdings.
Staking isn’t the limit of their on-chain activity. Forward Industries also noted a corporate milestone, as the first publicly traded company to offer its shares directly on-chain.
This commitment to expanding its Solana-based operations stands as a testament to its infrastructure as the bridge between TradFi and DeFi, as well as its price potential this cycle.
Solana Price Prediction: The Setup FWDI Could Be Betting On
The choice to accumulate here could be credited to a year-long descending triangle continuation pattern as it approaches its $120 launchpad level.
The 2-year demand zone forming the base of the pattern is being retested again, and with it, there is historical precedent that Solana stands to see another jump higher.
Momentum indicators support the bullish case. While the RSI has slipped just below the neutral 50 level, the broader uptrend it has established points to an imminent bounce.
The recent MACD death cross could prove short-lived, reflecting consolidation rather than a broader trend reversal.
With a bounce from $120, focus shifts to the level that has capped upside since September at $145. From there, the key breakout threshold sits at $210.
And with that level confirmed as support, a breakout push eyes past all-time highs at $300 for a 300% push into new price discovery targeting $500.
However, as Solana permeates deeper into the mainstream TradFi markets and infrastructure, fresh liquidity and use cases could send the altcoin much higher, eying a 680% move to $1,000.
Bitcoin Hyper: Solana Could Be the Wrong Bet
Those who chose Solana over the leading cryptocurrency may soon need to reconsider, as the Bitcoin ecosystem finally tackles its biggest limitation: scalability.
Bitcoin Hyper ($HYPER) is bridging Bitcoin’s security with Solana tech, creating a new Layer-2 network that unlocks scalable, efficient use cases Bitcoin couldn’t support on its own.
Whatever Solana can do, Bitcoin can now do – top-performing narratives like DeFi and real-world assets could be Bitcoin’s for the taking.
The project has already raised almost $31 million in presale, and post-launch, even a small fraction of Bitcoin’s massive trading volume could send its valuation significantly higher.
Bitcoin Hyper is fixing the slow transactions, high fees, and limited programmability that have long capped Bitcoin’s potential – just as the market turns bullish.
Solana failed to settle above $140 and nosedived. SOL price is now consolidating losses below $135 and might struggle to start a recovery wave.
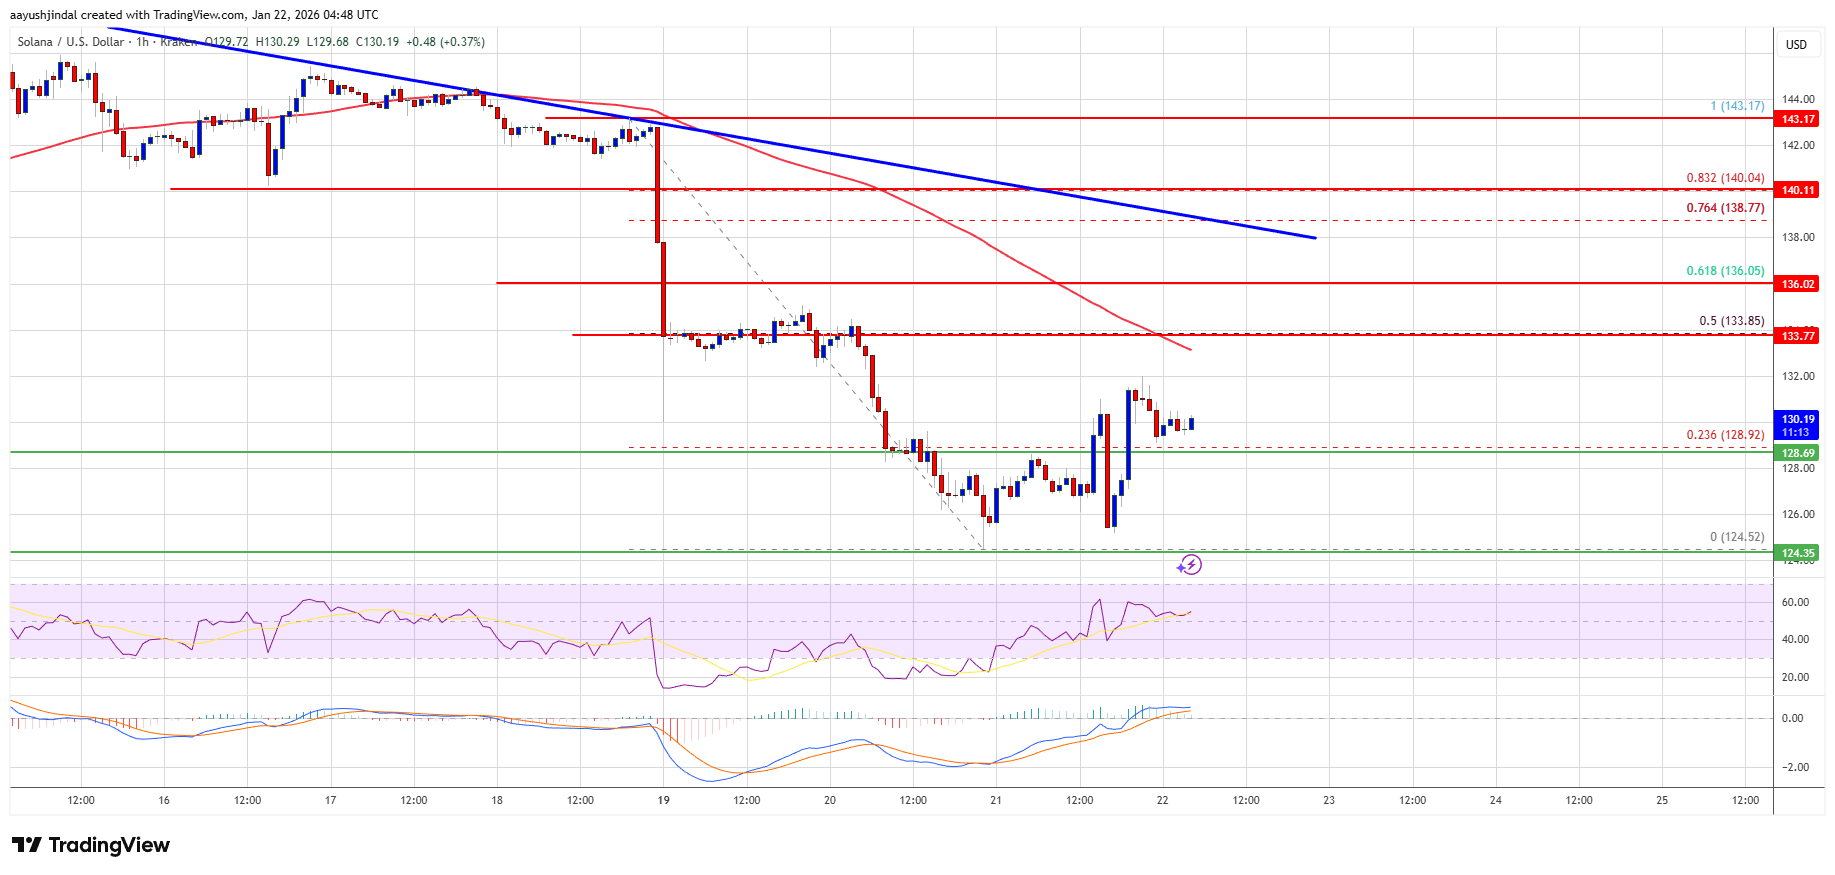
SOL price started a fresh decline below $136 and $135 against the US Dollar.
The price is now trading below $135 and the 100-hourly simple moving average.
There is a key bearish trend line forming with resistance at $138 on the hourly chart of the SOL/USD pair (data source from Kraken).
The price could start a recovery wave if the bulls defend $128 or $125.
Solana Price Dips Further
Solana price failed to remain stable above $140 and started a fresh decline, like Bitcoin and Ethereum. SOL declined below the $138 and $135 support levels.
The price gained bearish momentum below $132. A low was formed at $124, and the price is now consolidating losses. The price recovered a few points and climbed above the 23.6% Fib retracement level of the downward move from the $143 swing high to the $124 low.
Solana is now trading below $135 and the 100-hourly simple moving average. On the upside, immediate resistance is near the $134 level or the 50% Fib retracement level of the downward move from the $143 swing high to the $124 low.
The next major resistance is near the $136 level. The main resistance could be $138. There is also a key bearish trend line forming with resistance at $138 on the hourly chart of the SOL/USD pair. A successful close above the $138 resistance zone could set the pace for another steady increase. The next key resistance is $144. Any more gains might send the price toward the $150 level.
Another Decline In SOL?
If SOL fails to rise above the $133 resistance, it could continue to move down. Initial support on the downside is near the $129 zone. The first major support is near the $125 level.
A break below the $125 level might send the price toward the $120 support zone. If there is a close below the $120 support, the price could decline toward the $112 support in the near term.
Technical Indicators
Hourly MACD – The MACD for SOL/USD is losing pace in the bearish zone.
Hourly Hours RSI (Relative Strength Index) – The RSI for SOL/USD is above the 50 level.
Solana Mobile has rolled out its long-awaited SKR token airdrop for Seeker smartphone users and select developers, adding a fresh ecosystem catalyst as SOL trades near a critical technical support zone.
The launch comes at a time when Solana’s price is hovering around $120–$130, an area analysts see as decisive for the token’s medium-term direction. SKR debuted at around $0.006 and climbed above $0.01 within hours of launch, pushing its market capitalization past $70 million.
More than 100,000 users are eligible to claim the airdrop through the Seeker phone’s built-in wallet over a 90-day window. Any unclaimed tokens will be returned to the general distribution pool.
Solana SKR Airdrop Targets Users and Developers
Solana Mobile allocated 30% of SKR’s fixed 10 billion token supply to airdrops and early unlocks. Nearly 2 billion SKR are being distributed to Seeker phone owners and developers who deployed “quality apps” in the Solana dApp Store during Season 1.
The company said the token underpins governance, incentives, and economic activity within the Solana Mobile ecosystem. SKR can be staked directly from the Seed Vault wallet, with inflation events occurring every 48 hours. The annual inflation rate starts at 10% and declines by 25% each year until it stabilizes at 2%.
The airdrop coincides with the start of Seeker’s Season 2 campaign, which introduces a refreshed app catalog, rewards programs, and a focus on sectors such as DeFi, gaming, payments, trading, and decentralized physical infrastructure (DePIN).
Community reaction has been mixed. Some users reported receiving several thousand dollars’ worth of SKR, while others reported allocations closer to $50–$100. Some users expressed disappointment, citing delays in phone delivery and additional shipping costs.
SOL Price Near Key Support
While SKR draws attention to Solana’s mobile strategy, the SOL token itself is facing a technical test. After breaking below $136, SOL has slipped into the $120–$127 zone, where an ascending trendline from the 2023 lows meets historical horizontal support.
This area has previously acted as both resistance and support, making it a closely watched “flip zone” for traders. A sustained hold above $120 could open the door to a recovery toward the $135–$150 range. A breakdown, however, may expose downside targets near $110 or even $100.
Short-term indicators show some stabilization. SOL recently bounced from around $124 to near $128, supported by renewed ETF inflows of roughly $3.08 million and spot market accumulation of about $9.31 million. These flows suggest buyers are stepping in at current levels.
Cover image from ChatGPT, SOLUSD chart on Tradingview
Delphi Digital is betting that Solana’s next major upgrade cycle will reposition the network as an “exchange grade” environment capable of supporting onchain order books that can realistically contend with centralized venues on latency, liquidity depth, and market structure. In a Jan. 20 post on X titled “2026 is the Year of Solana”, the research firm argued Solana’s 2026 roadmap is its “most aggressive upgrade cycle” yet, one that “overhaul[s] everything from consensus to infrastructure to become the decentralized Nasdaq.”
Why Delphi Digital Calls 2026 “The Year Of Solana”
Delphi framed the roadmap less as a grab bag of performance enhancements and more as a capital-markets push: “Solana’s roadmap is about transforming it into an exchange grade environment where a native onchain CLOB can viably compete with CEX latency, liquidity depth, and fairness. Here are all the upgrades making this possible.” In that view, shaving milliseconds matters only insofar as it produces predictable, enforceable execution outcomes for applications like high-frequency trading and central limit order books.
The centerpiece, Delphi wrote, is Alpenglow, a consensus redesign it called “the most significant protocol level change in Solana’s history.” The firm said Alpenglow introduces a new architecture built around Votor and Rotor, with Votor changing how validators reach agreement. Rather than “chaining multiple voting rounds together,” validators would aggregate votes offchain and “commit to finality in one or two rounds,” producing “theoretical finality in the 100-150 millisecond range, down from the original 12.8 seconds.”
Delphi emphasized Votor’s parallel finalization paths as a resilience feature, not just a speed play. If a block gets “overwhelming support (80%+ stake)” it finalizes immediately; if support is between 60% and 80%, a second round triggers, and finality follows if that also clears 60%. The goal, Delphi argued, is to preserve finality even with unresponsive segments of the network.
Alpenglow also introduces what Delphi called a “20+20” resilience model: safety holds as long as no more than 20% of stake is malicious, while liveness persists even if another 20% is offline, “tolerat[ing] up to 40% of the network being either malicious or inactive while still maintaining finality.” Under this design, Proof of History is “effectively deprecated,” replaced by deterministic slot scheduling and local timers. Delphi said the upgrade is expected to roll out in early to mid 2026.
Delphi also pointed to Firedancer, Jump’s C++ validator client, as a structural upgrade aimed at reducing a long-standing operational risk. Solana has historically relied on a single client, now known as Agave, and Delphi described that “monoculture” as a central weakness because client-level faults can cascade into broader network halts.
Firedancer’s objective, Delphi said, is a deterministic, high-throughput engine that can process “millions of TPS with minimal latency variance.” Ahead of full readiness, Delphi highlighted “Frankendancer,” a transitional build that combines Firedancer’s networking and block production modules with Agave’s runtime and consensus components, as a bridge to “substantially” increased client diversity.
On infrastructure, Delphi spotlighted DoubleZero as a private fiber overlay for validators, likening its transmission profile to traditional exchange connectivity: “the same infrastructure traditional exchanges like Nasdaq and CME rely on for microsecond level transmission.” The argument is that as validator sets expand, propagation variance becomes the enemy of tight finality windows. By routing messages along “optimal paths” and supporting multicast delivery, Delphi said DoubleZero can narrow latency gaps across validators—an enabler for both Votor’s quorum formation and Rotor’s propagation design.
Delphi also framed Solana’s block-building roadmap as a market-structure project. It described Jito’s BAM (Block Assembly Marketplace) as separating ordering from execution via a marketplace and privacy layer, with transactions ingested into TEEs so “neither validators nor builders can see raw transaction content before ordering takes effect,” reducing pre-execution behavior like frontrunning.
Harmonic, meanwhile, targets builder competition by introducing an open aggregation layer so validators can accept proposals from “multiple competing builders in real time,” with Delphi summarizing: “Think of Harmonic as a meta-market and BAM as a micro-market.”
Raiku rounds out the thesis by adding deterministic latency and programmable execution guarantees adjacent to Solana’s validator set, using Ahead-of-Time (AOT) transactions for pre-committed workflows and Just-in-Time (JIT) transactions for real-time needs—without modifying L1 consensus.
Delphi ultimately tied the technical roadmap to market demand: Solana’s spot trading gravity, the consolidation of onchain perps toward a handful of venues, and the need to reach performance parity with centralized platforms. It cited expectations for “new Solana native perps like Bulk Trade coming early next year,” and pointed to products like xStocks bringing “onchain equities directly to Solana,” arguing that liquidity and attention are consolidating toward a chain with faster settlement, better UX, and denser capital.
A year after reaching its all-time high (ATH), Solana (SOL) is trading 54.3% below its $293 2025 milestone, attempting to hold a crucial zone as support. Some analysts warned that the altcoin could risk a deeper correction if the price fails to recover the recently lost ground.
Solana Breaks Below Key Support
On Sunday, Solana recorded an 8% pullback and hit a two-week low of $130. Since losing the $200 phycological barrier in late October, the cryptocurrency has struggled to hold bullish momentum, hovering between the $115-$145 levels over the past three months.
The start-of-the-year rally saw SOL break out of its multi-month downtrend, reclaim the upper zone of its local range, and briefly breach above the key $145 resistance last week. However, Sunday’s market pullback has sent Solana back below key areas.
Amid this performance, market observer BitGuru affirmed in an X analysis that the cryptocurrency “just swept liquidity into a strong demand zone after a clean structure breakdown.”
He explained that the price is attempting to rebound from its local support area, which could trigger a “sharp relief move toward previous highs” if the price can hold the current levels.
Meanwhile, analyst Man of Bitcoin noted that the altcoin’s price broke below its two-week ascending trendline, which had been supporting its 17% surge from its yearly opening. Moreover, it also dropped below the $136 mark, where the price had consistently bounced after the recent breakout.
The market observer pointed out that Solana’s short-term support sits between the $129-$136 area, adding that a breach and sustained breakdown from this area would spell trouble for the cryptocurrency.
According to the chart, if selling pressure persists and Solana fails to reclaim the recently lost ground, the price could see a scenario where it retraces deeper and potentially falls up to 25% to challenge the $100 area.
Analysts Warn Of Head And Shoulder Pattern
Other market watchers highlighted a macro pattern on Solana’s chart, suggesting that a breakdown to new lows could be coming. Notably, the altcoin displays a two-year Head and Shoulders formation in the weekly timeframe.
According to the chart, this bearish pattern has been forming since 2024, with the left shoulder developing during the Q1-Q2 2024 rally and the neckline sitting around the $120 area.
Meanwhile, the pattern’s head formed during its late 2024 and early 2025 bullish run, which led to its ATH of $293 a year ago. Lastly, the right shoulder developed after the Q3 2025 rally and Q4 correction.
Based on this performance, trader Slashology affirmed that Solana is “really looking bad here,” warning that investors should “prepare for the worst” as the price trades near the pattern’s neckline.
He forecasted that a breakdown from this key level could lead to a 35%-40% “bloodbath” toward the $75-$80 levels. On the contrary, market observer Crypto Curb suggested a different outcome could be possible.
In an X post, he compared SOL’s recent performance to the S&P 500 (SPX) price action between 2009 and 2011. Per the post, SPX displayed the same pattern as Solana, but ultimately invalidated the pattern after bouncing from the neckline and breaking above the right shoulder’s peak, eventually reaching new highs.
To the analyst, the altcoin could display a similar performance if it rebounds from the current levels and starts to climb higher.
As of this writing, Solana is trading at $134, a 5.6% decline in the daily timeframe.
Solana failed to settle above $145 and nosedived. SOL price is now consolidating losses below $135 and might decline further below $130.
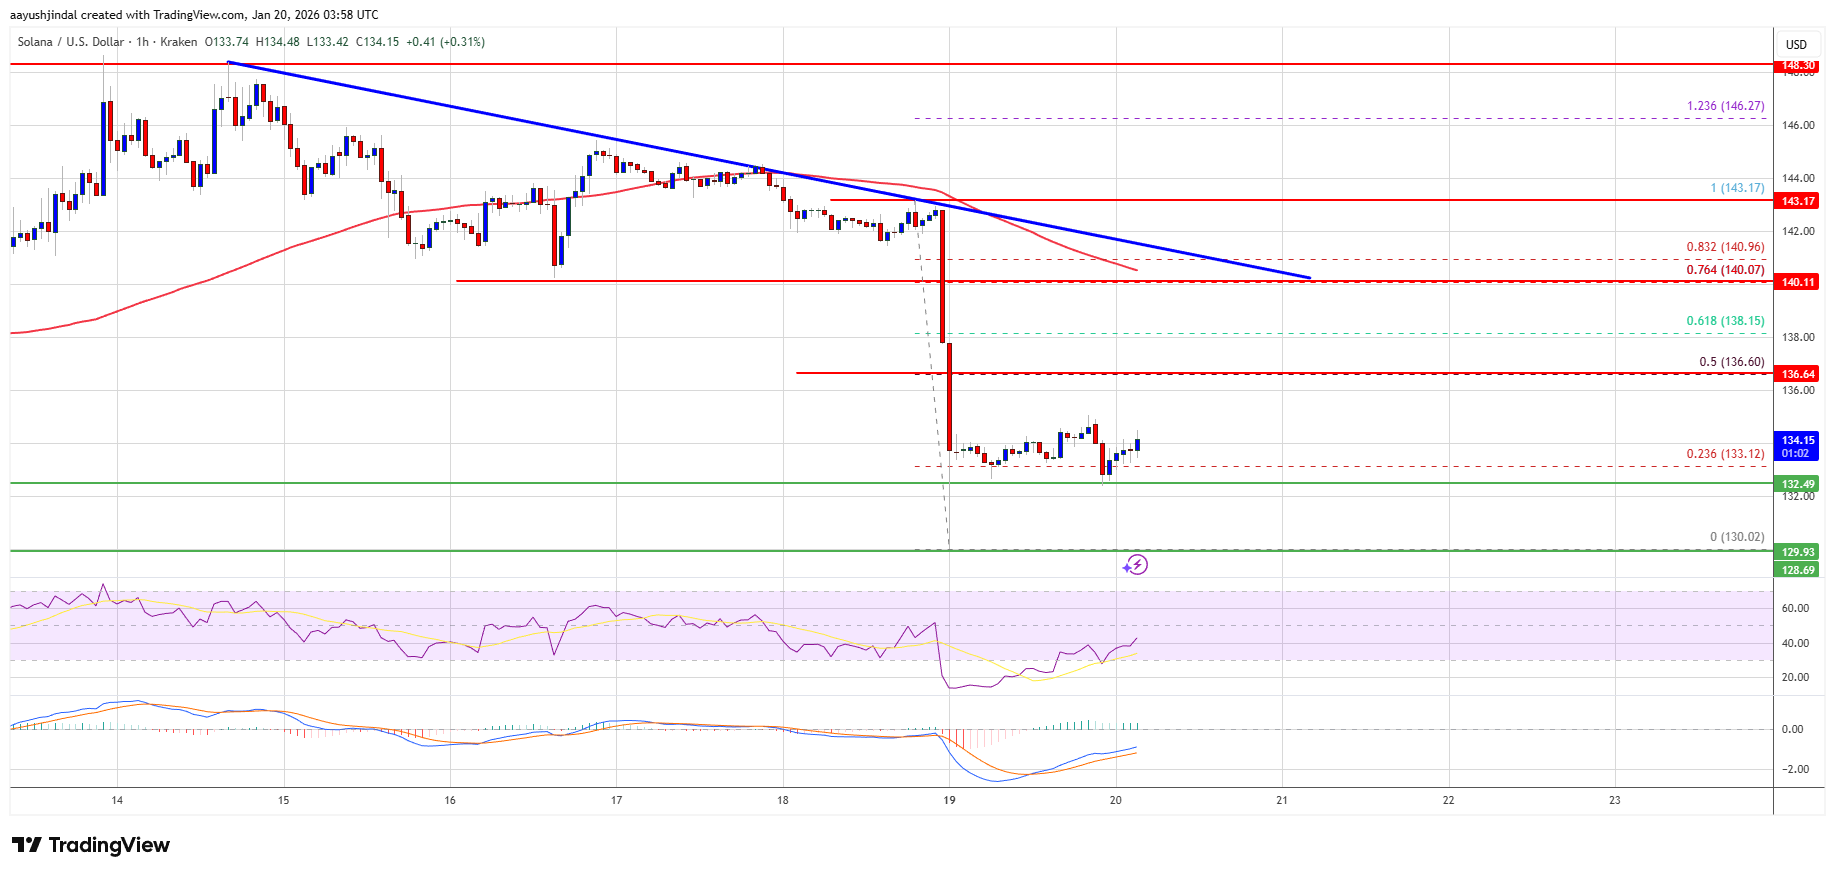
SOL price started a fresh decline below $138 and $135 against the US Dollar.
The price is now trading below $135 and the 100-hourly simple moving average.
There is a key bearish trend line forming with resistance at $140 on the hourly chart of the SOL/USD pair (data source from Kraken).
The price could start a recovery wave if the bulls defend $132 or $130.
Solana Price Dips Again
Solana price failed to remain stable above $142 and started a fresh decline, like Bitcoin and Ethereum. SOL declined below the $140 and $138 support levels.
The price gained bearish momentum below $135. A low was formed at $130, and the price is now consolidating losses. The price recovered a few points and climbed above the 23.6% Fib retracement level of the downward move from the $143 swing high to the $130 low.
Solana is now trading below $135 and the 100-hourly simple moving average. On the upside, immediate resistance is near the $135 level. The next major resistance is near the $136 level or the 50% Fib retracement level of the downward move from the $143 swing high to the $130 low.
The main resistance could be $140. There is also a key bearish trend line forming with resistance at $140 on the hourly chart of the SOL/USD pair. A successful close above the $140 resistance zone could set the pace for another steady increase. The next key resistance is $144. Any more gains might send the price toward the $150 level.
Another Decline In SOL?
If SOL fails to rise above the $136 resistance, it could continue to move down. Initial support on the downside is near the $132 zone. The first major support is near the $130 level.
A break below the $130 level might send the price toward the $122 support zone. If there is a close below the $122 support, the price could decline toward the $115 support in the near term.
Technical Indicators
Hourly MACD – The MACD for SOL/USD is gaining pace in the bearish zone.
Hourly Hours RSI (Relative Strength Index) – The RSI for SOL/USD is below the 50 level.
Buying activity among investors and traders has improved in the cryptocurrency market, with Bitcoin (BTC), Ethereum (ETH), Solana (SOL), and XRP leading the charge. Investors’ growing adoption and interest in these leading coins underscores their potential to produce significant gains in the long term.
Discreet Buying of Bitcoin, Ethereum, Solana, and XRP
With the market regaining bullish traction, several major cryptocurrency assets are starting to showcase upward movements. Following this rebound, institutional investors are stealthily reentering the cryptocurrency market and establishing holdings in Bitcoin, Ethereum, Solana, and XRP, without the customary fanfare.
According to the On-Chain Mind, a Bitcoin and crypto data analyst, this renewed demand among institutional investors is observed in the Exchange-Traded Funds (ETFs) field. Specifically, the behavior, which is significant for the market, is outlined on the Total ETF Flow metric.
This suggests that large funds and professional desks seem to be accumulating during times of muted volatility and mixed moods, taking advantage of liquidity supplied by cautious retail traders rather than pursuing short-term price movements. A widespread purchasing pressure across several significant networks suggests a shift from selective exposure to a more diversified institutional strategy.
After observing the key metric, On-Chain Mind revealed that the daily total crypto ETF flows for Bitcoin, Ethereum, Solana, and XRP are showing their highest net inflows since October 2025. The expert stated that institutional capital stepping back in quietly, absorbing supply while sentiment is still unstable, is exactly what investors have been anticipating. With capital from smart money flowing underneath the surface, these key investors may be preparing the market for its next sustained phase.
XRP Spot ETFs Are Still Maintaining Strong Inflows
Lately, the XRP Spot ETFs are seeing one of the most significant demands and interest from institutional investors. Arthur, a market expert and BingX partner, shared on X that smart money traders are heavily positioning themselves into the XRP spot ETFs.
While retail investors step back, institutional flows are showing a completely different narrative and action. Such a divergence frequently signals a change in market structure, when conviction-driven capital absorbs supply from weaker hands without immediately causing price excitement.
In the past week alone, more than 22.63 million XRP were recorded flowing into the newly launched funds, as seen in the chart posted by the expert. After weeks of additional positions from every major issuer, over 803.78 million XRP is currently being locked within the spot ETFs.
When millions of tokens are being moved into ETFs per day, it often means that a major repricing is only a matter of time before it occurs. Meanwhile, XRP’s current structure reflects a more careful and calm positioning process, which historically tends to develop in price right after the accumulation phase is essentially finished.
Solana faces resistance at key levels, but a potential rebound from support could trigger a rally toward previous highs. The Solana (SOL) price has experienced a sharp decline of 6.0% over the past 24 hours, falling from about $142.92 to $133.62.
Over the weekend, Solana Labs CEO Anatoly Yakovenko pushed back on Vitalik Buterin’s latest case for Ethereum “ossification,” arguing that for Solana, continuous protocol iteration is not optional, it is survival.
The exchange was sparked by a Jan. 12 post in which Buterin said “Ethereum itself must pass the walkaway test,” framing Ethereum as a base layer that should remain usable even if the community largely stops making substantive protocol changes.
“It must support applications that are more like tools […] than like services that lose all functionality once the vendor loses interest in maintaining them,” Buterin wrote. “But building such applications is not possible on a base layer which itself depends on ongoing updates from a vendor in order to continue being usable […] Hence, Ethereum itself must pass the walkaway test.”
Why Solana Can’t Afford To Ossify
Yakovenko replied that he “actually think[s] fairly differently on this,” laying out a philosophy that treats adaptability as core to Solana’s value proposition. “Solana needs to never stop iterating,” he wrote. “It shouldn’t depend on any single group or individual to do so, but if it ever stops changing to fit the needs of its devs and users, it will die.” In Yakovenko’s framing, the risk is not merely technical stagnation; it is a network losing relevance to the people building and transacting on it.
Buterin’s “walkaway test” rests on the idea that Ethereum should reach a point where its usefulness does not “strictly depend on any features that are not in the protocol already,” even if the ecosystem continues improving via client optimizations and limited parameter changes. He also sketched a set of medium-term protocol objectives, ranging from quantum resistance and scalable architecture to long-lived state design and decentralization safeguards, aimed at making Ethereum robust “for decades” and reducing the need for frequent disruptive upgrades.
Yakovenko’s critique is less about those specific goals than the premise that a base layer should aspire to being able to “ossify if we want to.” In his view, ossification is not a neutral milestone; it risks locking in a protocol that can’t keep pace with developer and user demands. “To not die requires to always be useful,” he wrote. “So the primary goal of protocol changes should be to solve a dev or user problem.” At the same time, he emphasized prioritization over maximalism: “That doesn’t mean solve every problem, in fact, saying no to most problems is necessary.”
A key overlap in both positions is a skepticism toward dependence on a single “vendor,” though they operationalize it differently. Buterin wants Ethereum’s base layer to become sufficiently complete that it can remain dependable even if the upgrade cadence slows dramatically. Yakovenko, by contrast, argues that Solana should assume upgrades will keep coming, but not necessarily from any one core team.
“You should always count on there being a next version of solana, just not necessarily from Anza or Labs or fd,” he wrote, referencing major entities in Solana’s development orbit. He then pointed to a future where governance and funding mechanisms could directly underwrite that work, suggesting “we are likely to end up in a world where a SIMD vote pays for the GPUs that write the code,” a nod to both on-chain coordination and the growing role of AI-assisted development.
Solana is testing investor confidence as the SOL price slips back toward key support levels, even as the network continues to expand across multiple fronts. After briefly pushing above $147 earlier this week, the token failed to hold its gains and is now trading below $145.
The pullback comes at a time when Solana is seeing rising institutional interest, growing real-world asset adoption, and new user-focused initiatives, creating a contrast between short-term price pressure and longer-term ecosystem growth.
SOL Price Tests Critical Support Zone
SOL has entered a short-term correction after failing to clear the $150 resistance area. The price dropped below the $146 and $145 levels, moving under the 100-hour simple moving average. On the downside, technical analysts are watching the $141–$140 zone, where a bullish trend line and Fibonacci support converge.
If the SOL price breaks below $140, the next support sits near $132, with further downside risk toward $124. On the upside, resistance remains near $146 and $148. A confirmed move above $148 could open the door to a retest of $155 and potentially $162.
Momentum indicators reflect cautious sentiment. The hourly RSI remains below 50, and the MACD continues to show bearish pressure. Despite a healthy trading volume of around $5 billion in 24 hours, SOL is still down roughly one-third from its price a year ago and well below its previous peak near $293.
Regulatory Developments and Solana ETF Inflows
Beyond price action, regulatory news in the U.S. may influence Solana’s medium-term outlook.
The draft bill known as the “Clarity Act,” released by the Senate Banking Committee, proposes reclassifying certain cryptocurrencies with exchange-traded products as “non-incidental” assets starting in 2026. This would ease some SEC disclosure requirements for assets like SOL.
If passed, the proposal could place Solana in a similar regulatory category to Bitcoin and Ethereum, potentially improving institutional access. Early signs of interest have already appeared.
On January 15, U.S. spot Solana ETFs recorded $23.57 million in net inflows, the highest in four weeks. However, ETF assets still represent only about 1.5% of SOL’s market capitalization, limiting their immediate impact on price.
Network Growth Outpaces Price Momentum
While the SOL price struggles, Solana’s network continues to expand. In 2025, the blockchain processed $1.6 trillion in trading volume, accounting for roughly 12% of the crypto market. Its DeFi ecosystem remains anchored by platforms like Jupiter, Raydium, Orca, and Kamino, with TVL holding steady near $11.5 billion.
A major milestone came as Solana’s real-world asset (RWA) ecosystem reached a record valuation of $1.15 billion, driven by tokenized U.S. Treasuries, equities, and institutional funds. This signals growing use of Solana as a settlement layer for traditional assets.
User engagement initiatives are also expanding. Solana’s Seeker phone is rolling out a large SKR token airdrop to over 100,000 users, while Interactive Brokers has enabled 24/7 USDC deposits via the Solana network, improving access for global traders.
Cover image from ChatGPT, SOLUSD chart from Tradingview
The Solana RWA ecosystem surpassing $1B in TVL the recent price stabilization signal potential for further gains if SOL maintains key support levels. Notably, Solana (SOL) is currently changing hands at $143.08, a slight 1.0% decrease over the last 24 hours.
Solana failed to stay above $146 and corrected gains. SOL price is now trading below $145 and might find bids near the $140 zone.
SOL price started a downside correction below $145 against the US Dollar.
The price is now trading below $145 and the 100-hourly simple moving average.
There is a bullish trend line forming with support at $141 on the hourly chart of the SOL/USD pair (data source from Kraken).
The pair could extend losses if it dips below the $140 zone.
Solana Price Starts Downside Correction
Solana price failed to surpass $150 and started a downside correction, like Bitcoin and Ethereum. SOL dipped below $146 and $145 to enter a short-term bearish zone.
There was a move below the 61.8% Fib retracement level of the upward wave from the $138 swing low to the $149 high. However, the bulls are active above $140. Besides, there is a bullish trend line forming with support at $141 on the hourly chart of the SOL/USD pair.
Solana is now trading below $145 and the 100-hourly simple moving average. On the upside, the price is facing resistance near the $144 level. The next major resistance is near the $146 level. The main resistance could be $148. A successful close above the $148 resistance zone could set the pace for another steady increase. The next key resistance is $155. Any more gains might send the price toward the $162 level.
More Losses In SOL?
If SOL fails to rise above the $146 resistance, it could start another decline. Initial support on the downside is near the $141 zone and the trend line. The first major support is near the $140 level and the 76.4% Fib retracement level of the upward wave from the $138 swing low to the $149 high.
A break below the $140 level might send the price toward the $132 support zone. If there is a close below the $132 support, the price could decline toward the $124 support in the near term.
Technical Indicators
Hourly MACD – The MACD for SOL/USD is gaining pace in the bearish zone.
Hourly Hours RSI (Relative Strength Index) – The RSI for SOL/USD is below the 50 level.
NASA Data Helps Maine Oyster Farmers Choose Where to Grow
The Landsat satellites are helping oyster farmers in Maine see which coves run warmer or cooler from space.
Credits: NASA/Ross Walter and Allison Nussbaum
When oyster farmer Luke Saindon went looking for a place to grow shellfish in Maine, he knew that picking the wrong patch of water could sink the farm before it began. So Saindon did something oyster farmers couldn’t have done a generation ago: He used NASA satellite data to view the coastline from space.
“Starting a farm is a big venture,” said Saindon, the director for The World Is Your Oyster farm in Wiscasset, Maine. “If you choose the wrong spot, you can blow through a lot of money without ever bringing oysters to market.”
NASA satellites had been passing over these waters for years, recording temperatures and other conditions. Using a site-selection tool created by University of Maine researchers, Saindon examined satellite maps showing where water temperatures and food levels might be best for growing oysters. The maps pointed him toward a wide, shallow bay near his home. Four years later, the farm is still there — and the oysters are thriving.
Luke Saindon, director of The World Is Your Oyster farm in Wiscasset, Maine, checks oyster cages on the farm’s floating platform.
Saindon believes that using the satellite data to select his oyster farm site resulted in faster-than-average growth rates.
“This is an example of how NASA’s Earth science program supports our nation,” said Chris Neigh, the Landsat 8 and 9 project scientist at NASA’s Goddard Space Flight Center in Greenbelt, Maryland. “We collect global data, but its value grows when it’s used locally to help communities work smarter and make their livelihoods more sustainable.”
From orbit to oyster
That same satellite-based approach is now the foundation of a study published Jan. 15 in the journal Aquaculture. Led by University of Maine scientists Thomas Kiffney and Damian Brady, the research demonstrates how temperature data from Landsat — the joint NASA and U.S. Geological Survey mission — combined with European Sentinel-2 satellite estimates of oyster food availability, namely plankton, can predict how quickly eastern oysters (Crassostrea virginica) reach market size.
The team built a satellite data–driven model of how oysters divide their energy among growth, survival, and reproduction. Feed the model sea surface temperature and satellite estimates of chlorophyll and particulate organic matter — signals of how much plankton and other edible particles are in the water — and it predicts how fast oysters will grow, a big step beyond just spotting good or bad sites for farms.
“By showing where oysters grow faster, the model can help farmers plan ahead,” Kiffney said. “That could mean better decisions about when to seed, when to harvest, and how much product to expect, all of which reduces financial risk.”
That kind of insight is increasingly valuable in Maine, where oyster farming has grown rapidly over the last decade. From 2011 to 2021, the industry’s value increased 78%, rising from about $2.5 million to more than $10 million. As the sector scales up, understanding the finer details of Maine’s coastal waters has become essential — and that’s where NASA satellites come in.
The stakes are considerable. “It takes two to three years of scoping in order to get your permit to grow, and then it can take two years for those oysters to reach market,” Brady said. “So if you’ve chosen the wrong site, you’re four years in the hole right off the bat.”
Sharper eyes on coast
Maine’s coastline measures about 3,400 miles (5,500 kilometers) if you follow the tide line. It is a coast of drowned valleys and glacier-scoured granite. Water depth, temperature, and circulation can shift dramatically within a few miles. This complexity makes oyster site selection notoriously difficult, and some satellites that see the coast in broad strokes miss the small, patchy places where oysters live.
“What makes Landsat so powerful for aquaculture is its ability to see finer-scale patterns along the coast,” where farmers put oyster cages in the water, Neigh said.
This false-color image from Landsat 9’s Thermal Infrared Sensor, acquired Oct. 11, 2025, shows the thermal signature of waters off the coast of Maine — revealing finer-scale temperature differences between neighboring coves. Cooler waters appear purple and blue, while warmer water shows up in orange and yellow.
NASA/Ross Walter and Allison Nussbaum
Landsat 8 and 9’s pixels — 98 to 328 feet (30 to 100 meters) across — are able to distinguish more subtle temperature differences between neighboring coves. For a cold-blooded oyster, those distinctions can translate into months of growth. Warm water accelerates feeding and shell development. Cold water slows both.
A challenge for satellites is clouds. Maine’s sky is frequently overcast, and together Landsat 8 and 9 pass over any given point only every eight days. To work around this, the research team analyzed 10 years of Landsat data (2013–2023) and built seasonal “climatologies,” or average temperature patterns for every 98-foot (30-meter) pixel along the coast. Sentinel-2 imagery added estimates of chlorophyll and particulate organic matter, the drifting microscopic food that oysters pull from the water column with rhythmic contractions of their gills.
Field tests at multiple sites showed the technique’s accuracy. “We validated the model against seven years of field data,” Brady said. “It’s a strong indication that these remotely sensed products can inform not just where to grow, but how long it will take to harvest.”
Turning satellite science into tools for growers
The University of Maine team is now developing an online tool to put this model into practice. A grower will be able to click on a coastal location and receive an estimate for time-to-market.
The researchers also assist with workshops through Maine’s Aquaculture in Shared Waters program, teaching farmers how to interpret temperature and water clarity data and apply them to their own sites.
Monique Boutin, an aquaculture technician with The World Is Your Oyster farm, sorts oysters during harvest work on the water in Maine.
For farmers like Saindon, that translates into something simpler: confidence and efficiency. “Having these kinds of tools lowers the barrier for new people to get into aquaculture,” he said. “It gives you peace of mind that you’re not just guessing.”
The Maine project is helping pave the way for other NASA missions. The PACE satellite (Plankton, Aerosol, Cloud, ocean Ecosystem) launched in 2024 and is now delivering hyperspectral observations of coastal waters. Where earlier sensors could estimate how much plankton was present, PACE can begin to identify the different plankton species themselves. For oysters, mussels, and other filter feeders, that specificity matters. Not all plankton are equal food: Different kinds offer different nutrition, and some plankton are harmful to oysters.
A next step will be turning that richer picture of coastal life into forecasts people working on the water can use, helping farmers trade some of the coast’s mystery for evidence they can apply to their harvest.
By Emily DeMarco
NASA’s Goddard Space Flight Center, Greenbelt, Md.
Solana started a fresh increase above the $142 zone. SOL price is now consolidating above $142 and might aim for more gains above the $150 zone.
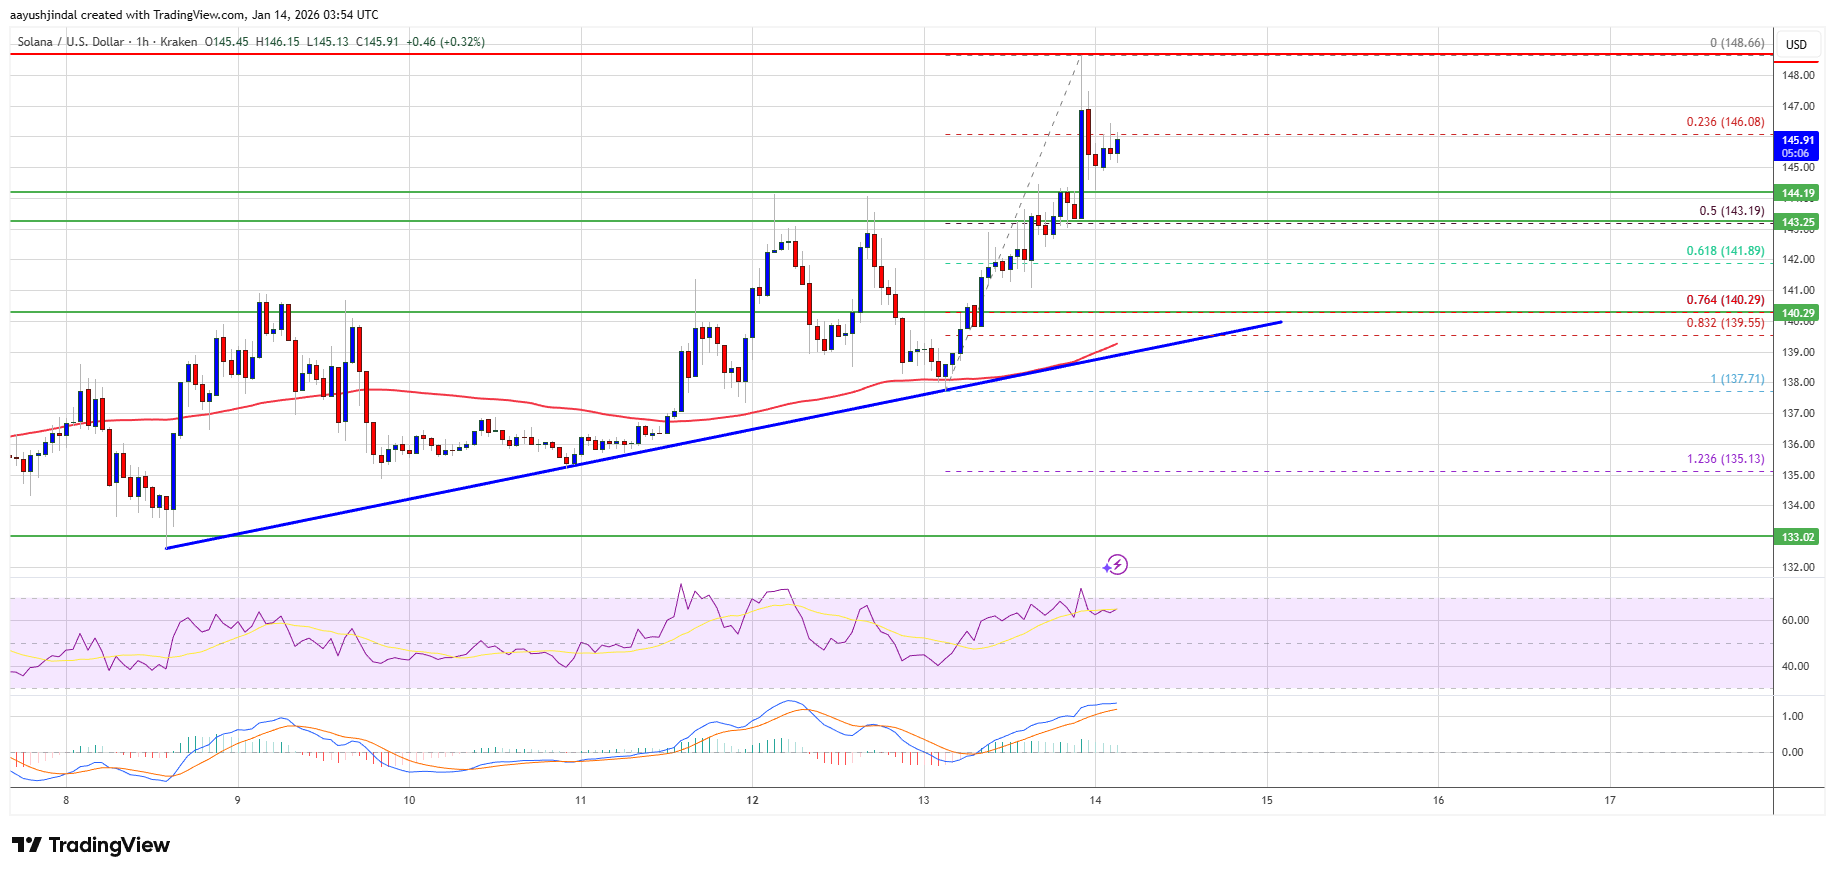
SOL price started a fresh upward move above the $142 and $145 levels against the US Dollar.
The price is now trading above $142 and the 100-hourly simple moving average.
There is a bullish trend line forming with support at $140 on the hourly chart of the SOL/USD pair (data source from Kraken).
The pair could extend gains if it clears the $150 resistance zone.
Solana Price Starts Fresh Surge
Solana price started a decent increase after it settled above the $135 zone, like Bitcoin and Ethereum. SOL climbed above the $140 level to enter a short-term positive zone.
The price even smashed the $142 resistance. The bulls were able to push the price above $145. A high was formed at $148, and the price is now consolidating gains. There was a minor decline below the 23.6% Fib retracement level of the recent upward move from the $138 swing low to the $148 high.
Solana is now trading above $142 and the 100-hourly simple moving average. Besides, there is a bullish trend line forming with support at $140 on the hourly chart of the SOL/USD pair.
On the upside, the price is facing resistance near $148. The next major resistance is near the $150 level. The main resistance could be $155. A successful close above the $155 resistance zone could set the pace for another steady increase. The next key resistance is $162. Any more gains might send the price toward the $170 level.
Downside Correction In SOL?
If SOL fails to rise above the $148 resistance, it could start another decline. Initial support on the downside is near the $144 zone. The first major support is near the $143 level or the 50% Fib retracement level of the recent upward move from the $138 swing low to the $148 high.
A break below the $143 level might send the price toward the $140 support zone and the trend line. If there is a close below the $140 support, the price could decline toward the $135 support in the near term.
Technical Indicators
Hourly MACD – The MACD for SOL/USD is gaining pace in the bullish zone.
Hourly Hours RSI (Relative Strength Index) – The RSI for SOL/USD is above the 50 level.
Bitcoin, Ethereum, Solana, and XRP are at the center of a clear capital rotation unfolding across the crypto market, as investors scale back exposure to the largest assets while reallocating capital into selective alternatives. The latest CoinShares Digital Asset Fund Flows Weekly Report (Volume 268) captures this shift through hard fund-flow data, highlighting deliberate institutional repositioning.
Bitcoin And Ethereum See Heavy Withdrawals As Capital Rotates
Digital asset investment products recorded $454 million in net outflows over the latest reporting week, a move linked to weakening expectations for near-term US Federal Reserve rate cuts. As macro conditions tightened, capital moved defensively, pressuring risk assets across the board.
Bitcoin accounted for the overwhelming share of redemptions. BTC investment products saw $405 million in outflows, reinforcing the idea that investors are reducing exposure where liquidity is deepest and allocations are largest. Ethereum followed with $116 million in outflows, confirming that selling pressure remains concentrated in core holdings rather than across the entire asset class.
The regional breakdown sharpens this picture. The United States recorded $569 million in outflows, making it the dominant source of capital withdrawal during the week. In contrast, other regions remained selectively constructive. Germany posted $58.9 million in inflows, while Canada added $24.5 million and Switzerland recorded $21 million, pointing to regional divergence rather than a synchronized global retreat.
Flows by product and provider further reinforce this trend. Multi-asset investment products saw $21 million in outflows, indicating reduced appetite for broad crypto exposure. Binance-linked products lost $3.7 million, while Aave-related products recorded $1.7 million in outflows, showing that pressure extended beyond just Bitcoin and Ethereum-linked vehicles.
Solana And XRP Capture Inflows Amid Market Repositioning
While headline flows were negative, capital did not exit crypto entirely. Instead, it rotated. XRP led alternative asset inflows with $45.8 million, standing out as the strongest performer during the week. Solana followed closely with $32.8 million in inflows, continuing a pattern of steady institutional accumulation.
These inflows are notable because they occurred during a week of broad net outflows, suggesting intentional reallocation rather than indiscriminate risk-off behavior. Investors appeared willing to maintain crypto exposure, but only where they perceived stronger relative upside or differentiated fundamentals. Solana’s inflows reflect confidence in its ecosystem growth and transaction throughput, while XRP’s gains point to improving sentiment around its positioning and use-case clarity.
Smaller assets also saw selective interest. Sui recorded $7.6 million in inflows, reinforcing the theme that capital is being redeployed with precision rather than withdrawn wholesale.
The numbers draw a clear conclusion. Bitcoin and Ethereum are increasingly treated as macro-sensitive anchors within crypto portfolios, absorbing most of the downside when conditions tighten. Solana and XRP, by contrast, are emerging as tactical allocation targets. If this rotation persists, market leadership could shift away from incumbents toward assets perceived to offer better capital efficiency, reshaping short-term market structure without undermining crypto’s broader institutional footprint.
Solana’s price has delivered a slight rebound as the broader crypto market gradually shifts towards a bullish outlook. Although the price of SOL may be demonstrating strength once again, its future trajectory is largely tied to the performance of the leading network in the days ahead.
Network Performance Becomes The Key Catalyst For Solana’s Price
Following a slight bounce on Monday, Solana is back above the $140 price mark. However, on-chain data suggests that the altcoin is nearing a turning point where its next significant price change may depend more on how well its network functions going forward than on market sentiment.
This thesis was outlined by Santiment, a leading market intelligence and on-chain data platform, after examining the correlation between SOL’s current price movement and its network activity. With price spikes coinciding with reduced network activity, the focus is now on the blockchain’s ability to maintain that momentum.
Santiment highlighted that as ongoing market volatility cools off, the price of SOL experienced a leg up as high as $144, drawing dangerously close to breaking past its $145 resistance level. While the price remains below the key resistance level, the altcoin awaits its next major catalyst in order to clear this level.
According to the on-chain platform, this will mostly depend on whether SOL network growth can start to increase once more, drawing attention to its fading new wallet creation. Data shows that the number of new wallet addresses created in a weekly timeframe has dropped significantly over the last few weeks.
In contrast to the prior optimistic moments, when new addresses were generated at record rates, accompanied by soaring trading and meme-coin activity, the slowdown represents a significant change.
As of November 2024, the number of weekly wallet addresses created was approximately 30.2 million. Fast forward to today, and the figure has fallen sharply, sitting at about 7.3 million. This massive drop in wallet creation signals a growing cooling phase in user onboarding across the SOL network.
SOL Maintaining Large Daily Transactions
New wallet addresses may have reduced significantly, but Solana’s transaction scale remains robust. Despite fluctuations in the overall market momentum, SOL maintains a remarkably high level of daily transactions, demonstrating the power of its network.
In a recent report from Solana Daily on the X platform, it was revealed that the network has persistently carried out more than 60 million transactions every day for the past 750 days. This consistency demonstrates the chain’s widespread use in Decentralized Finance (DeFi), Non-Fungible Tokens (NFTs), payments, and high-throughput applications that depend on its affordability and speed.
An interesting aspect of this growth is that the network has maintained zero uptime within the timeframe, reinforcing its position as a reliable hub for on-chain activity. Currently, Solana is supported by real usage rather than just speculative spikes, which increases network efficiency.