❌

Normal view

There are new articles available, click to refresh the page.
Before yesterdayMain stream

Solana Price Prediction: 200+ U.S. Stocks Just Landed on SOL – Is This the Most Bullish News of the Year?

23 January 2026 at 12:39

Over 200 tokenized U.S. stocks and ETFs just landed on Solana, boosting bullish Solana price predictions as its ecosystem evolves into the go-to platform for on-chain capital markets.

The altcoin is earning its keep as Wall Street’s blockchain of choice, now offering near-complete TradFi portfolio access through its partnership with Ondo Global Markets.

Today, Solana goes TradFi.

Hundreds of tokenized stocks & ETFs are now live on @solana, bringing the full TradFi portfolio to crypto’s largest trading ecosystem.

Millions of Solana users can now access Wall Street-grade liquidity across 200+ assets, including tokens tracking:… pic.twitter.com/JRZxcScOXj

β€” Ondo Finance (@OndoFinance) January 21, 2026

While Ondo featured on Ethereum and BNB first, Solana’s throughput makes it a closer match for the demands of traditional capital markets. It is uniquely positioned as the infrastructure layer to bridge TradFi and DeFi.

Solana has already proven itself in tokenized equities, accounting for a dominant 46% share of the $1 billion tokenized stock market through platforms like xStocks.

Tokenised Stock AUM by blockchain ($). Source: Dune Analytics.
Tokenised Stock assets under managment (AUM) by platform ($). Source: Dune Analytics.

Until now, however, growth has been constrained by limited liquidity depth and asset selection.

That ceiling may be lifting. With regulation pushing tokenization deeper into the mainstream, even a small fraction of the U.S. stock market’s massive trading volume could send SOL significantly higher.

Solana Price Prediction: Could Ondo Help Fuel a SOL Surge?

As the bull market matures, sticky adoption of RWAs could bring the demand Solana needs to finally realise a year-long descending channel.

Momentum indicators suggest the shift may already be underway, with a potential higher low setting focus on a breakout attempt.

SOL / USD 1-day chart - descending triangle pattern. Source: TradingView.
SOL / USD 1-day chart – descending triangle pattern. Source: TradingView.

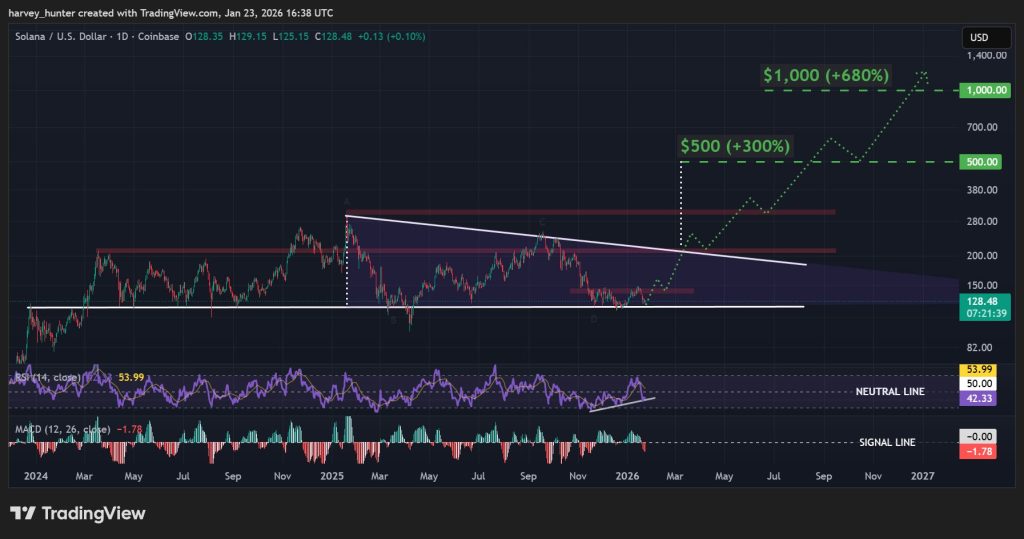
The RSI has once again affirmed its uptrend with another higher low after falling below the 50 neutral line, a sign of strength beneath the surface.

The MACD shows a potential trend shift, levelling off below the signal line around bottoms that previously marked the end of consolidation within the structure.

The recent bounce from the patterns $120 support could be the last, but the resistance that has capped upside since September at $145 will be the key proving grounds.

From there, the key breakout threshold sits at $210.

And with that level confirmed as support, a breakout push eyes past all-time highs at $300 for a 300% push into new price discovery targeting $500.

However, as Solana permeates deeper into the mainstream TradFi markets and infrastructure, fresh liquidity and use cases could send the altcoin much higher, eying a 680% move to $1,000.

Bitcoin Hyper: Don’t Back Solana Until You’ve Seen This

Those who chose Solana over the leading cryptocurrency may soon need to reconsider, as the Bitcoin ecosystem finally tackles its biggest limitation: scalability.

Bitcoin Hyper ($HYPER) is bridging Bitcoin’s security with Solana tech, creating a new Layer-2 network that unlocks scalable, efficient use cases Bitcoin couldn’t support on its own.

Whatever Solana can do, Bitcoin can now do – top-performing narratives like DeFi and real-world assets could be Bitcoin’s for the taking.

The project has already raised almost $31 million in presale, and post-launch, even a small fraction of Bitcoin’s massive trading volume could send its valuation significantly higher.

Bitcoin Hyper is fixing the slow transactions, high fees, and limited programmability that have long capped Bitcoin’s potential – just as the market turns bullish.

Visit the Official Bitcoin Hyper Website Here

The post Solana Price Prediction: 200+ U.S. Stocks Just Landed on SOL – Is This the Most Bullish News of the Year? appeared first on Cryptonews.

ONDO’s Silent Accumulation: Whales Absorb The 1.94B Unlock While Price Bleeds

20 January 2026 at 04:00

ONDO has lost over 65% of its value since October as heavy selling pressure continues to dominate the altcoin market. While Bitcoin has shown relative stability at key levels, many mid-cap tokens like ONDO have struggled to find consistent demand. This drawdown has pushed sentiment toward the bearish side, especially as traders remain cautious around liquidity events and token unlocks.

Still, some analysts argue that the current dip is not purely a sign of weakness. A CryptoQuant report explains that the headlines may scream β€œprice drop,” but the on-chain data is pointing toward β€œopportunity” instead. The focus is now on ONDO’s massive 1.94 billion token unlock scheduled for January 18, 2026. Historically, unlocks can trigger panic selling, as investors anticipate higher circulating supply and additional distribution pressure.

However, this time may be different. The report suggests that larger market participants are actively positioning through the decline, using the fear as a liquidity window. Rather than treating the unlock as a reason to exit, the data hints that β€œsmart money” is stepping in to absorb supply while retail confidence remains fragile. That sets the stage for a critical test.

Smart Money Absorption Signals Are Building

The CryptoQuant report outlines why larger investors appear to be ignoring the noise around ONDO’s decline. The first signal is the β€œwhale shield.” Despite the sharp correction since the December 2024 peak, Spot Average Order Size continues to be dominated by β€œBig Whale Orders,” shown through consistent green dots on the chart. This implies institutions are using weakness to absorb liquidity, with the $0.35–$0.40 zone acting as a primary accumulation range.

Ondo Spot Average Order Size | Source: CryptoQuant

Second, ONDO has officially entered a Taker Buy Dominant phase. The 90-day Cumulative Volume Delta (CVD) remains positive and continues rising, showing that market buy pressure has outweighed market sells for months. This is important because takers represent aggressive participants who buy at the ask without waiting for better entries.

The report frames this alignment as β€œtaker alpha.” When large whale orders and aggressive taker buying strengthen while the price falls, it often reflects absorption. If this continues through the unlock, ONDO could be building a coiled-spring setup for a 2026 RWA breakout.

ONDO Extends Downtrend as Bulls Defend Key Demand Zone

ONDO remains under heavy pressure after a prolonged decline that has erased most of its 2025 upside. The 3-day chart shows a clear breakdown from the former consolidation range near $0.90–$1.00, where price repeatedly failed to reclaim momentum during the second half of the year. Once sellers forced a decisive move lower, the market quickly transitioned into a steep downtrend marked by weak bounces and consistent lower highs.

ONDO testing fresh demand level | Source: ONDOUSDT chart on TradingView

At the time of writing, ONDO is trading near $0.33 after slipping below the $0.40 handle, a psychological level that previously acted as temporary support. This drop places the token deep below its key moving averages, with the shorter trend lines rolling over and acting as overhead resistance. The failed recovery attempts throughout late 2025 confirm that sellers have stayed in control, while buyers have struggled to generate enough volume to shift the trend.

However, price is now approaching a potential demand zone around $0.30–$0.35, where volatility historically increases and dip buyers may try to step in. If this area fails, the chart suggests downside could accelerate. Still, a strong defense could open the door for a stabilization phase before any meaningful rebound.

Featured image from ChatGPT, chart from TradingView.comΒ 

❌
❌