Half the world's 100 largest cities are experiencing high levels of water stress, with 38 of these sitting in regions of "extremely high water stress," new analysis and mapping has shown. The Guardian: Water stress means that water withdrawals for public water supply and industry are close to exceeding available supplies, often caused by poor management of water resources exacerbated by climate breakdown. Watershed Investigations and the Guardian mapped cities on to stressed catchments revealing that Beijing, New York, Los Angeles, Rio de Janeiro and Delhi are among those facing extreme stress, while London, Bangkok and Jakarta are classed as being highly stressed.
Separate analysis of NASA satellite data, compiled by scientists at University College London, shows which of the largest 100 cities have been drying or getting wetter over two decades with places such as Chennai, Tehran and Zhengzhou showing strong drying trends and Tokyo, Lagos and Kampala showing strong wetting trends. All 100 cities and their trends can be viewed on a new interactive water security atlas.
An anonymous reader quotes a report from Inside Climate News: Just 32 companies accounted for over half of global fossil carbon emissions in 2024, according to a report published Wednesday by the U.K.-based think tank InfluenceMap. That is down from 36 companies responsible for half the global CO2 emissions in 2023, and 38 companies five years ago. The analysis is the latest update to the Carbon Majors database, which tracks the world's largest oil, gas, coal and cement producers and uses production data to calculate the carbon emissions from each entity's production. The database, first developed by researcher Richard Heede and now hosted by InfluenceMap, quantifies current and historical emissions attributable to nearly 180 companies and provides annual updates. It is the only database of its kind tracking corporate-generated carbon emissions dating back to the start of the Industrial Revolution, research that's being used in efforts to hold major polluters accountable for climate harms.
Despite dire warnings from scientists about the consequences of accelerating climate change, fossil fuel production is continuing apace. Last year, fossil fuel CO2 emissions reached a record high, topping 38 billion metric tons. In 2024 these emissions were 37.4 billion metric tons -- up 0.8 percent from 2023 -- and traceable to 166 oil, gas, coal and cement producers, according to the report. Much of the global carbon emissions in 2024 came from state-owned entities, which represented 16 of the top 20 emitters. The five largest emitters overall -- Saudi Arabia's Aramco, Coal India, China's CHN Energy, National Iranian Oil Co. and Russia's Gazprom -- were all state-controlled, and accounted for 18 percent of the total fossil CO2 emissions in 2024.
ExxonMobil, Chevron, Shell, ConocoPhillips and BP -- the top five emitting investor-owned companies -- together were responsible for 5.5 percent of the total emissions in that year. Historically, ExxonMobil and Chevron rank in the top five for fossil carbon emissions generated from 1854 through 2024, accounting for 2.79 percent and 3.08 percent of overall carbon pollution, respectively. According to the analysis, the 178 entities in the database have generated 70 percent of fossil CO2 emissions since the start of the Industrial Revolution, and just 22 entities are responsible for one-third of these emissions. "Each year, global emissions become increasingly concentrated among a shrinking group of high-emitting producers, while overall production continues to grow. Simultaneously, these heavy emitters continue to use lobbying to obstruct a transition that the scientific community has known for decades is essential," said Emmett Connaire, senior analyst at InfluenceMap. The findings of the new analysis, he added, "underscore the growing importance of this kind of rigorous evidence in efforts to determine accountability for climate-related losses."
Just 32 fossil fuel companies were responsible for half the global carbon dioxide emissions driving the climate crisis in 2024, down from 36 a year earlier, a report has revealed. The Guardian: Saudi Aramco was the biggest state-controlled polluter and ExxonMobil was the largest investor-owned polluter. Critics accused the leading fossil fuel companies of "sabotaging climate action" and "being on the wrong side of history" but said the emissions data was increasingly being used to hold the companies accountable.
State-owned fossil fuel producers made up 17 of the top 20 emitters in the Carbon Majors report, which the authors said underscored the political barriers to tackling global heating. All 17 are controlled by countries that opposed a proposed fossil fuel phaseout at the Cop30 UN climate summit in December, including Saudi Arabia, Russia, China, Iran, the United Arab Emirates and India. More than 80 other nations had backed the phaseout plan.
alternative_right shares a report from ScienceAlert: Thanks to a giant eruption on the Sun and a large opening in its atmosphere, we're currently experiencing G4 conditions -- a severe geomagnetic storm strong enough to disrupt power grids as energy from space weather disturbances drives electric currents through Earth's magnetic field and the ground. Experts say the storm could even reach G5 levels, the extreme category responsible for the spectacular auroral activity seen in May 2024. In fact, space weather bureaus around the world are forecasting powerful aurora conditions, with some suggesting aurora could be visible at unusually low latitudes, potentially rivaling the reach of 2024's historic superstorm. A livestream of the Northern Lights is available on YouTube. The Aurora forecast is available here.
An anonymous reader quotes a report from the Guardian: The world has entered an era of "global water bankruptcy" that is harming billions of people, a UN report has declared. The overuse and pollution of water must be tackled urgently, the report's lead author said, because no one knew when the whole system could collapse, with implications for peace and social cohesion. All life depends on water but the report found many societies had long been using water faster than it could be replenished annually in rivers and soils, as well as over-exploiting or destroying long-term stores of water in aquifers and wetlands. This had led to water bankruptcy, the report said, with many human water systems past the point at which they could be restored to former levels. The climate crisis was exacerbating the problem by melting glaciers, which store water, and causing whiplashes between extremely dry and wet weather.
Prof Kaveh Madani, who led the report, said while not every basin and country was water bankrupt, the world was interconnected by trade and migration, and enough critical systems had crossed this threshold to fundamentally alter global water risk. The result was a world in which 75% of people lived in countries classified as water-insecure or critically water-insecure and 2 billion people lived on ground that is sinking as groundwater aquifers collapse. Conflicts over water had risen sharply since 2010, the report said, while major rivers, such as the Colorado, in the US, and the Murray-Darling system, in Australia, were failing to reach the sea, and "day zero" emergencies -- when cities run out of water, such as in Chennai, India -- were escalating. Half of the world's large lakes had shrunk since the early 1990s, the report noted. Even damp nations, such as the UK, were at risk because of reliance on imports of water-dependent food and other products. "This report tells an uncomfortable truth: many critical water systems are already bankrupt," said Madani, of the UN University's Institute for Water, Environment and Health. "It's extremely urgent [because] no one knows exactly when the whole system would collapse."
About 70% of fresh water taken by human withdrawals was used for agriculture, but Madani said: "Millions of farmers are trying to grow more food from shrinking, polluted or disappearing water sources. Water bankruptcy in India or Pakistan, for example, also means an impact on rice exports to a lot of places around the world." More than half of global food was grown in areas where water storage was declining or unstable, the report said. Madani said action to deal with water bankruptcy offered a chance to bring countries together in an increasingly fragmented world. "Water is a strategic, untapped opportunity to the world to create unity within and between nations. It is one of the very rare topics that left and right and north and south all agree on its importance." The UN report, which is based on a forthcoming paper in the peer-reviewed journal Water Resources Management, sets out how population growth, urbanization and economic growth have increased water demand for agriculture, industry, energy and cities. "These pressures have produced a global pattern that is now unmistakable," it said.
A new study from Scripps Institution of Oceanography finds that factoring ocean damage into climate economics nearly doubles the estimated global cost of climate change, adding close to $2 trillion per year from losses to fisheries, coral reefs, and coastal infrastructure. "It is the first time a social cost of carbon (SCC) assessment -- a key measure of economic harm caused by climate change -- has included damages to the ocean," reports Inside Climate News. From the report: "For decades, we've been estimating the economic cost of climate change while effectively assigning a value of zero to the ocean," said Bernardo Bastien-Olvera, who led the study during his postdoctoral fellowship at Scripps. "Ocean loss is not just an environmental issue, but a central part of the economic story of climate change."
The social cost of carbon is an accounting method for working out the monetary cost of each ton of carbon dioxide released into the atmosphere. "[It] is one of the most efficient tools we have for internalizing climate damages into economic decision-making," said Amy Campbell, a United Nations climate advisor and former British government COP negotiator. Calculations have historically been used by international organizations and state departments like the U.S. Environmental Protection Agency to assess policy proposals -- though a 2025 White House memo from the Trump administration instructed federal agencies to ignore the data during cost-benefit analyses unless required by law. "It becomes politically contentious when deciding whose damages are counted, which sectors are included and most importantly how future and retrospective harms are valued," Campbell said.
Excluding ocean harm, the social cost of carbon is $51 per ton of carbon dioxide emitted. This increases to $97.20 per ton when the ocean, which covers 70 percent of the planet, is included. In 2024, global CO2 emissions were estimated to be 41.6 billion tons, making the 91 percent cost increase significant. Using greenhouse gas emission predictions, the report estimates the annual damages to traditional markets alone will be $1.66 trillion by 2100.
NASA Data Helps Maine Oyster Farmers Choose Where to Grow
The Landsat satellites are helping oyster farmers in Maine see which coves run warmer or cooler from space.
Credits: NASA/Ross Walter and Allison Nussbaum
When oyster farmer Luke Saindon went looking for a place to grow shellfish in Maine, he knew that picking the wrong patch of water could sink the farm before it began. So Saindon did something oyster farmers couldn’t have done a generation ago: He used NASA satellite data to view the coastline from space.
“Starting a farm is a big venture,” said Saindon, the director for The World Is Your Oyster farm in Wiscasset, Maine. “If you choose the wrong spot, you can blow through a lot of money without ever bringing oysters to market.”
NASA satellites had been passing over these waters for years, recording temperatures and other conditions. Using a site-selection tool created by University of Maine researchers, Saindon examined satellite maps showing where water temperatures and food levels might be best for growing oysters. The maps pointed him toward a wide, shallow bay near his home. Four years later, the farm is still there — and the oysters are thriving.
Luke Saindon, director of The World Is Your Oyster farm in Wiscasset, Maine, checks oyster cages on the farm’s floating platform.
Saindon believes that using the satellite data to select his oyster farm site resulted in faster-than-average growth rates.
“This is an example of how NASA’s Earth science program supports our nation,” said Chris Neigh, the Landsat 8 and 9 project scientist at NASA’s Goddard Space Flight Center in Greenbelt, Maryland. “We collect global data, but its value grows when it’s used locally to help communities work smarter and make their livelihoods more sustainable.”
From orbit to oyster
That same satellite-based approach is now the foundation of a study published Jan. 15 in the journal Aquaculture. Led by University of Maine scientists Thomas Kiffney and Damian Brady, the research demonstrates how temperature data from Landsat — the joint NASA and U.S. Geological Survey mission — combined with European Sentinel-2 satellite estimates of oyster food availability, namely plankton, can predict how quickly eastern oysters (Crassostrea virginica) reach market size.
The team built a satellite data–driven model of how oysters divide their energy among growth, survival, and reproduction. Feed the model sea surface temperature and satellite estimates of chlorophyll and particulate organic matter — signals of how much plankton and other edible particles are in the water — and it predicts how fast oysters will grow, a big step beyond just spotting good or bad sites for farms.
“By showing where oysters grow faster, the model can help farmers plan ahead,” Kiffney said. “That could mean better decisions about when to seed, when to harvest, and how much product to expect, all of which reduces financial risk.”
That kind of insight is increasingly valuable in Maine, where oyster farming has grown rapidly over the last decade. From 2011 to 2021, the industry’s value increased 78%, rising from about $2.5 million to more than $10 million. As the sector scales up, understanding the finer details of Maine’s coastal waters has become essential — and that’s where NASA satellites come in.
The stakes are considerable. “It takes two to three years of scoping in order to get your permit to grow, and then it can take two years for those oysters to reach market,” Brady said. “So if you’ve chosen the wrong site, you’re four years in the hole right off the bat.”
Sharper eyes on coast
Maine’s coastline measures about 3,400 miles (5,500 kilometers) if you follow the tide line. It is a coast of drowned valleys and glacier-scoured granite. Water depth, temperature, and circulation can shift dramatically within a few miles. This complexity makes oyster site selection notoriously difficult, and some satellites that see the coast in broad strokes miss the small, patchy places where oysters live.
“What makes Landsat so powerful for aquaculture is its ability to see finer-scale patterns along the coast,” where farmers put oyster cages in the water, Neigh said.
This false-color image from Landsat 9’s Thermal Infrared Sensor, acquired Oct. 11, 2025, shows the thermal signature of waters off the coast of Maine — revealing finer-scale temperature differences between neighboring coves. Cooler waters appear purple and blue, while warmer water shows up in orange and yellow.
NASA/Ross Walter and Allison Nussbaum
Landsat 8 and 9’s pixels — 98 to 328 feet (30 to 100 meters) across — are able to distinguish more subtle temperature differences between neighboring coves. For a cold-blooded oyster, those distinctions can translate into months of growth. Warm water accelerates feeding and shell development. Cold water slows both.
A challenge for satellites is clouds. Maine’s sky is frequently overcast, and together Landsat 8 and 9 pass over any given point only every eight days. To work around this, the research team analyzed 10 years of Landsat data (2013–2023) and built seasonal “climatologies,” or average temperature patterns for every 98-foot (30-meter) pixel along the coast. Sentinel-2 imagery added estimates of chlorophyll and particulate organic matter, the drifting microscopic food that oysters pull from the water column with rhythmic contractions of their gills.
Field tests at multiple sites showed the technique’s accuracy. “We validated the model against seven years of field data,” Brady said. “It’s a strong indication that these remotely sensed products can inform not just where to grow, but how long it will take to harvest.”
Turning satellite science into tools for growers
The University of Maine team is now developing an online tool to put this model into practice. A grower will be able to click on a coastal location and receive an estimate for time-to-market.
The researchers also assist with workshops through Maine’s Aquaculture in Shared Waters program, teaching farmers how to interpret temperature and water clarity data and apply them to their own sites.
Monique Boutin, an aquaculture technician with The World Is Your Oyster farm, sorts oysters during harvest work on the water in Maine.
For farmers like Saindon, that translates into something simpler: confidence and efficiency. “Having these kinds of tools lowers the barrier for new people to get into aquaculture,” he said. “It gives you peace of mind that you’re not just guessing.”
The Maine project is helping pave the way for other NASA missions. The PACE satellite (Plankton, Aerosol, Cloud, ocean Ecosystem) launched in 2024 and is now delivering hyperspectral observations of coastal waters. Where earlier sensors could estimate how much plankton was present, PACE can begin to identify the different plankton species themselves. For oysters, mussels, and other filter feeders, that specificity matters. Not all plankton are equal food: Different kinds offer different nutrition, and some plankton are harmful to oysters.
A next step will be turning that richer picture of coastal life into forecasts people working on the water can use, helping farmers trade some of the coast’s mystery for evidence they can apply to their harvest.
By Emily DeMarco
NASA’s Goddard Space Flight Center, Greenbelt, Md.
Coal power generation fell in China and India for the first time since the 1970s last year, in a "historic" moment that could bring a decline in global emissions, according to analysis. From a report: The simultaneous fall in coal-powered electricity in the world's biggest coal-consuming countries had not happened since 1973, according to analysts at the Centre for Research on Energy and Clean Air, and was driven by a record roll-out of clean energy projects.
The research, commissioned by the climate news website Carbon Brief, found that electricity generated by coal plants fell by 1.6% in China and by 3% in India last year, after the boom in clean energy across both countries was more than enough to meet their rising demand for energy. China added more than 300GW of solar power and 100GW of wind power last year -- together, more than five times the UK's total existing power generation capacity -- which are both "clear new records for China and, therefore, for any country ever," the report said. India added 35GW of solar, 6GW of wind and 3.5GW of hydropower last year, according to the analysis.
The New York–Newark–Jersey City Metropolitan Statistical Area, which spans 23 counties across New York, New Jersey, and Connecticut and has a population of about 19.9 million, is pictured at approximately 3:29 a.m. local time Dec. 20, 2025, from the International Space Station as it orbited 262 miles above the Atlantic coast.
Crew members aboard the orbital lab have produced hundreds of thousands of images of the land, oceans, and atmosphere of Earth, and even of the Moon through Crew Earth Observations. Their photographs of Earth record how the planet changes over time due to human activity and natural events. This allows scientists to monitor disasters and direct response on the ground and study a number of phenomena, from the movement of glaciers to urban wildlife.
The electric vehicle revolution has created market forces to drive all sorts of innovations. Battery technology has progressed at a rapid pace, and engineers have developed ways to charge vehicles at ever more breakneck rates. Similarly, electric motors have become more powerful and more compact, delivering greater performance than ever before.
In the latter case, while modern EV motors are very capable things, they’re also reliant on materials that are increasingly hard to come by. Most specifically, it’s the rare earth materials that make their magnets so good. The vast majority of these minerals come from China, with trade woes and geopolitics making it difficult to get them at any sort of reasonable price. Thus has sprung up a new market force, pushing engineers to search for new ways to make their motors compact, efficient, and powerful.
Rare
Many of us first came across neodymium magnets as a simple curiosity. Credit: XRDoDRX, CC BY-SA 3.0
Rare earth materials have become a hot button issue in recent decades, and they’ve also become a familiar part of our lives. If you remember playing with some curiously powerful magnets at some point, you’ve come across neodymium—a rare earth material of wide application. The element is alloyed with iron and boron to produce some of the strongest magnets readily available on the commercial market. You’ll find them in everything from hard drives to EV motors, and stuck to a great many fridges, where they’re quite hard to peel off. At times, neodymium is also alloyed with other rare earths, like terbium and dysprosium, which can help create powerful magnets that are able to resist higher temperatures without failure.
We come across these magnets all the time, so they might not feel particularly rare. Indeed, the rare earth elements—of which there are 17 in total—are actually fairly abundant in the Earth’s crust. The problem is that they are thinly spread, often only found as trace elements rather than in rich ore deposits that are economical to mine. Producing any useful amount of rare earth materials tends to require processing a great deal of raw material at significant cost. As it stands, China has gained somewhat of a monopoly on rare earths, controlling up to 92% of global processing capability and 60 to 70% of mining capacity. In happier times, this wouldn’t be such a problem. Sadly, with the extended battles being fought over global trade at the moment, it’s making access to rare earths both difficult and expensive.
This has become a particular problem for automotive manufacturers. It’s no good to design a wonderful motor that needs lots of fancy rare earth magnets, only to find out a year later that they’re no longer available and that production must shut down. Thus, there is a serious desire on the part of major automakers to produce high-performance motors that don’t require such fancy, hard-to-come-by materials. Even if they come with a small cost penalty in materials or manufacturing, they could save huge sums of money if they avoid a production shutdown at some point in the future. Large manufacturing operations are slow, lumbering things that need to run on long timescales to operate economically, and they can easily be derailed by supply disruptions. Securing a solid motor supply is thus key to companies looking to build EVs en masse in the immediate future.
BMW’s new EV motors use electrically-excited coils in the rotor to generate the necessary magnetic field, instead of rare-earth magnets. Credit: BMW
BMW has, to a degree, solved the problem by making different kinds of motors. Rather than trying to find other ways to make powerful magnets, the German automaker put engineering efforts into developing highly-efficient motors that generate their own magnetic fields via electricity. Instead of using permanent magnets on the rotor, they use coils, which are electrically excited to generate a comparable magnetic field. Thus, rare earth magnets are replaced with coil windings, which are much easier to source. These motors are referred to as Electrically Excited Synchronous Motors (EESM), and are distinct from traditional induction motors as they are creating a magnetic field in the rotor via supplied electric current rather than via induction.
This method of construction does come with some trade offs, of course, such as heat generated by the rotor coils, and the need for slip rings or brushes to transfer power to the coils on the rotor. However, they manage to neatly sidestep the need for rare earth materials entirely. They are also more controllable. Since it’s possible to vary the magnetic field in the rotor as needed, this can be used to make efficiency gains in low-load situations. They’re also less susceptible to damage from overtemperature that could completely destroy the magnets in a permanent magnet motor.
ZF is one of a number of motor manufacturers that has developed a range of EESM motors. Note the coils in the rotor where the permanent magnets would usually go. Credit: ZF
BMW was inspired to take this route because of a spike in neodymium prices well over a decade ago. Today, that decision is bearing fruit—with the company less fearful of supply chain issues and production line stoppages due to some pesky magnets. You’ll find EESM motors in a range of BMW products, from the iX1 to the i7, and even the compact CE 02 scooter. The company’s next generation of electric models will largely use EESM motors for rear-wheel-drive models, while using asynchronous motors up front to add all-wheel-drive to select models. The German automaker is not the only player in this space, either. A range of third-party motor manufacturers have gotten on board the EESM train, as well as other automakers like Nissan and Renault.
Nissan has similarly gotten onboard with EESM technology. Note the contact surfaces for the brushes used to deliver electricity to the coils in the motor.
Don’t expect every automaker to rush into this technology overnight. Retooling production lines to make different types of motors takes time, to say nothing of the supporting engineering required to control the motors and integrate them into vehicle designs. Many automakers will persevere with permanent magnet motors, doing what they can to secure rare earth supplies and shore up their supply chains. However, if the rare earth crisis drags on much longer, expect to see ever more reliance on new motor designs that don’t need rare earth magnets at all.
The U.S. Geological Survey, in cooperation with NASA, has named the new Landsat Science Team that will support the world’s longest-running Earth observation mission for a planned 2026-2030 term.
The team brings together experts from universities, private industry, and federal and international agencies to help the U.S. Geological Survey (USGS) and NASA ensure Landsat continues delivering trusted, publicly available data that supports disaster response, agricultural management, water resources, land stewardship, and national security.
Science Focus Areas of the New Landsat Science Team (2026–2030)
The Landsat Science Team supports the USGS and NASA in maintaining scientific integrity, data quality, and mission continuity across the Landsat program. Their work informs mission planning and development and helps maximize the value of the Landsat archive through improved data products, expanded applications and strategic insight that helps the Landsat program continue to serve the public effectively.
The Landsat Science Team will provide collective analysis and advice on a range of priority issues as defined by the USGS and NASA. In addition, each team member will lead research on a variety of topical areas deemed to be of interest to the Landsat program.
Research areas include atmospheric correction and calibration methods to ensure consistent reflectance across the Landsat archive. Team members will also look at improving data processing pipelines and interoperability with international satellite systems to support integrated Earth observations. Several studies are focused on land-surface processes, including crop condition, evapotranspiration, soil and residue detection, and non-photosynthetic vegetation, which support agricultural monitoring and conservation.
Water cycle and aquatic focused research includes inland and coastal water-quality mapping, harmful algal bloom detection, and refined snow cover characterization. Additional studies address fire monitoring, volcanic activity, and geothermal systems. Other work is centered on developing tools that help translate Landsat data into actionable products for science, management, and policy.
The Landsat Science Team members and their planned research:
Atmospheric Correction and Calibration
Pathfinding the steps to ensure global analysis ready consistent reflectance from the Landsat MSS to Landsat Next era
Dr. David Roy (PI), Michigan State University
Dr. Hankui K. Zhang, South Dakota State University
Dr. Lin Yan, Michigan State University
Fully probabilistic atmospheric correction for Landsat
Dr. Nimrod Carmon (PI), University of California, Los Angeles
Dr. Gregory Okin, University of California, Los Angeles
Maintenance and Refinement of the Land Surface Reflectance Code (LaSRC) for Landsat and Sentinel 2
Dr. Eric Vermote (PI), NASA Goddard Space Flight Center
Towards a harmonized atmospheric correction for EnMAP, CHIME, Landsat archive, and Landsat Next observables
Dr. Raquel De Los Reyes (PI), The German Aerospace Center (DLR)
Interoperability and Data Processing
Synergistic data processing pipelines for Landsat and European satellite missions
Dr. David Frantz (PI), Trier University
Dr. Patrick Hostert, Humboldt University of Berlin
Dr. Sebastian van der Linden, University of Greifswald
Dr. Dirk Pflugmacher, Humboldt University of Berlin
Dr. Cornelius Senf, Technical University of Munich
Stronger together – next generation interoperability for Landsat and Copernicus
Dr. Peter Strobl (PI), European Commission
Maximizing the impact of interoperable Landsat Analysis-Ready Surface Reflectance for Operational Land, Water and Antarctic Monitoring
Medhavy Thankappan (PI), Geoscience Australia
Dr. Kimberlee Baldry, Geoscience Australia
Dr. Courtney Bright, Commonwealth Scientific and Industrial Research Organisation (CSIRO)
Agriculture, Vegetation, and Land Surface Processes
Developing non-photosynthetic vegetation cover capabilities for Landsat Next
Dr. Phillip Dennison (Co-PI), University of Utah
Dr Michael Campbell (Co-PI), University of Utah
Improving and synergizing Landsat evapotranspiration and albedo using multi-satellite observations
Dr. Yun Yang (PI), Cornell University
Dr. Zhuosen Wang, University of Maryland
OpenET: Supporting US sustainable water management with Landsat
Dr. Forrest Melton (PI), NASA Earth Science Division
From leaf to Landsat: A multi-scale approach to developing information for agricultural management from Landsat Next
Dr. Kyle Kipper (PI), USDA Agriculture Research Service
Dr. Martha Anderson, USDA Agriculture Research Service
Measuring Agricultural Conservation Land Cover with Next Generation Earth Observation: Detecting Green Vegetation, Crop Residue, and Soil in the Context of Surface Moisture Variability
Dr. Dean Hively (PI), USGS Lower Mississippi Water Science Center
Tracking Crop Growth and Condition in Near Real-time Using Harmonized Landsat and Sentinel-2 Data
Dr. Feng Gao (PI), USDA Agriculture Research Service
Water, Snow, and Aquatic Systems
Harmonizing inland and coastal water quality monitoring from the Landsat Program: Harmful algal blooms
Dr. Ryan O’Shea (PI), Science Systems and Applications, Inc
Next generation snow cover mapping and establishment of a long-term ground validation site
Dr. Edward Bair (PI), Leidos, Inc.
Fire and Disturbance
Advancing fire monitoring with Landsat Next and Canada’s WildFireSat
Dr. Morgan Crowley (PI), Canadian Forest Service
Volcanoes and Geothermal Systems
Characterizing/monitoring active volcanoes and geothermal systems with Landsat
Dr. Greg Vaughan (PI), USGS Astrogeology Science Center
Science Applications and User Engagement
From pixels to products to policy: Creating and sharing information to advance science and applications with Landsat
Artemis II NASA astronauts (left to right) Reid Wiseman, Victor Glover, and Christina Koch, and CSA (Canadian Space Agency) astronaut Jeremy Hansen stand in the white room on the crew access arm of the mobile launcher at Launch Pad 39B as part of an integrated ground systems test at the agency’s Kennedy Space Center in Florida on Sept. 20, 2023.
Credit: NASA/Frank Michaux
With a second Trump Administration at the helm in 2025, NASA marked significant progress toward the Artemis II test flight early next year, which is the first crewed mission around the Moon in more than 50 years, as well as built upon its momentum toward a human return to the lunar surface in preparation to send the first astronauts — Americans — to Mars.
As part of the agency’s Golden Age of innovation and exploration, NASA and its partners landed two robotic science missions on the Moon; garnered more signatories for the Artemis Accords with 59 nations now agreeing to safe, transparent, and responsible lunar exploration; as well as advanced a variety of medical and technological experiments for long-duration space missions like hand-held X-ray equipment and navigation capabilities.
NASA also led a variety of science discoveries, including launching a joint satellite mission with India to regularly monitor Earth’s land and ice-covered surfaces, as well as identifying and tracking the third interstellar object in our solar system; achieved 25 continuous years of human presence aboard the International Space Station; and, for the first time, flew a test flight of the agency’s X-59 supersonic plane that will help revolutionize air travel.
Sean Duffy, named by President Trump, is serving as the acting administrator while NASA awaits confirmation of Jared Isaacman to lead the agency. Isaacman’s nomination hearing took place in early December, and his nomination was passed out of committee with bipartisan support. The full Senate will consider Isaacman’s nomination soon. President Trump also nominated Matt Anderson to serve as deputy administrator, and Greg Autry to serve as chief financial officer, both of whom are awaiting confirmation hearings. NASA named Amit Kshatriya to associate administrator, the agency’s highest-ranking civil servant position.
Key accomplishments by NASA in 2025 include:
Astronauts exploring Moon, Mars is on horizon
Under Artemis, NASA will send astronauts on increasingly difficult missions to explore more of the Moon for scientific discovery, economic benefits, and to build upon our foundation for the first crewed mission to Mars. The Artemis II test flight is the first flight with crew under NASA’s Artemis campaign and is slated to launch in early 2026. The mission will help confirm systems and hardware for future lunar missions, including Artemis III’s astronaut lunar landing.
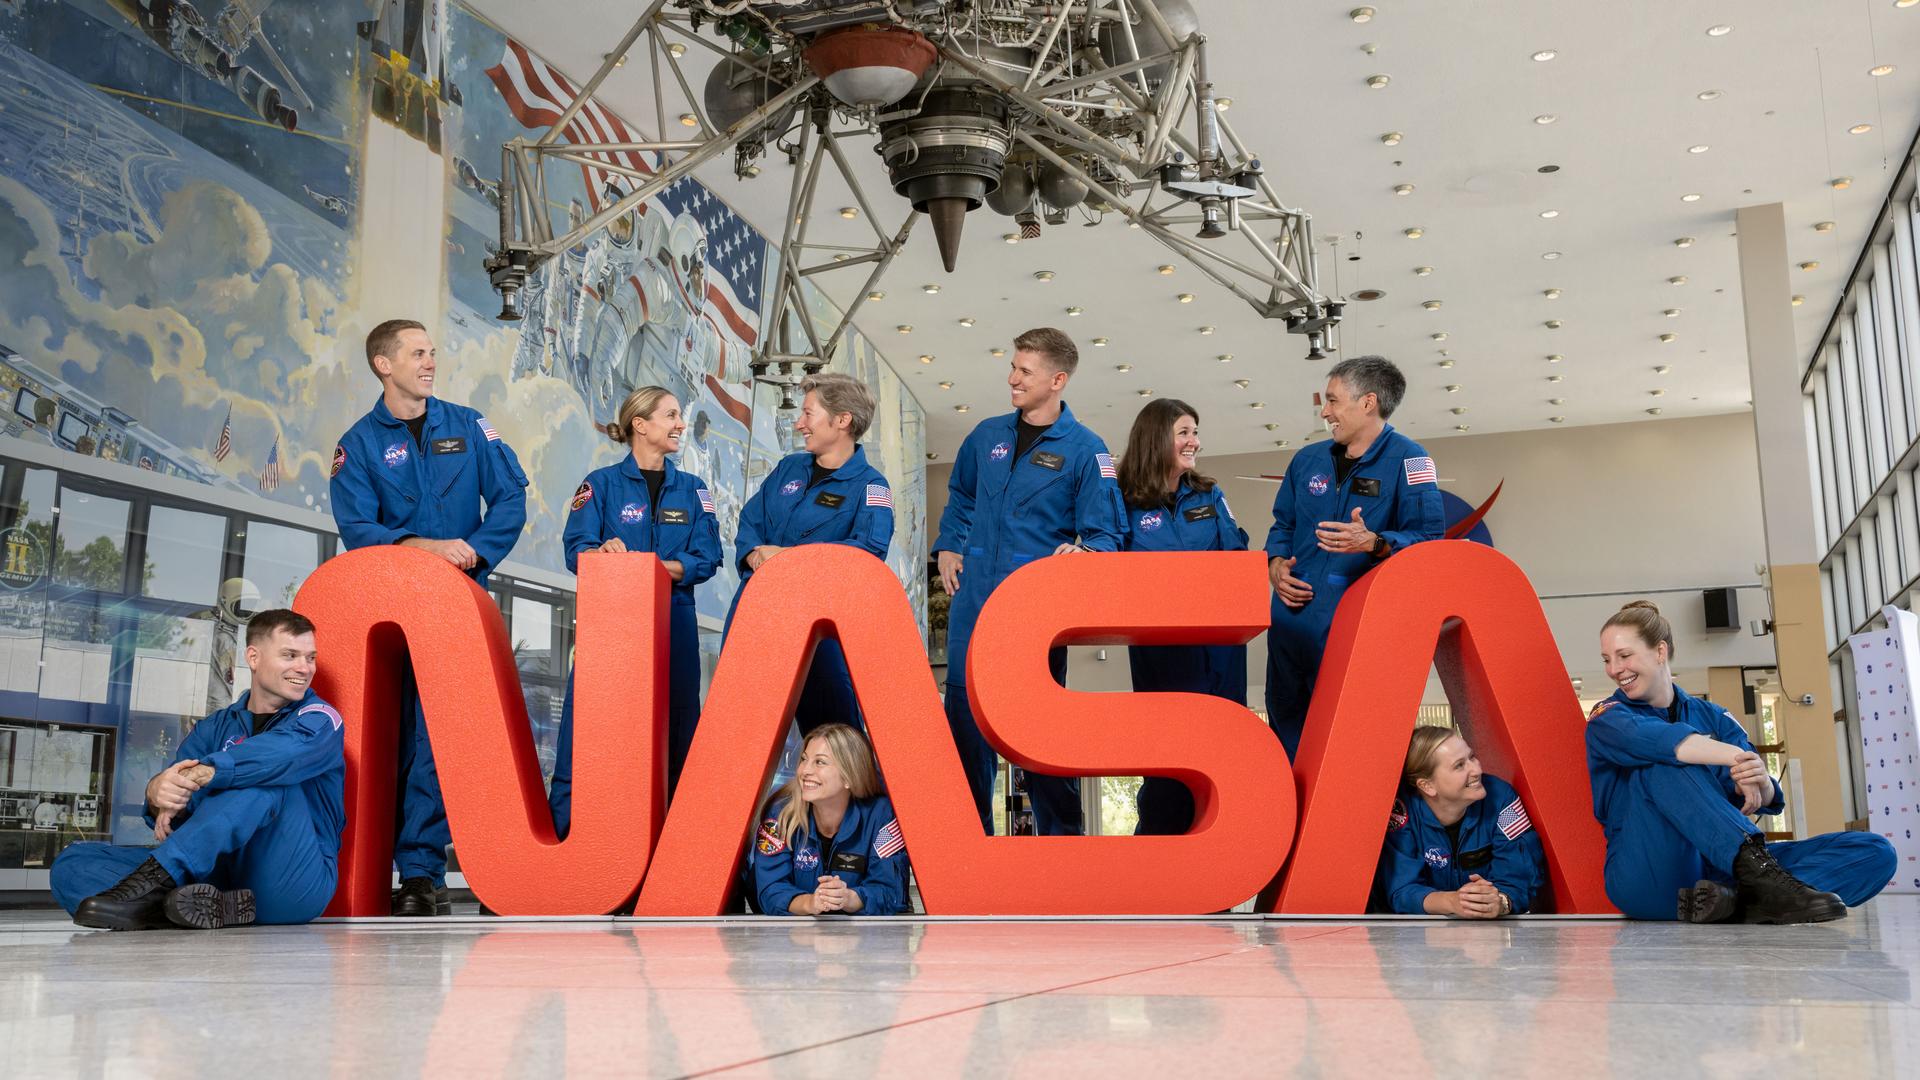
NASA also introduced 10 new astronaut candidates in September, selected from more than 8,000 applicants. The class is undertaking nearly two years of training for future missions to low Earth orbit, the Moon, and Mars.
Progress to send the first crews around the Moon and on the lunar surface under Artemis includes:
NASA completed stacking of its Space Launch System rocket and Orion spacecraft for Artemis II. Teams integrated elements manufactured across the country at NASA’s Kennedy Space Center in Florida, including the rocket’s boosters and core stage, as well as Orion’s stage adapter and launch abort system, to name a few.
Ahead of America’s 250th birthday next year, the SLS rocket’s twin-pair of solid rocket boosters showcases the America 250 emblem.
The Artemis II crew participated in more than 30 mission simulations alongside teams on the ground, ensuring the crew and launch, flight, and recovery teams are prepared for any situation that may arise during the test flight. Soon, crew will don their survival suits and get strapped into Orion during a countdown demonstration test, serving as a dress rehearsal for launch day.
The agency worked with the Department of War to conduct a week-long underway recovery test in preparation to safely collect the Artemis II astronauts after they splashdown following their mission.
To support later missions, teams conducted a booster firing test for future rocket generations, verified new RS-25 engines, test-fired a new hybrid rocket motor to help engineering teams better understand the physics of rocket exhaust and lunar landers, as well using various mockups to test landing capabilities in various lighting conditions. Teams also conducted human-in-the-loop testing in Japan with JAXA (Japan Aerospace Exploration Agency) with a rover mockup from their agency.
NASA also continued work with Axiom Space, to develop and test the company’s spacesuit, including completing a test run at the Neutral Buoyancy Laboratory at NASA Johnson ahead of using the suit for Artemis training. The spacesuit will be worn by Artemis astronauts during the Artemis III mission to the lunar South Pole.
On the Moon, future crew will use a lunar terrain vehicle, or LTV, to travel away from their landing zone. NASA previously awarded three companies feasibility studies for developing LTV, followed by a request for proposals earlier this year. The agency is expected to make an award soon to develop, deliver, and demonstrate LTV on the lunar surface later this decade. The agency also selected two science instruments that will be included on the LTV to study the Moon’s surface composition and scout for potential resources.
For operations around the Moon, NASA and its partners continued to develop Gateway to support missions between lunar orbit and the Moon’s surface. Construction and production of the first two elements, a power and propulsion system and habitation element, each progressed, as did development and testing of potential science and technology demonstrations operated from Gateway. International partners also continued work that may contribute technology to support those elements, as well as additional habitation capabilities and an airlock.
This past year, NASA’s Lunar Surface Innovation Consortium team collaborated with over 3,900 members from academia, industry, and government on key lunar surface capabilities. Members from across the U.S. and 71 countries participated in two biannual meetings, three lunar surface workshops, and monthly topic meetings, resulting in 10 studies, four reports, and nine conference presentations.
Building on previous missions and planning for the future, NASA will conduct more science and technology demonstrations on and around the Moon than ever before. Work toward effort included:
Selected a suite of science studies for the Artemis II mission, including studies that focus on astronauts’ health.
Launched two CLPS (Commercial Lunar Payload Services) flights with NASA as a key customer, including Firefly’s Blue Ghost Mission One, which landed on the Moon March 2, and Intuitive Machines’ Nova C lunar lander, which touched down on March 6.
Experiments and tech demos aboard these flights included an electrodynamic dust shield, lunar navigation system, high-performance computing, collection of more than 9,000 first-of-a-kind images of the lunar lander’s engine plumes, and more.
For future CLPS flights, NASA awarded Blue Origin a task order with an option to deliver the agency’s VIPER (Volatiles Investigating Polar Exploration Rover) to the lunar South Pole in late 2027, as well as awarded Firefly another flight, slated for 2030.
Teams studied regolith (lunar dirt and rocks) in a simulated lunar gravity environment and tested how solid materials catch fire in space.
The agency’s 55-pound CubeSat in lunar orbit, CAPSTONE, exceeded 1,000 days in space, serving as a testbed for autonomous navigation and in-space communications.
Published findings from this Artemis I experiment highlighting why green algae may be a very good deep space travel companion.
NASA announced its 2025 Astronaut Candidate Class on Sept. 22, 2025. The 10 candidates, pictured here at NASA’s Johnson Space Center in Houston are: U.S. Army CW3 Ben Bailey, Anna Menon, Rebecca Lawler, Katherine Spies, U.S. Air Force Maj. Cameron Jones, Dr. Lauren Edgar, U.S. Navy Lt. Cmdr. Erin Overcash, Yuri Kubo, Dr. Imelda Muller, and U.S. Air Force Maj. Adam Fuhrmann.
Credit: NASA/Josh Valcarcel
Technological and scientific steps toward humanity’s next giant leap on the Red Planet include:
Launched a pair of spacecraft, known as ESCAPADE, on a mission to Mars, arriving in September 2027, to study how its magnetic environment is impacted by the Sun. This data will better inform our understanding of space weather, which is important to help minimize the effects of radiation for future missions with crew.
NASA announced Steve Sinacore, from the agency’s Glenn Research Center in Cleveland, to lead the nation’s fission surface power efforts.
Selected participants for a second yearlong ground-based simulation of a human mission to Mars, which began in October, as well as tested a new deep space inflatable habitat concept.
Completed the agency’s Deep Space Optical Communications experiment, which exceeded all of its technical goals after two years. This type of laser communications has the potential to support high-bandwidth connections for long duration crewed missions in deep space.
NASA completed its fourth Entry Descent and Landing technology test in three months, accelerating innovation to achieve precision landings on Mars’ thin atmosphere and rugged terrain.
Through the Artemis Accords, seven new nations have joined the United States, led by NASA and the U.S. Department of State, in a voluntary commitment to the safe, transparent, and responsible exploration of the Moon, Mars, and beyond. With nearly 60 signatories, more countries are expected to sign in the coming months and years.
A NASA delegation participated in the 76th International Astronautical Congress in Sydney, Australia. During the congress, NASA co-chaired the Artemis Accords Principals’ Meeting, bringing together dozens of nations furthering discussions on their implementation.
Finally, NASA engaged the public to join its missions to the Moon and Mars through a variety of activities. The agency sought names from people around the world to fly their name on a SD card aboard Orion during the Artemis II mission. NASA also sponsored a global challenge to design the spacecraft’s zero gravity indicator, announcing 25 finalists this year for the mascot design. Artemis II crew members are expected to announce a winner soon.
NASA’s gold standard science benefits humanity
In addition to conducting science at the Moon and Mars to further human exploration in the solar system, the agency continues its quest in the search for life, and its scientific work defends the planet from asteroids, advances wildfire monitoring from its satellites, studies the Sun, and more.
Garnering significant interest this year, NASA has coordinated a solar system-wide observation campaign to follow comet 3I/ATLAS, the third known interstellar object to pass through our solar system. To date, 12 NASA spacecraft and space-based telescopes have captured and processed imagery of the comet since its discovery in the summer.
Astrobiology
A Perseverance sample found on Mars potentially contain biosignatures, a substance or structure that might have a biological origin but requires additional data and studying before any conclusions can be reached about the absence or presence of life.
Samples from asteroid Bennu revealed sugars, amino acids, and other life-building molecules.
Planetary Defense
In defense of Earth and protecting humanity, NASA has continued to monitor a near-Earth object that triggered potential impact notifications.
Scientists have worked to calculate more precise impact models, noting the asteroid, which poses no significant threat to Earth, has only a 0.0004% chance of hitting our planet. An international satellite determined NASA’s DART (Double Asteroid Redirect Test) released 35.5 million pounds of dust and rock from the mission’s impact in 2022.
In addition to launching the NISAR mission, here are other key science moments:
Completion of NASA’s next flagship observatory, the Nancy Grace Roman Space Telescope, is done, with final testing underway. The telescope will help answer questions about dark energy and exoplanets and will be ready to launch as early as fall of 2026.
The agency’s newest operating flagship telescope, James Webb Space Telescope, now in its third year, continued to transform our understanding of the universe, and Hubble celebrated its 35th year with a 2.5-gigapixel Andromeda galaxy mosaic.
Juno found a massive, hyper-energetic volcano on Jupiter’s moon Io.
NASA’s Parker Solar Probe team shared new images of the Sun’s atmosphere, taken closer to the star than ever captured before.
Lucy completed a successful rehearsal flyby of the asteroid Donaldjohanson.
NASA space telescopes including Chandra X-ray Observatory, IXPE, Fermi, Swift, and NuSTAR continued to reveal secrets in the universe from record-setting black holes to the first observations of the cosmos’ most magnetic objects.
NASA’s ESCAPADE (Escape and Plasma Acceleration and Dynamics Explorers) mission launched on Nov. 13, 2025, atop a Blue Origin New Glenn rocket at Launch Complex 36 at Cape Canaveral Space Force Station.
Credit: Blue Origin
25 years of continuous presence in low Earth orbit
In 2025, the International Space Station celebrated 25 years of continuous human presence, a milestone achievement underscoring its role as a beacon of global cooperation in space. The orbital laboratory supported thousands of hours of groundbreaking research in microgravity in 2025, advancing commercial space development and preparing for future human exploration of the Moon and Mars.
For the first time, all eight docking ports were occupied by visiting spacecraft to close out the year, demonstrating the strength of NASA’s commercial and international partnerships. Twenty-five people from six countries lived and worked aboard the station this year. In all, 12 spacecraft visited the space station in 2025, including seven cargo missions delivering more than 50,000 pounds of science, tools, and critical supplies to the orbital complex.
Research aboard the International Space Station continues to benefit life on Earth and support deep space exploration.
Several studies with Crew-10 and Crew 11 aimed at understanding how the human body adapts to spaceflight, including a new study to assess astronauts’ performance, decision making, and piloting capabilities during simulated lunar landings.
In September, the U.S. Food and Drug Administration approved an early-stage cancer treatment, supported by research aboard the space station, that could reduce costs and shorten treatment times for patients.
Scientists also published findings in peer-reviewed journals on topics such as astronaut piloting performance after long missions, the use of biologically derived materials to shield against space radiation, robotic telesurgery in space, and how spaceflight affects stem cells, all advancing our understanding of human physiology in space and on Earth.
Researchers 3D-printed medical implants with potential to support nerve repair; advanced work toward large-scale, in-space semiconductor manufacturing; and researched the production of medical components with increased stability and biocompatibility that could improve medication delivery.
Additional notable space operations accomplishments included:
NASA’s SpaceX Crew-9 astronauts Nick Hague, Suni Williams, and Butch Wilmore returned in March after a long-duration mission, including more than eight months for Williams and Wilmore. The trio completed more than 150 scientific experiments and 900 hours of research during the stay aboard the orbiting laboratory. Williams also conducted two spacewalks, setting a new female spacewalking record with 62 hours, 6 minutes, and ranking her fourth all-time in spacewalk duration.
NASA astronaut Don Pettit returned in April with Roscosmos cosmonauts Alexey Ovchinin and Ivan Vagner, concluding a seven-month mission. Pettit, who turned 70 the day of his return, completed 400 hours of research during his flight, and has now logged 590 days in space across four missions.
SpaceX Dragon cargo missions 32 and 33 launched in April and August, delivering more than 11,700 pounds of cargo, while SpaceX 33 tested a new capability to help maintain the altitude of station.
Axiom Mission 4, the fourth private astronaut mission to the space station, concluded in July, furthering NASA’s efforts to support and advance commercial operations in low Earth orbit.
NASA SpaceX Crew-11 mission launched in August with NASA astronauts Zena Cardman and Mike Fincke, JAXA (Japan Aerospace Exploration Agency) astronaut Kimiya Yui, and Roscosmos cosmonaut Oleg Platonov aboard. The crew remains aboard the space station where they are conducting long-duration research to support deep space exploration and benefit life on Earth.
NASA’s SpaceX Crew-10 mission completed more than 600 hours of research before returning in August, when they became the first crewed SpaceX mission for NASA to splash down in the Pacific Ocean.
In September, the first Northrop Grumman Cygnus XL spacecraft arrived, delivering more than 11,000 pounds of cargo, including research supporting Artemis and Mars exploration.
NASA Glenn researchers tested handheld X-ray devices that could help astronauts quickly check for injuries or equipment problems during future space missions.
For nearly six years, NASA’s BioNutrients project has studied how to produce essential nutrients to support astronaut health during deep space missions, where food and vitamins have limited shelf lives. With its third experiment now aboard the International Space Station, the research continues to advance preparations for long-duration spaceflight.
NASA astronaut Chris Williams arrived with Roscosmos cosmonauts Sergey Kud-Sverchkov and Sergei Mikaev for an eight-month science mission aboard the station. Following their arrival, NASA astronaut Jonny Kim returned home, concluding his own eight-month mission.
NASA has worked with commercial companies to advance development of privately owned and operated space stations in low Earth orbit from which the agency, along with other customers, can purchase services and stimulate the growth of commercial activities in microgravity. This work is done in advance of the International Space Station’s retirement in 2030.
Among the many achievements made by our partners, recent advancements include:
Axiom Space has completed critical design review, machining activities, and the final welds, moving to testing for the primary structure of Axiom Station’s first module.
Completed testing of the trace contaminant control system for Vast’s Haven-1 space station using facilities at NASA Marshall, confirming the system can maintain a safe and healthy atmosphere.
Blue Origin’s Orbital Reef completed a human-in-the-loop testing milestone using individual participants or small groups to perform day-in-the-life walkthroughs in life-sized mockups of major station components.
The agency also continues to support the design and development of space stations and technologies through agreements with Northrop Grumman, Sierra Space, SpaceX, Special Aerospace Services, and ThinkOrbital.
On Nov. 2, 2025, the International Space Station celebrated 25 years of continuous human presence. Here, clouds swirl over the Gulf of Alaska and underneath the aurora borealis blanketing Earth’s horizon in this photograph from the space station as it orbited 261 miles above on March 12, 2025.
Credit: NASA
Pioneering aviation research
This year saw a major triumph for NASA’s aviation researchers, as its X-59 one-of-a-kind quiet supersonic aircraft made its historic first flight Oct 28. NASA test pilot Nils Larson flew the X-59 for 67 minutes up to an altitude of about 12,000 feet and an approximate top speed of 230 mph, precisely as planned. The flight capped off a year of engine testing including afterburner testing, taxi testing, and simulated flights from the ground — all to make sure first flight went safely and smoothly. The X-59 team will now focus on preparing for a series of flight tests where the aircraft will operate at higher altitudes and supersonic speeds. This flight test phase will ensure the X-59 meets performance and safety expectations. NASA’s Quesst mission also began testing the technologies that they will use to measure the X-59’s unique shock waves and study its acoustics during future mission phases.
Researchers also made other major strides to further aviation technologies that will benefit the public and first responders, including live flight testing of a new portable airspace management system with the potential to greatly improve air traffic awareness during wildland fire operations.
During the past year, the agency’s aeronautics researchers also:
Conducted live flight testing with aircraft performing simulated wildland fire response using NASA’s new portable airspace management system known as Advanced Capabilities for Emergency Response Operations (ACERO) project.
Used NASA’s Transonic Dynamics Tunnel in Virginia to test the performance of rotors designed for NASA’s Dragonfly rotorcraft, which will explore Saturn’s moon, Titan.
Performed wind tunnel tests to see how icing could affect longer, thinner wings on future airliners and to evaluate a tiltwing design likely to see wide usage in advanced air mobility vehicles.
Tested NASA-designed ultralight aerogel antennas that could be embedded into aircraft skin for more aerodynamic, reliable, satellite communications.
Worked to advance the airborne transportation of people and goods, including a collaboration with the Department of War to advance capabilities for long-distance cargo drones; a partnership to test a tool for remotely piloted urban air transportation; flight tests with partners exploring large-scale drone cargo flights; and work with ResilienX to enhance preflight planning for safer future skies.
Performed research to help with the integration of air taxis and similar future aircraft, such as producing real-world data to help understand their flight dynamics; dropping a full-scale fuselage model to test its materials upon impact; collecting to evaluate strategies for urban airspace integration; investigating passenger comfort; and testing 5G-based aviation network technology to boost air taxi connectivity. Evaluated a system that would help prevent collisions between air taxis and other future aircraft in urban environments.
Made advances to unsteady pressure sensitive paint wind tunnel technology, allowing it to measure air pressure on miniature aircraft and rocket models 10,000 times faster with 1,000 times higher resolution.
Collected data on mixed reality systems that allow users to interact with physical flight simulators while wearing virtual reality headsets.
Developed the GlennICE tool for U.S. researchers and aircraft developers to integrate icing-related considerations into aircraft design.
Supported research for safer and smoother airline and airport operations, including; developing a preflight rerouting tool to actively curb commercial airline delays and save fuel; demonstrating a unique air traffic management concept for safer aircraft operate at higher altitudes; and hosting technology testing to make runway taxiing safer and more efficient.
NASA’s X-59 quiet supersonic research aircraft lifts off for its first flight on Oct. 28, 2025, from U.S. Air Force Plant 42 in Palmdale, California. The aircraft’s first flight marks the start of flight testing for NASA’s Quesst mission, the result of years of design, integration, and ground testing.
Credit: NASA/Lori Losey
Technologies that advance exploration, support growing space economies
From spinoff technologies on Earth to accelerating development of technologies in low Earth orbit and at the Moon and Mars, NASA develops, demonstrates, and transfer new space technologies that benefit the agency, private companies, and other government agencies and missions.
Accomplishments by NASA and our partners in 2025 included:
NASA and Teledyne Energy Systems Inc. demonstrated a next-generation fuel cell system aboard a Blue Origin New Shepard mission, proving it can deliver reliable power in the microgravity environment of space.
Varda Space Industries licensed cutting-edge heatshield material from NASA, allowing it to be produced commercially for the company’s capsule containing a platform to process pharmaceuticals in microgravity. Through this commercial collaboration NASA is making entry system materials more readily available to the U.S. space economy and advancing the industries that depend on it.
The maiden flight of UP Aerospace’s Spyder hypersonic launch system demonstrated the U.S. commercial space industry’s capacity to test large payloads (up to 400 pounds) at five times the speed of sound. NASA’s support of Spyder’s development helped ensure the availability of fast-turnaround, lower cost testing services for U.S. government projects focused on space exploration and national security.
The NASA Integrated Rotating Detonation Engine System completed a test series for its first rotating detonation rocket engine technology thrust chamber assembly unit.
NASA successfully completed its automated space traffic coordination objectives between the agency’s four Starling spacecraft and SpaceX’s Starlink constellation. The Starling demonstration matured autonomous decision-making capabilities for spacecraft swarms using Distributed Spacecraft Autonomy software, developed by NASA’s Ames Research Center in California’s Silicon Valley.
NASA announced an industry partnership to design the Fly Foundational Robots mission to demonstrate use of Motiv Space Systems’ robotic arm aboard a hosted orbital flight test with Astro Digital.
The third spacecraft in the R5 (Realizing Rapid, Reduced-cost high-Risk Research) demonstration series launched aboard SpaceX’s Transporter-15 mission. This series of small satellites leverage terrestrial commercial off-the-shelf hardware to enable affordable, rapid orbital flight tests of rendezvous and proximity operations payloads.
The DUPLEX CubeSat developed by CU Aerospace deployed from the International Space Station to demonstrate two commercial micro-propulsion technologies for affordable small spacecraft propulsion systems.
Harnessing NASA’s brand power in real life, online
As one of the most recognized global brands and most followed on social media, NASA amplified its reach through force-multiplying engagement activities that generate excitement and support for the agency’s missions and help foster a Golden Age of innovators and explorers.
From collaborations with sport organizations and players to partnerships with world-renowned brands, these activities provide low-cost, high-impact avenues to engage an ever-expanding audience and reinforce NASA’s position as the world’s premier space agency. Engagement highlights from 2025 include:
Second Lady Usha Vance also kicked off her summer reading challenge at NASA’s Johnson Space Center in Houston, encouraging youth to seek adventure, imagination, and discovery in books, a sentiment close to NASA and everyone the agency inspires.
Reached nearly 5 million people through participation in hybrid and in-person events across the agency, including the White House’s Summer Reading Challenge, Open Sauce 2025, the Expedition 71 and 72 postflight visits, featuring NASA astronauts recently returned from missions aboard the space station, and more.
Participated in a variety of space policy conferences to include Space Symposium and the International Aeronautical Congress highlighting America’s leadership in human exploration to the Moon and Mars, responsible exploration under the Artemis Accords, and support for the commercial space sector.
In 2025, NASA also consolidated its social media accounts to improve clarity, compliance, and strategic alignment. After streamlining the number of active accounts, the agency grew its total following on these accounts by more than eight million, reaching nearly 367 million followers.
Other digital highlights included:
In 2025, NASA expanded access to its NASA+ streaming service by launching a free, ad-supported channel on Prime Video and announcing a new partnership with Netflix to stream live programming, including rocket launches and spacewalks, making its missions more accessible to global audiences and inspiring the next generation of explorers. As of November 2025, viewers have streamed more than 7.7 million minutes of NASA content on the Prime Video FAST channel.
NASA’s SpaceX Crew-9 return from the space station drew over 2.5 million live viewers, making it the agency’s most-watched event of 2025.
NASA aired live broadcasts for 17 launches in 2025, which have a combined 3.7 million views while live. NASA’s SpaceX Crew-10 and NISAR launches have the most views on YouTube, while crewed launches (Crew-10, Crew-11, and Axiom Mission 4) were the most-viewed while the broadcast was live.
The agency’s YouTube livestreams in 2025 surpassed 18.8 million total live views. The agency’s YouTube channel has more than 50.4 million total views for the year.
The agency’s podcasts were downloaded more than 2 million times in 2025 by more than 750,000 listeners.
Increased content production nearly tenfold for its science-focused website in Spanish, Ciencia de la NASA, and grew the website’s page views by 24% and visitor numbers by 25%. NASA’s Spanish language social media accounts experienced a 17% growth in followers in 2025.
The number of subscribers to NASA’s flagship and Spanish newsletters total more than 4.6 million.
NASA earned a spot on The Webby 30, a curated list celebrating 30 companies and organizations that have shaped the digital landscape.
More than 2.9 million viewers watched 38,400 hours of NASA’s on-demand streaming service NASA+ in 2025. November marked two years since NASA+ debuted.
Premiered “Planetary Defenders,” a new documentary that follows the dedicated team behind asteroid detection and planetary defense. The film debuted at an event at the agency’s headquarters with digital creators, interagency and international partners, and now is streaming on NASA+, YouTube, and X. In its first 24 hours, it saw 25,000 views on YouTube – 75% above average – and reached 4 million impressions on X.
“Cosmic Dawn,” a feature-length documentary following the creation of the James Webb Space Telescope, was released this year. The film has been viewed 1.6 million times on the agency’s YouTube channel.
Among agency awards:
NASA’s broadcast of the April 8, 2024, total solar eclipse won multiple Emmy Awards.
Received six Webby Awards and six People’s Voice Awards across platforms — recognition of America’s excellence in digital engagement and public communication.
Proxyearth is a new site that shows names, Aadhaar numbers, and live locations of users in India using only mobile numbers, raising serious privacy and security concerns.