Every spring, raptors return to nesting sites across northern Michigan. The smallest of these birds of prey, a falcon called the American kestrel (Falco sparverius), flies through the region’s many cherry orchards and spends its days hunting for even tinier creatures to eat. This quest keeps the kestrels fed, but it also benefits the region’s cherry farmers.
Fruit farmers have been working symbiotically with kestrels for decades, adding nesting boxes and reaping the benefits of the birds eliminating the mice, voles, songbirds, and other pests that wreak havoc by feeding on not-yet-harvested crops. In addition to limiting the crop damage caused by hungry critters, new research suggests kestrels also lower the risk of food-borne illnesses.
The study, published in November in the Journal of Applied Ecology, suggests the kestrels help keep harmful pathogens off of fruit headed to consumers by eating and scaring off small birds that carry those pathogens. Orchards housing the birds in nest boxes saw fewer cherry-eating birds than orchards without kestrels on site. This translated to an 81 percent reduction in crop damage—such as bite marks or missing fruit—and a 66 percent decrease in branches contaminated with bird feces.
Bitcoin is facing a critical test as volatility returns and price action remains unstable around the $90,000 level. Bulls are attempting to defend this psychological zone after recent turbulence, but confidence across the market is still fragile. With uncertainty dominating short-term sentiment, many traders are treating every bounce as a potential trap rather than the start of a confirmed recovery.
According to top analyst Darkfost, the market is still missing a key ingredient for a sustainable bullish continuation: a broad base of investors sitting in profit. He argues that despite Bitcoin’s resilience, there are not yet enough participants in positive territory to build the kind of structural comfort that fuels long-lasting uptrends.
This matters because latent profits are not inherently bearish. In healthy conditions, when most holders are in profit, the market tends to stabilize. Investors feel less pressure to sell, panic fades, and holding becomes easier. That environment often supports stronger trend development and reduces the risk of sharp downside reactions.
Still, Darkfost warns that profit dynamics only help up to a point. When unrealized gains become extreme across the entire market, they can eventually turn into overhead supply, triggering corrective phases.
Bitcoin’s Profit Structure Still Isn’t Bullish Enough
Profit distribution across holders can become a double-edged sword for Bitcoin. When the supply in profit climbs above 95% and approaches 100%, unrealized gains stop being supportive and begin turning into overhead pressure. At those extremes, investors have little incentive to hold through volatility, and even small shocks can trigger profit-taking that fuels corrective phases.
From a structural perspective, Darkfost argues the market needs to reclaim the 75% supply-in-profit threshold to rebuild a healthier foundation. Historically, Bitcoin has tended to sustain bullish conditions when this metric holds above that level, as most participants remain comfortable and less reactive to downside volatility.
Right now, however, the market sits near 71%, after dropping as low as 64%. Darkfost notes that readings this low have often appeared near the early stages of bear markets, even when the headline drawdown looks relatively contained. In this case, the decline of roughly 31% was enough to push a large portion of recent buyers underwater, suggesting many entered late in the move.
The recent rebound briefly lifted supply in profit back to 75%, but it failed to hold. That rejection likely reflects investors using the bounce to exit at breakeven or reduce losses. Going forward, reclaiming 75%–80% would signal stabilization, while further weakness could amplify panic-driven selling.
Volatility Keeps Bulls on the Defensive
Bitcoin is attempting to stabilize near the $90,000 mark after a volatile correction that reshaped the market structure over the past few months. The chart shows BTC printing a major peak around $125,000 before rolling over into a sharp selloff. Accelerating into November and eventually finding a local floor near the mid-$80,000s. That drop marked a decisive break in momentum and triggered a shift toward a lower range, where price has struggled to regain prior support levels.
Since the rebound off the lows, Bitcoin has moved into a consolidation phase, repeatedly testing resistance around $92,000–$95,000 but failing to generate sustained continuation. Each recovery attempt has been met with selling pressure, suggesting that short-term supply is still active near former breakdown zones. The latest bounce back toward $90,000 signals buyers are defending the level. But the structure still looks fragile without a clean breakout.
Volume also reflects uncertainty, with higher activity during selloffs and more muted participation during rebounds. Bulls likely need to hold $88,000–$90,000 and reclaim the $92,000 region with conviction.
Featured image from ChatGPT, chart from TradingView.com
Ethereum has slipped below the $3,000 level again as selling pressure returns across the broader crypto market, keeping bulls on the defensive after a brief recovery attempt. The move back under this psychological zone suggests that traders remain cautious, with downside volatility re-emerging as risk appetite fades and liquidity thins near key support levels.
However, while price action looks heavy in the short term, on-chain data is flashing a different signal beneath the surface. According to Arab Chain, Ethereum reserves held across centralized exchanges have dropped to around 16.2 million ETH, marking their lowest level since 2016. That milestone matters because it highlights a steady, long-duration trend of withdrawals rather than a sudden one-off event.
In practical terms, fewer coins sitting on exchanges typically means less immediate supply available for spot selling, especially during periods of market stress. This behavior can reflect a shift away from short-term trading and toward longer-term holding, self-custody, or deployment in DeFi.
Ethereum remains vulnerable as price struggles below $3,000. Still, the persistent reserve decline suggests that supply conditions may be tightening in the background, setting the stage for a sharper reaction if demand returns.
Binance Reserves Keep Falling
The CryptoQuant analysis also points to a similar reserve drawdown on Binance, reinforcing the broader exchange supply contraction narrative. Since the beginning of 2026, Binance’s Ethereum reserves have dropped from roughly 4.168 million ETH to around 4.0 million ETH, signaling steady withdrawals even as the price remains under pressure. This matters because Binance is often the main liquidity hub for ETH spot and derivatives, so shifts in its reserve balance can reflect real changes in market positioning.
What stands out is that this decline is happening without a meaningful rebound in inflows. In other words, ETH is not rotating back onto exchanges aggressively, suggesting sellers are not rushing to increase liquid supply at current levels. That dynamic typically aligns with a market where investors prefer holding behavior over active distribution. Either moving ETH to cold storage or deploying it across DeFi.
While reserves falling does not guarantee an immediate rally, it can change the supply-demand equation over time. With fewer coins sitting on exchanges, the market becomes more reactive if demand returns suddenly, as there is less readily available ETH to absorb buy pressure.
If Ethereum manages to reclaim key resistance levels, this supply tightening could amplify upside follow-through.
Ethereum Loses $3,000 as Bears Regain Control
Ethereum is showing renewed weakness after failing to hold above the key $3,000 level, with price now hovering near $2,970 on the daily chart. After briefly stabilizing earlier this month, ETH attempted a rebound toward the $3,300–$3,400 supply zone. But momentum faded quickly as sellers stepped back in and pushed the market lower.
From a technical perspective, Ethereum remains trapped below its major moving averages, reinforcing the bearish structure. The recent rejection near the descending trend of the 200-day average signals that upside attempts are still being capped by overhead resistance. Keeping bulls on the defensive. At the same time, the breakdown below $3,000 shifts market sentiment back into risk-off mode. Especially as crypto traders remain sensitive to broader macro uncertainty.
The current price action also reflects a fragile recovery attempt rather than a confirmed reversal. ETH’s latest drop places focus on the $2,850–$2,900 region as the next support area. An area where buyers previously stepped in during earlier selloffs. If this zone fails to hold, the market could revisit deeper levels from the previous correction phase.
For bulls to regain control, Ethereum must reclaim $3,000 quickly and build stronger demand above that threshold.
Bitcoin has slipped below the $92,000 level after a sharp decline that began on Sunday, signaling that downside pressure is still shaping market conditions. Despite the drop, bulls are trying to defend current levels and regain control, with many traders watching for a rebound that could restore confidence across the broader crypto market. The move comes at a sensitive moment, as risk appetite remains fragile and short-term volatility continues to shake out leveraged positioning.
Top analyst Darkfost highlighted that the market is now 109 days removed from Bitcoin’s last all-time high, placing the current drawdown into a wider cycle context. In previous major corrections, Bitcoin spent far longer in recovery mode, including 236 days between March 2024 and November, followed by another 154-day correction window between December 2024 and May 2025. Compared to those periods, the current pullback may still be early in its timeline, even if price action already feels aggressive.
What makes this correction stand out is the intensity of the pain across the market. Realized losses have stacked up, capitulation has been more visible, and short-term holders appear increasingly stressed, creating the sense that this decline is heavier than past resets. Even so, history suggests Bitcoin can remain in a choppy recovery phase for months without breaking the broader cycle structure.
Capitulation Builds, But the Cycle May Still Be Intact
Bitcoin’s recent decline has not been a “clean” pullback. Realized losses have stacked up, capitulation has looked aggressive, and short-term holders remain under heavy pressure as the market punishes late entries and weak conviction. Liquidation data has also shown how leverage has amplified the downside, with forced selling accelerating drops that might have otherwise played out more gradually. That backdrop is exactly why the correction feels so violent, even compared to past drawdowns.
However, Darkfost argues this phase still fits within the broader rhythm of Bitcoin’s cycle. His key point is that extended corrections are not unusual, even when they feel unusually painful in real time. From that perspective, the market could easily spend more months digesting losses and rebuilding positioning without signaling a full structural breakdown.
Where this cycle becomes more complex is the macro timing. Unlike previous cycles, Bitcoin’s post-bear all-time high and the halving narrative have overlapped with a new variable: ETF-driven demand. That shift changes how drawdowns develop, because deeper pools of institutional capital can absorb supply differently than retail-led rallies. If this institutional trend continues, Bitcoin may be transitioning into a structurally different market regime, with longer consolidations and less predictable “four-year cycle” behavior.
Bitcoin Slips Below Key Averages as Bulls Defend $90K Support
Bitcoin is back under pressure after failing to hold above the $92,000 zone, with the chart showing price sliding toward $91,300 as selling accelerates. The move keeps BTC trapped below major moving averages, reinforcing the idea that this rebound is still fragile and highly reactive to headline-driven volatility. After the January recovery attempt, the rejection near the descending resistance structure highlights that sellers remain active on rallies, limiting bullish follow-through.
Technically, the market continues to trade beneath the 50-day and 100-day trend lines, while the longer-term averages remain overhead, acting as dynamic resistance. This structure suggests BTC is still in a corrective phase rather than a confirmed trend reversal, despite short-term optimism earlier this month. Volume also shows a lack of sustained demand expansion, supporting the view that buyers are defending levels, but not fully regaining control.
The $90,000–$88,000 range now stands out as a critical support area, as it has acted as a base during recent consolidation. A clean breakdown below it could reopen downside risk toward the December lows, while a hold could keep the market building a recovery structure. For bulls, the first step is stabilizing above $92,000 again, then reclaiming the mid-$90,000s to shift momentum back in their favor.
Featured image from ChatGPT, chart from TradingView.com
[Dr Ali Shirsavar] from Biricha Digital runs us through How to Select the Perfect Output Capacitor for Your Power Supply. Your switching-mode power supply (SMPS) will require an output capacitor both to iron out voltage swings due to loading and to attenuate ripple caused by switching. In this video we learn how to calculate the required capacitance, and when necessary the ESR, for your output capacitor.
To begin [Dr Ali] shows us that in order to calculate the minimum capacitance to mitigate voltage swings we need values for Δi, Δv, and Ts. Using these we can calculate the minimum output capacitance. We then need to calculate another minimum capacitance for our circuit given that we need to attenuate ripple. To calculate this second minimum we need to change our approach depending on the type of capacitor we are using, such as ceramic, or electrolytic, or something else.
When our circuit calls for an electrolytic capacitor the equivalent series resistance (ESR) becomes relevant and we need to take it into account. The ESR is so predominant that in our calculations for the minimum capacitance to mitigate ripple we can ignore the capacitance and use the ESR only as it is the feature which dominates. [Dr Ali] goes into detail for both examples using ceramic capacitors and electrolytic capacitors. Armed with the minimum capacitance (in Farads) and maximum ESR (in Ohms) you can then go shopping to find a capacitor which meets the requirements.
Ethereum is struggling to push above critical supply levels after a brief surge above $3,300, as the market attempts to stabilize following weeks of sustained selling pressure. While the rebound has sparked renewed optimism, price action remains fragile, with bulls still needing clear confirmation before a broader recovery can take hold. Still, the fact that ETH is holding near key levels has led some analysts to start calling for higher prices, arguing that the market may be entering a new phase after the recent downtrend.
Supporting this view, a CryptoQuant analyst highlighted Ethereum Exchange Netflow spot data showing persistent ETH outflows from spot exchanges during price pullbacks, while inflows during upward moves remain relatively limited. This pattern suggests a more disciplined supply environment, where holders are reluctant to sell into weakness and are not aggressively distributing during rallies.
In other words, sell-side pressure appears to be easing, even as Ethereum remains capped below major resistance. If demand returns, this type of netflow structure can support sharper upside moves, as fewer coins are available on exchanges to meet new buying interest. For now, Ethereum is caught between fading fear and unfinished recovery, with the next breakout attempt likely to define the short-term trend.
ETH Supply Tightens As Exchange Outflows Persist
Ethereum’s recent Exchange Netflow behavior suggests that the latest pullbacks have been met with holding and accumulation rather than broad-based distribution. Instead of rushing to send ETH onto exchanges during weakness, many participants appear willing to sit through volatility, reducing the immediate sell pressure that typically accelerates downtrends. This supports the idea that supply is gradually stepping back, even as price remains capped below key resistance zones and market sentiment stays cautious.
However, Exchange Netflow alone is not enough to define direction. A favorable supply structure can still fail if demand remains weak, or if macro conditions deteriorate and force investors back into risk-off positioning. In that scenario, downside continuation cannot be ruled out, even if exchange balances remain constrained.
That said, in the absence of major systemic stress, the current netflow profile offers a constructive backdrop for upside. The lack of supply expansion during drawdowns and the restrained profit-taking during rebounds imply that sellers are not in control. If demand rotates back into Ethereum, price could respond more efficiently because there is less readily available liquidity sitting on exchanges.
In this sense, the on-chain data is not signaling an immediate breakout. Instead, it highlights a market structure that appears increasingly prepared for upward price action once broader conditions align and buyers regain conviction.
Ethereum Bulls Fight Structural Resistance
Ethereum is attempting to stabilize above the $3,300 zone after a sharp rebound from the December lows, but the chart shows bulls are still battling heavy overhead supply. Price recently pushed into the $3,300–$3,400 band, a level that has repeatedly acted as a pivot point during this downtrend. While momentum has improved, ETH is still trading below key moving averages, reinforcing the idea that this move may be more of a recovery leg than a confirmed reversal.
The blue moving average overhead continues to slope downward and sits above current price, highlighting that the broader structure remains pressured. At the same time, the green moving average is flattening near the $3,300 area, adding to the resistance cluster and making this zone difficult to reclaim cleanly.
From a market structure perspective, ETH has shifted from a clear downtrend into a tighter consolidation, with buyers stepping in on dips and building higher lows since early January. However, volume remains relatively muted compared to the October and November selloffs, suggesting that conviction is still developing.
Featured image from ChatGPT, chart from TradingView.com
A map from Microsoft’s Closing Washington’s Housing Gap report shows the estimated number of additional homes needed across the state through 2044, highlighting the scale of the shortfall in King, Snohomish, Pierce and other fast-growing counties. (Microsoft Image)
A bill to open up strip malls, big-box stores, and other commercial land for housing development across Washington state gets its first hearing today, with what might seem an unlikely supporter: Microsoft.
The tech giant is urging lawmakers to pass SB 6026, which would flip the default setting on commercial zoning: instead of requiring developers to seek permission for housing on commercial land, cities of more than 30,000 people would have to allow it in qualifying areas.
In other words, no more lengthy battles to turn half-empty strip malls into apartments.
It’s one piece of a broader strategy that Microsoft is laying out after more than five years and $750 million invested in affordable housing across the region, mostly in the form of a revolving loan fund. In a report released this week, the company makes the case that Washington’s housing crisis is solvable, but only if policymakers treat it as a systemic problem rather than a collection of isolated issues.
The report draws on lessons learned from Microsoft’s housing investments, which the company says are on track to create or preserve more than 16,000 affordable homes so far across King County and the broader region.
“We greatly underestimated the size, scope, and complexity of the problem,” acknowledged Jane Broom, senior director of Microsoft Philanthropies, in an interview with GeekWire this week. “We didn’t quite realize the interconnectedness of the housing sector, from shelter space to low-income housing to workforce housing to market-rate housing.”
She explained, “If you underperform in one of those areas, it greatly impacts the whole.”
Jane Broom, senior director of Microsoft Philanthropies, during a 2025 Microsoft Elevate event. (GeekWire Photo / Taylor Soper)
Why does Microsoft care about housing? Broom said it comes down to economic opportunity and quality of life. Housing affordability has risen to become the top concern among Washington voters, she said, threatening the state’s ability to attract and retain workers.
Broom pointed to anecdotes about school teachers and essential workers commuting 90 minutes each way because they can’t afford to live closer, and young professionals leaving the region entirely because they can’t find affordable housing.
Microsoft added housing to its portfolio of community investments in 2019, alongside longstanding commitments to education, transportation, and arts and culture. The company’s report this week lays out a four-point plan based on its lessons learned:
Unlock more land for housing, especially underused commercial property like strip malls and big-box stores, by making residential development the default in commercial zones.
Fix the permitting process to make it faster and more predictable, removing unnecessary delays that add costs and drive developers out of the market.
Lower construction costs through innovation in materials and methods, expanded tax incentives, and use of AI to streamline regulatory compliance.
Build long-term public-private partnerships with clear accountability, leveraging private and philanthropic capital alongside public investment.
Another long-term opportunity mentioned in the report is AI. Broom said Microsoft is working with tech companies that serve municipal governments to integrate AI into permitting systems, helping to sort through complex building codes and regulatory requirements more quickly.
Some developers are already experimenting with the technology, she said, uploading building codes and municipal regulations to AI systems that can automatically flag whether a proposed design will comply, or how to optimize plans for housing affordability.
Microsoft isn’t the only local tech giant addressing the housing crisis. Amazon has committed more than $3.6 billion to affordable housing through its Housing Equity Fund, with more than $780 million directed toward the Seattle area since 2021.
The two companies have taken different approaches. Microsoft has focused primarily on the Eastside and middle-income housing, while Amazon has pursued project-by-project investments targeting lower-income households.
However, they are often on the same page on housing policy, Broom said.
“Thematically, we’ve always been aligned and supportive,” she said. “This is really hard and complicated, and this state is making it much more difficult than it really needs to be.”
Bitcoin has pushed above the $97,000 level, extending a recovery that has brought short-term relief to a market weighed down by weeks of uncertainty. While the move has reignited optimism among some investors, a large share of analysts remains cautious, arguing that the rally could still be a counter-trend bounce within a broader bearish setup for 2026.
Price strength alone, however, does not fully explain the current move. According to a CryptoQuant analyst, Bitcoin has shown notable resilience after decisively breaking the $94,200 resistance zone and accelerating toward the $97,500 area, with on-chain data offering important context behind the advance.
One of the key indicators supporting this move is Value Days Destroyed (VDD), a metric that sheds light on long-term holder behavior. VDD measures how long coins remained inactive before being spent, weighted by transaction size. In simple terms, it helps distinguish whether price movements are driven by experienced holders distributing old coins or by newer coins changing hands.
As of January 2026, VDD is hovering around 0.53, a historically low reading. This implies that the coins currently moving on the network are relatively young, while older holdings remain largely dormant. Such behavior suggests that long-term holders are not rushing to sell into strength, lending structural support to the recent breakout—even as the broader market debates whether this surge marks renewed strength or merely a temporary reprieve.
The report by Carmelo Alemán, Verified On-Chain Analyst at CryptoQuant, highlights an important dynamic behind Bitcoin’s recent move above key resistance levels. Despite the sharp price appreciation, long-term holders remain largely inactive. In practical terms, this means that investors who have held Bitcoin through multiple cycles are not using the current strength as an opportunity to exit positions. Their restraint significantly improves the quality of the rally.
Historically, this behavior has mattered. When Bitcoin advances while Value Days Destroyed (VDD) stays low, it signals that older coins are not entering circulation. Demand is being met primarily by younger supply, allowing price to rise without triggering structural selling pressure from the most experienced market participants. These phases have often aligned with healthier expansion periods rather than short-lived speculative spikes.
The current breakout fits that historical pattern. Bitcoin’s move through resistance has not been accompanied by a surge in long-dormant coins being spent. Instead, long-term capital appears comfortable holding through higher prices, suggesting confidence in the broader market structure rather than urgency to lock in gains.
This supportive backdrop remains conditional. As long as VDD stays suppressed, the rally retains a strong foundation. However, a sustained increase in the indicator would change the narrative, signaling that long-term holders are beginning to distribute and potentially marking a shift toward heavier selling pressure.
Price Tests Key Resistance After December Rebound
Bitcoin price is trying to stabilize after a sharp rebound from the December lows, with the chart showing BTC reclaiming the $96,000–$97,000 zone. This level coincides with a confluence of technical factors, making it a critical area for short-term direction. The recent recovery followed a strong sell-off from the November highs. Where the price broke below the 50-day and 100-day moving averages and briefly capitulated toward the low $80,000s.
From a structure perspective, BTC is now printing higher lows on the daily timeframe, signaling a potential short-term trend reversal. Price has also reclaimed the 50-day moving average, which often acts as dynamic resistance during downtrends. Holding above this level would be constructive, as it suggests buyers are regaining control after weeks of distribution and volatility.
However, overhead resistance remains significant. The 100-day and 200-day moving averages, currently clustered between $100,000 and $108,000, represent a heavy supply zone where previous breakdowns occurred. A failure to push higher could lead to renewed consolidation or a pullback toward the $92,000–$94,000 support range.
Volume has increased during the rebound, showing genuine participation rather than a low-liquidity bounce. Still, the broader trend remains unclear. For bullish momentum, Bitcoin needs acceptance above $97,000 and a clear attempt toward the $100,000 psychological level. Otherwise, the move risks being a technical rebound within a larger corrective phase.
Featured image from ChatGPT, chart from TradingView.com
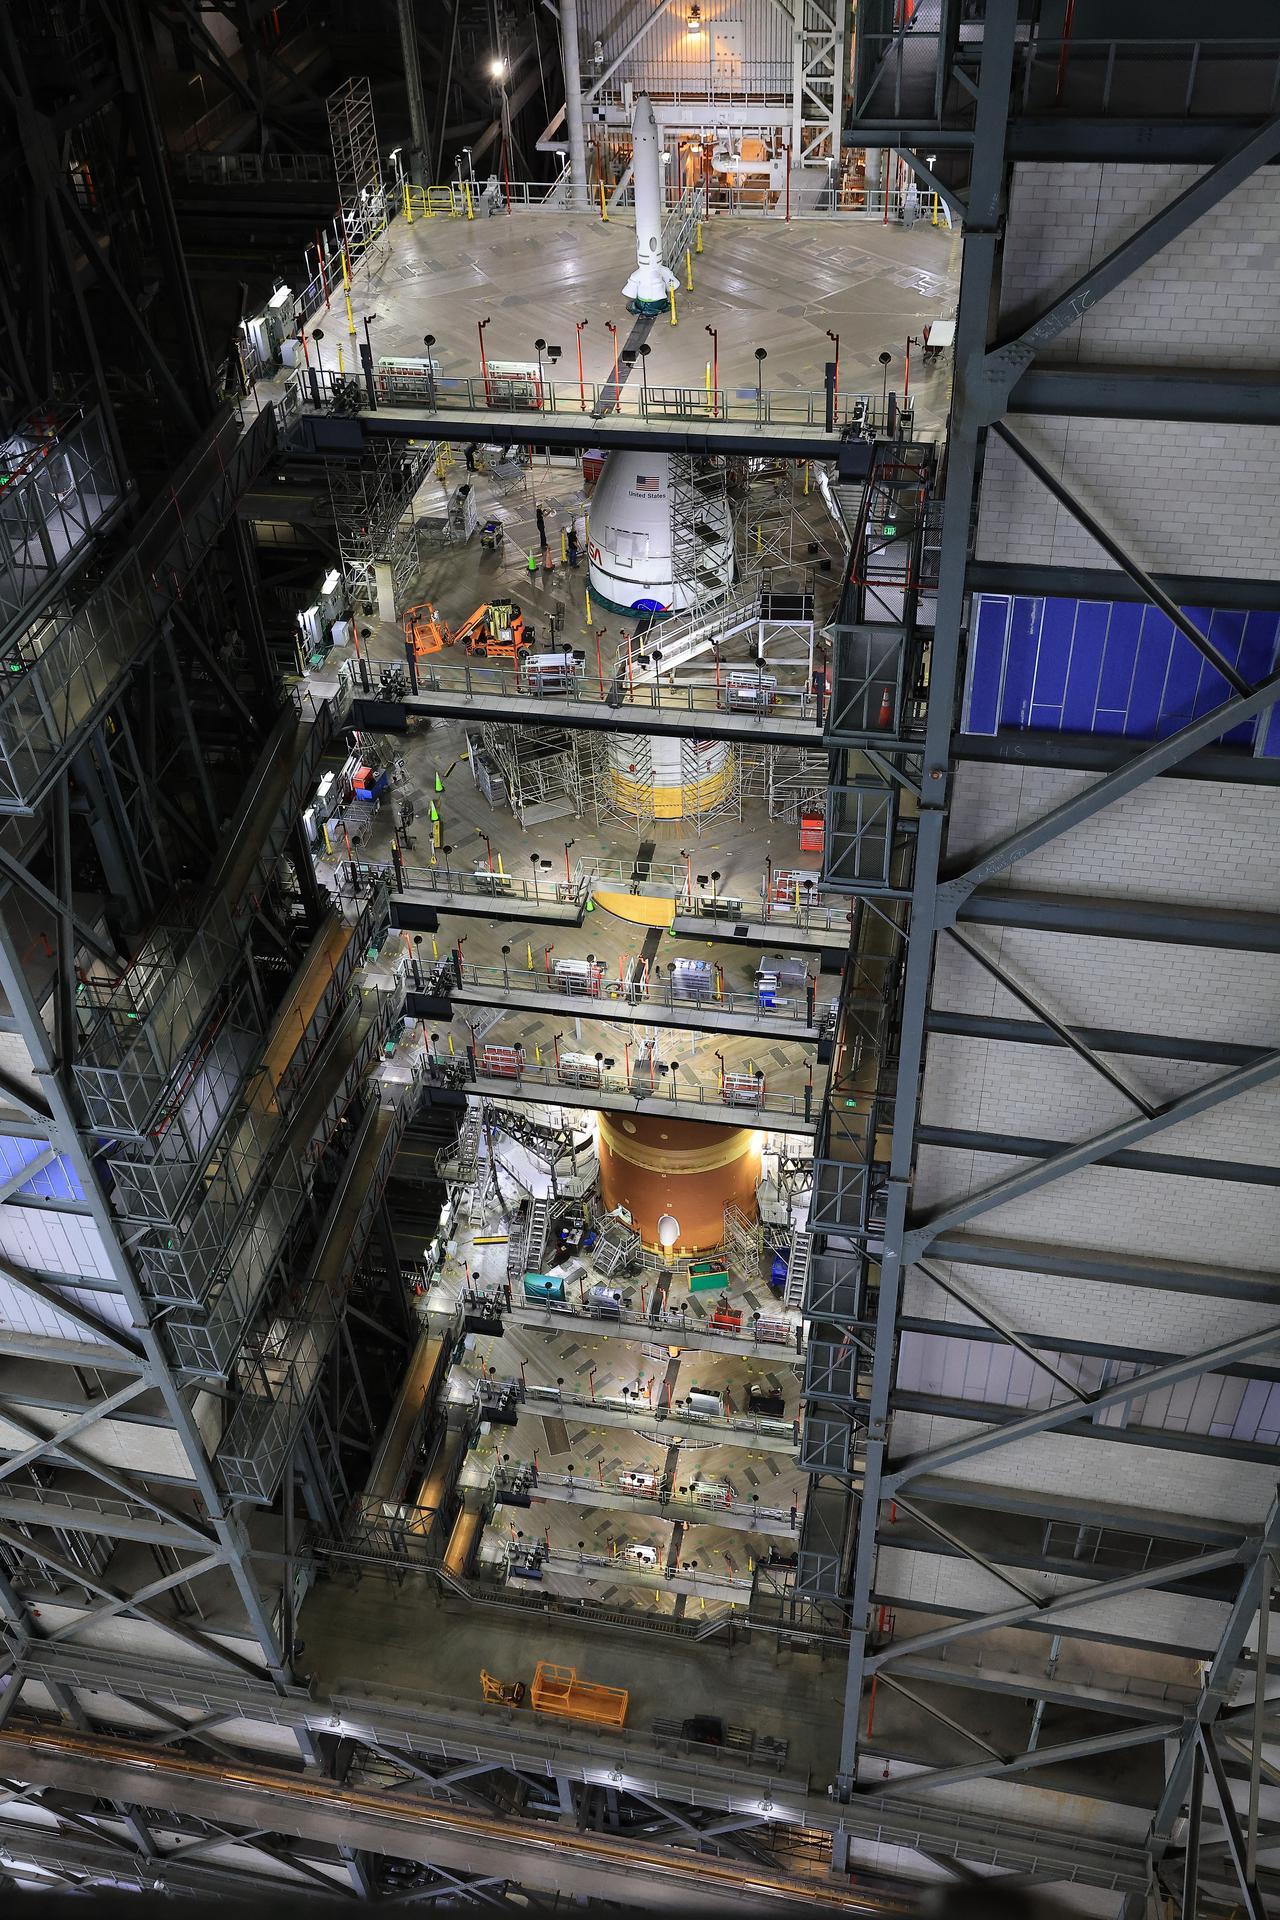
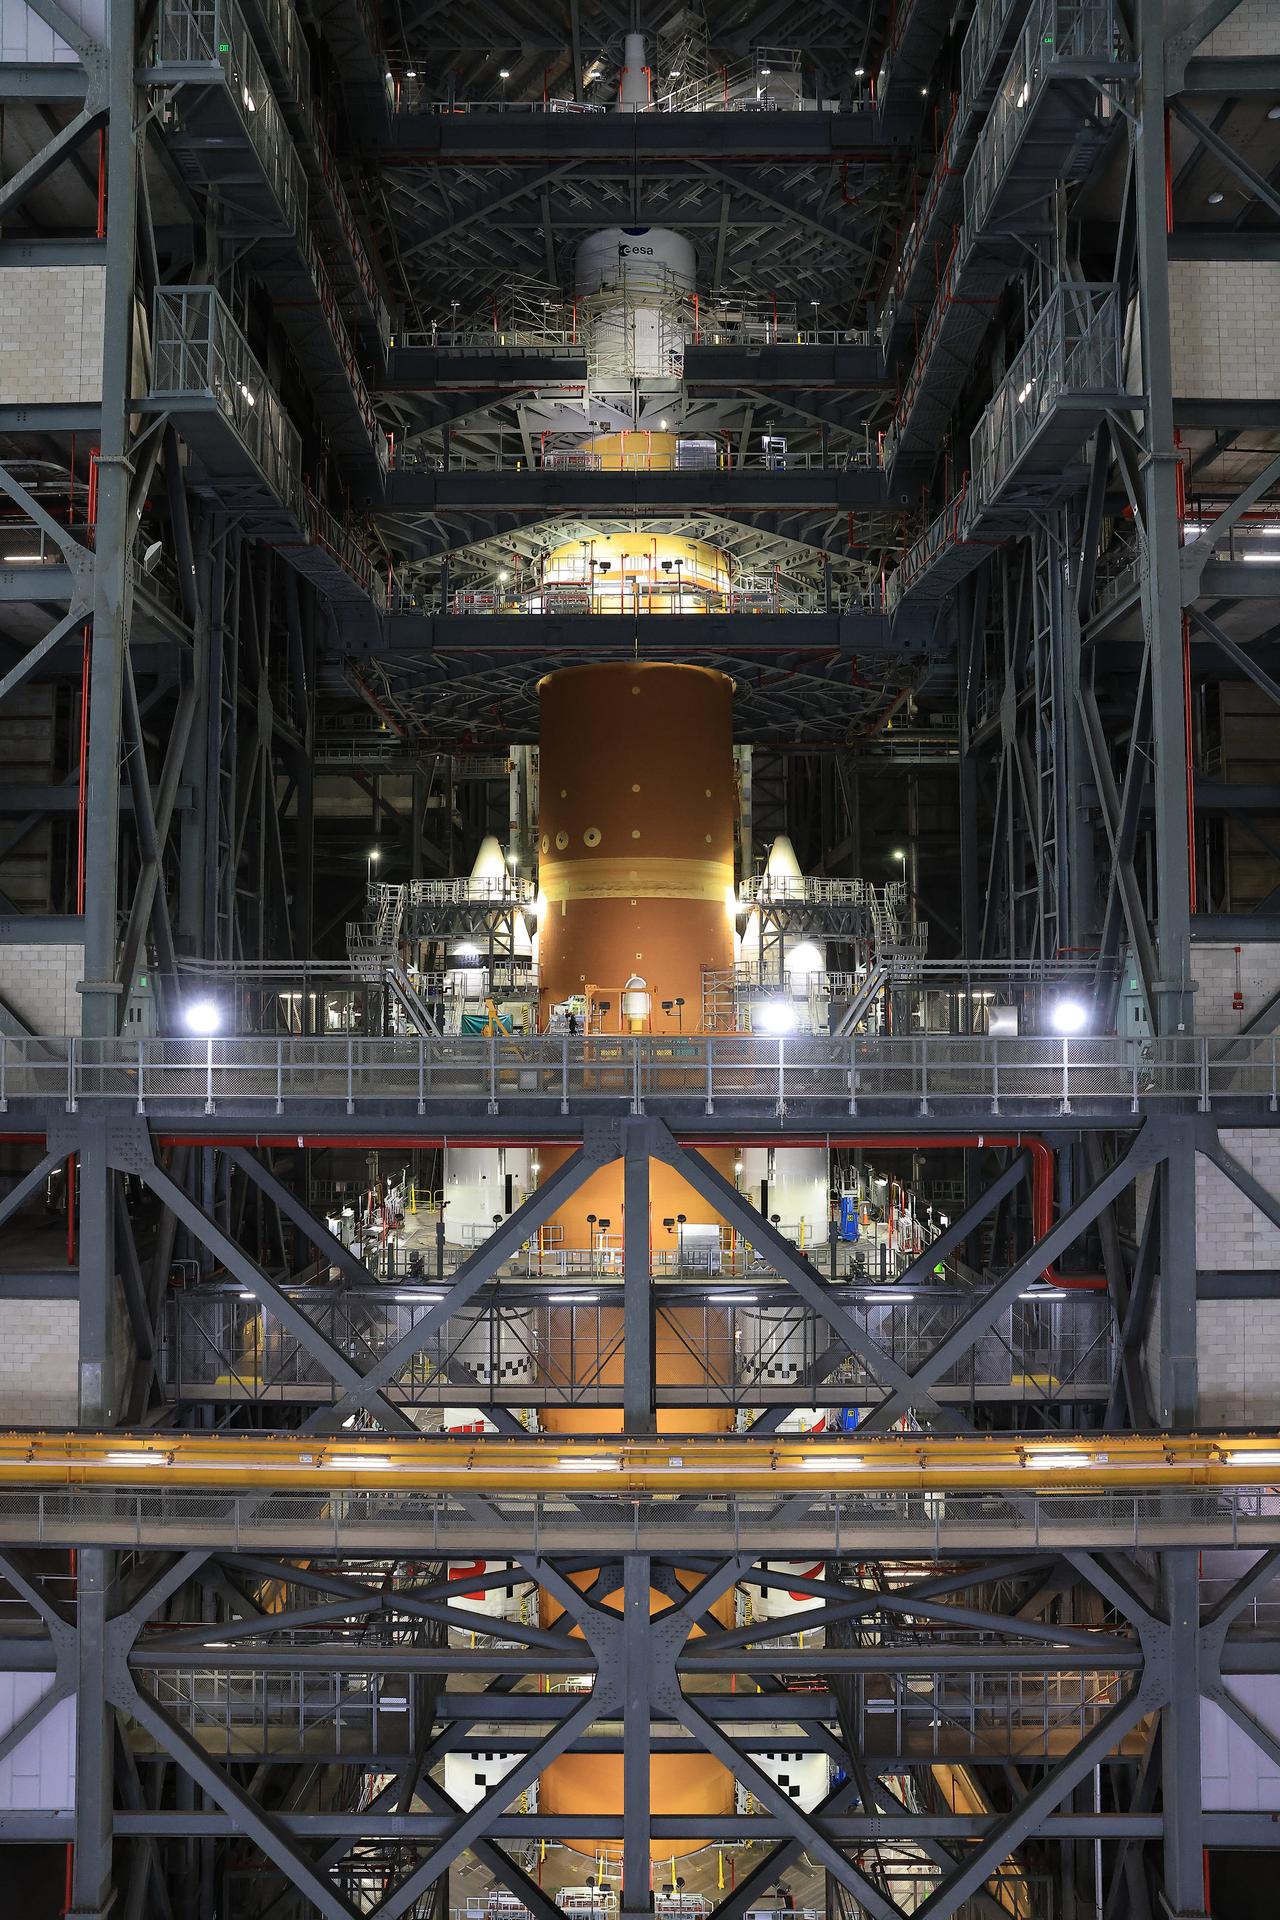
NASA’s Artemis II Orion spacecraft with its launch abort system is stacked atop the agency’s SLS (Space Launch System) rocket in High Bay 3 of the Vehicle Assembly Building at NASA’s Kennedy Space Center in Florida on Monday, Oct. 20, 2025. The spacecraft will carry NASA astronauts Reid Wiseman, Victor Glover, Christina Koch, and CSA (Canadian Space Agency) astronaut Jeremy Hansen on a 10-day mission around the Moon and back in early 2026. Teams will begin conducting a series of verification tests ahead of rolling out the integrated SLS rocket to NASA Kennedy’s Launch Complex 39B for the wet dress rehearsal.
NASA/Kim Shiflett
Teams at NASA’s Kennedy Space Center in Florida spent 2025 preparing the launch vehicle and its powerhouse SLS (Space Launch System) rocket to launch four astronauts around the Moon for Artemis II in early 2026. The center also celebrated milestones by conducting science experiments at the International Space Station to studying the Sun’s solar wind impacts on Earth to traveling to Mars in hopes of one day exploring the Red Planet in person.
JANUARY NASA Kennedy Marks New Chapter for Florida Space Industry
Kennedy Space Center Director Janet Petro and charter members of the Florida University Space Research Consortium sign a memorandum of understanding in research and development to assist with missions and contribute to NASA’s Moon to Mars exploration approach.
From left: Jennifer Kunz, Associate Director, Technical, Kennedy Space Center; Kelvin Manning, Deputy Director, Kennedy Space Center; Dr. Kent Fuchs, Interim President, University of Florida; Janet Petro, Director, Kennedy Space Center; Jeanette Nuñez, Florida Lieutenant Governor; Dr. Alexander Cartwright, President, University of Central Florida; Dr. Barry Butler, President, Embry-Riddle Aeronautical University.
NASA/Kim Shifflet
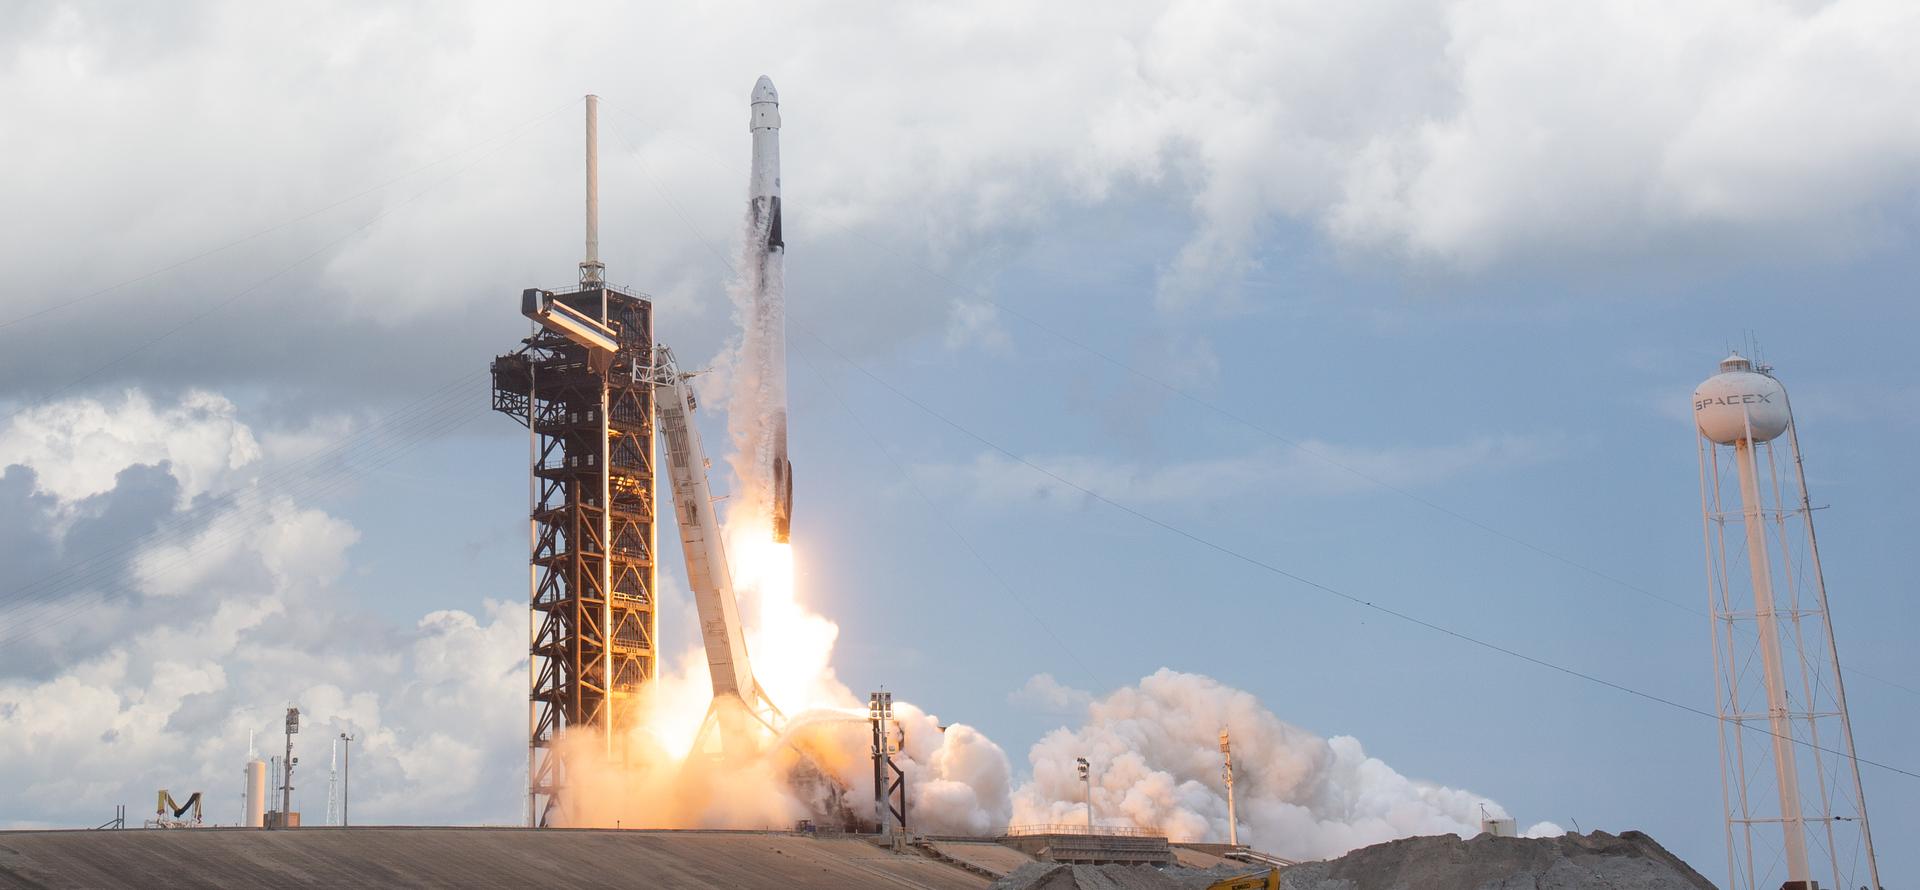
Firefly Launches Blue Ghost Mission One
Firefly Aerospace launched Blue Ghost Mission One lunar lander with a suite of NASA scientific instruments on January 15, from Launch Complex 39A at NASA Kennedy. The lander and instruments landed March 2 on the Moon.
Creating a golden streak in the night sky, a SpaceX Falcon 9 rocket carrying Firefly Aerospace’s Blue Ghost Mission One lander soars upward after liftoff from Launch Complex 39A at NASA’s Kennedy Space Center in Florida on Wednesday, Jan. 15, 2025 as part of NASA’s CLPS (Commercial Lunar Payload Services) initiative.
NASA/Cory S Huston
FEBRUARY Intuitive Machines Launches to the Moon
Intuitive Machines’ IM-2 Nova C lunar lander launched Feb. 26 from Launch Complex 39A, carrying NASA science and technology demonstrations to the Mons Mouton region of the Moon. IM-2 reached the surface of the Moon on March 6.
Creating a golden streak in the night sky, a SpaceX Falcon 9 rocket carrying Intuitive Machines’ Nova-C lunar lander (IM-2) soars upward after liftoff from Launch Complex 39A at NASA’s Kennedy Space Center in Florida at 7:16 p.m. EST Wednesday, Feb. 26, 2025, as part of NASA’s CLPS (Commercial Lunar Payload Services) initiative.
NASA/Frank Michaux
MARCH NASA’s SpaceX Crew-10 Launch
NASA astronauts Anne McClain and Nicole Ayers, JAXA (Japan Aerospace Exploration Agency) Takuya Onishi, and Roscosmos cosmonaut Kirill Peskov launched March 14 from Launch Complex 39A to the International Space Station for a five-month science mission.
Members of NASA’s SpaceX Crew-10, from left, Roscosmos cosmonaut Kirill Peskov, mission specialist; NASA astronauts Nichole Ayers, pilot and Anne McClain, commander; and JAXA (Japan Aerospace Exploration Agency) astronaut Takuya Onishi, mission specialist.
SpaceX
NASA’s SPHEREx, PUNCH Missions Launch
A SpaceX Falcon 9 rocket launched on March 11, from Space Launch Complex 4 East at Vandenberg Space Force Base in California carrying NASA’s SPHEREx (Spectro-Photometer for the History of the Universe, Epoch of Reionization and Ices Explorer) and PUNCH (Polarimeter to Unify the Corona and Heliosphere) missions. NASA’s Launch Services Program, based at NASA Kennedy managed the launch service for SPHEREx.
NASA’s SPHEREx observatory is installed in the Titan Thermal Vacuum (TVAC) test Chamber at BAE Systems in Boulder, Colorado, in June 2024. As part of the test setup, the spacecraft and photon shield are covered in multilayer insulation and blankets and surrounded by ground support equipment.
Jet Propulsion Laboratory
NASA’s SpaceX Crew-9 Returns
NASA astronauts Nick Hague, Suni Williams, and Butch Wilmore were greeted by dolphins and recovery teams after their SpaceX Dragon spacecraft splashed down on March 18, off the coast of Tallahassee, Florida following their long-duration mission at the International Space Station.
Support teams work around a SpaceX Dragon spacecraft shortly after it landed with NASA astronauts Nick Hague, Suni Williams, Butch Wilmore, and Roscosmos cosmonaut Aleksandr Gorbunov aboard in the water off the coast of Tallahassee, Florida, Tuesday, March 18, 2025. Hague, Gorbunov, Williams, and Wilmore are returning from a long-duration science expedition aboard the International Space Station.
NASA/Keegan Barber
NASA Causeway Bridge Opens
The Florida Department of Transportation opened the westbound portion of the NASA Causeway Bridge on March 19, completing construction in both directions spanning the Indian River Lagoon and connecting NASA Kennedy and Cape Canaveral Space Force Station to the mainland.
Cars drive over the newly completed westbound portion (right side of photo) of the NASA Causeway Bridge leading away from NASA’s Kennedy Space Center in Florida on Wednesday, March 19, 2025. The Florida Department of Transportation (FDOT) opened the span on Tuesday, March 18, 2025, alongside its twin on the eastbound side, which has accommodated traffic in both directions since FDOT opened it on June 9, 2023.
NASA/Glenn Benson
NASA Artemis Teams Complete URT-12
Teams from NASA and the Department of War train during a week-long Underway Recovery Test-12 in March off the coast of California for Artemis II test flight crewmembers and the Orion spacecraft. The series of tests demonstrate and evaluate the processes, procedures, and hardware used in recovery operations for crewed lunar missions.
Waves break inside USS Somerset as the Crew Module Test Article, a full scale mockup of the Orion spacecraft, is tethered during Underway Recovery Test-12 off the coast of California, Wednesday, March 26, 2025. During the test, NASA and Department of Defense teams are practicing to ensure recovery procedures are validated as NASA plans to send Artemis II astronauts around the Moon and splashdown in the Pacific Ocean.
NASA/Joel Kowsky
APRIL NASA’s SpaceX 32nd Commercial Resupply Mission
A SpaceX Falcon 9 rocket and a Dragon spacecraft carrying nearly 6,700 pounds of scientific investigations, food, supplies, and equipment launched on April 21 from Launch Complex 39A to the International Space Station.
The SpaceX Falcon 9 rocket carrying the Dragon spacecraft lifts off from Launch Complex 39A at NASA’s Kennedy Space Center in Florida on Monday, April 21, on the company’s 32nd commercial resupply services mission for the agency to the International Space Station.
SpaceX
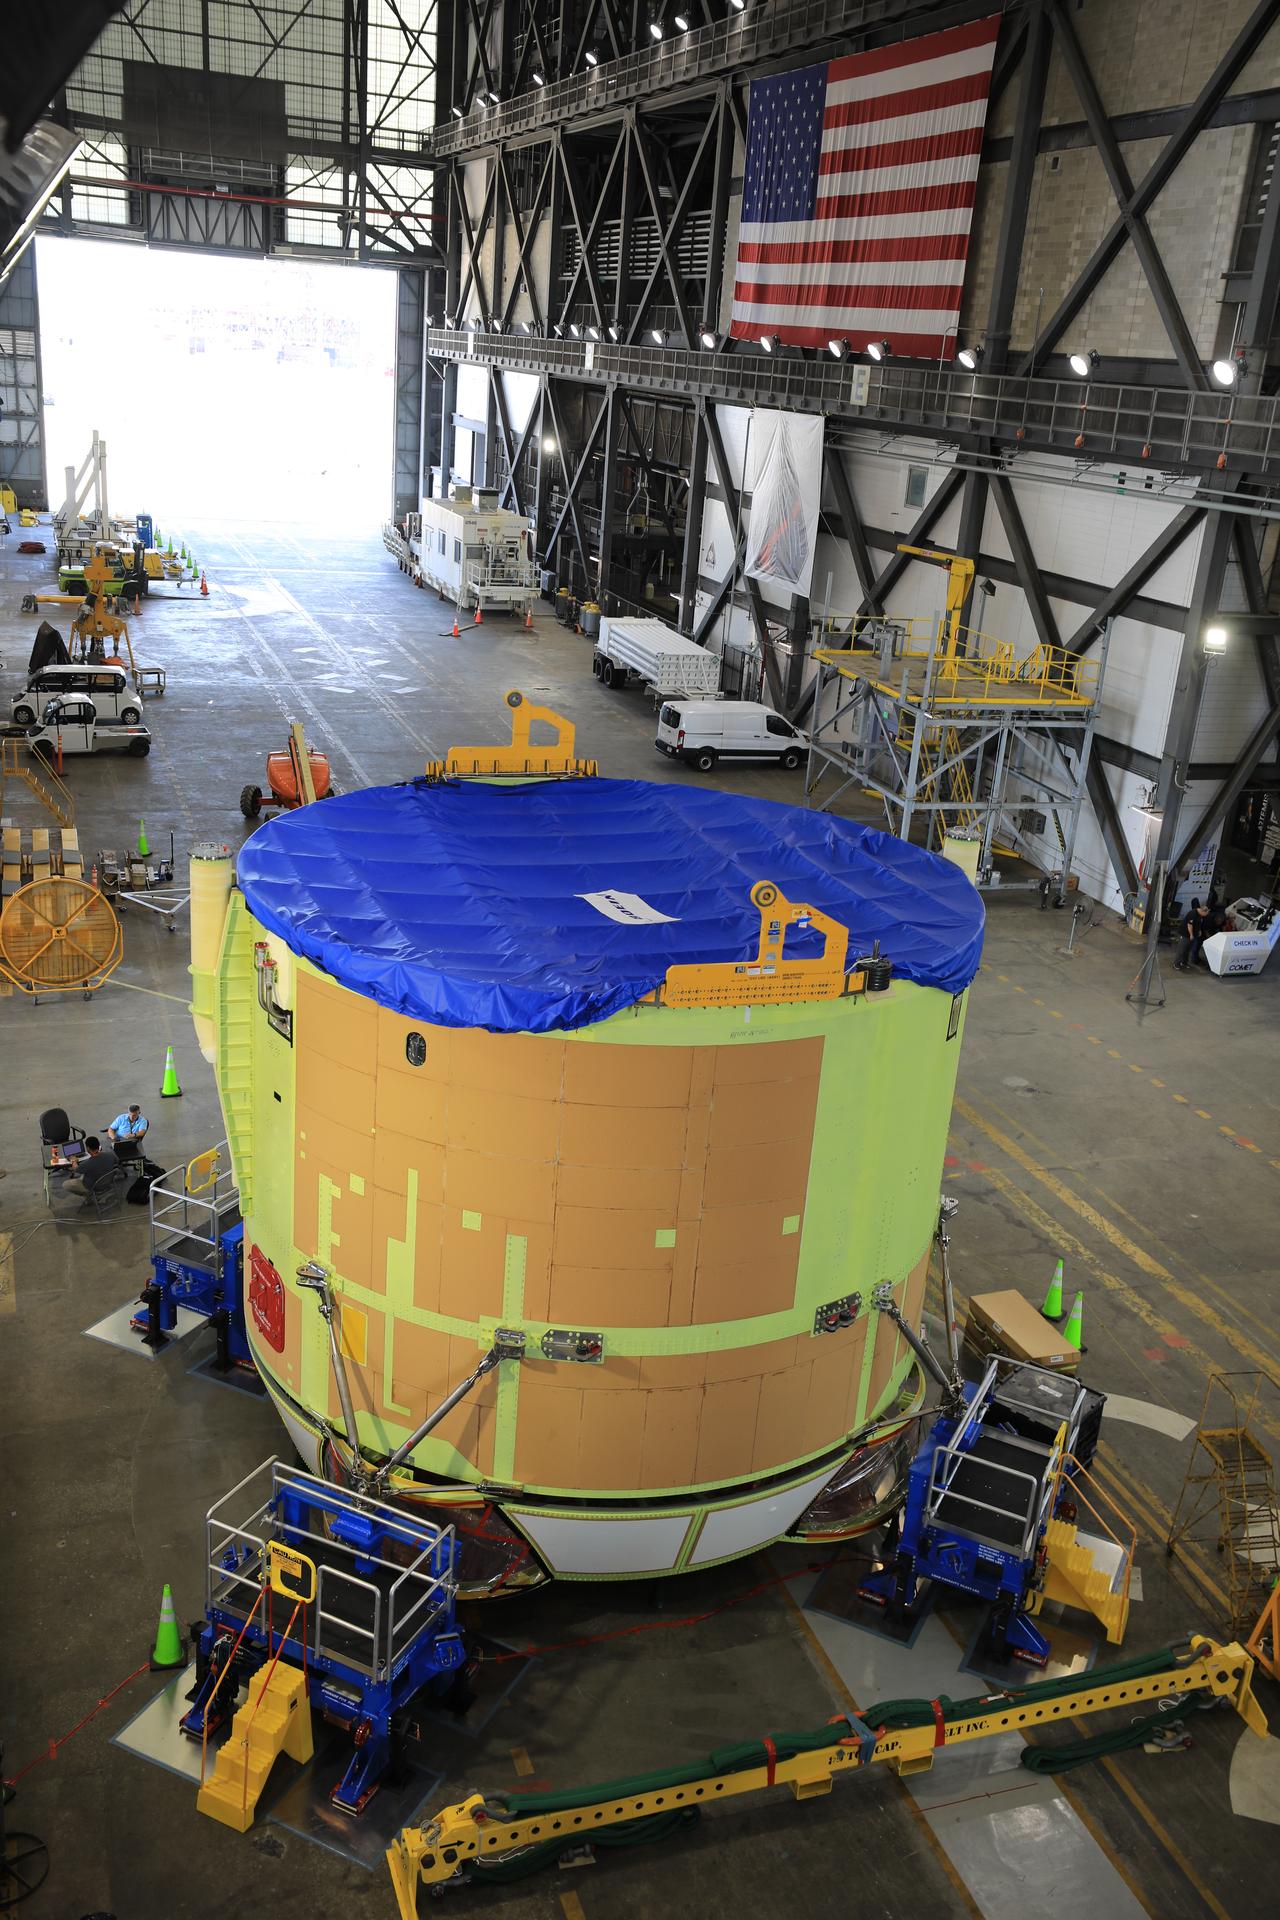
JULY Artemis III Begins Processing
NASA’s Artemis III SLS engine section and boat-tail made the journey from the Space Systems Processing Facility at NASA Kennedy to the spaceport’s Vehicle Assembly Building in July to complete integration and check-out testing. Beginning with the Artemis III hardware, NASA moved certain operations to NASA Kennedy to streamline the manufacturing process and enable simultaneous production operations of two core stages.
Teams from NASA’s Kennedy Space Center in Florida integrate NASA’s Artemis III SLS (Space Launch System) core stage engine section with its boat-tail inside the spaceport’s Vehicle Assembly Building on Wednesday, July 30, 2025. The boat-tail is a fairing-like structure that protects the bottom end of the core stage, while the engine section is one the most complex and intricate parts of the rocket stage that will help power the Artemis missions to the Moon.
NASA/Ronald Beard
AUGUST NASA’s SpaceX Crew-11 Launches
NASA astronauts Zena Cardman and Mike Fincke, JAXA (Japan Aerospace Exploration Agency) astronaut Kimiya Yui, and Roscosmos cosmonaut Oleg Platonov launched aboard a SpaceX Dragon spacecraft and its Falcon 9 rocket on Aug. 1 from Launch Complex 39A bound for a long-duration mission to the International Space Station.
NASA’s SpaceX Crew-11 mission is the eleventh crew rotation mission of the SpaceX Dragon spacecraft and Falcon 9 rocket to the International Space Station as part of the agency’s Commercial Crew Program.
NASA/Joel Kowsky
NASA’s SpaceX Crew-10 Returns
NASA astronauts Anne McClain and Nicole Ayers, JAXA (Japan Aerospace Exploration Agency) astronaut Takuya Onishi, and Roscosmos cosmonaut Kirill Peskov became the first Commercial Crew to splash down in the Pacific Ocean off the coast of California on Aug. 9, completing their nearly five-month mission at the orbiting outpost as part of the agency’s Commercial Crew Program.
Roscosmos cosmonaut Kirill Peskov, left, NASA astronauts Nichole Ayers, Anne McClain, and JAXA (Japan Aerospace Exploration Agency) astronaut Takuya Onishi returned after 147 days in space as part of Expedition 73 aboard the International Space Station.
NASA/Keegan Barber
NASA’s SpaceX 33rd Commercial Resupply Mission
A SpaceX Falcon 9 launched the company’s Dragon spacecraft carrying more than 5,000 pounds of food, crew supplies, science investigations, spacewalk equipment, and more to the space station on Aug. 24 from Launch Complex 39A.
A SpaceX Dragon cargo spacecraft with its nosecone open and carrying over 5,000 pounds of science, supplies, and hardware for NASA’s SpaceX CRS-33 mission approaches the International Space Station for an automated docking to the Harmony module’s forward port.
NASA
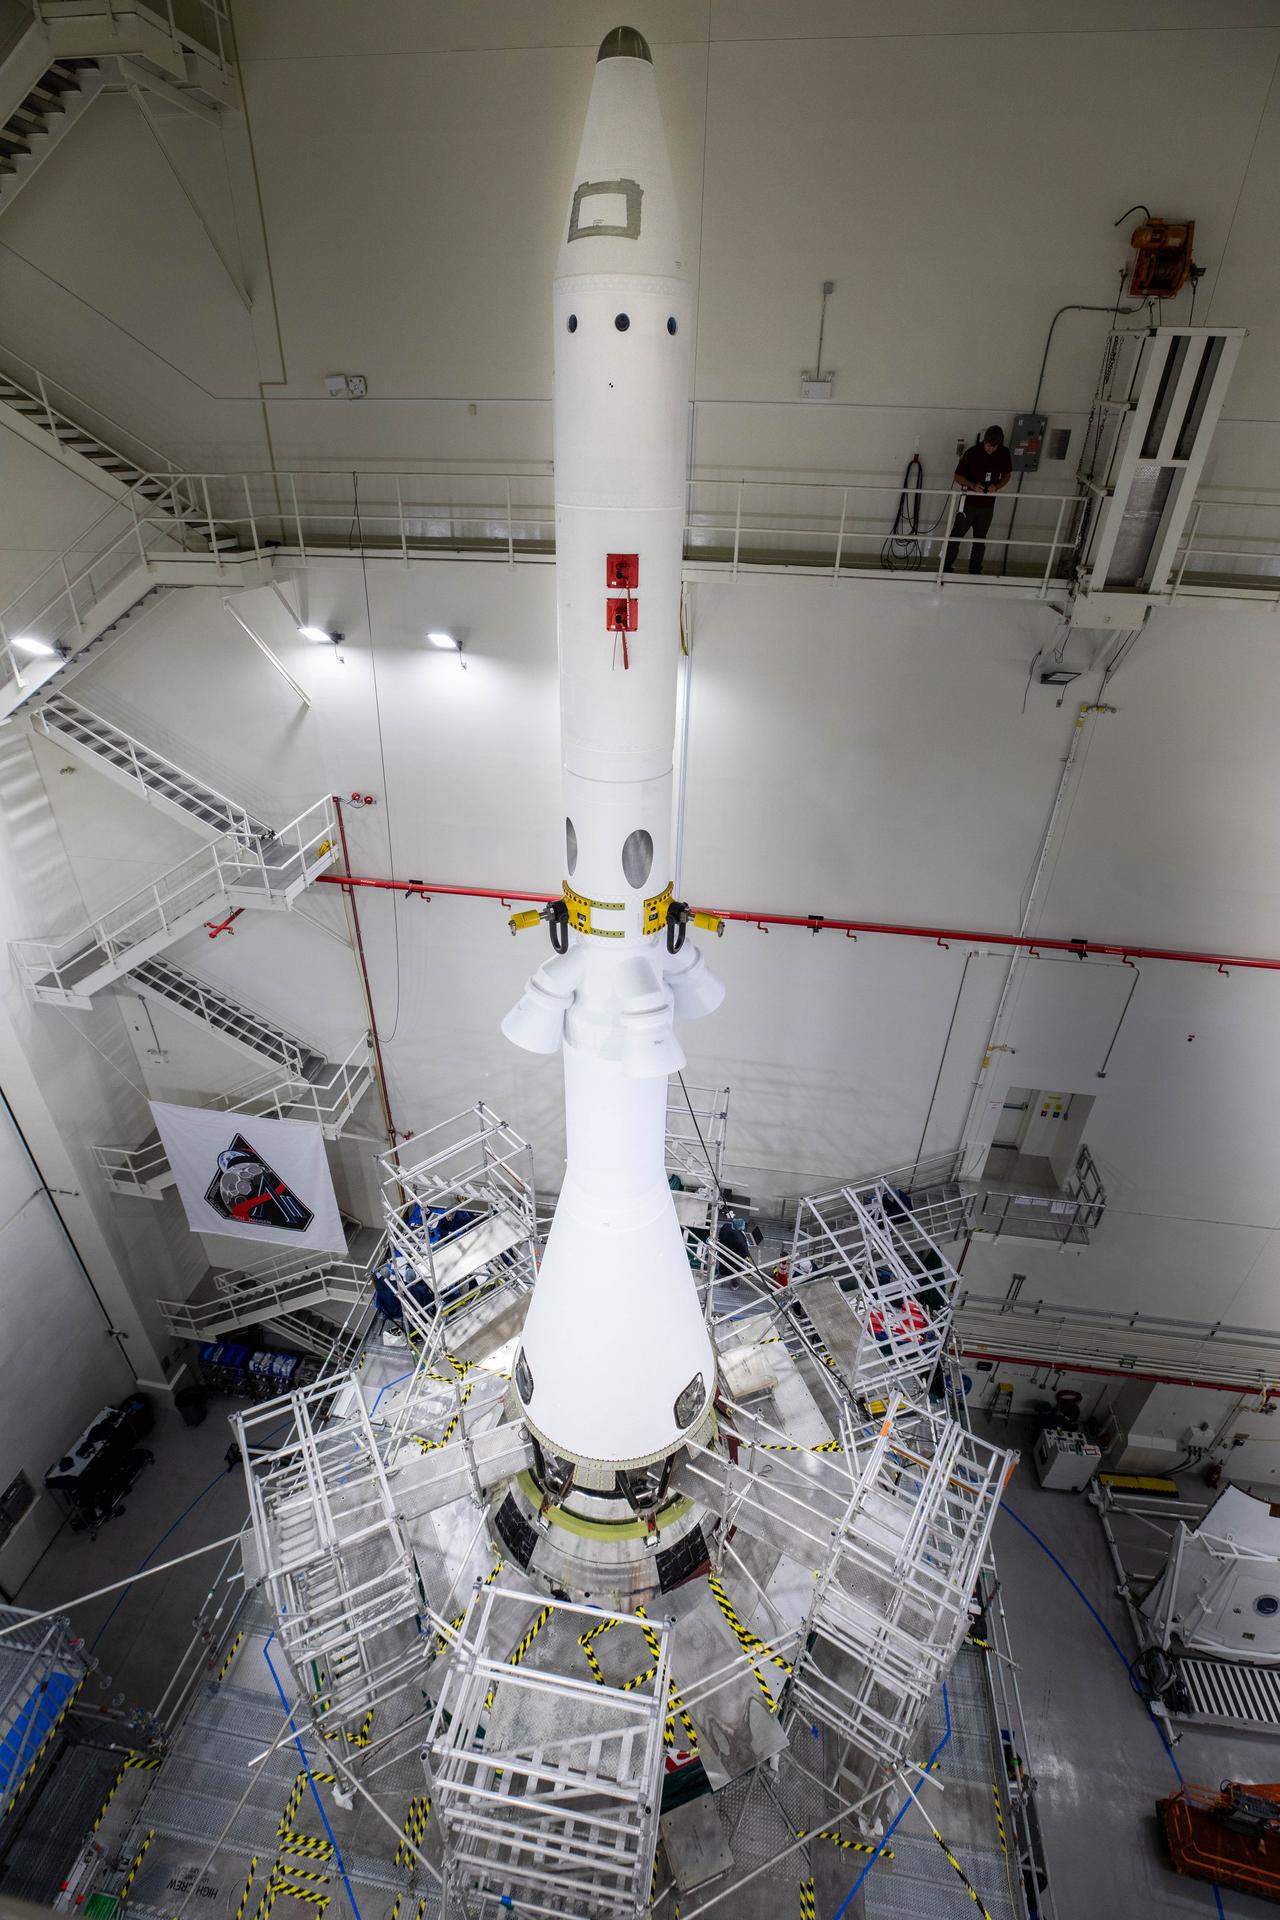
Orion Tested, Stacked With Hardware
Teams transported NASA’s Orion spacecraft from Kennedy’s Multi-Payload Processing Facility to the Launch Abort System Facility in August where crews integrated the 44-foot-tall launch abort system. The Orion spacecraft will send NASA astronauts Reid Wiseman, Victor Glover, Christina Koch, and CSA (Canadian Space Agency) astronaut Jeremy Hansen around the Moon for the Artemis II mission in early 2026. The launch abort system is designed to carry the crew to safety in the event of an emergency atop the SLS.
The launch abort tower on NASA’s Artemis II Orion spacecraft is pictured inside the Launch Abort System Facility at the agency’s Kennedy Space Center in Florida on Wednesday, Aug. 27, 2025, after teams with NASA’s Exploration Ground Systems Program installed the tower on Wednesday, Aug. 20, 2025. Positioned at the top of Orion, the 44-foot-tall launch abort system is designed to carry the crew to safety in the event of an emergency during launch or ascent, with its three solid rocket motors working together to propel Orion – and astronauts inside – away from the rocket for a safe landing in the ocean, or detach from the spacecraft when it is no longer needed. The final step to complete integration will be the installation of the ogive fairings, which are four protective panels that will shield the crew module from the severe vibrations and sounds it will experience during launch.
NASA/Cory Huston
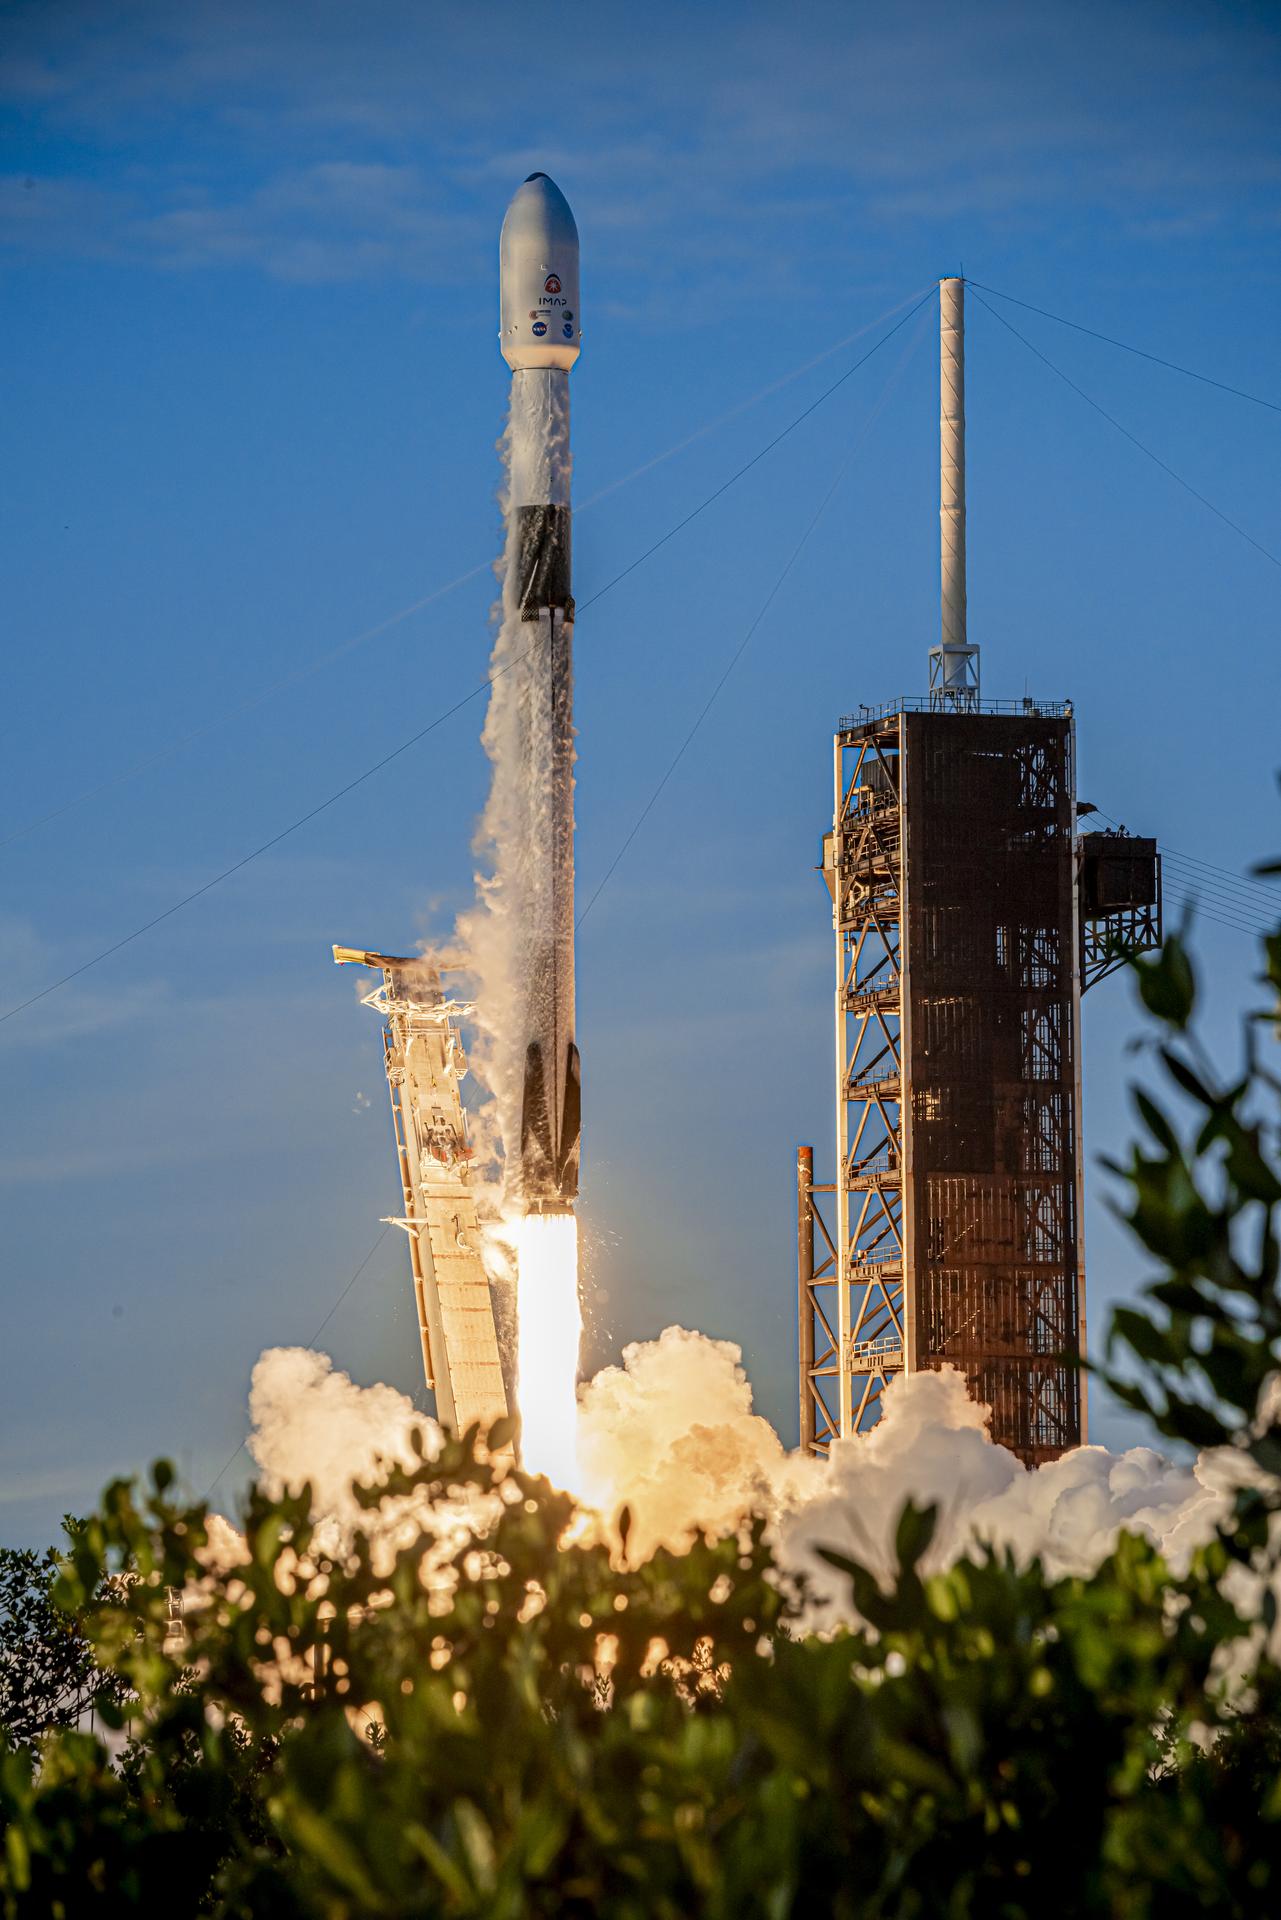
SEPTEMBER NASA Launches IMAP Mission
NASA’s IMAP (Interstellar Mapping and Acceleration Probe) launched from Launch Complex 39A on Sept. 24, to help researchers better understand the boundary of the heliosphere, a huge bubble created by the Sun surrounding and protecting our solar system.
A SpaceX Falcon 9 rocket carrying NASA’s IMAP (Interstellar Mapping and Acceleration Probe), the agency’s Carruthers Geocorona Observatory, and National Oceanic and Atmospheric Administration’s (NOAA) Space Weather Follow On–Lagrange 1 (SWFO-L1) spacecraft lifts off from Launch Complex 39A at NASA’s Kennedy Space Center in Florida at 7:30 a.m. EDT Wednesday, Sept. 24, 2025. The missions will each focus on different effects of the solar wind — the continuous stream of particles emitted by the Sun — and space weather — the changing conditions in space driven by the Sun — from their origins at the Sun to their farthest reaches billions of miles away at the edge of our solar system.
A Northrop Grumman Cygnus XL spacecraft atop a SpaceX Falcon 9 rocket lifted off from Launch Complex 39A to the International Space Station delivering NASA science investigations, supplies, and equipment as part of the agency’s partnership to resupply the orbiting laboratory.
Northrop Grumman’s Cygnus XL cargo craft, carrying over 11,000 pounds of new science and supplies for the Expedition 73 crew, is pictured in the grips of the International Space Station’s Canadarm2 robotic arm following its capture. Both spacecraft were orbiting 257 miles above Tanzania. Cygnus XL is Northrop Grumman’s expanded version of its previous Cygnus cargo craft increasing its payload capacity and pressurized cargo volume.
NASA
OCTOBER Orion Integrated With SLS Rocket
Teams stacked NASA’s Orion spacecraft with its launch abort system on the agency’s SLS rocket in High Bay 3 of the Vehicle Assembly Building at NASA Kennedy on Oct. 20 for the agency’s Artemis II mission. Teams will begin conducting a series of verification tests ahead of rolling out the integrated SLS rocket to Launch Complex 39B for the wet dress rehearsal.
NASA’s Artemis II Orion spacecraft with its launch abort system is stacked atop the agency’s SLS (Space Launch System) rocket in High Bay 3 of the Vehicle Assembly Building at NASA’s Kennedy Space Center in Florida on Monday, Oct. 20, 2025.
NASA/Kim Shiflett
NOVEMBER NASA’s ESCAPADE Begins Journey to Mars
NASA’s ESCAPADE (Escape and Plasma Acceleration and Dynamics Explorers) twin spacecraft launched aboard Blue Origin’s New Glenn rocket on Nov. 13 from Launch Complex 36 at Cape Canaveral Space Force Station. Its twin orbiters will take simultaneous observations from different locations around Mars to reveal how the solar wind interacts with Mars’ magnetic environment and how this interaction drives the planet’s atmospheric escape.
Near Cape Canaveral Lighthouse, Blue Origin’s New Glenn rocket carrying NASA’s twin ESCAPADE (Escape and Plasma Acceleration and Dynamics Explorers) spacecraft launches at 3:55 p.m. EST, Thursday, Nov. 13, 2025, from Launch Complex 36 at Cape Canaveral Space Force Station in Florida. The ESCAPADE mission, built by Rocket Lab, will study how solar wind and plasma interact with Mars’ magnetosphere and how this interaction drives the planet’s atmospheric escape to prepare for future human missions on Mars.
Blue Origin
NASA, European Partners Launch Sea Satellite
A SpaceX Falcon 9 rocket carrying the U.S.-European Sentinel-6B satellite launched at Nov. 16 from Space Launch Complex 4 East at Vandenberg Space Force Base in California. Sentinel-6B will observe Earth’s ocean, measuring sea levels to improve weather forecasts and flood predictions, safeguard public safety, benefit commercial industry, and protect coastal infrastructure.
A SpaceX Falcon 9 rocket carrying the international Sentinel-6B spacecraft lifts off from Space Launch Complex 4 East at Vandenberg Space Force Base in California at 9:21 p.m. PST Sunday, Nov. 16, 2025. A collaboration between NASA, ESA (European Space Agency), EUMETSAT (European Organisation for the Exploitation of Meteorological Satellites), and the National Oceanic and Atmospheric Administration (NOAA), Sentinel-6B is designed to measure sea levels down to roughly an inch for about 90% of the world’s oceans.
SpaceX
DECEMBER
NASA astronauts Reid Wiseman, Victor Glover, Christina Koch, and CSA astronaut Jeremy Hansen participated in a dry dress rehearsal at NASA Kennedy on Dec. 20 to mimic launch day operations for the Artemis II launch. The crew donned their spacesuits, exited the Neil A. Operations and Checkout Building, and took the journey to the Vehicle Assembly Building, up the mobile launcher to the crew access arm, and entered the Orion spacecraft that will take them around the Moon and back to Earth.
From right to left, NASA astronauts Christina Koch, mission specialist; Reid Wiseman, commander; Victor Glover, pilot; and CSA (Canadian Space Agency) astronaut Jeremy Hansen, mission specialist are seen as they depart the Neil A. Armstrong Operations and Checkout Building to board their Orion spacecraft atop NASA’s Space Launch System rocket inside the Vehicle Assembly Building as part of the Artemis II countdown demonstration test, Saturday, Dec. 20, 2025, at NASA’s Kennedy Space Center in Florida. For this operation, the Artemis II crew and launch teams are simulating the launch day timeline including suit-up, walkout, and spacecraft ingress and egress. Through the Artemis campaign, NASA will send astronauts to explore the Moon for scientific discovery, economic benefits, and to build the foundation for the first crewed missions to Mars, for the benefit of all.
Always check local laws and ensure compliance to avoid any issues.
How to Choose the Right Weed Subscription Box
Consider the following factors when choosing a subscription box:
Your Budget: Determine how much you’re willing to spend monthly.
Your Preferences: Do you prefer accessories, cannabis products, or a mix of both?
Your Location: Check if the subscription box ships to your area.
Subscription Flexibility: Some boxes allow one-time purchases, while others require a monthly commitment.
Themes and Personalization: Look for boxes that align with your lifestyle or offer personalized curation.
Conclusion
Weed subscription boxes are a fantastic way to discover new products, save money, and enjoy the convenience of home delivery.
Whether you’re a seasoned cannabis user or a curious beginner, there’s a box tailored to your needs.
With options ranging from budget-friendly essentials to high-end cannabis products, there’s something for everyone. Explore the options above and elevate your cannabis experience today!
FAQs
Are weed subscription boxes worth it? Yes! They offer great value for money, especially if you enjoy trying new products and accessories.
Can I gift a weed subscription box? Absolutely! Many subscription services offer gift options.
Do these boxes include actual cannabis? Some, like Nugg Club and Lucky Box Club, include cannabis products, while others focus on accessories.
Can I cancel my subscription anytime? Most subscription boxes offer flexible cancellation policies. Check the terms before subscribing.
Russian crypto traders have been looking to obtain unrestricted accounts for global exchanges as their access to such platforms is limited. Over the past year, the offering of such accounts on the dark web has increased significantly, cybersecurity experts told the Russian press.
Supply of Crypto Exchange Accounts for Russian Users Doubles in a Year of Sanctions
More and more ready-to-use accounts for cryptocurrency exchanges are being sold to Russian residents. While this is not a new phenomenon — such accounts are often employed by fraudsters and money launderers — the current growth in supply has been attributed to the restrictions imposed by the trading platforms on customers from Russia, as a result of compliance with sanctions over the war in Ukraine.
Russian residents have been buying these accounts despite the dangers, including the risk that whoever created them could maintain access after the sale, the Kommersant reported. But they are inexpensive and offers on darknet markets have doubled since early 2022, Nikolay Chursin from the Positive Technologies information security threat analysis group told the business daily.
According to Peter Mareichev, an analyst at Kaspersky Digital Footprint Intelligence, the number of new ads for ready-made and verified wallets on various exchanges reached 400 in December. Proposals to prepare fake documents for passing know-your-customer procedures also rose, the newspaper revealed in an earlier article last month.
Simple login data, username and password, is typically priced at around $50, Chursin added. And for a fully set up account, including the documents with which it was registered, a buyer would have to pay an average of $300. Dmitry Bogachev from digital threat analysis firm Jet Infosystems explained that the price depends on factors such as the country and date of registration as well as the activity history. Older accounts are more expensive.
Sergey Mendeleev, CEO of defi banking platform Indefibank, pointed out that there are two categories of buyers — Russians that have no other choice as they need an account for everyday work and those who use these accounts for criminal purposes. Igor Sergienko, director of development at cybersecurity services provider RTK-Solar, is convinced that demand is largely due to crypto exchanges blocking Russian accounts or withdrawals to Russian bank cards in recent months.
Major crypto service providers, including leading digital asset exchanges, have complied with financial restrictions introduced by the West in response to Russia’s invasion of Ukraine. Last year, the world’s largest crypto trading platform, Binance, indicated that, while restricting sanctioned individuals and entities, it was not banning all Russians.
However, since the end of 2022, a number of Russian users of Binance have complained about having their accounts blocked without explanation, as reported by Forklog. Many experienced problems for weeks, including suspended withdrawals amid prolonged checks, affected customers said. The company told the crypto news outlet that the blocking of users from Eastern Europe and the Commonwealth of Independent States was related to the case with the seized crypto exchange Bitzlato.
Do you think the restrictions will push more Russians towards buying ready-made accounts for cryptocurrency exchanges? Share your thoughts on the subject in the comments section below.