NASA and CNES's SWOT satellite captured the first high-resolution, wide-swath image of a major tsunami in the open ocean after the July 2025 Kuril-Kamchatka quake. "Instead of a single neat crest racing across the basin, the image revealed a complicated, braided pattern of energy dispersing and scattering over hundreds of miles," reports Earth.com. "These are details that traditional instruments almost never resolve. They suggest the physics we use to forecast tsunami hazards -- especially the assumption that the largest ocean-crossing waves travel as largely "non-dispersive" packets -- need a revision." From the report: Three takeaways emerge. First, high-resolution satellite altimetry can see the internal structure of a tsunami in mid-ocean, not just its presence. Second, researchers now argue that dispersion -- often downplayed for great events -- may shape how energy spreads into leading and trailing waves, which could alter run-up timing and the force on harbor structures. Third, combining satellite swaths, DART time series, seismic records, and geodetic deformation gives a more faithful picture of the source and its evolution along strike.
For tsunami modelers and hazard planners, the message is equal parts caution and opportunity. The physics now has to catch up with the complexity that SWOT has revealed, and planners need forecasting systems that can merge every available data stream. The waves won't get any simpler -- but our predictions can get a lot sharper. The findings have been published in the journal The Seismic Record.
Nature has retracted a headline-grabbing climate-economics study after critics found flawed data that massively inflated its predicted global economic collapse. The New York Times reports: The decision came after a team of economists noticed problems with the data for one country, Uzbekistan, that significantly skewed the results. If Uzbekistan were excluded, they found, the damages would look similar to earlier research (PDF). Instead of a 62 percent decline in economic output by 2100 in a world where carbon emissions continue unabated, global output would be reduced by 23 percent.
Of course, erasing more than 20 percent of the world's economic activity would still be a devastating blow to human welfare. The paper's detractors emphasize that climate change is a major threat, as recent meta analyses have found, and that more should be done to address it -- but, they say, unusual results should be treated skeptically. "Most people for the last decade have thought that a 20 percent reduction in 2100 was an insanely large number," said Solomon Hsiang, a professor of global environmental policy at Stanford University who co-wrote the critique published in August. "So the fact that this paper is coming out saying 60 percent is off the chart."
The XRP price is rebounding sharply as the broader crypto market slowly recovers from a months-long downtrend. Although XRP is still more than 43% below its all-time high, a market analyst has outlined what needs to happen before the cryptocurrency can rally again. The analyst has shared a rather blunt assessment of XRP’s recent performance, highlighting its vulnerability and weakened price action.
XRP Price Rally Hinges On Bitcoin’s Recovery
A crypto market expert identified as ‘Guy on Earth’ has issued a fresh warning on X, highlighting that the XRP price is currently sitting at precarious levels and “hanging on for its dear life.” His outlook was cautious as he stated that the cryptocurrency is barely maintaining a crucial monthly bull market support level.
In his view, a potential XRP price rally now depends on a shift in Bitcoin’s behavior. The analyst explained that the altcoin market has suffered from maximum stress in recent months and will only begin to recover once BTC stages a rebound. He highlighted that the cryptocurrency needs to trigger a recovery rally while its dominance levels decline, giving altcoins enough room to regain former momentum and stage a rally.
Without this change in Bitcoin, the pressure on XRP is likely to continue. Recently, BTC climbed roughly 7% and is now trading above $93,000. Within the same period, the XRP price has surged more than 9% to $2.19. This trend highlights a correlation between Bitcoin’s positive price action and XRP’s upward movement.
Despite the recovery, Guy on Earth has warned investors and traders to stay realistic and manage their exposure carefully, given the market’s fragile state. His accompanying chart supports this caution. It shows that following a sharp impulse move that pushed XRP into a multi-year high zone, the price has stalled beneath a clear ceiling marked by repeated monthly rejections. Below the price structure, XRP’s Relative Strength Index (RSI) has declined, reflecting fading strength.
XRP Price To 10x In 2026 Crypto Super Cycle
Presenting a more bullish outlook for XRP, crypto analyst Amonyx has examined its price potential within the broader altcoin market cycle. He suggested that the crypto supercycle in 2026 will be massive. His analysis places XRP at the centre of this bullish expansion, predicting a powerful price surge.
Amonyx shared a chart illustrating three distinct altcoin seasons during past bull market cycles, each marked by explosive performances relative to Bitcoin. The first two cycles show a massive surge followed by prolonged cooldown periods. The current cycle highlights a larger structure, suggesting that the upcoming altcoin season in 2026 could be more powerful than the last two. If this trend holds, the analyst predicts that XRP’s price could skyrocket 10x from its current level of $2.19 to approximately $22.
Proxyearth is a new site that shows names, Aadhaar numbers, and live locations of users in India using only mobile numbers, raising serious privacy and security concerns.
The British government said it opposes attempts to cool the planet by spraying millions of tons of dust into the atmosphere -- but did not close the door to a debate on regulating the technology. From a report: The comments in parliament Thursday came after a POLITICO investigation revealed an Israeli-U.S. company Stardust Solutions aimed to be capable of deploying solar radiation modification, as the technology is called, inside this decade. "We're not in favor of solar radiation modification given the uncertainty around the potential risks it poses to the climate and environment," Leader of the House of Commons Alan Campbell said on behalf of the government.
Black fungus found growing inside Chernobyl's destroyed reactor may be feeding on radiation, and researchers have tested samples of the same species aboard the International Space Station to explore whether it could eventually shield astronauts from cosmic rays. Ukrainian scientist Nelli Zhdanova first discovered the melanin-rich mould colonizing the walls and ceilings of the exploded reactor building during a May 1997 survey. Her research indicated that the fungal hyphae were actually growing toward sources of ionizing radiation rather than merely tolerating it.
In 2007, nuclear scientist Ekaterina Dadachova at the Albert Einstein College of Medicine found that melanised fungi grew 10% faster when exposed to radioactive caesium compared to control samples, leading her to propose "radiosynthesis" -- a process where organisms convert radiation into metabolic energy. The same strain, Cladosporium sphaerospermum, traveled to the ISS in December 2018 and grew an average of 1.21 times faster over 26 days compared to Earth-based controls. Nils Averesch, a biochemist at the University of Florida and co-author of that study, remains cautious about attributing the growth boost to radiation harvesting since zero gravity could also be responsible.
A new study published in Communications Earth & Environment has reconstructed the climate conditions of the ancient Indus River Valley civilization between 3000 and 1000 B.C., finding that four intense droughts -- each lasting more than 85 years -- likely drove the gradual decline of one of the world's earliest advanced societies.
The research team, led by Hiren Solanki at the Indian Institute of Technology, Gandhinagar, combined paleoclimate data from cave formations and lake records with computer models to determine that the region shifted from wetter-than-present monsoon conditions to prolonged dry spells as the tropical Pacific Ocean warmed. The third drought, peaking around 1733 B.C., proved the most severe: it lasted 164 years, reduced annual rainfall by 13%, and affected nearly the entire region.
Overall temperatures rose by 0.5 degrees Celsius and rainfall dropped between 10 and 20%. These changes shrank lakes and rivers, dried soils, and made agriculture increasingly difficult in areas away from major waterways. Harappan settlements progressively relocated eastward toward the Indus River over roughly 2,000 years. The civilization's long survival under repeated climate stress -- through crop switching, trade diversification, and settlement relocation -- offers lessons for modern communities facing environmental pressures, the researchers said.
Researchers at the Pacific Institute documented 420 water-related conflicts globally in 2024, a record that far surpasses the 355 incidents logged in 2023 and continues a trend that has seen such violence more than quadruple over the past five years. The Oakland-based water think tank's database tracks disputes where water triggered violence, where water systems were targeted, and where infrastructure became collateral damage in broader conflicts.
The Middle East reported the most incidents at 138, including 66 tied to the Israeli-Palestinian conflict. The Israeli military destroyed more than 30 wells in Rafah and Khan Yunis, and there were numerous reports of settlers destroying pipelines and tanks in the West Bank. The Russia-Ukraine war accounted for 51 incidents, including strikes that disrupted water service in Ukrainian cities.
Malaysia's Johor, one of Southeast Asia's fastest-growing data center hubs, has announced it will no longer approve applications for Tier 1 and Tier 2 data centers because of their enormous water consumption -- up to 50 million liters daily, or roughly 200 times what higher-tier facilities require.
The Malaysian state has approved 51 data center projects as of November 2025. 17 centers are already operational, 11 are under construction and 23 received approval this year. The announcement follows concerns raised by a local politician who pointed to water supply disruptions in Georgia in the US after a data center began operations and protests in Uruguay over fears that data centers could affect farms.
schwit1 writes: Indonesia's capital, Jakarta, tops a ranking that is increasingly dominated by Asia: the world's most populated city. It edged out Bangladesh's capital, Dhaka, and Japan's Tokyo to earn the title in a new United Nations report. [PDF]
With an estimated population of nearly 42 million residents, Jakarta soared from 33rd place in the previous rankings, in 2018, that were topped by Tokyo. It's followed by Dhaka, with 36 million, which the report says is "expected to become the world's largest city by mid-century."
Scientists report that the Antarctic ozone hole in 2025 is the fifth-smallest since 1992, thanks largely to decades of global restrictions on ozone-depleting chemicals under the Montreal Protocol. ABC News reports: The ozone hole reached its greatest one-day extent for 2025 in early September, measuring 8.83 million square miles, about 30% smaller than the largest hole on record in 2006. NOAA and NASA scientists emphasize that recent findings show efforts to limit ozone-depleting chemical compounds can have a significant impact. The regulations are established by the Montreal Protocol, which went into effect in 1992. Subsequent amendments are driving the gradual recovery of the ozone layer, which remains on track to fully recover later this century as countries worldwide replace harmful substances with safer alternatives.
For decades, chlorofluorocarbons (CFCs) and other ozone-depleting compounds were widely used in aerosol sprays, foams, air conditioners and refrigerators, causing significant reductions in ozone levels. Natural factors, such as temperature and atmospheric circulation, also influence ozone concentrations and are likely to have contributed to a smaller ozone hole this year, according to researchers. "This year's hole would have been more than one million square miles larger if there was still as much chlorine in the stratosphere as there was 25 years ago," said Paul Newman, a senior scientist at the University of Maryland system and longtime leader of NASA's ozone research team.
NASA, NOAA Rank 2025 Ozone Hole as 5th Smallest Since 1992
While continental in scale, the ozone hole over the Antarctic was small in 2025 compared to previous years and remains on track to recover later this century, NASA and the National Oceanic and Atmospheric Administration (NOAA) reported. The hole this year was the fifth smallest since 1992, the year a landmark international agreement to phase out ozone-depleting chemicals began to take effect.
At the height of this year’s depletion season from Sept. 7 through Oct. 13, the average extent of the ozone hole was about 7.23 million square miles (18.71 million square kilometers) — that’s twice the area of the contiguous United States. The 2025 ozone hole is already breaking up, nearly three weeks earlier than usual during the past decade.
This map shows the size and shape of the ozone hole over the South Pole on the day of its 2025 maximum extent. Moderate ozone losses (orange) are visible amid areas of more potent ozone losses (red). Scientists describe the ozone “hole” as the area in which ozone concentrations drop below the historical threshold of 220 Dobson units.
NASA Earth Observatory image by Lauren Dauphin, using data courtesy of NASA Ozone Watch and GEOS-5 data from the Global Modeling and Assimilation Office at NASA GSFC
The hole reached its greatest one-day extent for the year on Sept. 9 at 8.83 million square miles (22.86 million square kilometers). It was about 30% smaller than the largest hole ever observed, which occurred in 2006, and had an average area of 10.27 million square miles (26.60 million square kilometers).
“As predicted, we’re seeing ozone holes trending smaller in area than they were in the early 2000s,” said Paul Newman, a senior scientist with the University of Maryland, Baltimore County, and leader of the ozone research team at NASA’s Goddard Space Flight Center in Greenbelt, Maryland. “They’re forming later in the season and breaking up earlier. But we still have a long way to go before it recovers to 1980s levels.”
NASA and NOAA scientists say this year’s monitoring showed that controls on ozone-depleting chemical compounds established by the Montreal Protocol and subsequent amendments are driving the gradual recovery of the ozone layer in the stratosphere, which remains on track to recover fully later this century.
The ozone-rich layer acts as a planetary sunscreen that helps shield life from harmful ultraviolet (UV) radiation from the Sun. It is located in the stratosphere, which is found between 7 and 31 miles above the Earth’s surface. Reduced ozone allows more UV rays to reach the surface, resulting in crop damage as well as increased cases of skin cancer and cataracts, among other adverse health impacts.
The ozone depletion process starts when human-made compounds containing chlorine and bromine rise high into the stratosphere miles above Earth’s surface. Freed from their molecular bonds by the more intense UV radiation, the chlorine and bromine-containing molecules then participate in reactions that destroy ozone molecules. Chlorofluorocarbons and other ozone-depleting compounds were once widely used in aerosol sprays, foams, air conditioners, and refrigerators. The chlorine and bromine from these compounds can linger in the atmosphere for decades to centuries.
“Since peaking around the year 2000, levels of ozone-depleting substances in the Antarctic stratosphere have declined by about a third, relative to pre-ozone-hole levels,” said Stephen Montzka, a senior scientist with NOAA’s Global Monitoring Laboratory.
As part of the 1987 Montreal Protocol, countries agreed to replace ozone-depleting substances with less harmful alternatives.
“This year’s hole would have been more than one million square miles larger if there was still as much chlorine in the stratosphere as there was 25 years ago,” Newman said.
Still, the now-banned chemicals persist in old products like building insulation and in landfills. As emissions from those legacy uses taper off over time, projections show the ozone hole over the Antarctic recovering around the late 2060s.
NASA and NOAA previously ranked ozone hole severity using a time frame dating back to 1979, when scientists began tracking Antarctic ozone levels with satellites. Using that longer record, this year’s hole area ranked 14th smallest over 46 years of observations.
Factors like temperature, weather, and the strength of the wind encircling Antarctica known as the polar vortex also influence ozone levels from year to year. A weaker-than-normal polar vortex this August helped keep temperatures above average and likely contributed to a smaller ozone hole, said Laura Ciasto, a meteorologist with NOAA’s Climate Prediction Center.
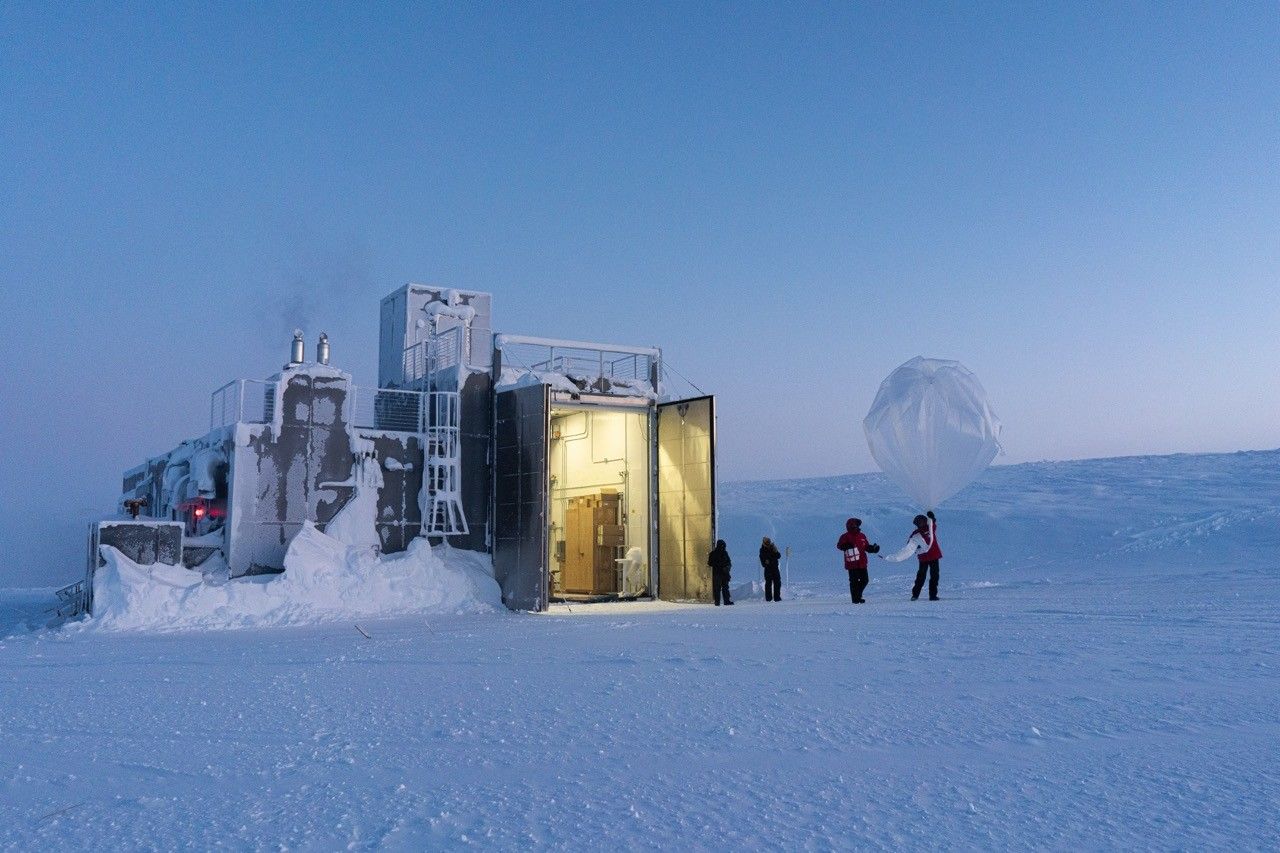
NOAA scientists also use instruments carried on weather balloons and upward-looking surface-based instruments to measure stratospheric ozone directly above the South Pole Atmospheric Baseline Observatory. Balloon data showed that the ozone concentration reached its lowest value of 147 Dobson Units this year on Oct. 6. The lowest value ever recorded over the South Pole was 92 Dobson Units in October 2006.
NOAA scientists launch a weather balloon carrying an ozonesonde near the South Pole in September 2025.
Simeon Bash/IceCube – courtesy of NOAA
The Dobson Unit is a measurement that indicates the total number of ozone molecules present throughout the atmosphere above a certain location. A measurement of 100 Dobson Units corresponds to a layer of pure ozone 1 millimeter thick — about as thick as a dime — at standard temperature and pressure conditions.
View the latest status of the ozone layer over the Antarctic with NASA’s ozone watch.
We’ve probably all had a few conversations with people who hold eccentric scientific ideas, and most of the time they yield nothing more than frustration and perhaps a headache. In [Bertrand Selva]’s case, however, a conversation with a flat-earth believer yielded a device that uses a pair of gyroscopes to detect earth’s rotation, demonstrating that rotation exists without the bulkiness of a Foucalt pendulum.
[Bertrand] built his apparatus around a pair of BMI160 MEMS gyroscopes, which have a least significant bit for angular velocity corresponding to 0.0038 degrees per second, while the earth rotates at 0.00416 degrees per second. To extract such a small signal from all the noise in the measurements, the device makes measurements with the sensors in four different positions to detect and eliminate the bias of the sensors and the influence of the gravitational field. Before running a test, [Bertrand] oriented the sensors toward true north, then had a stepper motor cycle the sensors through the four positions, while a Raspberry Pi Pico records 128 measurements at each position. It might run the cycle as many as 200 times, with error tending to decrease as the number of cycles increases.
A Kalman filter processes the raw data and extracts the signal, which came within two percent of the true rotational velocity. [Bertrand] found that the accuracy was strongly dependent on how well the system was aligned to true north. Indeed, the alignment effect was so strong that he could use it as a compass.
In the end, the system didn’t convince [Bertrand]’s neighbor, but it’s an impressive demonstration nonetheless. This system is a bit simpler, but it’s also possible to measure the earth’s rotation using a PlayStation. For higher precision, check out how the standards organizations manage these measurements.
Preparations for Next Moonwalk Simulations Underway (and Underwater)
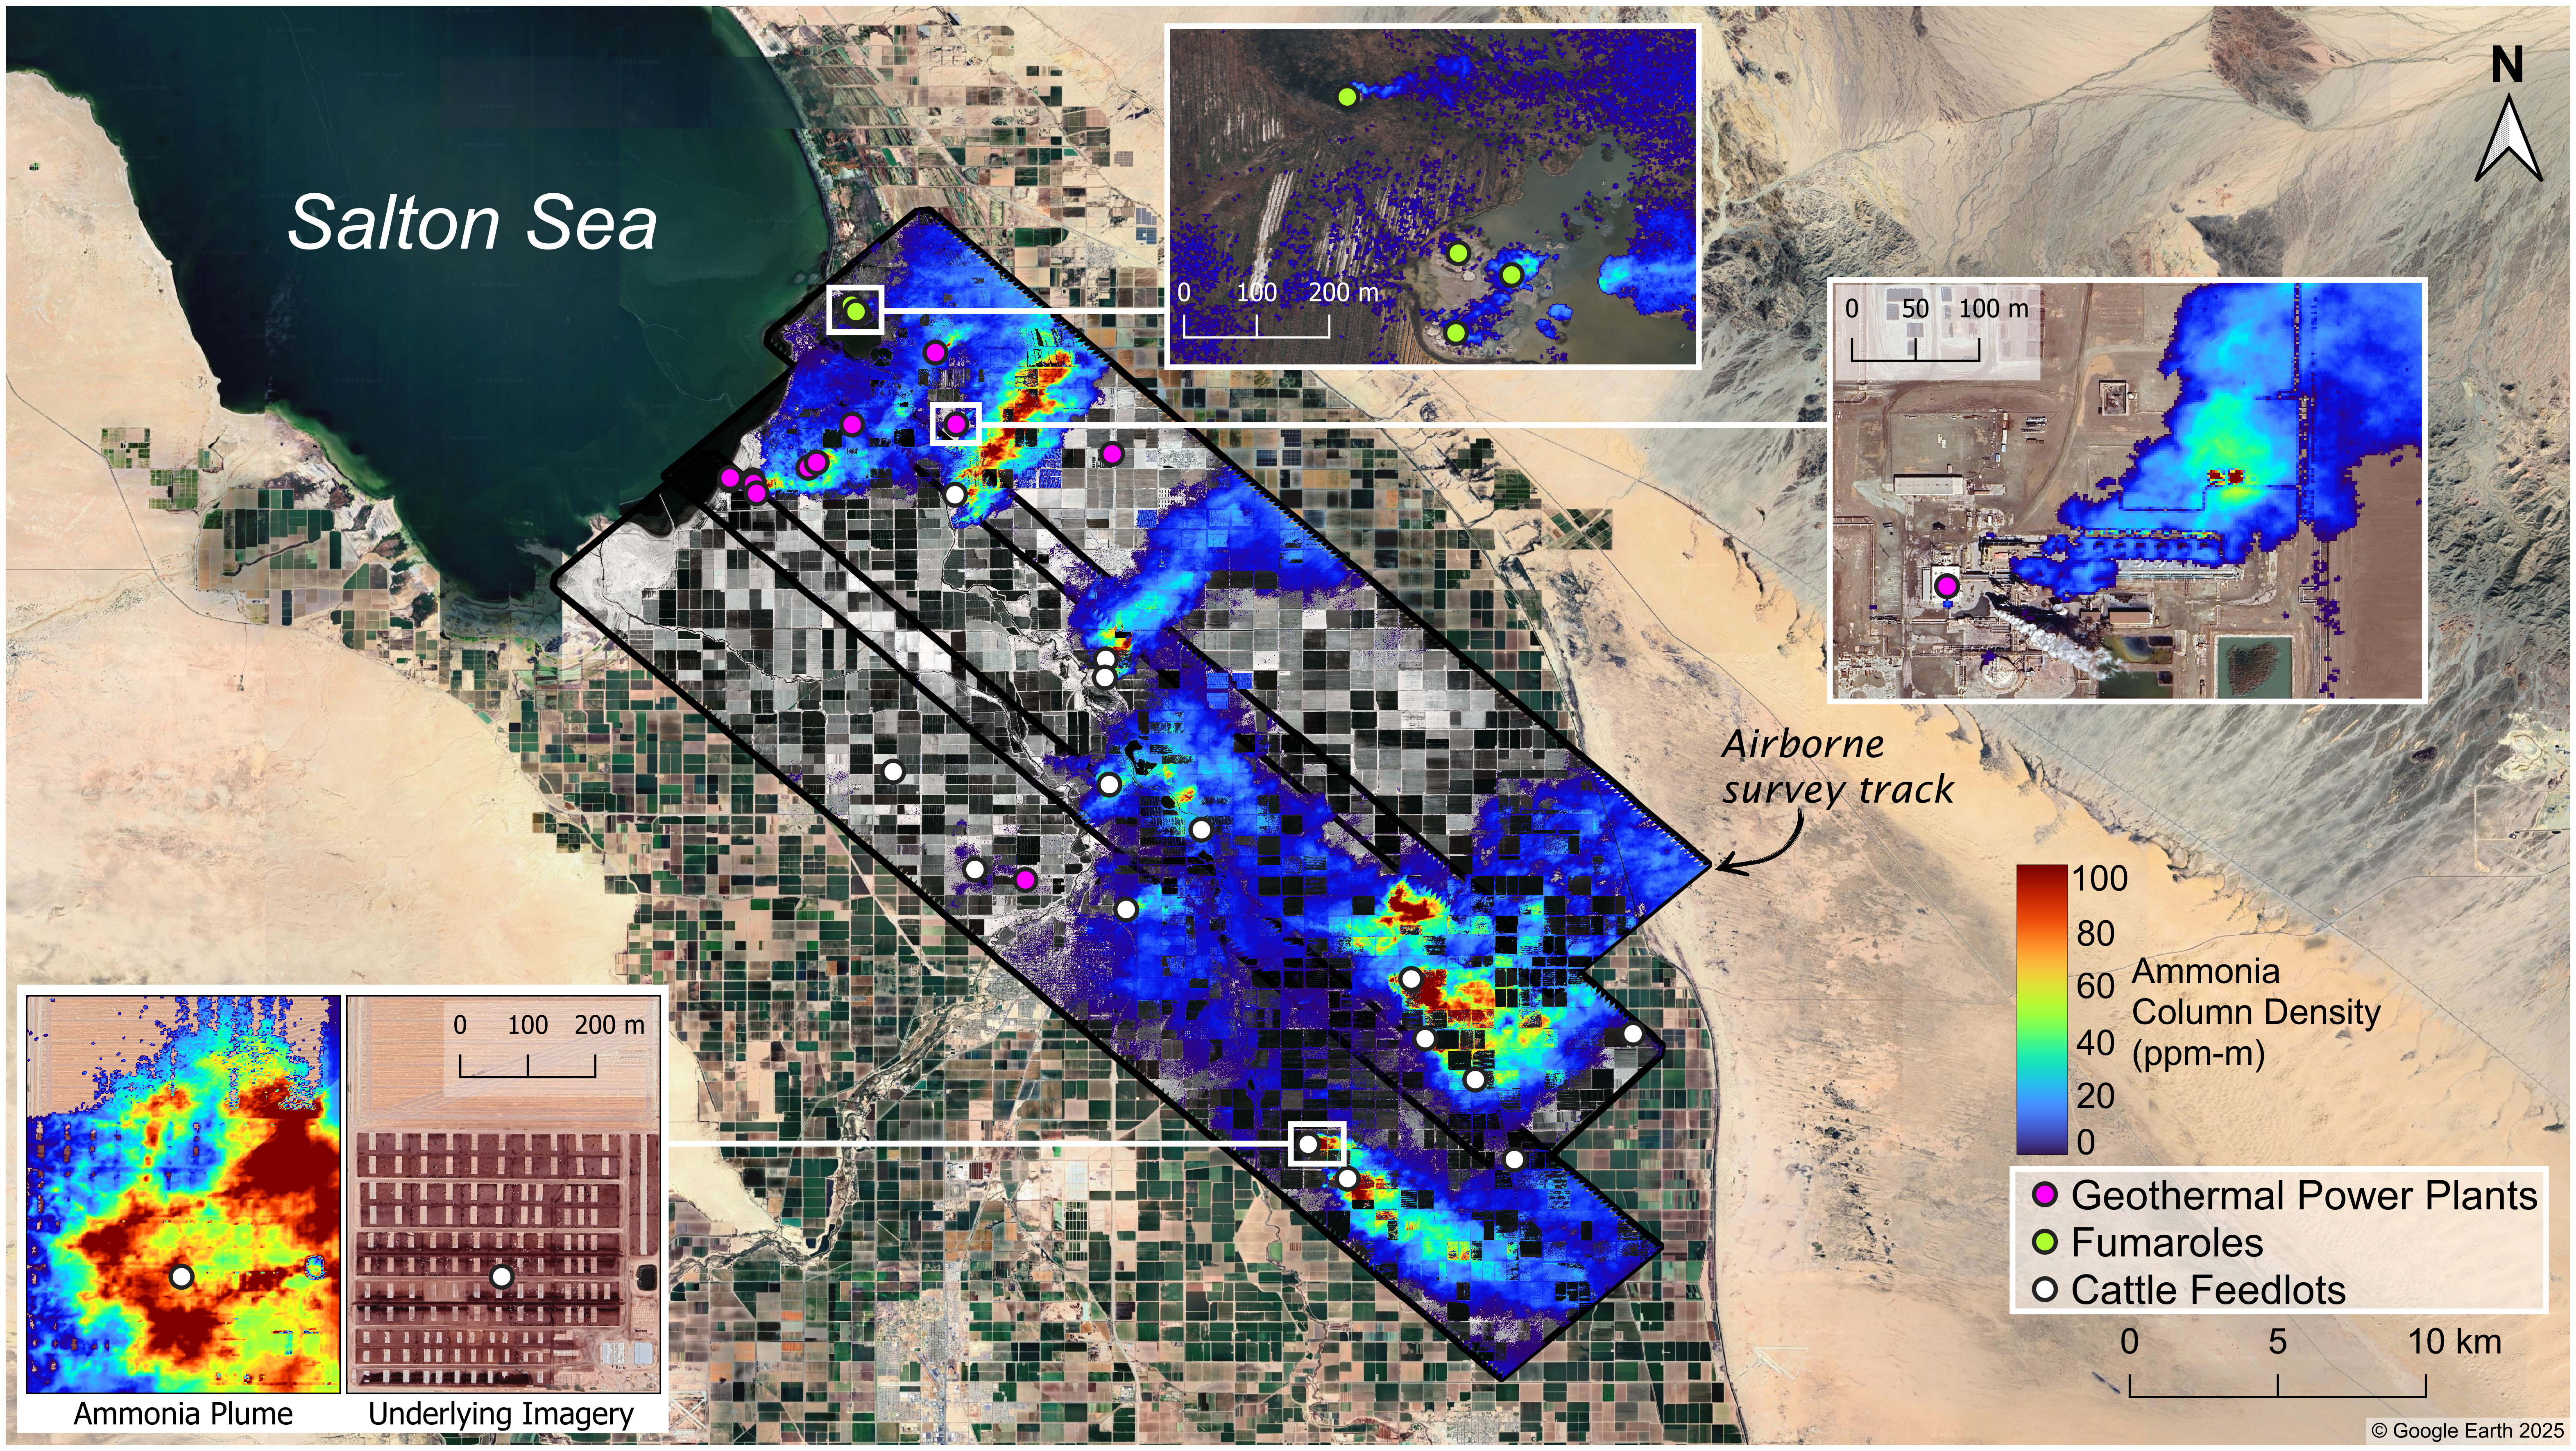
Researchers used data taken in March 2023 by an airborne imaging spectrometer to map ammonia emissions in the Imperial Valley. Produced by agricultural activities as well as geothermal processes, ammonia is a precursor to particulate matter, which can cause adverse health outcomes when inhaled.
NASA/JPL-Caltech
The pungent gas contributes to fine airborne particulate pollution, which endangers human health when inhaled and absorbed in the bloodstream.
A recent study led by scientists at NASA’s Jet Propulsion Laboratory in Southern California and the nonprofit Aerospace Corporation shows how high-resolution maps of ground-level ammonia plumes can be generated with airborne sensors, highlighting a way to better track the gas. A key chemical ingredient of fine particulate matter — tiny particles in the air known to be harmful when inhaled — ammonia can be released through agricultural activities such as livestock farming and geothermal power generation as well as natural geothermal processes. Because it’s not systematically monitored, many sources of the pungent gas go undetected.
Published in Atmospheric Chemistry and Physics in October, the study focuses on a series of 2023 research flights that covered the Imperial Valley to the southeast of the Salton Sea in inland Southern California, as well as the Eastern Coachella Valley to its northwest. Prior satellite-based research has identified the Imperial Valley as a prolific source of gaseous ammonia. In the study, scientists employed an airborne sensor capable of resolving ammonia plumes with enough detail to track their origins: Aerospace Corporation’s Mako instrument is an imaging spectrometer that observes long-wave infrared light emitted by areas of Earth’s surface and atmosphere 6 feet (2 meters) across.
Using the instrument, which can detect ammonia’s chemical signature by the infrared light it absorbs, the authors found elevated levels of the gas near several sources, including agricultural fields, livestock feedlots, geothermal plants, and geothermal vents. Measurements in parts of the Imperial Valley were 2½ to eight times higher than in Coachella Valley’s Mecca community, which had ammonia concentrations closer to background levels.
Though not toxic on its own in low concentrations, ammonia is a precursor to particulate matter, also known as aerosol or particle pollution. It reacts with other gases to form solid ammonium salt particles small enough to penetrate the bloodstream from the lungs. Particles under 2.5 micrometers in diameter — also known as PM2.5 — are associated with elevated rates of asthma, lung cancer, and cardiovascular disease, among other negative health outcomes.
“Historically, more attention has focused on primary sources of PM2.5, such as auto emissions. But with significant reductions in those emissions and increasingly stringent air quality standards, there is growing interest in understanding secondary sources that form particles in the air from precursor gases,” said Sina Hasheminassab, lead author of the paper and a research scientist at JPL. “As an important precursor to PM2.5, ammonia plays a key role, but its emissions are poorly characterized and undermonitored.”
Rising ammonia
Previous satellite-based studies have shown rising levels of atmospheric ammonia, both globally and in the continental United States. That research revealed broad trends, but with spatial resolution on the order of tens of miles, the measurements were only sufficient to identify variation over areas of hundreds of square miles or more.
The chemical behavior of ammonia also poses a particular monitoring challenge: Once emitted, it only stays in the atmosphere for hours before reacting with other compounds. In contrast, carbon dioxide can remain in the air for centuries.
Planes and satellites can provide an overview of sources and the geographic distribution of emissions at a given moment. Although satellites offer wider and more recurrent coverage, airborne instruments, being closer to the source, produce higher-resolution data and can focus on specific locations at designated times.
Those proved to be the right capabilities for the recent study. Researchers flew Mako over the Imperial and Eastern Coachella valleys on the mornings and afternoons of March 28 and Sept. 25, 2023, and took concurrent measurements on the ground with both a fixed monitoring station in Mecca operated by the South Coast Air Quality Management District (AQMD) and a mobile spectrometer developed at the University of California, Riverside.
“The goal was to show that this technique was capable of delivering data with the required accuracy that aerosol scientists and potentially even air quality regulatory bodies could use to improve the air quality in those regions,” said David Tratt, a senior scientist at Aerospace Corporation and coauthor of the paper. “We ended up with maps that identify multiple sources of ammonia, and we were able to track the plumes from their sources and observe them coalescing into larger clouds.”
Distinct plumes
During the flights, the team collected data over the southeastern coast of the Salton Sea, which straddles Riverside and Imperial counties. There, Mako revealed small plumes coming from geothermal fumaroles venting superheated water and steam that react with nitrogen-bearing compounds in the soil, releasing ammonia.
Farther to the southeast, the results showed several geothermal power plants emitting ammonia, primarily from their cooling towers, as part of their normal operations.
Farther southeast still, the researchers spotted ammonia emissions, a byproduct of animal waste, from cattle farms in the Imperial Valley. During the March 28 flight, a plume from the largest facility in the study area measured up to 1.7 miles (2.8 kilometers) wide and extended up to 4.8 miles (7.7 kilometers) downwind of the source.
‘Very large puzzle’
As part of the study, AQMD’s Mecca monitoring station recorded seasonal changes in ammonia concentrations. Given the few sources in the area, the researchers surmised that winds during certain months tend to blow the gas from Imperial Valley to the Coachella Valley.
The study underscores the benefits of detailed spatial information about ammonia emissions, and it partly informed the agency’s decision in July to expand its ammonia-monitoring network and extend the life of the Mecca station.
As a precursor to PM2.5, ammonia is “one piece of a very large puzzle” that, for Coachella Valley residents, includes vehicle emissions, desert dust, and agricultural activities, said Payam Pakbin, manager of the Advanced Monitoring Technologies Unit at AQMD and a paper coauthor.
“These communities want to know the contributions of these sources to the air quality they’re experiencing,” he added. “Findings like these help our agency better prioritize which sources require the most attention and ultimately guide our focus toward those that are the highest priority for achieving emission reductions in this community.”
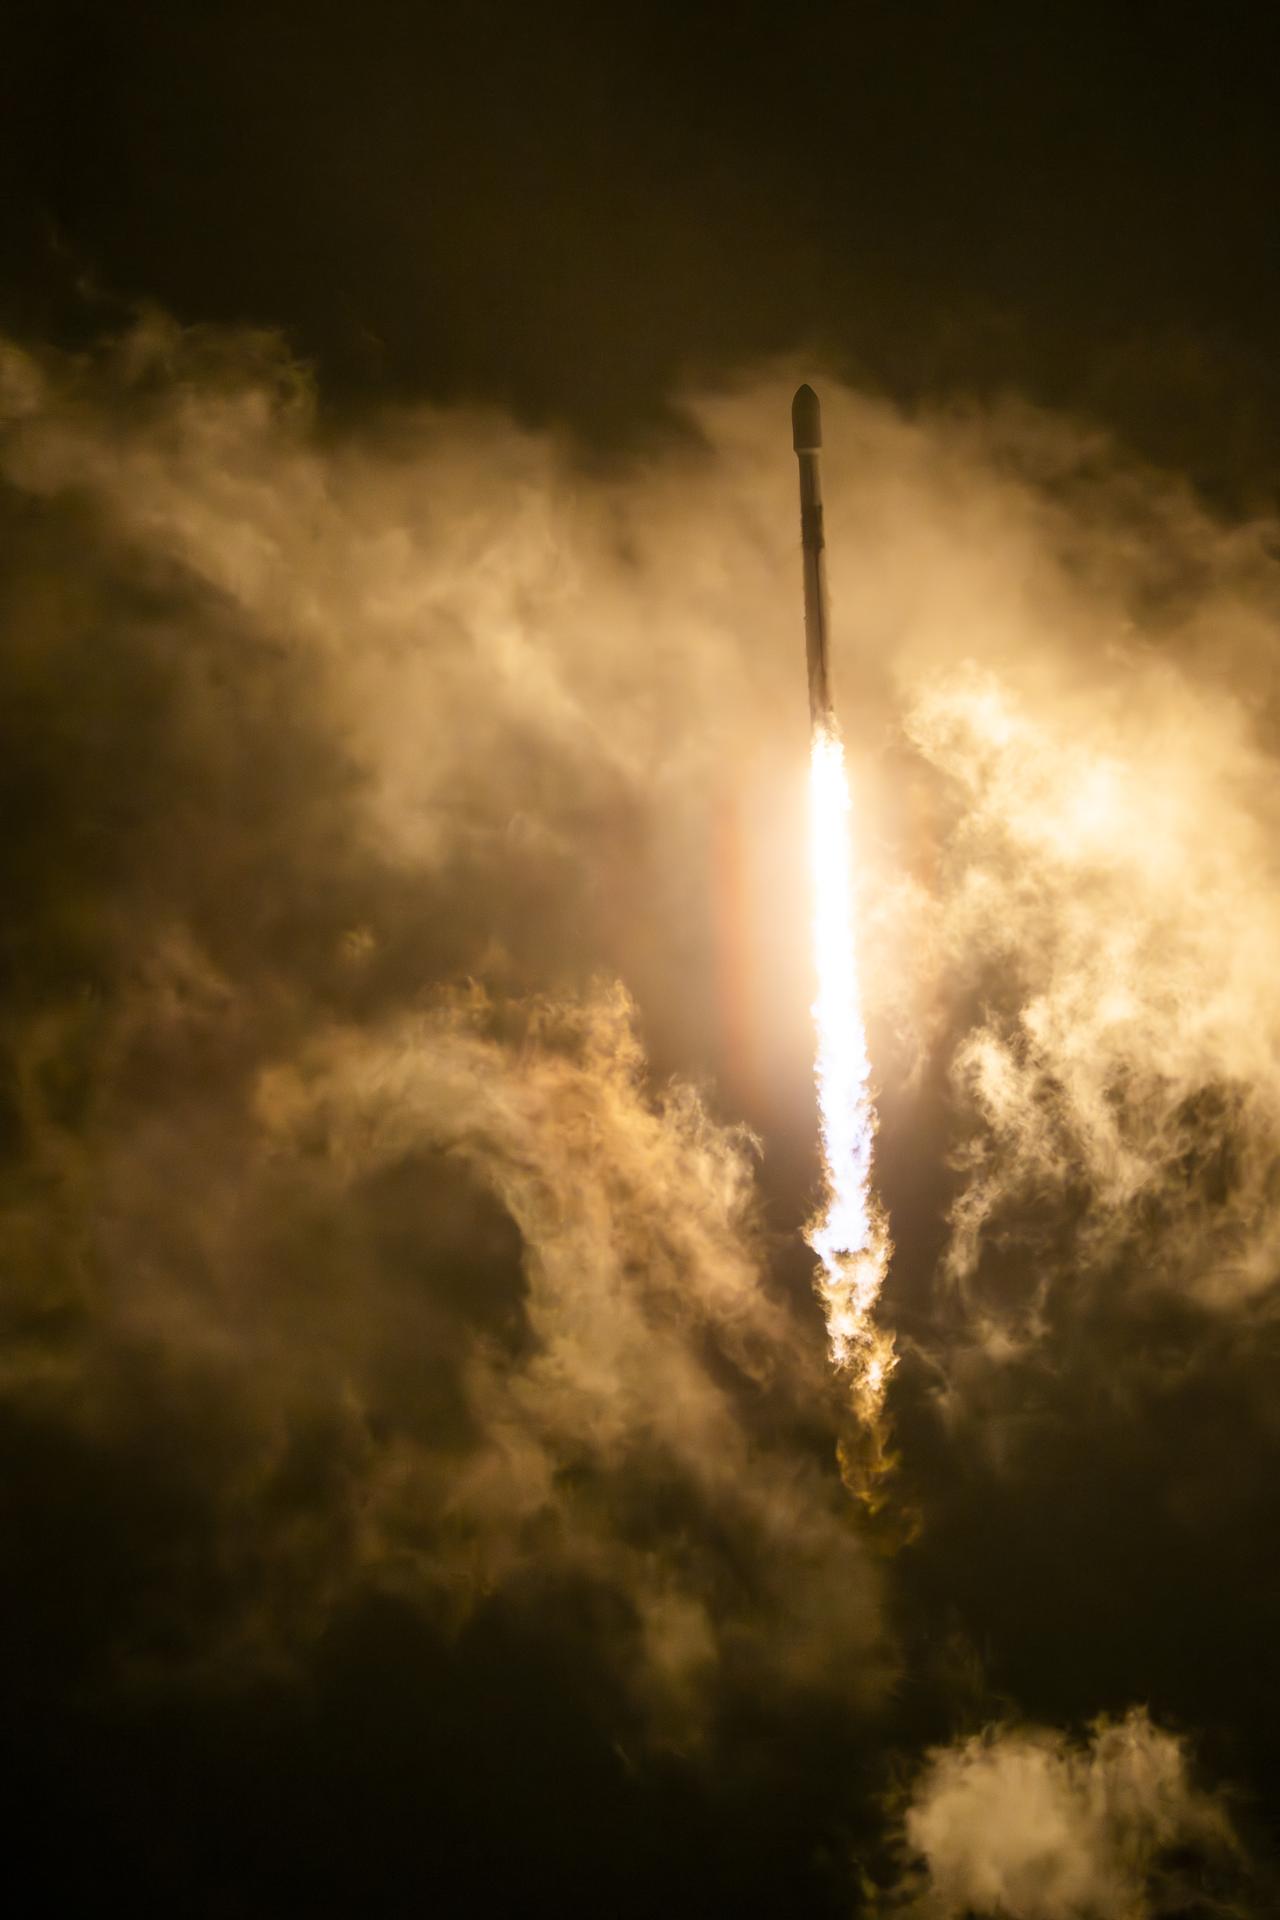
The Sentinel-6B satellite lifted off aboard a SpaceX Falcon 9 rocket from Launch Complex 4 East at Vandenberg Space Force Base in central California at 9:21 p.m. PST on Nov. 16.
Credit: NASA/Carla Thomas
About the size of a full-size pickup truck, a newly launched satellite by NASA and its partners will provide ocean and atmospheric information to improve hurricane forecasts, help protect infrastructure, and benefit commercial activities, such as shipping.
The Sentinel-6B satellite lifted off aboard a SpaceX Falcon 9 rocket from Launch Complex 4 East at Vandenberg Space Force Base in central California at 9:21 p.m. PST on Nov. 16. Contact between the satellite and a ground station in northern Canada occurred about 1 hour and 30 minutes later at 10:54 p.m. All systems are functioning normally.
“Understanding tidal patterns down to the inch is critical in protecting how we use our oceans every day on Earth,” said Nicky Fox, associate administrator, Science Mission Directorate at NASA Headquarters in Washington. “Sentinel-6B will build upon the legacy of Sentinel-6 Michael Freilich by making sea level measurements that improve forecasts used by communities, businesses, and operations across the country. It also will support a safer reentry for our astronauts returning home, including crew from Artemis Moon missions.”
Sea levels vary from place to place, and the satellite will provide accurate measurements at both local and global scales — all from hundreds of miles above in low Earth orbit. Those observations form the basis for U.S. flood predictions, which are crucial for safeguarding coastal infrastructure, real estate, energy storage sites, and other coastal assets. Sentinel-6B will take over for Sentinel-6 Michael Freilich, which launched in 2020 and later became the official reference satellite for global sea level measurements, providing sea surface height measurements against which those from other satellites are compared for accuracy.
The satellite comes from a collaboration between multiple partners, including NASA, ESA (European Space Agency), EUMETSAT (European Organisation for the Exploitation of Meteorological Satellites), and the National Oceanic and Atmospheric Administration (NOAA). It also is part of the European Union’s family of Copernicus missions.
“Collaboration between partners is key to a mission such as Sentinel-6, and my thanks go to everyone involved in developing, launching, and operating this exceptional satellite, which follows in the footsteps of the first Sentinel-6, Michael Freilich,” said Simonetta Cheli, director, ESA’s Earth Observation Programmes. “This achievement demonstrates what can be accomplished when international agencies and industries work together toward a shared goal. Sentinel-6B will ensure we continue to collect the high-precision data needed to understand our changing climate, safeguard our oceans and support decisions that protect coastal communities around the world.”
The two satellites make up the Copernicus Sentinel-6/Jason-CS (Continuity of Service) mission, the latest in a series of ocean-observing radar altimetry missions that have monitored Earth’s changing seas since the early 1990s.
As with its predecessor, Sentinel-6B satellite also will provide key information about wind speeds, wave heights, atmospheric temperature, and humidity. Moreover, because water expands as its temperature increases, researchers can tell which parts of the ocean are warmer than others based on where the sea surface height is greater.
Combined with data from other instruments, that knowledge can help in forecasting marine weather, including the development of hurricanes, which intensify with warmer water. Also, because large currents are taller than surrounding waters due to their higher temperatures, sea surface measurements can shed light on interactions between the Gulf Stream, for example, and nearby waves. Where they meet, seas can become rougher, presenting a hazard to even the largest ships.
“Sentinel-6B is a testament to the value of NASA’s partnership missions to put actionable satellite information and science into the hands of decision-makers on the ground,” said Karen St. Germain, director, NASA Earth Science Division at the agency’s headquarters. “Sentinel-6B will collect ocean surface observations that will inform decisions critical to coastal communities, commercial shipping and fishing, national defense, and emergency preparedness and response. This is what NASA does — puts advanced technology and science into action for the benefit of the nation.”
When Sentinel-6B reaches its operating elevation, the satellite will fly about 30 seconds behind Sentinel-6 Michael Freilich, which carries identical science instruments. Once the mission finishes cross-calibrating the data collected by the two, Sentinel-6 Michael Freilich will move into a different orbit, and Sentinel-6B will take over the role of official reference satellite, orbiting Earth about 13 times a day at 830 miles (1,336 kilometers) above the surface.
“Sentinel-6B demonstrates the versatile Earth science applications made possible by expertly engineered, space-based technology. The satellite’s powerful suite of instruments will measure about 90% of Earth’s oceans down to fractions of an inch — continuing to add to a vital dataset that America and a growing global community depend on,” said Dave Gallagher, director, NASA’s Jet Propulsion Laboratory (JPL) in Southern California.
More about Sentinel-6B
Copernicus Sentinel-6/Jason-CS is a collaboration between ESA, the European Union, EUMETSAT, NASA, and NOAA. French space agency CNES (Centre National d’Études Spatiales) contributed technical support. Copernicus, which includes the Sentinel missions, is the European Union’s Earth observation program led by the European Commission.
A division of Caltech in Pasadena, JPL contributed three science instruments for each Sentinel-6 satellite: the Advanced Microwave Radiometer, the Global Navigation Satellite System – Radio Occultation, and the laser retroreflector array. NASA also is contributing launch services, ground systems supporting operation of the NASA science instruments, the science data processors for two of these instruments, and support for the U.S. members of the international Ocean Surface Topography Science Team, and Sentinel-6 science teams.
Preparations for Next Moonwalk Simulations Underway (and Underwater)
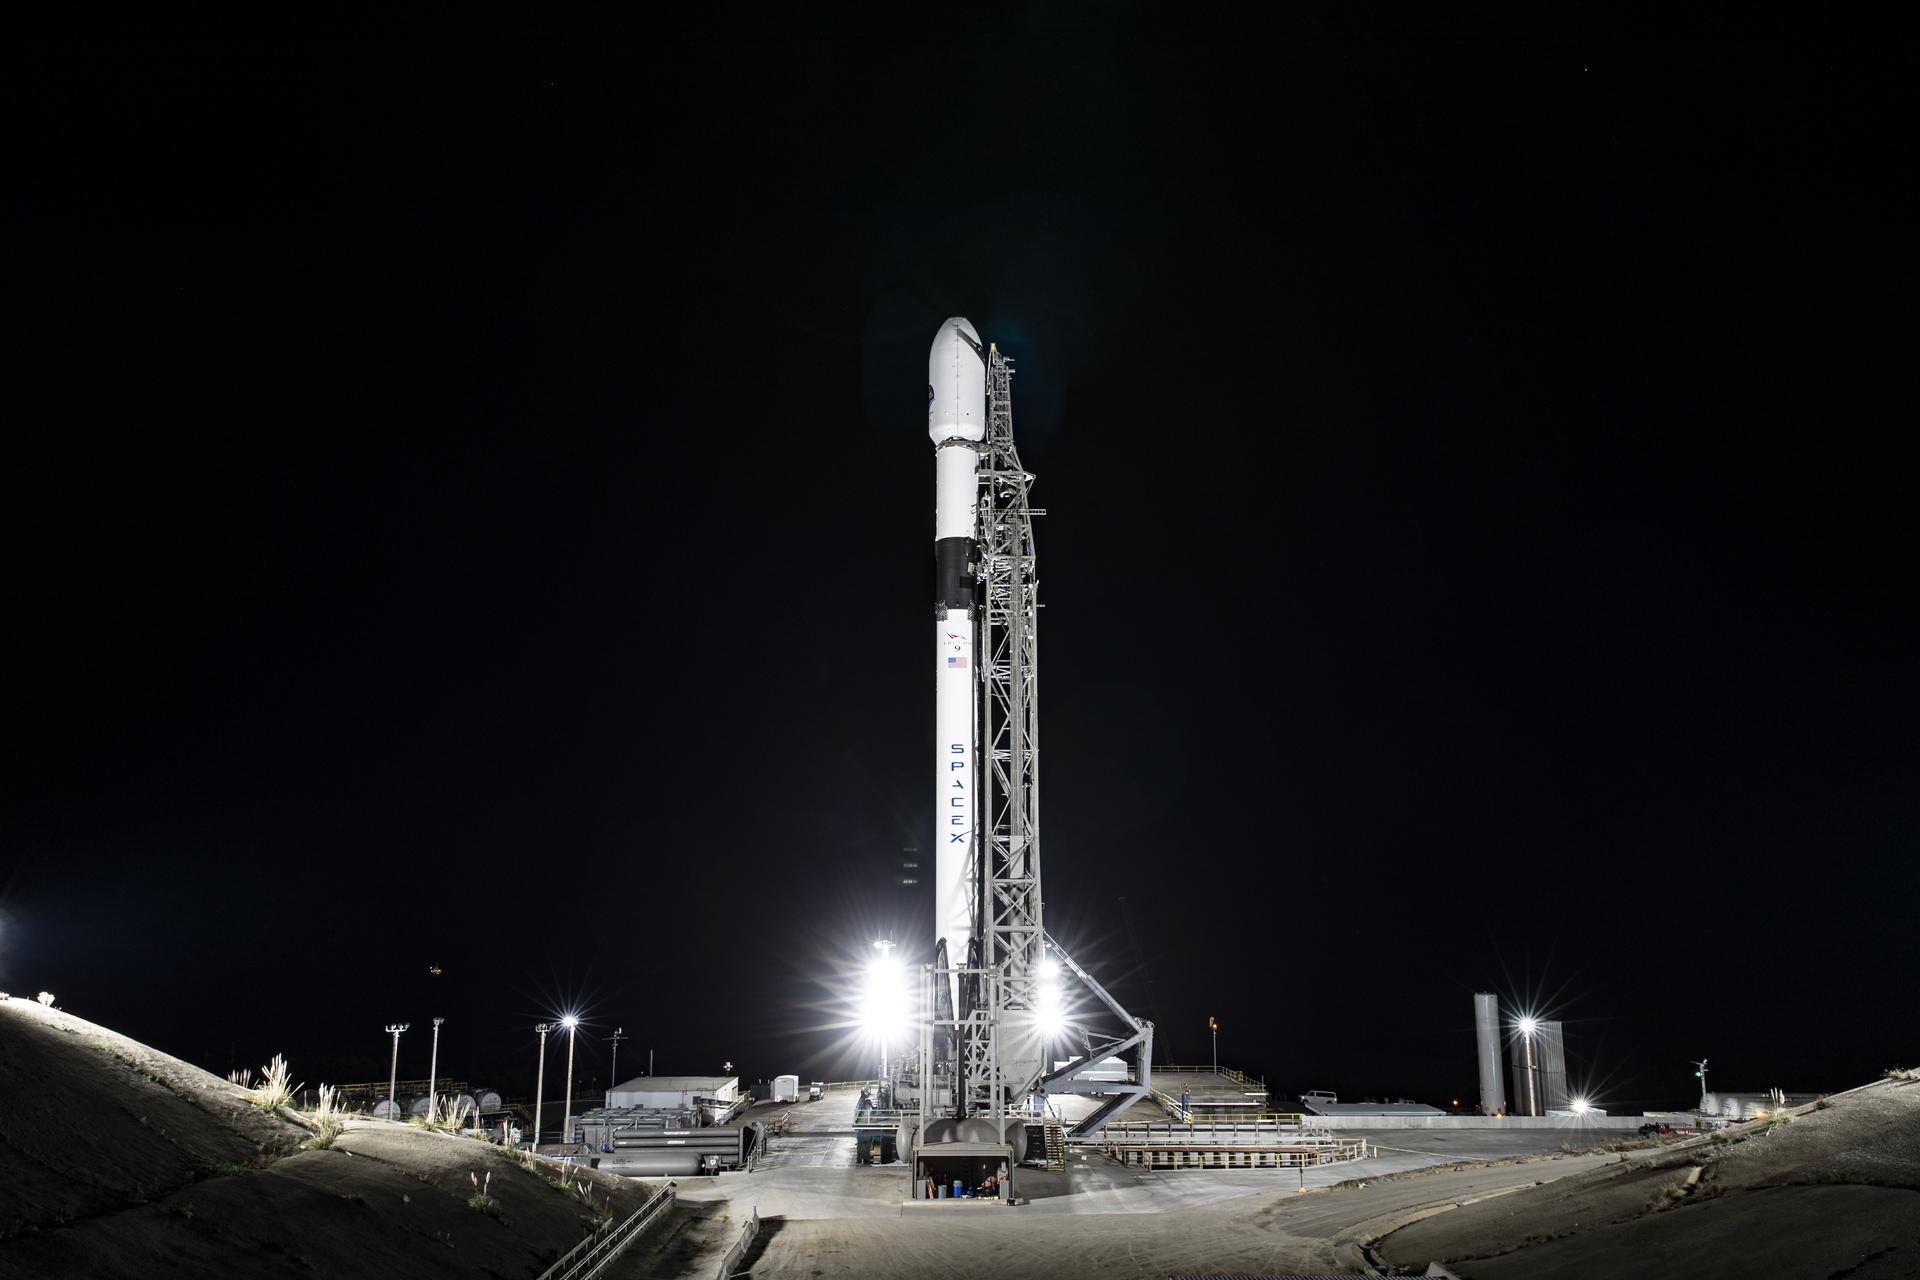
Set to launch no earlier than Nov. 16, Sentinel-6B will continue the data record now being collected by its twin satellite Sentinel-6 Michael Freilich, which lifted off from Vandenberg Space Force Base in November 2020 aboard the SpaceX Falcon 9 rocket shown here.
SpaceX
Set to track sea levels across more than 90% of Earth’s ocean, the mission must first get into orbit. Here’s what to expect.
Sentinel-6B, an ocean-tracking satellite jointly developed by NASA and ESA (European Space Agency), is ready to roll out to the launch pad, packed into the payload fairing of a SpaceX Falcon 9 rocket.
Launch is targeted at 12:21 a.m. EST, Monday, Nov. 17 (9:21 p.m. PST, Sunday, Nov. 16). Once it lifts off from Vandenberg Space Force Base in California, the satellite will ride out a 57-minute sequence of events ending in spacecraft separation, when the satellite detaches from the rocket.
Then Sentinel-6B’s real work begins. Orbiting Earth every 112 minutes at 4.5 miles (7.2 kilometers) per second, the satellite will eventually take over for its twin, Sentinel-6 Michael Freilich, launched five years ago, to continue a multidecade dataset for sea level measurements from space. Those measurements, along with atmospheric data the mission gathers, will help improve public safety and city planning while protecting coastal infrastructure, including power plants and defense interests. NASA will also use the data to refine atmospheric models that support the safe re-entry of Artemis astronauts.
Here’s a closer look at what lies ahead for the satellite in the coming days.
Launch timeline
Measuring 19.1 feet (5.82 meters) long and 7.74 feet (2.36 meters) high (including the communications antennas), the satellite weighs in at around 2,600 pounds (1,200 kilograms) when loaded with propellant at launch.
The satellite will lift off from Space Launch Complex 4 East at Vandenberg. If needed, backup launch opportunities are available on subsequent days, with the 20-second launch window occurring about 12 to 13 minutes earlier each day.
A little more than two minutes after the Falcon 9 rocket lifts off, the main engine cuts off. Shortly after, the rocket’s first and second stages separate, followed by second-stage engine start. The reusable Falcon 9 first stage then begins its automated boost-back burn to the launch site for a powered landing. About three minutes after launch, the two halves of the payload fairing, which protected the satellite as it traveled through the atmosphere, separate and fall safely back to Earth.
The first cutoff of the second stage engine takes place approximately eight minutes after liftoff, at which point the launch vehicle and the spacecraft will be in a temporary “parking” orbit. The second stage engine fires a second time about 44 minutes later, and about 57 minutes after liftoff, the rocket and the spacecraft separate. Roughly seven minutes after that, the satellite’s solar panels deploy. Sentinel-6B is expected to make first contact with ground controllers about 35 minutes after separation (roughly an hour and a half after liftoff) — a major milestone indicating that the spacecraft is healthy.
Science mission
Following launch operations, the team will focus on its next challenge: getting the spacecraft ready for science operations. Once in orbit, Sentinel-6B will fly about 30 seconds behind its twin, the Sentinel-6 Michael Freilich satellite. When scientists and engineers have completed cross-calibrating the data collected by the two spacecraft, Sentinel-6B will take over the role of providing primary sea level measurements while Sentinel-6 Michael Freilich will move into a different orbit. From there, researchers plan to use measurements from Sentinel-6 Michael Freilich for different purposes, including helping to map seafloor features (variations in sea surface height can reveal variations in ocean floor features, such as seamounts).
Sentinel-6B is part of a U.S.-European mission that will continue 30-year-plus record of sea-level measurements. Its observations will help build an accurate picture of local and global sea surface heights to support storm forecasting, secure coastal infrastructure, and help optimize commercial activities, such as shipping. NASA/JPL-Caltech
Where to find launch coverage
Launch day coverage of the mission will be available on the agency’s website, including links to live streaming and blog updates beginning no earlier than 11 p.m. EST, Nov. 16, as the countdown milestones occur. Streaming video and photos of the launch will be accessible on demand shortly after liftoff. Follow countdown coverage on NASA’s Sentinel-6B blog.
The Copernicus Sentinel-6/Jason-CS (Continuity of Service) mission is a collaboration between NASA, ESA, EUMETSAT (European Organisation for the Exploitation of Meteorological Satellites), and the National Oceanic and Atmospheric Administration (NOAA). The European Commission contributed funding support while France’s space agency CNES (Centre National d’Études Spatiales) provided technical expertise. The mission also marks the first international involvement in Copernicus, the European Union’s Earth Observation Programme.
A division of Caltech in Pasadena, JPL built three science instruments for each Sentinel-6 satellite: the Advanced Microwave Radiometer, the Global Navigation Satellite System – Radio Occultation, and the Laser Retroreflector Array. NASA is also contributing launch services, ground systems supporting operation of the NASA science instruments, the science data processors for two of these instruments, and support for the U.S. members of the international Ocean Surface Topography and Sentinel-6 science teams. The launch service is managed by NASA’s Launch Services Program, based at the agency’s Kennedy Space Center in Florida.
NASA and its U.S. and international partners have teamed up to launch a new Earth-observing satellite called Sentinel-6B that will measure sea surface height...
Preparations for Next Moonwalk Simulations Underway (and Underwater)
Set to launch no earlier than Nov. 16, Sentinel-6B will continue a decades-long data record of sea level measurement that will help decision-makers manage coastal flooding, support hurricane intensity forecasts, and assist in the return of astronauts from space.
NASA
Data from Sentinel-6B will continue a decades-long record of sea surface height, helping to improve coastal planning, protect critical infrastructure, and advance weather forecasts.
With launch set for no earlier than 12:21 a.m. EST Monday, Nov. 17, Sentinel-6B is the latest satellite in a series of spacecraft NASA and its partners have used to measure sea levels since 1992. Their data has helped meteorologists improve hurricane forecasts, managers protect infrastructure, and coastal communities plan.
After launch, Sentinel-6B will begin the process of data cross-calibration with its predecessor, Sentinel-6 Michael Freilich, to provide essential information about Earth’s ocean.
Sentinel-6B is the second of two satellites that constitute the Sentinel-6/Jason-CS (Continuity of Service) mission, a collaboration between NASA, ESA (European Space Agency), EUMETSAT (European Organisation for the Exploitation of Meteorological Satellites), and the National Oceanic and Atmospheric Administration (NOAA). The European Commission contributed funding support while France’s space agency CNES (Centre National d’Études Spatiales) provided technical expertise.
Here are six things to know about Sentinel-6B and the broader Copernicus Sentinel-6/Jason-CS mission:
1. Sentinel-6B will deliver data on about 90% of Earth’s ocean, providing direct benefits to humanity.
Sentinel-6B will contribute to a multidecade dataset for sea level measurements from space. This data is key to helping improve public safety, city planning, and protecting commercial and defense interests.
Pioneered by NASA and its partners, the dataset enables users in government, industry, and the research community to better understand how sea levels change over time. Combined with information from other NASA satellites, data from Copernicus Sentinel-6/Jason-CS is vital for tracking how heat and energy move through Earth’s seas and atmosphere, as well as for monitoring ocean features such as currents and eddies. The measurements come courtesy of a radar altimeter that measures sea levels for nearly all of Earth’s ocean, providing information on large-scale currents that can aid in commercial and naval navigation, search and rescue, and the tracking of debris and pollutants from disasters at sea.
Sentinel-6B is part of a U.S.-European mission that will continue 30-year-plus record of sea-level measurements. Its observations will help build an accurate picture of local and global sea surface heights to support storm forecasting, secure coastal infrastructure, and help optimize commercial activities, such as shipping. Credit: NASA/JPL-Caltech
2. Data from the Copernicus Sentinel-6/Jason-CS mission helps NASA prepare for the next phase of space exploration.
The better we understand Earth, the better NASA can carry out its mission to explore the universe. Data from the Copernicus Sentinel-6/Jason-CS mission is used to refine the Goddard Earth Observing System atmospheric forecast models, which the NASA Engineering Safety Center uses to plan safer reentry of astronauts returning from Artemis missions.
Additionally, changes to Earth’s ocean, observed by satellites, can have measurable effects beyond our planet. For instance, while the Moon influences ocean tides on Earth, changes in those tides can also exert a small influence on the Moon. Data from Copernicus Sentinel-6/Jason-CS can help improve understanding of this relationship, knowledge that can contribute to future lunar exploration missions.
3. The Copernicus Sentinel-6/Jason-CS mission helps the U.S. respond to challenges by putting actionable information into the hands of decision-makers.
Data collected by the mission helps city planners, as well as local and state governments, to make informed decisions on protecting coastal infrastructure, real estate, and energy facilities. The mission’s sea level data also improves meteorologists’ weather predictions, which are critical to commercial and recreational navigation. By enhancing weather prediction models, data provided by Copernicus Sentinel-6/Jason-CS improves forecasts of hurricane development, including the likelihood of storm intensification, which can aid disaster preparedness and response.
4. Data from Sentinel-6B will support national security efforts.
The ocean and atmosphere measurements from Sentinel-6B will enable decision-makers to better protect coastal military installations from such events as nuisance flooding while aiding national defense efforts by providing crucial information about weather and ocean conditions. The satellite will do so by feeding near-real time data on Earth’s atmosphere and seas to forward-looking weather and ocean models. Since the measurements are part of a long-term dataset, they also can add historical context that puts the new data in perspective.
5. The Copernicus Sentinel-6/Jason-CS mission’s direct observation of sea levels delivers information critical to protecting coastlines, where nearly half of the world’s population lives.
Sea level rise varies from one area to another, meaning that some coastlines are more vulnerable than others to flooding, erosion, and saltwater contamination of underground freshwater supplies, the latter of which threatens farmland and drinking water. Sea level measurements from Sentinel-6 Michael Freilich, and soon, Sentinel-6B, form the basis of U.S. flood predictions for coastal infrastructure, real estate, energy storage sites, and other coastal assets. Knowing which regions are more vulnerable to these risks will enable U.S. industries and emergency managers to make better-informed decisions about transportation and commercial infrastructure, land-use planning, water management, and adaptation strategies.
6. The international collaboration behind the mission enables the pooling of capabilities, resources, and expertise.
The multidecadal dataset that this mission supports is the result of years of close work between NASA and several collaborators, including NASA, ESA, EUMETSAT, CNES, and NOAA. By pooling expertise and resources, this partnership has delivered cost-effective solutions that have made precise, high-impact data available to industry and government agencies alike.
More about Sentinel-6B
Copernicus Sentinel-6/Jason-CS was jointly developed by ESA, EUMETSAT, NASA, and NOAA, with funding support from the European Commission and technical support from CNES. The mission also marks the first international involvement in Copernicus, the European Union’s Earth Observation Programme.
Managed for NASA by Caltech in Pasadena, JPL contributed three science instruments for each Sentinel-6 satellite: the Advanced Microwave Radiometer, the Global Navigation Satellite System – Radio Occultation, and the laser retroreflector array. NASA is also contributing launch services, ground systems supporting operation of the NASA science instruments, the science data processors for two of these instruments, and support for the international ocean surface topography community.
NASA and its U.S. and international partners have teamed up to launch a new Earth-observing satellite called Sentinel-6B that will measure sea surface height...
In this artist’s concept, the ocean-observing satellite Sentinel-6B orbits Earth with its deployable solar panels extended.
Credit: NASA/JPL-Caltech
NASA will provide live coverage of prelaunch and launch activities for Sentinel-6B, an international mission delivering critical sea level and ocean data to protect coastal infrastructure, improve weather forecasting, and support commercial activities at sea.
Launch is targeted at 12:21 a.m. EST, Monday, Nov. 17 (9:21 p.m. PST, Sunday, Nov. 16) aboard a SpaceX Falcon 9 rocket from Space Launch Complex 4 East at Vandenberg Space Force Base in California.
Watch coverage beginning at 11:30 p.m. EST (8:30 p.m. PST) on NASA+, Amazon Prime, and more. Learn how to watch NASA content through a variety of platforms, including social media.
The Sentinel-6B mission continues a decades-long effort to monitor global sea level and ocean conditions using precise radar measurements from space. Since the early 1990s, satellites launched by NASA and domestic and international partners have collected precise sea level data. The launch of Sentinel-6B will extend this dataset out to nearly four decades.
NASA’s mission coverage is as follows (all times Eastern and subject to change based on real-time operations):
Saturday, Nov. 15
4 p.m. – NASA Prelaunch Teleconference on International Ocean Tracking Mission
Karen St. Germain, director, Earth Science Division, NASA Headquarters in Washington
Pierrik Veuilleumier, Sentinel-6B project manager, ESA (European Space Agency)
Parag Vaze, Sentinel-6B project manager, NASA’s Jet Propulsion Laboratory in Pasadena, California
Tim Dunn, senior launch director, Launch Services Program, NASA’s Kennedy Space Center in Florida
Julianna Scheiman, director, NASA Science Missions, SpaceX
1st Lt. William Harbin, launch weather officer, U.S. Air Force
11:30 p.m. – Launch coverage begins on NASA+, Amazon Prime, and more.
Audio-only coverage
Audio-only of the launch coverage will be carried on the NASA “V” circuits, which may be accessed by dialing 321-867-1220 or -1240. On launch day, “mission audio” countdown activities without NASA+ launch commentary will be carried at 321-867-7135.
NASA website launch coverage
Launch day coverage of the mission will be available on the agency’s website. Coverage will include links to live streaming and blog updates beginning no earlier than 11 p.m. EST, Nov. 16, as the countdown milestones occur. Streaming video and photos of the launch will be accessible on demand shortly after liftoff. Follow countdown coverage on NASA’s Sentinel-6/Jason-CS blog.
For questions about countdown coverage, contact the NASA Kennedy newsroom at: 321-867-2468.
Attend launch virtually
Members of the public can register to attend this launch virtually. NASA’s virtual guest program for this mission includes curated launch resources, notifications about related opportunities or changes, and a stamp for the NASA virtual guest passport following launch.
Watch, engage on social media
Let people know you’re watching the mission on X, Facebook, and Instagram by following and tagging these accounts:
Sentinel-6B is the second of twin satellites in the Copernicus Sentinel-6/Jason-CS (Continuity of Service) mission, a collaboration among NASA, ESA, EUMETSAT (European Organisation for the Exploitation of Meteorological Satellites), and the National Oceanic and Atmospheric Administration (NOAA). The first satellite in the mission, Sentinel-6 Michael Freilich, launched in November 2020. The European Commission contributed funding support, while France’s space agency CNES (Centre National d’Études Spatiales) provided technical expertise. The mission also marks the first international involvement in Copernicus, the European Union’s Earth Observation Programme.