XRP Price Prediction: $1.88 Triple-Bottom Support as ETF Money Pulls Back – What’s Next?
XRP is trading near $1.89–$1.91 as January draws to a close, holding a well-defined triple-bottom support around $1.88 after slipping below the $2.00 mark earlier this week. The pullback has coincided with ETF outflows and a sharp drop in trading volume, but price action suggests stabilization rather than renewed selling pressure.
With volatility compressing and buyers repeatedly defending the same demand zone, XRP is approaching a technical decision point that could define its next directional move.
ETF Outflows Ease Short-Term Momentum Without Breaking the Thesis
Short-term pressure has been driven largely by institutional flows. According to data reported by CryptoQuant, U.S. spot XRP ETFs recorded their first weekly net outflows, totaling approximately $40.6 million toward the end of January. Trading volume has also declined sharply, with some estimates showing a 50%+ drop in 24-hour activity, signaling trader hesitation rather than aggressive selling.
That said, the flow data points to rotation and profit-taking, not abandonment. XRP remains one of the few large-cap tokens with clear regulatory positioning in the US, and earlier ETF inflows north of $1 billion underscore that institutional interest hasn’t disappeared. The current reset appears more about leverage clearing than confidence breaking.
Core Adoption Trends Remain Unchanged Despite Price Weakness
Fundamentally, Ripple’s long-term thesis remains unchanged. XRP continues to underpin on-demand liquidity (ODL) across Ripple’s global payments network, offering faster and cheaper settlement compared to legacy systems.
More than 300 financial institutions remain connected to RippleNet, and ongoing regulatory clarity following 2025 rulings continues to distinguish XRP from many peers.
While no major partnership headlines have emerged this week, the absence of negative ecosystem news reinforces the view that the current weakness is market-driven, not fundamental.
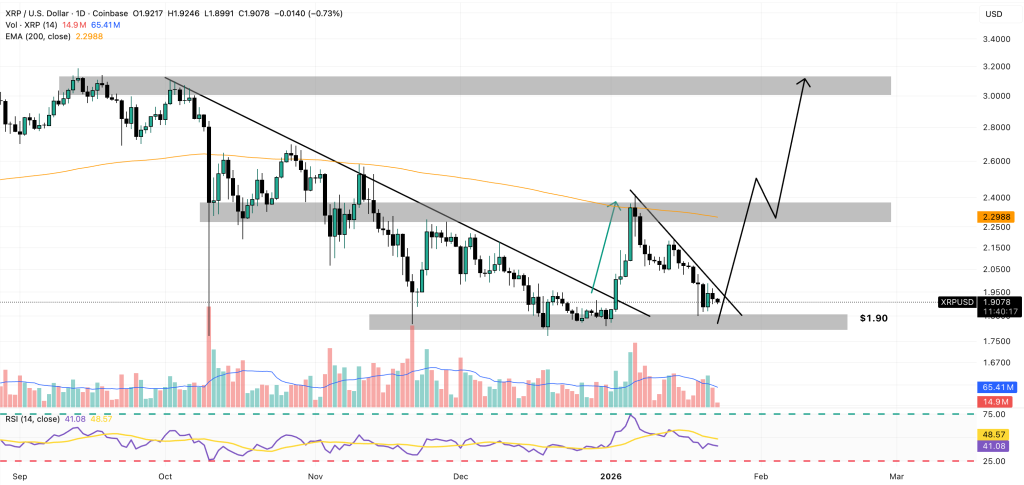
XRP Price Prediction: Volatility Shrinks at $1.90 – Breakout or Breakdown Ahead?
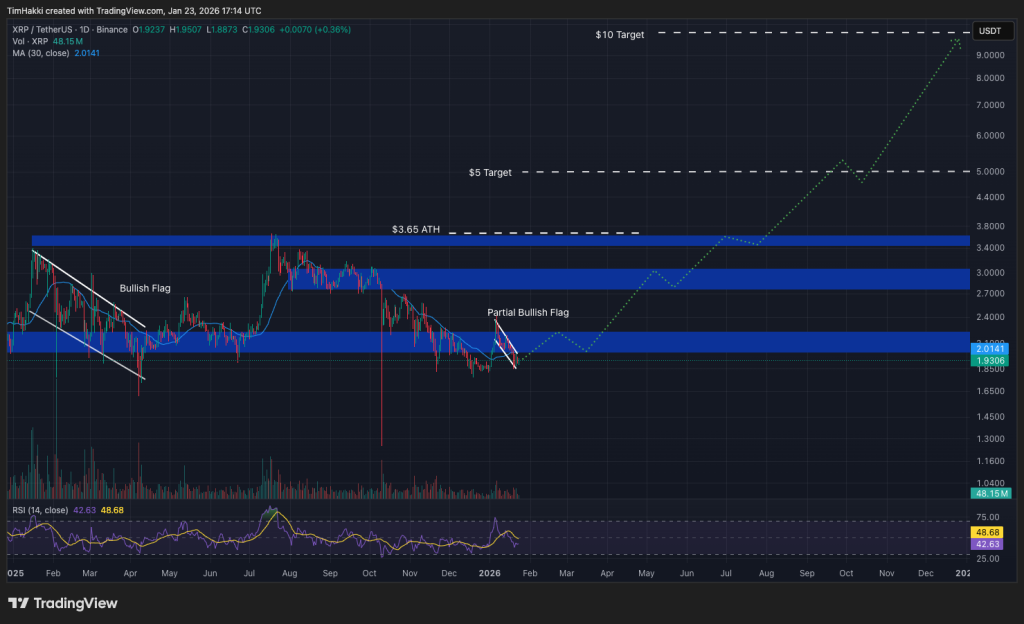
From a technical perspective, XRP price prediction remains cautiously neutral near term. On the 2-hour chart, price is stabilizing inside a descending channel, capped by a falling trendline near $1.95. XRP is trading below the 50-EMA and 100-EMA, while the 200-EMA near $1.99 continues to act as firm resistance.
Support is clearly defined between $1.88 and $1.85, where repeated long lower wicks suggest responsive buying. RSI has recovered into the mid-40s after oversold readings, indicating easing downside pressure. Volatility has contracted, forming a descending wedge, a structure that often resolves higher if support holds.
A successful break above $1.95 would expose $2.03–$2.06, signaling structural repair. Conversely, a decisive loss of $1.85 would open downside toward $1.80 and $1.77.
XRP Trade setup: Accumulate near $1.88–$1.85, target $2.03–$2.06, invalidation below $1.80.
Bitcoin Hyper: The Next Evolution of BTC on Solana?
Bitcoin Hyper ($HYPER) is bringing a new phase to the BTC ecosystem. While BTC remains the gold standard for security, Bitcoin Hyper adds what it always lacked: Solana-level speed. The result: lightning-fast, low-cost smart contracts, decentralized apps, and even meme coin creation, all secured by Bitcoin.
Audited by Consult, the project emphasizes trust and scalability as adoption builds. And momentum is already strong. The presale has surpassed $30.9 million, with tokens priced at just $0.013635 before the next increase.
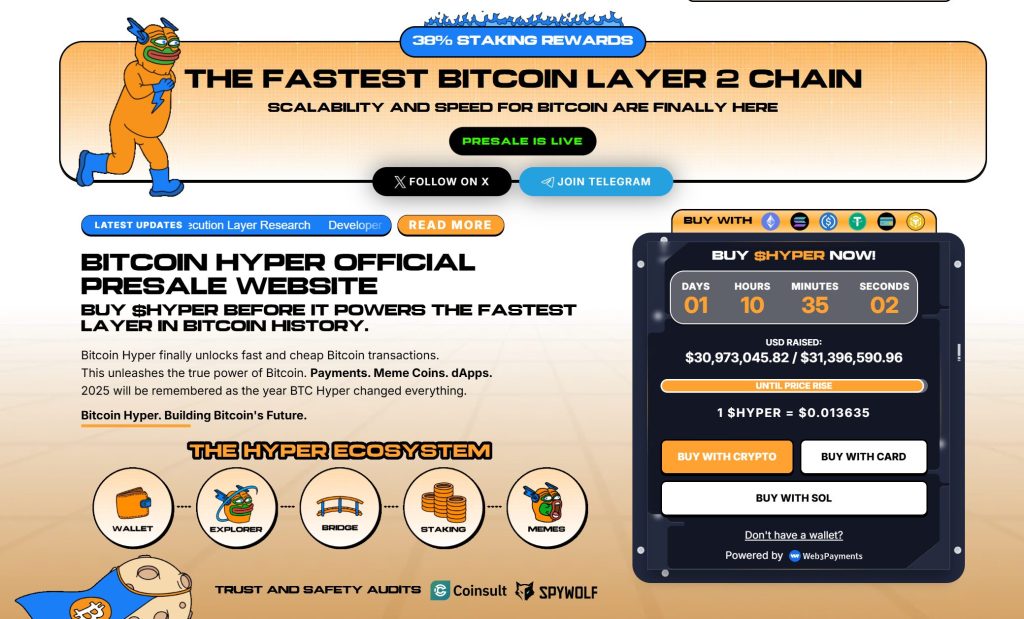
As Bitcoin activity climbs and demand for efficient BTC-based apps rises, Bitcoin Hyper stands out as the bridge uniting two of crypto’s biggest ecosystems. If Bitcoin built the foundation, Bitcoin Hyper could make it fast, flexible, and fun again.
Click Here to Participate in the PresaleThe post XRP Price Prediction: $1.88 Triple-Bottom Support as ETF Money Pulls Back – What’s Next? appeared first on Cryptonews.
![]()