Normal view

There are new articles available, click to refresh the page.
Before yesterdayMain stream

Journey to Center of Milky Way With Upcoming NASA Roman Core Survey

23 January 2026 at 10:00

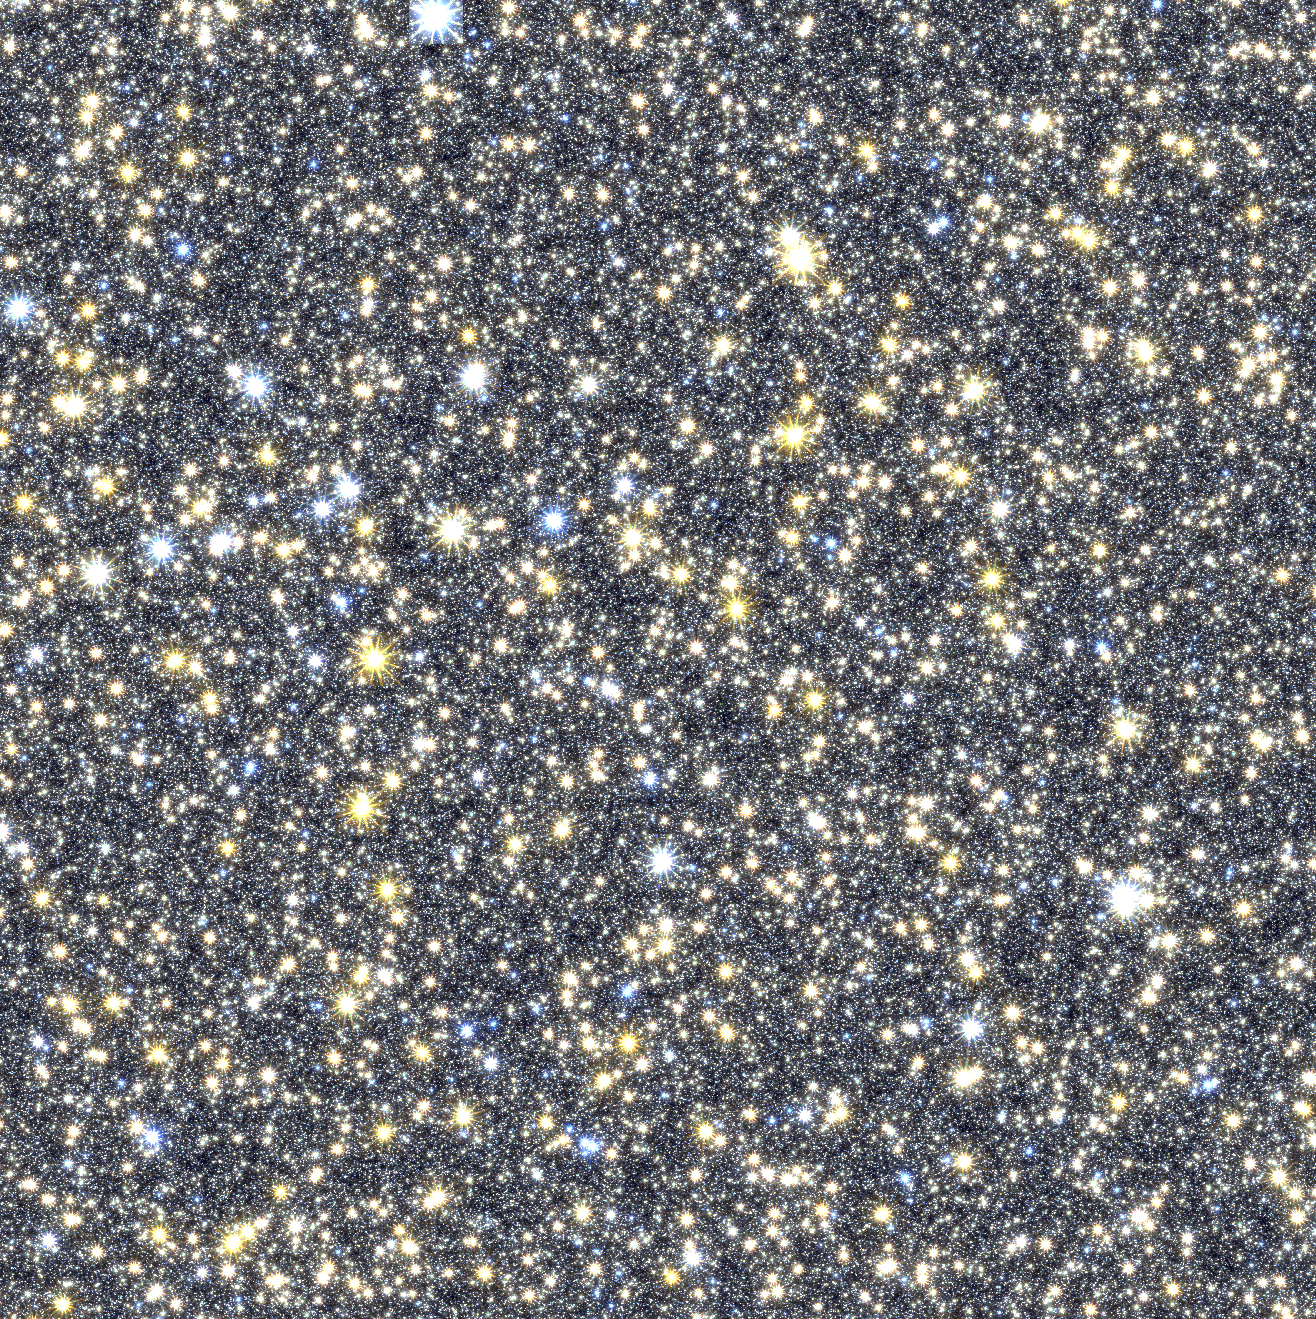
At the heart of our own galaxy, there is a dense thicket of stars with a supermassive black hole at the very center. NASA’s Nancy Grace Roman Space Telescope will provide the deepest-ever view of this zone, revealing stars, planets, and unique objects that resist definition.

Based on the input of astronomers from across the globe, the Roman Space Telescope will spend three-quarters of its five-year primary mission conducting three revolutionary surveys of unprecedented scale. Their combined results will transform all areas of astronomy and answer longstanding questions about dark matter, dark energy, and planets outside of our solar system, called exoplanets.

That last theme will be addressed by the Galactic Bulge Time-Domain Survey, which will peer into the center of our galaxy to study the stars and exoplanets that make up the densely populated region around the center of the Milky Way, known as the galactic bulge.

Galactic Bulge Time-Domain Survey infographic
This infographic describes the Galactic Bulge Time-Domain Survey that will be conducted by NASA’s Nancy Grace Roman Space Telescope. The smallest of Roman’s core surveys, this observation program will consist of repeat visits to six fields covering 1.7 square degrees total. One field will pierce the very center of the galaxy, and the others will be nearby — all in a region of the sky that will be visible to Roman for two 72-day stretches each spring and fall. The survey will mainly consist of six seasons (three early on, and three toward the end of Roman’s primary mission), during which Roman will view each field every 12 minutes. Roman will also view the six fields with less intensity at other times throughout the mission, allowing astronomers to detect microlensing events that can last for years, signaling the presence of isolated, stellar-mass black holes.
Credit: NASA’s Goddard Space Flight Center

The survey will observe six patches of the galactic bulge, one pinpointing the center and five nearby, every 12 minutes during 438 days of total observing time. The observations will be separated into six “seasons” spread out over five years.

Spending so much time focusing on a relatively small area of the sky, the mission will be able to track changes in the motion and light of hundreds of millions of stars, and any planets that orbit them, over long periods — the “time-domain” aspect of the survey.

“This survey will be the highest precision, highest cadence, longest continuous observing baseline survey of our galactic bulge, where the highest density of stars in our galaxy reside,” said Jessie Christiansen of Caltech/IPAC, who served as co-chair of the committee that defined the Galactic Bulge Time-Domain Survey.

Exoplanet microlensing

Roman will use a method called microlensing to search for exoplanets, a technique that has so far identified just over 200 exoplanets, compared to more than 4,000 discovered with the transit method, out of the greater than 6,000 currently confirmed.

With this survey, scientists expect to see over 1,000 new planets orbiting other stars just using microlensing alone. This would increase the number of exoplanets identified using this method by more than fivefold.

A microlensing event is when light from a distant star in the background is warped slightly by a foreground object, like a star and its planet. This warping of light is called gravitational lensing, with the gravity from the star and planet bending the fabric of space that light is traveling through and focusing it like a magnifying glass.

This animation illustrates the concept of gravitational microlensing. When one star in the sky appears to pass nearly in front of another, the light rays of the background source star become bent due to the warped space-time around the foreground star. This star is then a virtual magnifying glass, amplifying the brightness of the background source star, so we refer to the foreground star as the lens star. If the lens star harbors a planetary system, then those planets can also act as lenses, each one producing a short deviation in the brightness of the source. Thus we discover the presence of exoplanets, and measure its mass and separation from its star.
Credit: NASA’s Goddard Space Flight Center/CI Lab

While the transit method is very good at identifying exoplanets that orbit close to their star, the microlensing method can discover exoplanets that orbit farther away from their star, and in planetary systems farther from Earth than ever studied before. Roman will be versatile enough to see exoplanets dwelling from the inner edge of the habitable zone out to great distances from their stars, with a wide range of masses from planets smaller than Mars to the size of gas giants like Jupiter and Saturn. It may even discover “rogue planets” without host stars that either formed alone or were ejected from their host systems long ago.

“For the first time, we will have a big picture understanding of Earth and our solar system within the broader context of the exoplanet population of the Milky Way galaxy,” Christiansen said. “We still don’t know how common Earth-like planets are, and the Roman Galactic Bulge Time-Domain Survey will provide us with this answer.”

This survey will create a census of exoplanets for scientists to draw statistical conclusions from, revealing common patterns found in exoplanets and furthering our understanding of planetary formation and habitability.

One survey; lots of science

Because of the immense amount of observing time and subsequent data produced, the Galactic Bulge Time-Domain Survey will advance not only the field of exoplanet microlensing, but other areas of astronomy, too.

“There is an incredibly rich diversity of science that can be done with a high-precision, high-cadence survey like this one,” said Dan Huber of the University of Hawaii, the other survey co-chair.

The core survey was optimized not only for microlensing, but also to observe changes in brightness from small, fast blips to long-term trends. This property allows astronomers to discover and characterize transiting planets, red giant stars, stellar-mass black holes and other stellar remnants, and eclipsing binaries, and can lead to a deeper understanding about the physics of star formation and evolution.

Many thousands of bright, explosive looking stars speckle the screen. The smallest ones are white pinpoints, strewn across the screen like spilled salt. Larger ones are yellow and bluish white and they have spiky outer edges like sea urchins.
A simulated image of Roman’s observations toward the center of our galaxy, spanning only less than 1 percent of the total area of Roman’s galactic bulge time-domain survey. The simulated stars were drawn from the Besançon Galactic Model.
Credit: Matthew Penny (Louisiana State University)

“The stars in the bulge and center of our galaxy are unique and not yet well understood,” Huber said. “The data from this survey will allow us to measure how old these stars are and how they fit into the formation history of our Milky Way galaxy.”

Roman’s observing strategy in the Galactic Bulge Time-Domain Survey, as well as the High-Latitude Time-Domain Survey and the High-Latitude Wide-Area Survey, will allow astronomers to maximize scientific output, all with one telescope.

Abundance of data to explore

Roman will observe hundreds of millions of stars every 12 minutes during the survey period, providing an unprecedented volume of data for astronomers to parse through.

The Roman Science Support Center at Caltech/IPAC in Pasadena, California, will be responsible for the high-level science data processing for the Galactic Bulge Time Domain Survey, including exoplanet microlensing and general community outreach for Roman exoplanet science. The Science Support Center’s monitoring of these stars has been automated to detect microlensing and variable events within the data. This helps scientists understand features like how frequently a star’s brightness is changing, or if there are planets lurking near the lensed stars, or other sources of variability. The number of stars and frequency of the observations make the Roman data an ideal dataset for finding such sources.

All Roman observations will be made publicly available after a short processing period. The mission is scheduled to launch no later than May 2027, with the team on track for launch in fall 2026.

The Nancy Grace Roman Space Telescope is managed at NASA’s Goddard Space Flight Center in Greenbelt, Maryland, with participation by NASA’s Jet Propulsion Laboratory in Southern California; Caltech/IPAC in Pasadena, California; the Space Telescope Science Institute in Baltimore; and a science team comprising scientists from various research institutions. The primary industrial partners are BAE Systems Inc. in Boulder, Colorado; L3Harris Technologies in Rochester, New York; and Teledyne Scientific & Imaging in Thousand Oaks, California.

By Isabel Swafford
Caltech/IPAC, Pasadena, Calif.

Media contact:

Claire Andreoli
NASA’s Goddard Space Flight Center, Greenbelt, Md.
301-286-1940

Share

Details

Last Updated
Jan 23, 2026
Editor
Ashley Balzer
Contact
Location
Goddard Space Flight Center

💾

This animation illustrates the concept of gravitational microlensing. When one star in the sky appears to pass nearly in front of another, the light rays of ...

NASA’s Webb Delivers Unprecedented Look Into Heart of Circinus Galaxy

13 January 2026 at 05:00
 
7 Min Read

NASA’s Webb Delivers Unprecedented Look Into Heart of Circinus Galaxy

An artist’s illustration showing the center of the Circinus galaxy, including its supermassive black hole, dusty torus, and superheated jets of matter. The center of supermassive black hole, slightly left of center, is bright white. Two slim, bright green jets of matter shoot out from the black hole at 1 o’clock and 7 o’clock, and hit the edges of the frame. A donut-shaped, orangish-pinkish ring of dust and gas, called a torus, surrounds the black hole. The disk is clumpy closer to the center and more diffuse at the edges. The torus, tilted at the same angle as the jets, is brighter and whiter closer to the black hole than at the edges. The words Artist’s Concept is in the lower right corner.
This artist’s concept depicts the central engine of the Circinus galaxy, visualizing the supermassive black hole fed by a thick, dusty torus that glows in infrared light. 
Credits:
Artwork: NASA, ESA, CSA, Ralf Crawford (STScI)

The Circinus Galaxy, a galaxy about 13 million light-years away, contains an active supermassive black hole that continues to influence its evolution. The largest source of infrared light from the region closest to the black hole itself was thought to be outflows, or streams of superheated matter that fire outward. 

Image: Circinus Galaxy (Hubble and Webb)

Image shows a large spiral galaxy that that has a bright white center, with several lanes of reddish-brown dust and gas in between faint white arms. The galaxy takes up the center third of the frame. There are several thousand stars, some with diffraction spikes, scattered around the image. This image is labeled Hubble. A small box outlining an area at the center of the galaxy leads a pullout square at the top right. The image, labeled Webb, is dark with a white glowing oval at the center.
This image from NASA’s Hubble Space Telescope shows the Circinus galaxy. A close-up of its core from NASA’s James Webb Space Telescope shows the inner face of the hole of the donut-shaped disk of gas disk glowing in infrared light. The outer ring appears as dark spots. 
Image: NASA, ESA, CSA, Enrique Lopez-Rodriguez (University of South Carolina), Deepashri Thatte (STScI); Image Processing: Alyssa Pagan (STScI); Acknowledgment: NSF’s NOIRLab, CTIO

Now, new observations by NASA’s James Webb Space Telescope, seen here with a new image from NASA’s Hubble Space Telescope, provide evidence that reverses this thinking, suggesting that most of the hot, dusty material is actually feeding the central black hole. The technique used to gather this data also has the potential to analyze the outflow and accretion components for other nearby black holes. 

The research, which includes the sharpest image of a black hole’s surroundings ever taken by Webb, published Tuesday in Nature.

Outflow question

Supermassive black holes like those in Circinus remain active by consuming surrounding matter. Infalling gas and dust accumulates into a donut-shaped ring around the black hole, known as a torus. As supermassive black holes gather matter from the torus’ inner walls, they form an accretion disk, similar to a whirlpool of water swirling around a drain. This disk grows hotter through friction, eventually becoming hot enough to emit light. 

This glowing matter can become so bright that resolving details within the galaxy’s center with ground-based telescopes is difficult. It’s made even harder due to the bright, concealing starlight within Circinus. Further, since the torus is incredibly dense, the inner region of the infalling material, heated by the black hole, is obscured from our point of view. For decades, astronomers contended with these difficulties, designing and improving models of Circinus with as much data as they could gather.

Image: Circinus Galaxy Center (Artist’s Concept)

An artist’s illustration showing the center of the Circinus galaxy, including its supermassive black hole, dusty torus, and superheated jets of matter. The center of supermassive black hole, slightly left of center, is bright white. Two slim, bright green jets of matter shoot out from the black hole at 1 o’clock and 7 o’clock, and hit the edges of the frame. A donut-shaped, orangish-pinkish ring of dust and gas, called a torus, surrounds the black hole. The disk is clumpy closer to the center and more diffuse at the edges. The torus, tilted at the same angle as the jets, is brighter and whiter closer to the black hole than at the edges. The words Artist’s Concept is in the lower right corner.
This artist’s concept depicts the central engine of the Circinus galaxy, visualizing the supermassive black hole fed by a thick, dusty torus that glows in infrared light. 
Artwork: NASA, ESA, CSA, Ralf Crawford (STScI)

“In order to study the supermassive black hole, despite being unable to resolve it, they had to obtain the total intensity of the inner region of the galaxy over a large wavelength range and then feed that data into models,” said lead author Enrique Lopez-Rodriguez of the University of South Carolina. 

Early models would fit the spectra from specific regions, such as the emissions from the torus, those of the accretion disk closest to the black hole, or those from the outflows, each detected at certain wavelengths of light. However, since the region could not be resolved in its entirety, these models left questions at several wavelengths. For example, some telescopes could detect an excess of infrared light, but lacked the resolution to determine where exactly it was coming from.

“Since the ‘90s, it has not been possible to explain excess infrared emissions that come from hot dust at the cores of active galaxies, meaning the models only take into account either the torus or the outflows, but cannot explain that excess,” said Lopez-Rodriguez.

Such models found that most of the emission (and, therefore, mass) close to the center came from outflows. To test this theory, then, astronomers needed two things: the ability to filter the starlight that previously prevented a deeper analysis, and the ability to distinguish the infrared emissions of the torus from those of the outflows. Webb, sensitive and technologically sophisticated enough to meet both challenges, was necessary to advance our understanding.

Webb’s innovative technique

To look into the center of Circinus, Webb needed the Aperture Masking Interferometer tool on its NIRISS (Near-Infrared Imager and Slitless Spectrograph) instrument. 

On Earth, interferometers usually take the form of telescope arrays: mirrors or antennae that work together as if they were a single telescope. An interferometer does this by gathering and combining the light from whichever source it is pointed toward, causing the electromagnetic waves that make up light to “interfere” with each other (hence, “interfere-ometer”) and creating interference patterns. These patterns can be analyzed by astronomers to reconstruct the size, shape, and features of distant objects with much greater detail than non-interferometric techniques. 

The Aperture Masking Interferometer allows Webb to become an array of smaller telescopes working together as an interferometer, creating these interference patterns by itself. It does this by utilizing a special aperture made of seven small, hexagonal holes, which, like in photography, controls the amount and direction of light that enters the telescope’s detectors.

“These holes in the mask are transformed into small collectors of light that guide the light toward the detector of the camera and create an interference pattern,” said Joel Sanchez-Bermudez, co-author based at the National University of Mexico.

With new data in hand, the research team was able to construct an image from the central region’s interference patterns. To do so, they referenced data from previous observations to ensure their data from Webb was free of any artifacts. This resulted in the first extragalactic observation from an infrared interferometer in space.

“By using an advanced imaging mode of the camera, we can effectively double its resolution over a smaller area of the sky,” Sanchez-Bermudez said. “This allows us to see images twice as sharp. Instead of Webb’s 6.5-meter diameter, it’s like we are observing this region with a 13-meter space telescope.” 

The data showed that contrary to the models predicting that the infrared excess comes from the outflows, around 87% of the infrared emissions from hot dust in Circinus come from the areas closest to the black hole, while less than 1% of emissions come from hot dusty outflows. The remaining 12% comes from distances farther away that could not previously be told apart. 

“It is the first time a high-contrast mode of Webb has been used to look at an extragalactic source,” said Julien Girard, paper co-author and senior research scientist at the Space Telescope Science Institute. “We hope our work inspires other astronomers to use the Aperture Masking Interferometer mode to study faint, but relatively small, dusty structures in the vicinity of any bright object.”

Video: Circinus Galaxy Zoom

This zoom-in video shows the location of the Circinus galaxy on the sky. It begins with a ground-based photo of the constellation Circinus by the late astrophotographer Akira Fujii. The video closes in on the Circinus galaxy, using views from the Digitized Sky Survey and the Dark…
Video: NASA, ESA, CSA, Alyssa Pagan (STScI); Acknowledgment: CTIO, NSF’s NOIRLab, DSS, Akira Fujii

Universe of black holes

While the mystery of Circinus’ excess emissions has been solved, there are billions of black holes in our universe. Those of different luminosities, the team notes, may have an influence on whether most of the emissions come from a black hole’s torus or their outflows.

“The intrinsic brightness of Circinus’ accretion disk is very moderate,” Lopez-Rodriguez said. “So it makes sense that the emissions are dominated by the torus. But maybe, for brighter black holes, the emissions are dominated by the outflow.” 

With this research, astronomers now have a tested technique to investigate whichever black holes they want, so long as they are bright enough for the Aperture Masking Interferometer to be useful. Studying additional targets will be essential to building a catalog of emission data to figure out if Circinus’ results were unique or characteristic of a pattern. 

“We need a statistical sample of black holes, perhaps a dozen or two dozen, to understand how mass in their accretion disks and their outflows relate to their power,” Lopez-Rodriguez said.

The James Webb Space Telescope is the world’s premier space science observatory. Webb is solving mysteries in our solar system, looking beyond to distant worlds around other stars, and probing the mysterious structures and origins of our universe and our place in it. Webb is an international program led by NASA with its partners, ESA (European Space Agency) and CSA (Canadian Space Agency).

To learn more about Webb, visit: 

https://science.nasa.gov/webb

Downloads & Related Information

The following sections contain links to download this article’s images and videos in all available resolutions followed by related information links, media contacts, and if available, research paper and spanish translation links.

Related Images & Videos

An artistu2019s illustration showing the center of the Circinus galaxy, including its supermassive black hole, dusty torus, and superheated jets of matter. The center of supermassive black hole, slightly left of center, is bright white. Two slim, bright green jets of matter shoot out from the black hole at 1 ou2019clock and 7 ou2019clock, and hit the edges of the frame. A donut-shaped, orangish-pinkish ring of dust and gas, called a torus, surrounds the black hole. The disk is clumpy closer to the center and more diffuse at the edges. The torus, tilted at the same angle as the jets, is brighter and whiter closer to the black hole than at the edges. The words Artistu2019s Concept is in the lower right corner.

Circinus Galaxy Center (Artist’s Concept)

This artist’s concept depicts the central engine of the Circinus galaxy, visualizing the supermassive black hole fed by a thick, dusty torus that glows in infrared light.

Image shows a large spiral galaxy that that has a bright white center, with several lanes of reddish-brown dust and gas in between faint white arms. The galaxy takes up the center third of the frame. There are several thousand stars, some with diffraction spikes, scattered around the image. This image is labeled Hubble. A small box outlining an area at the center of the galaxy leads a pullout square at the top right. The image, labeled Webb, is dark with a white glowing oval at the center.

Circinus Galaxy (Hubble and Webb)

This image from NASA’s Hubble Space Telescope shows the Circinus galaxy. A close-up of its core from NASA’s James Webb Space Telescope shows the inner face of the hole of the donut-shaped disk of gas disk glowing in infrared light. The outer ring appears as dark spots.

Image titled u201cJames Webb Space Telescope; Circinus Galaxy, ESO 97-G13,u201d with compass arrows, scale bar, and color key. Image shows a large spiral galaxy that that has a bright white center, with several lanes of reddish-brown dust and gas in between faint white arms. This image is labeled Hubble. A small box outlining an area at the center of the galaxy leads a pullout square at the top right. The image, labeled Webb, is dark with a white glowing oval at the center. At the bottom left are compass arrows indicating the orientation of the image on the sky. The east arrow points toward 7 ou2019clock. The north arrow points in the 11 ou2019clock direction. At the bottom right of each image is a scale bar. The Hubble one is labeled 1,300 light-years and 400 parsecs and is one eighth the image. The Webb label is 2 pcs and is 1 fifth the inset image. Below the image is a color key showing which filters were used to create the image and which visible-light color is assigned to each filter.

Circinus Galaxy (Hubble and Webb Compass Image)

This image shows two views of the Circinus galaxy, one captured by the Hubble Space Telescope and the other by the James Webb Space Telescope’s NIRISS (Near-Infrared Imager and Slitless Spectrograph. It shows compass arrows, scale bar, and color key for reference.

Telescope image including stars on the night sky and splotches of pink. Thin blue lines connect the actual stars of several constellations.

Circinus Galaxy Zoom

This zoom-in video shows the location of the Circinus galaxy on the sky. It begins with a ground-based photo of the constellation Circinus by the late astrophotographer Akira Fujii. The video closes in on the Circinus galaxy, using views from the Digitized Sky Survey and the Dark…

Related Links

Read more: The Modes of Webb’s NIRISS

Explore moreBlack Hole Resources from NASA’s Universe of Learning

Read more:  Webb’s Scientific Instruments

VideoNASA Animation Sizes Up the Universe’s Biggest Black Holes

More Webb News

More Webb Images

Webb Science Themes

Webb Mission Page


Share

Details

Last Updated
Jan 13, 2026
Contact
Media

Laura Betz
NASA’s Goddard Space Flight Center
Greenbelt, Maryland
laura.e.betz@nasa.gov

Matthew Brown
Space Telescope Science Institute
Baltimore, Maryland

Hannah Braun
Space Telescope Science Institute
Baltimore, Maryland

NASA’s Pandora Satellite, CubeSats to Explore Exoplanets, Beyond

9 January 2026 at 09:40

6 min read

NASA’s Pandora Satellite, CubeSats to Explore Exoplanets, Beyond

Editor’s Note, Jan. 11, 2026: NASA’s Pandora and the NASA-sponsored BlackCAT and SPARCS missions lifted off at 8:44 a.m. EST (5:44 a.m. PST) Sunday, Jan. 11.

A new NASA spacecraft called Pandora is awaiting launch ahead of its journey to study the atmospheres of exoplanets, or worlds beyond our solar system, and their stars.

Along for the ride are two shoebox-sized satellites called BlackCAT (Black Hole Coded Aperture Telescope) and SPARCS (Star-Planet Activity Research CubeSat), as NASA innovates with ambitious science missions that take low-cost, creative approaches to answering questions like, “How does the universe work?” and “Are we alone?”

All three missions are set to launch Jan. 11 on a SpaceX Falcon 9 rocket from Space Launch Complex 4 East at Vandenberg Space Force Base in California. The launch window opens at 8:19 a.m. EST (5:19 a.m. PST). SpaceX will livestream the event.

The Pandora spacecraft with an exoplanet and two stars in the background
Artist’s concept of NASA’s Pandora mission, which will help scientists untangle the signals from the atmospheres of exoplanets — worlds beyond our solar system — and their stars.
NASA’s Goddard Space Flight Center/Conceptual Image Lab

“Pandora’s goal is to disentangle the atmospheric signals of planets and stars using visible and near-infrared light,” said Elisa Quintana, Pandora’s principal investigator at NASA’s Goddard Space Flight Center in Greenbelt, Maryland. “This information can help astronomers determine if detected elements and compounds are coming from the star or the planet — an important step as we search for signs of life in the cosmos.”

BlackCAT and SPARCS are small satellites that will study the transient, high-energy universe and the activity of low-mass stars, respectively.

Pandora will observe planets as they pass in front of their stars as seen from our perspective, events called transits.

As starlight passes through a planet’s atmosphere, it interacts with substances like water and oxygen that absorb characteristic wavelengths, adding their chemical fingerprints to the signal.

But while only a small fraction of the star’s light grazes the planet, telescopes also collect the rest of the light emitted by the star’s facing side. Stellar surfaces can sport brighter and darker regions that grow, shrink, and change position over time, suppressing or magnifying signals from planetary atmospheres. Adding a further complication, some of these areas may contain the same chemicals that astronomers hope to find in the planet’s atmosphere, such as water vapor.

All these factors make it difficult to be certain that important detected molecules come from the planet alone.

Pandora will help address this problem by providing in-depth study of at least 20 exoplanets and their host stars during its initial year. The satellite will look at each planet and its star 10 times, with each observation lasting a total of 24 hours. Many of these worlds are among the over 6,000 discovered by missions like NASA’s TESS (Transiting Exoplanet Survey Satellite).

Pandora, fully integrated, with blue-lit background
This view of the fully integrated Pandora spacecraft was taken May 19, 2025, following the mission’s successful environmental test campaign at Blue Canyon Technologies in Lafayette, Colorado. Visible are star trackers (center), multilayer insulation blankets (white), the end of the telescope (top), and the solar panel (right) in its launch configuration.
NASA/BCT

Pandora will collect visible and near-infrared light using a novel, all-aluminum 17-inch-wide (45-centimeter) telescope jointly developed by Lawrence Livermore National Laboratory in California and Corning Incorporated in Keene, New Hampshire. Pandora’s near-infrared detector is a spare developed for NASA’s James Webb Space Telescope.

Each long observation period will capture a star’s light both before and during a transit and help determine how stellar surface features impact measurements.

“These intense studies of individual systems are difficult to schedule on high-demand missions, like Webb,” said engineer Jordan Karburn, Pandora’s deputy project manager at Livermore. “You also need the simultaneous multiwavelength measurements to pick out the star’s signal from the planet’s. The long stares with both detectors are critical for tracing the exact origins of elements and compounds scientists consider indicators of potential habitability.”

Pandora is the first satellite to launch in the agency’s Astrophysics Pioneers program, which seeks to do compelling astrophysics at a lower cost while training the next generation of leaders in space science.

After launching into low Earth orbit, Pandora will undergo a month of commissioning before embarking on its one-year prime mission. All the mission’s data will be publicly available.

“The Pandora mission is a bold new chapter in exoplanet exploration,” said Daniel Apai, an astronomy and planetary science professor at the University of Arizona in Tucson where the mission’s operations center resides. “It is the first space telescope built specifically to study, in detail, starlight filtered through exoplanet atmospheres. Pandora’s data will help scientists interpret observations from past and current missions like NASA’s Kepler and Webb space telescopes. And it will guide future projects in their search for habitable worlds.”

Watch to learn more about NASA’s Pandora mission, which will revolutionize the study of exoplanet atmospheres.
NASA’s Goddard Space Flight Center

The BlackCAT and SPARCS missions will take off alongside Pandora through NASA’s Astrophysics CubeSat program, the latter supported by the Agency’s CubeSat Launch Initiative.

CubeSats are a class of nanosatellites that come in sizes that are multiples of a standard cube measuring 3.9 inches (10 centimeters) across. Both BlackCAT and SPARCS are 11.8 by 7.8 by 3.9 inches (30 by 20 by 10 centimeters). CubeSats are designed to provide cost-effective access to space to test new technologies and educate early career scientists and engineers while delivering compelling science.

The BlackCAT mission will use a wide-field telescope and a novel type of X-ray detector to study powerful cosmic explosions like gamma-ray bursts, particularly those from the early universe, and other fleeting cosmic events. It will join NASA’s network of missions that watch for these changes. Abe Falcone at Pennsylvania State University in University Park, where the satellite was designed and built, leads the mission with contributions from Los Alamos National Laboratory in New Mexico. Kongsberg NanoAvionics US provided the spacecraft bus.

The SPARCS CubeSat will monitor flares and other activity from low-mass stars using ultraviolet light to determine how they affect the space environment around orbiting planets. Evgenya Shkolnik at Arizona State University in Tempe leads the mission with participation from NASA’s Jet Propulsion Laboratory in Southern California. In addition to providing science support, JPL developed the ultraviolet detectors and the associated electronics. Blue Canyon Technologies fabricated the spacecraft bus.

Pandora is led by NASA Goddard. Livermore provides the mission’s project management and engineering. Pandora’s telescope was manufactured by Corning and developed collaboratively with Livermore, which also developed the imaging detector assemblies, the mission’s control electronics, and all supporting thermal and mechanical subsystems. The near-infrared sensor was provided by NASA Goddard. Blue Canyon Technologies provided the bus and performed spacecraft assembly, integration, and environmental testing. NASA’s Ames Research Center in California’s Silicon Valley will perform the mission’s data processing. Pandora’s mission operations center is located at the University of Arizona, and a host of additional universities support the science team.

By Jeanette Kazmierczak
NASA’s Goddard Space Flight Center, Greenbelt, Md.

Media Contact:
Claire Andreoli
301-286-1940
NASA’s Goddard Space Flight Center, Greenbelt, Md.

Facebook logo
Instagram logo

Scientists Identify ‘Astronomy’s Platypus’ with NASA’s Webb Telescope

6 January 2026 at 12:16
 
5 Min Read

Scientists Identify ‘Astronomy’s Platypus’ with NASA’s Webb Telescope

James Webb Space Telescope image showing a broad area of space with many small galaxies, four of which are highlighted in pull-out boxes. The four highlighted galaxies are very small, appearing as points of light. Black areas of the overall image indicate where the telescope did not collect data – a vertical section in the center and a square in the lower left corner.
Four of the nine galaxies in the newly identified “platypus” sample were discovered in NASA’s James Webb Space Telescope’s Cosmic Evolution Early Release Science Survey (CEERS). One key feature that makes them distinct is their point-like appearance.
Credits: Image: NASA, ESA, CSA, Steve Finkelstein (UT Austin); Image Processing: Alyssa Pagan (STScI)

After combing through NASA’s James Webb Space Telescope’s archive of sweeping extragalactic cosmic fields, a small team of astronomers at the University of Missouri says they have identified a sample of galaxies that have a previously unseen combination of features. Principal investigator Haojing Yan compares the discovery to an infamous oddball in another branch of science: biology’s taxonomy-defying platypus.

“It seems that we’ve identified a population of galaxies that we can’t categorize, they are so odd. On the one hand they are extremely tiny and compact, like a point source, yet we do not see the characteristics of a quasar, an active supermassive black hole, which is what most distant point sources are,” said Yan.

The research was presented in a press conference at the 247th meeting of the American Astronomical Society in Phoenix. 

Image A: Galaxies in CEERS Field (NIRCam image)

James Webb Space Telescope image showing a broad area of space with many small galaxies, four of which are highlighted in pull-out boxes. The four highlighted galaxies are very small, appearing as points of light. Black areas of the overall image indicate where the telescope did not collect data u2013 a vertical section in the center and a square in the lower left corner.
Four of the nine galaxies in the newly identified “platypus” sample were discovered in NASA’s James Webb Space Telescope’s Cosmic Evolution Early Release Science Survey (CEERS). One key feature that makes them distinct is their point-like appearance, even to a telescope that can capture as much detail as Webb.
Image: NASA, ESA, CSA, Steve Finkelstein (UT Austin); Image Processing: Alyssa Pagan (STScI)

“I looked at these characteristics and thought, this is like looking at a platypus. You think that these things should not exist together, but there it is right in front of you, and it’s undeniable,” Yan said.

The team whittled down a sample of 2,000 sources across several Webb surveys to identify nine point-like sources that existed 12 to 12.6 billion years ago (compared to the universe’s age of 13.8 billion years). Spectral data gives astronomers more information than they can get from an image alone, and for these nine sources it doesn’t fit existing definitions. They are too far away to be stars in our own galaxy, and too faint to be quasars, which are so brilliant that they outshine their host galaxies. Though the spectra resemble the less distant “green pea” galaxies discovered in 2009, the galaxies in this sample are much more compact.

“Like spectra, the detailed genetic code of a platypus provides additional information that shows just how unusual the animal is, sharing genetic features with birds, reptiles, and mammals,” said Yan. “Together, Webb’s imaging and spectra are telling us that these galaxies have an unexpected combination of features.”

Yan explained that for typical quasars, the peaks in their characteristic spectral emission lines look like hills, with a broad base, indicating the high velocity of gas swirling around their supermassive black hole. Instead, the peaks for the “platypus population” are narrow and sharp, indicating slower gas movement. 

While there are narrow-line galaxies that host active supermassive black holes, they do not have the point-like feature of the sample Yan’s team has identified.

Image B: Galaxy CEERS 4233-42232: Comparison With Quasar Spectrum

Infographic titled Galaxy CEERS 4233-42232, comparison with quasar spectrum.  Text at top right reads NIRSpec, Multi-Object Spectroscopy. Vertical Y axis of graph is labeled Brightness, more with an arrow pointing up and less with an arrow pointing down. Horizontal X axis is labeled Velocity of Gas (miles/second) in increments of one thousand starting with negative 4,000 on the left to 4,000 on the right. The spectrum of the galaxy is shown with a white line that peaks sharply at zero. The spectrum of the quasar example is shown with a dashed blue line that also peaks at zero, but with less brightness and a broader base that begins to increase in brightness at negative 1,000 miles per second the  and declines to at about 1,500 miles per second.
This graphic illustrates the pronounced narrow peak of the spectra that caught researchers’ attention in a small sample of galaxies, represented here by galaxy CEERS 4233-42232. Typically, distant point-like light sources are quasars, but quasar spectra have a much broader shape.
Illustration: NASA, ESA, CSA, Joseph Olmsted (STScI)

Has Yan’s team discovered a missing link in the cosmos? Once the team determined that the objects didn’t fit the definition of a quasar, graduate student researcher Bangzheng Sun analyzed the data to see if there were signatures of star-forming galaxies.

“From the low-resolution spectra we have, we can’t rule out the possibility that these nine objects are star-forming galaxies. That data fits,” said Sun. “The strange thing in that case is that the galaxies are so tiny and compact, even though Webb has the resolving power to show us a lot of detail at this distance.”

One proposal the team suggests is that Webb, as promised, is revealing earlier stages of galaxy formation and evolution than we have ever been able to see before. It is generally accepted across the astronomy community that large, massive galaxies like our own Milky Way grew by many smaller galaxies merging together. But, Yan asks, what comes before small galaxies? 

“I think this new research is presenting us with the question, how does the process of galaxy formation first begin? Can such small, building-block galaxies be formed in a quiet way, before chaotic mergers begin, as their point-like appearance suggests?” Yan said.

To begin answering that question, as well as to determine more about the nature of their odd platypuses, the team says they need a much larger sample than nine to analyze, and with higher-resolution spectra. 

“We cast a wide net, and we found a few examples of something incredible. These nine objects weren’t the focus; they were just in the background of broad Webb surveys,” said Yan. “Now it’s time to think about the implications of that, and how we can use Webb’s capabilities to learn more.”

The James Webb Space Telescope is the world’s premier space science observatory. Webb is solving mysteries in our solar system, looking beyond to distant worlds around other stars, and probing the mysterious structures and origins of our universe and our place in it. Webb is an international program led by NASA with its partners, ESA (European Space Agency) and CSA (Canadian Space Agency).

To learn more about Webb, visit:

https://science.nasa.gov/webb

Downloads & Related Information

The following sections contain links to download this article’s images and videos in all available resolutions followed by related information links, media contacts, and if available, research paper and spanish translation links.

Related Images & Videos

James Webb Space Telescope image showing a broad area of space with many small galaxies, four of which are highlighted in pull-out boxes. The four highlighted galaxies are very small, appearing as points of light. Black areas of the overall image indicate where the telescope did not collect data - a vertical section in the center and a square in the lower left corner.

Galaxies in CEERS Field (NIRCam image)

Four of the nine galaxies in the newly identified “platypus” sample were discovered in NASA’s James Webb Space Telescope’s Cosmic Evolution Early Release Science Survey” (CEERS). One key feature that makes them distinct is their point-like appearance.

Infographic titled Galaxy CEERS 4233-42232, comparison with quasar spectrum.  Text at top right reads NIRSpec, Multi-Object Spectroscopy. Vertical Y axis of graph is labeled Brightness, more with an arrow pointing up and less with an arrow pointing down. Horizontal X axis is labeled Velocity of Gas (miles/second) in increments of one thousand starting with negative 4,000 on the left to 4,000 on the right. The spectrum of the galaxy is shown with a white line that peaks sharply at zero. The spectrum of the quasar example is shown with a dashed blue line that also peaks at zero, but with less brightness and a broader base that begins to increase in brightness at negative 1,000 miles per second the  and declines to at about 1,500 miles per second.

Galaxy CEERS 4233-42232: Comparison With Quasar Spectrum

This graphic illustrates the pronounced narrow peak of the spectra that caught researchers’ attention in a small sample of galaxies, represented here by galaxy CEERS 4233-42232. Typically, distant point-like light sources are quasars, but quasar spectra have a much broader shape.

Related Links

Read more: Webb Science: Galaxies Through Time

Explore more: ViewSpace Seeing Farther: Hubble Ultra Deep Field

Explore more: JWST’s Tiny Red Sources and the Big Questions They Raise

Read more: Webb Shows Many Early Galaxies Looked Like Pool Noodles, Surfboards

More Webb News

More Webb Images

Webb Science Themes

Webb Mission Page

Related for Kids

What is the Webb Telescope?

SpacePlace for Kids

Share

Details

Last Updated
Jan 06, 2026
Contact
Media

Laura Betz
NASA’s Goddard Space Flight Center
Greenbelt, Maryland
laura.e.betz@nasa.gov

Leah Ramsay
Space Telescope Science Institute
Baltimore, Maryland

Christine Pulliam
Space Telescope Science Institute
Baltimore, Maryland

NASA Webb Finds Early-Universe Analog’s Unexpected Talent for Making Dust

6 January 2026 at 12:14
 
6 Min Read

NASA Webb Finds Early-Universe Analog’s Unexpected Talent for Making Dust

A region of space is filled with stars and clumps of glowing orange and tan dust. A small  portion of the sky at the center of the image is outlined with a white box. Lines extend from the corner of the box to the inset panel at the top right showing a magnified version of the outlined portion of the image. In the inset, there are smatterings of dim whitish-blueish stars and about seven glowing red orbs across the center in a line. Also across the center of the inset is a green glow. The background of the image is filled with stars and galaxies of various shapes and colors.
Images from NASA’s James Webb Space Telescope of the dwarf galaxy Sextans A reveal polycyclic aromatic hydrocarbons (PAHs), large carbon-based molecules that can be a signifier of star formation. The inset at the top right zooms in on those PAHs, which are represented in green.
Credits: Image: NASA, ESA, CSA, Elizabeth Tarantino (STScI), Martha Boyer (STScI), Julia Roman-Duval (STScI); Image Processing: Alyssa Pagan (STScI)

Using NASA’s James Webb Space Telescope, astronomers have spotted two rare kinds of dust in the dwarf galaxy Sextans A, one of the most chemically primitive galaxies near the Milky Way. The finding of metallic iron dust and silicon carbide (SiC) produced by aging stars, along with tiny clumps of carbon-based molecules, shows that even when the universe had only a fraction of today’s heavy elements, stars and the interstellar medium could still forge solid dust grains. This research with Webb is reshaping ideas about how early galaxies evolved and developed the building blocks for planets, as NASA explores the secrets of the universe and our place in it.

Sextans A lies about 4 million light-years away and contains only 3 to 7 percent of the Sun’s metal content, or metallicity, the astrophysical term for elements heavier than hydrogen and helium. Because the galaxy is so small, unlike other nearby galaxies, its gravitational pull is too weak to retain the heavy elements like iron and oxygen created by supernovae and aging stars.

Galaxies like it resemble those that filled the early universe just after the big bang, when the universe was made of mostly hydrogen and helium, before stars had time to enrich space with ‘metals.’ Because it is relatively close, Sextans A gives astronomers a rare chance to study individual stars and interstellar clouds under conditions similar to those shortly after the big bang.

“Sextans A is giving us a blueprint for the first dusty galaxies,” said Elizabeth Tarantino, postdoctoral researcher at the Space Telescope Science Institute and lead author of the results in one of the two studies presented at a press conference at the 247th meeting of the American Astronomical Society in Phoenix. “These results help us interpret the most distant galaxies imaged by Webb and understand what the universe was building with its earliest ingredients.”

Image A: Sextans A PAHs Pull-out (NIRCam and MIRI Image)

A region of space is filled with stars and clumps of glowing orange and tan dust. A small  portion of the sky at the center of the image is outlined with a white box. Lines extend from the corner of the box to the inset panel at the top right showing a magnified version of the outlined portion of the image. In the inset, there are smatterings of dim whitish-blueish stars and about seven glowing red orbs across the center in a line. Also across the center of the inset is a green glow. The background of the image is filled with stars and galaxies of various shapes and colors.
Images from NASA’s James Webb Space Telescope of the dwarf galaxy Sextans A reveal polycyclic aromatic hydrocarbons (PAHs), large carbon-based molecules that can be a signifier of star formation. The inset at the top right zooms in on those PAHs, which are represented in green.
Image: NASA, ESA, CSA, Elizabeth Tarantino (STScI), Martha Boyer (STScI), Julia Roman-Duval (STScI); Image Processing: Alyssa Pagan (STScI)

Forging dust without usual ingredients

One of those studies, published in the Astrophysical Journal, honed in on a half a dozen stars with the low-resolution spectrometer aboard Webb’s MIRI (Mid-Infrared Instrument). The data collected shows the chemical fingerprints of the bloated stars very late in their evolution, called asymptotic giant branch (AGB) stars. Stars with masses between one and eight times that of the Sun pass through this phase.

“One of these stars is on the high-mass end of the AGB range, and stars like this usually produce silicate dust. However, at such low metallicity, we expect these stars to be nearly dust-free,” said Martha Boyer, associate astronomer at the Space Telescope Science Institute and lead author in that second companion study. “Instead, Webb revealed a star forging dust grains made almost entirely of iron. This is something we’ve never seen in stars that are analogs of stars in the early universe.”

Silicates, the usual dust formed by oxygen-rich stars, require elements like silicon and magnesium that are almost nonexistent in Sextans A. It would be like trying to bake cookies in a kitchen without flour, sugar, and butter. 

A normal cosmic kitchen, like the Milky Way, has those crucial ingredients in the form of silicon, carbon, and iron. In a primitive kitchen, like Sextans A, where almost all of those ingredients are missing, you barely have any proverbial flour or sugar. Therefore, astronomers expected that without those key ingredients, stars in Sextans A couldn’t “bake” much dust at all. 

However, not only did they find dust, but Webb showed that one of these stars used an entirely different recipe than usual to make that dust. 

The iron-only dust, as well as silicon carbide produced by the less massive AGB stars despite the galaxy’s low silicon abundance, proves that evolved stars can still build solid material even when the typical ingredients are missing. 

“Dust in the early universe may have looked very different from the silicate grains we see today,” Boyer said. “These iron grains absorb light efficiently but leave no sharp spectral fingerprints and can contribute to the large dust reservoirs seen in far-away galaxies detected by Webb.”

Image B: Sextans A Context Image (Webb and KPNO)

Two panels showing different views of a small galaxy. The left panel, labeled Webb, shows a region of space filled with stars and small clumps of glowing orange and tan dust. The right panel is labeled KPNO. This image shows stars on the black background of space, with a higher concentration of them in a globe at the center. On the edges of this circular globe, there are puffs of pink gas. A small portion of the of the galaxy in the right panel is outlined with a white box, and the image from the left panel appears in that box at a 45-degree angle. Lines extend from the corner of the box to the panel at the left.
NASA’s James Webb Space Telescope’s image of a portion of the nearby Sextans A galaxy is put into context using a ground-based image from the Nicholas U. Mayall 4-meter Telescope at Kitt Peak National Observatory.
Image: STScI, NASA, ESA, CSA, KPNO, NSF’s NOIRLab, AURA, Elizabeth Tarantino (STScI), Phil Massey (Lowell Obs.), George Jacoby (NSF, AURA), Chris Smith (NSF, AURA); Image Processing: Alyssa Pagan (STScI), Travis Rector (UAA), Mahdi Zamani (NSF’s NOIRLab), Davide De Martin (NSF’s NOIRLab)

Tiny clumps of organic molecules

In the companion study, currently under peer review, Webb imaged Sextans A’s interstellar medium and discovered polycyclic aromatic hydrocarbons (PAHs), which are complex, carbon-based molecules and the smallest dust grains that glow in infrared light. The discovery means Sextans A is now the lowest-metallicity galaxy ever found to contain PAHs.

But, unlike the broad, sweeping PAH emission seen in metal-rich galaxies, Webb revealed PAHs in tiny, dense pockets only a few light-years across.

“Webb shows that PAHs can form and survive even in the most metal-starved galaxies, but only in small, protected islands of dense gas,” said Tarantino. 

The clumps likely represent regions where dust shielding and gas density reach just high enough to allow PAHs to form and grow, solving a decades-long mystery about why PAHs seem to vanish in metal-poor galaxies.

The team has an approved Webb Cycle 4 program to use high-resolution spectroscopy to study the detailed chemistry of Sextans A’s PAH clumps further. 

Image C: Giant Star in Dwarf Galaxy Sextans A (Spectrum)

Graphic titled “Giant Star in Dwarf Galaxy Sextans A: Iron-Rich Dust at Low Metallicities” showing a graph of brightness versus wavelength, with two sets of data and two model spectra. One set of data is represented in 12 orange triangle data points, and the other is a solid yellow line. A cyan solid line represents “Iron + 0.8% silicates” and a red dashed line represents “Iron + 5% silicates.” They appear on a graph of Brightness on the y-axis versus Wavelength of Light in microns on x-axis. The y-axis ranges from dimmer at bottom to brighter at top. The x-axis ranges from 0 to 12 microns.
This graph shows a spectrum of an Asymptotic Giant Branch (AGB) star in the Sextans A galaxy. It compares data collected by NASA’s James Webb Space Telescope with models of mostly silicate-free dust and dust containing at least 5% silicates. 
Illustration: NASA, ESA, CSA, STScI, Joseph Olmsted (STScI)

Connecting two discoveries

Together, the results show that the early universe had more diverse dust production pathways than the more established and proven methods, like supernova explosions. Additionally, researchers now know there’s more dust than predicted at extremely low metallicities. 

“Every discovery in Sextans A reminds us that the early universe was more inventive than we imagined,” said Boyer. “Clearly stars found a way to make the building blocks of planets long before galaxies like our own existed.”

The James Webb Space Telescope is the world’s premier space science observatory. Webb is solving mysteries in our solar system, looking beyond to distant worlds around other stars, and probing the mysterious structures and origins of our universe and our place in it. Webb is an international program led by NASA with its partners, ESA (European Space Agency) and CSA (Canadian Space Agency).

To learn more about Webb, visit:

https://science.nasa.gov/webb

Downloads & Related Information

The following sections contain links to download this article’s images and videos in all available resolutions followed by related information links, media contacts, and if available, research paper and spanish translation links.

Related Images & Videos

A region of space is filled with stars and clumps of glowing orange and tan dust. A small portion of the sky at the center of the image is outlined with a white box. Lines extend from the corner of the box to the inset panel at the top right showing a magnified version of the outlined portion of the image. In the inset, there are smatterings of dim whitish-blueish stars and about seven glowing red orbs across the center in a line. Also across the center of the inset is a green glow. The background of the image is filled with stars and galaxies of various shapes and colors.

Sextans A PAHs Pull-out (NIRCam and MIRI Image)

Images from NASA’s James Webb Space Telescope of the dwarf galaxy Sextans A reveal polycyclic aromatic hydrocarbons (PAHs), large carbon-based molecules that can be a signifier of star formation. The inset at the top right zooms in on those PAHs, which are represented in green.

Two panels showing different views of a small galaxy. The left panel, labeled Webb, shows a region of space filled with stars and small clumps of glowing orange and tan dust. The right panel is labeled KPNO. This image shows stars on the black background of space, with a higher concentration of them in a globe at the center. On the edges of this circular globe, there are puffs of pink gas. A small portion of the of the galaxy in the right panel is outlined with a white box, and the image from the left panel appears in that box at a 45-degree angle. Lines extend from the corner of the box to the panel at the left.

Sextans A Context Image (Webb and KPNO)

NASA’s James Webb Space Telescope’s image of a portion of the nearby Sextans A galaxy is put into context using a ground-based image from the Nicholas U. Mayall 4-meter Telescope at Kitt Peak National Observatory.

Image titled u201cJames Webb Space Telescope; Sextans A, UGCA 205,u201d with compass arrows, scale bar, and color key. At the left, a region of space is filled with stars and clumps of glowing orange and tan dust. A small portion of the sky at the center of the image is outlined with a white box. In the inset, there are smatterings of dim whitish-blueish stars and about seven glowing red orbs across the center in a line. Also across center of the image is a green glow. At the bottom left are compass arrows indicating the orientation of the image on the sky. The east arrow points toward 2 ou2019clock. The north arrow points in the 10 ou2019clock direction. At the bottom left is a scale bar labeled 300 light-years, 15 arcsec. The length of the scale bar is about one tenth of the total image. Below the image is a color key showing which NIRCam and MIRI filters were used to create the image and which visible-light color is assigned to each filter.

Sextans A PAHs Pull-out (Compass Image)

This image of dwarf galaxy Sextans A, captured by NASA’s James Webb Space Telescope’s Near Infrared Camera (NIRCam) and Mid-Infrared Instrument (MIRI), shows compass arrows, scale bar, and color key for reference.

Graphic titled u201cGiant Star in Dwarf Galaxy Sextans A: Iron-Rich Dust at Low Metallicitiesu201d showing a graph of brightness versus wavelength, with two sets of data and two model spectra. One set of data is represented in 12 orange triangle data points, and the other is a solid yellow line. A cyan solid line represents u201cIron + 0.8% silicatesu201d and a red dashed line represents u201cIron + 5% silicates.u201d They appear on a graph of Brightness on the y-axis versus Wavelength of Light in microns on x-axis. The y-axis ranges from dimmer at bottom to brighter at top. The x-axis ranges from 0 to 12 microns.

Giant Star in Dwarf Galaxy Sextans A (Spectrum)

This graph shows a spectrum of an Asymptotic Giant Branch (AGB) star in the Sextans A galaxy. It compares data collected by NASA’s James Webb Space Telescope with models of mostly silicate-free dust and dust containing at least 5% silicates.

Related Links

Read more: Webb Science: Galaxies Through Time

Explore more: Massive stars: Engines of Creation

Explore more: Wolf-Rayet Apep Visualization

Read more: Spectroscopy 101

More Webb News

More Webb Images

Webb Science Themes

Webb Mission Page

Related for Kids

What is the Webb Telescope?

SpacePlace for Kids

Share

Details

Last Updated
Jan 06, 2026
Contact
Media

Laura Betz
NASA’s Goddard Space Flight Center
Greenbelt, Maryland
laura.e.betz@nasa.gov

Hannah Braun
Space Telescope Science Institute
Baltimore, Maryland

NASA’s Hubble Examines Cloud-9, First of New Type of Object

5 January 2026 at 12:15
6 Min Read

NASA’s Hubble Examines Cloud-9, First of New Type of Object

A region of space mostly filled with background galaxies, with one prominent star at upper left. A large blob of purple haze occupies much of the field. Within the purple region, an unremarkable area is outlined with a dashed white circle.
Magenta is radio data from the ground-based Very Large Array showing the presence of Cloud-9. The dashed circle marks the peak of radio emission, which is where researchers focused their search for stars. Hubble found no stars within Cloud-9. The few objects within its boundaries are background galaxies.
Credits:
NASA, ESA, VLA, Gagandeep Anand (STScI), Alejandro Benitez-Llambay (University of Milano-Bicocca); Image Processing: Joseph DePasquale (STScI)

A team using NASA’s Hubble Space Telescope has uncovered a new type of astronomical object — a starless, gas-rich, dark-matter cloud considered a “relic” or remnant of early galaxy formation. Nicknamed “Cloud-9,” this is the first confirmed detection of such an object in the universe — a finding that furthers the understanding of galaxy formation, the early universe, and the nature of dark matter itself.

“This is a tale of a failed galaxy,” said the program’s principal investigator, Alejandro Benitez-Llambay of the Milano-Bicocca University in Milan, Italy. “In science, we usually learn more from the failures than from the successes. In this case, seeing no stars is what proves the theory right. It tells us that we have found in the local universe a primordial building block of a galaxy that hasn’t formed.”

The results, published in The Astrophysical Journal Letters, were presented at a press conference Monday at the 247th meeting of the American Astronomical Society in Phoenix.

“This cloud is a window into the dark universe,” said team member Andrew Fox of the Association of Universities for Research in Astronomy/Space Telescope Science Institute (AURA/STScI) for the European Space Agency. “We know from theory that most of the mass in the universe is expected to be dark matter, but it’s difficult to detect this dark material because it doesn’t emit light. Cloud-9 gives us a rare look at a dark-matter-dominated cloud.”

A region of space mostly filled with background galaxies, with one prominent star at upper left. A large blob of purple haze occupies much of the field. Within the purple region, an unremarkable area is outlined with a dashed white circle.
This image shows the location of Cloud-9, which is 14 million light-years from Earth. The diffuse magenta is radio data from the ground-based Very Large Array (VLA) showing the presence of the cloud. The dashed circle marks the peak of radio emission, which is where researchers focused their search for stars. Follow-up observations by the Hubble Space Telescope’s Advanced Camera for Surveys found no stars within the cloud. The few objects that appear within its boundaries are background galaxies. Before the Hubble observations, scientists could argue that Cloud-9 is a faint dwarf galaxy whose stars could not be seen with ground-based telescopes due to the lack of sensitivity. Hubble’s Advanced Camera for Surveys shows that, in reality, the failed galaxy contains no stars.
Science: NASA, ESA, VLA, Gagandeep Anand (STScI), Alejandro Benitez-Llambay (University of Milano-Bicocca); Image Processing: Joseph DePasquale (STScI)

The object is called a Reionization-Limited H I Cloud, or “RELHIC.” The term “H I” refers to neutral hydrogen, and “RELHIC” describes a natal hydrogen cloud from the universe’s early days, a fossil leftover that has not formed stars. For years, scientists have looked for evidence of such a theoretical phantom object. It wasn’t until they turned Hubble toward the cloud, confirming that it is indeed starless, that they found support for the theory.

“Before we used Hubble, you could argue that this is a faint dwarf galaxy that we could not see with ground-based telescopes. They just didn’t go deep enough in sensitivity to uncover stars,” said lead author Gagandeep Anand of STScI. “But with Hubble’s Advanced Camera for Surveys, we’re able to nail down that there’s nothing there.”

The discovery of this relic cloud was a surprise. “Among our galactic neighbors, there might be a few abandoned houses out there,” said STScI’s Rachael Beaton, who is also on the research team.

Astronomers think RELHICs are dark matter clouds that couldn’t accumulate enough gas to form stars. They represent a window into the early stages of galaxy formation. Cloud-9 suggests the existence of many other small, dark matter-dominated structures in the universe — other failed galaxies. This discovery provides new insights into the dark components of the universe that are difficult to study through traditional observations, which focus on bright objects like stars and galaxies.

Scientists have studied hydrogen clouds near the Milky Way for many years, but these clouds tend to be much bigger and more irregular than Cloud-9. Compared with other observed hydrogen clouds, Cloud-9 is smaller, more compact, and highly spherical, making it look very different from the others.

The core of this object is composed of neutral hydrogen and is about 4,900 light-years in diameter. Researchers measured the hydrogen gas in Cloud-9 by the radio waves it emits, measuring it to be approximately one million times the mass of the Sun. Assuming that the gas pressure is balancing the dark matter cloud’s gravity, which appears to be the case, researchers calculated Cloud-9’s dark matter must be about five billion solar masses.

Cloud-9 is an example of structures and mysteries that don’t involve stars. Just looking at stars doesn’t give the full picture. Studying the gas and dark matter helps provide a more complete understanding of what’s going on in these systems that would otherwise be unknown.

Observationally, identifying these failed galaxies is challenging because nearby objects outshine them. Such systems are also vulnerable to environmental effects like ram-pressure stripping, which can remove gas as the cloud moves through intergalactic space. These factors further reduce their expected numbers.

The starless relic was discovered three years ago as part of a radio survey by the Five-hundred-meter Aperture Spherical Telescope (FAST) in Guizhou, China, a finding later confirmed by the Green Bank Telescope and the Very Large Array facilities in the United States. But only with Hubble could researchers definitively determine that the failed galaxy contains no stars.

Cloud-9 was simply named sequentially, having been the ninth gas cloud identified on the outskirts of a nearby spiral galaxy, Messier 94 (M94). The cloud is close to M94 and appears to have a physical association with the galaxy. High-resolution radio data shows slight gas distortions, possibly indicating interaction between the cloud and galaxy.

The cloud may eventually form a galaxy in the future, provided it grows more massive — although how that would occur is under speculation. If it were much bigger, say, more than 5 billion times the mass of our Sun, it would have collapsed, formed stars, and become a galaxy that would be no different than any other galaxy we see. If it were much smaller than that, the gas could have been dispersed and ionized and there wouldn’t be much left. But it’s in a sweet spot where it could remain as a RELHIC.

The lack of stars in this object provides a unique window into the intrinsic properties of dark matter clouds. The rarity of such objects and the potential for future surveys is expected to enhance the discovery of more of these “failed galaxies” or “relics,” resulting in insights into the early universe and the physics of dark matter.  

The Hubble Space Telescope has been operating for more than three decades and continues to make ground-breaking discoveries that shape our fundamental understanding of the universe. Hubble is a project of international cooperation between NASA and ESA (European Space Agency). NASA’s Goddard Space Flight Center in Greenbelt, Maryland, manages the telescope and mission operations. Lockheed Martin Space, based in Denver, also supports mission operations at Goddard. The Space Telescope Science Institute in Baltimore, which is operated by the Association of Universities for Research in Astronomy, conducts Hubble science operations for NASA.

Facebook logo
Instagram logo

Related Images & Videos

A region of space mostly filled with background galaxies, with one prominent star at upper left. A large blob of purple haze occupies much of the field. Within the purple region, an unremarkable area is outlined with a dashed white circle.

Cloud 9, Starless Gas Cloud

Magenta is radio data from the ground-based Very Large Array (VLA) showing the presence of Cloud-9. The dashed circle marks the area where researchers focused their search for stars. Hubble found no stars within Cloud-9. The few objects within its boundaries are background galaxies.

An image labeled u201cCloud 9 HST ACS WFCu201d. Below that, a color key shows F606W in blue, F814W in orange, and Radio VLA in purple. A region of space mostly filled with background galaxies, with one prominent star at upper left. A large blob of purple haze occupies much of the field. Within the purple region, an unremarkable area is outlined with a dashed white circle. At lower left, a scale bar extending about one-sixth of the image is labeled 2,000 light-years and 30 arcseconds. At lower right are compass arrows with east pointing to 10 ou2019clock and north pointing to 2 ou2019clock.

Cloud 9, Starless Gas Cloud Compass Image

This is an annotated composite image of Cloud-9, a Reionization-Limited H I Cloud (RELHIC), as captured by the Hubble Space Telescope’s ACS (Advanced Camera for Surveys) and the ground-based Very Large Array (VLA) radio telescope.

A region of space mostly filled with background galaxies, with one prominent star at upper left. A large blob of purple haze occupies much of the field. Within the purple region, an unremarkable area is outlined with a dashed white circle.

Cloud 9, Starless Gas Cloud Video

This annotated video shows the location of Cloud-9 on the sky. As the video zooms into this gas-rich, dark-matter cloud, it becomes evident that there are no stars within it. Only background galaxies appear behind Cloud-9, which has survived since the universe’s early days….


Share

Details

Last Updated
Jan 05, 2026
Editor
Andrea Gianopoulos
Contact
Media

Claire Andreoli
NASA’s Goddard Space Flight Center
Greenbelt, Maryland
claire.andreoli@nasa.gov

Ann Jenkins, Christine Pulliam
Space Telescope Science Institute
Baltimore, Maryland

Hubble Glimpses Galactic Gas Making a Getaway

2 January 2026 at 10:39
A nearly edge-on spiral galaxy. Its disk holds pink light from star-forming nebulae and blue light from clusters of hot stars. Thick dark clouds of dust block the strong white light from galaxy’s center. A faint, glowing halo of gas surrounds the disk, fading into the black background of space. A bluish plume of gas also extends from the galaxy’s core extending toward the lower-right corner of the image.
This NASA/ESA Hubble Space Telescope image features the galaxy NGC 4388, a member of the Virgo galaxy cluster.
ESA/Hubble & NASA, S. Veilleux, J. Wang, J. Greene

A sideways spiral galaxy shines in this NASA/ESA Hubble Space Telescope image. Located about 60 million light-years away in the constellation Virgo (the Maiden), NGC 4388 is a resident of the Virgo galaxy cluster. This enormous cluster of galaxies contains more than a thousand members and is the nearest large galaxy cluster to the Milky Way.

NGC 4388 appears to tilt at an extreme angle relative to our point of view, giving us a nearly edge-on prospect of the galaxy. This perspective reveals a curious feature that wasn’t visible in a previous Hubble image of this galaxy released in 2016: a plume of gas from the galaxy’s nucleus, here seen billowing out from the galaxy’s disk toward the lower-right corner of the image. But where did this outflow come from, and why does it glow?

The answer likely lies in the vast stretches of space that separate the galaxies of the Virgo cluster. Though the space between galaxies appears empty, this space is occupied by hot wisps of gas called the intracluster medium. As NGC 4388 moves within the Virgo cluster, it plunges through the intracluster medium. Pressure from hot intracluster gas whisks away gas from within NGC 4388’s disk, causing it to trail behind as NGC 4388 moves.

The source of the ionizing energy that causes this gas cloud to glow is more uncertain. Researchers suspect that some of the energy comes from the center of the galaxy, where a supermassive black hole spins gas around it into a superheated disk. The blazing radiation from this disk might ionize the gas closest to the galaxy, while shock waves might be responsible for ionizing filaments of gas farther out.

This image incorporates new data, including several additional wavelengths of light, that bring the ionized gas cloud into view. The image holds data from several observing programs that aim to illuminate galaxies with active black holes at their centers.

Image credit: ESA/Hubble & NASA, S. Veilleux, J. Wang, J. Greene

NASA’s Chandra Rings in New Year With Champagne Cluster

By: Lee Mohon
30 December 2025 at 11:45
This release features a composite image of a galaxy cluster first discovered on New Year's Eve day, 2020. The cluster appears here as a large collection of brilliant white lights, each a distinct galaxy. A neon purple cloud stretches across the cluster's crowded core. Many of the hundred-plus galaxies in the cluster are in two clumps of galaxies towards the top and bottom of center. Some are encircled by a faint glowing haze, while a few foreground stars gleam with diffraction spikes. Some of the smaller galaxies are tinted blue, orange, or red, and some appear more oblong than round, suggesting spiral shapes viewed edge-on. The neon purple cloud sits at the heart of the image, surrounding the most densely-packed part of the cluster. This cloud, which spreads vertically across the cluster, is multimillion-degree gas observed by Chandra. The two clumps of observable galaxies, and the spread of superheated gas, reveal that the Champagne Cluster is in fact two clusters in the process of colliding. With the two clusters of sparkling light clinking together, and the auspicious discovery date, astronomers have dubbed the merged cosmic structure "The Champagne Cluster".
X-ray: NASA/CXC/UCDavis/F. Bouhrik et al.; Optical:Legacy Survey/DECaLS/BASS/MzLS; Image Processing: NASA/CXC/SAO/P. Edmonds and L. Frattare

Celebrate the New Year with the “Champagne Cluster,” a galaxy cluster seen in this new image from NASA’s Chandra X-ray Observatory and optical telescopes.

Astronomers discovered this galaxy cluster Dec. 31, 2020. The date, combined with the bubble-like appearance of the galaxies and the superheated gas seen with Chandra observations (represented in purple), inspired the scientists to nickname the galaxy cluster the Champagne Cluster, a much easier-to-remember name than its official designation of RM J130558.9+263048.4.

The new composite image shows that the Champagne Cluster is actually two galaxy clusters in the process of merging to form an even larger cluster. Multimillion-degree gas in galaxy clusters usually takes on an approximately circular or moderately oval shape in images, but in the Champagne Cluster it is more widely spread from top to bottom, revealing the presence of the two colliding clusters. Two clumps of individual galaxies making up the colliding clusters can be seen toward the top and bottom of center. (The image has been rotated clockwise by 90 degrees so that North points to the right.)

The hot gas outweighs the combined mass in all of the hundred-plus individual galaxies in the newly forming cluster. The clusters also contain even larger amounts of unseen dark matter, the mysterious substance that pervades the universe.

In addition to the Chandra data, this new image contains optical data from the Legacy Surveys (red, green, and blue), which consists of three individual and complementary surveys from various telescopes in Arizona and Chile.

The Champagne Cluster is a member of a rare class of merging clusters, which includes the well-known Bullet Cluster, where the hot gas in each cluster has collided and slowed down, and there is a clear separation between the hot gas and the most massive galaxy in each cluster.

By comparing the data with computer simulations, astronomers came up with two possibilities for the history of the Champagne Cluster. One is that the two clusters already collided with each other over two billion years ago. After the collision the two clusters traveled outward and then were pulled back toward each other by gravity, and are now heading into a second collision. The other idea is that a single collision occurred about 400 million years ago, and the two clusters are now traveling away from each other after that collision. Researchers think further studies of the Champagne Cluster can potentially teach them how dark matter reacts to a high-speed collision.

A paper describing these results recently appeared in The Astrophysical Journal and is available online. The authors of the paper are Faik Bouhrik, Rodrigo Stancioli, and David Wittman, all from the University of California, Davis.

NASA’s Marshall Space Flight Center in Huntsville, Alabama, manages the Chandra program. The Smithsonian Astrophysical Observatory’s Chandra X-ray Center controls science operations from Cambridge, Massachusetts, and flight operations from Burlington, Massachusetts.


Read more from NASA’s Chandra X-ray Observatory

Learn more about the Chandra X-ray Observatory and its mission here:

https://www.nasa.gov/chandra

https://chandra.si.edu

Visual Description

This release features a composite image of a galaxy cluster discovered on New Year’s Eve day, 2020.

The cluster appears here as a large collection of brilliant white lights, each a distinct galaxy. A neon purple cloud stretches across the cluster’s crowded core. Many of the hundred-plus galaxies in the cluster are in two clumps of galaxies towards the top and bottom of center. Some are encircled by a faint glowing haze, while a few foreground stars gleam with diffraction spikes. Some of the smaller galaxies are tinted blue, orange, or red, and some appear more oblong than round, suggesting spiral shapes viewed edge-on.

The neon purple cloud sits at the heart of the image, surrounding the most densely-packed part of the cluster. This cloud, which spreads vertically across the cluster, is multimillion-degree gas observed by Chandra. The two clumps of observable galaxies, and the spread of superheated gas, reveal that the Champagne Cluster is in fact two clusters in the process of colliding.

With the two clusters of sparkling light clinking together, and the auspicious discovery date, astronomers have dubbed the merged cosmic structure “The Champagne Cluster”.

News Media Contact

Megan Watzke
Chandra X-ray Center
Cambridge, Mass.
617-496-7998
mwatzke@cfa.harvard.edu

Joel Wallace
Marshall Space Flight Center, Huntsville, Alabama
256-544-0034
joel.w.wallace@nasa.gov

A Galactic Embrace

29 December 2025 at 11:43
A pair of colliding spiral galaxies. Here, both spirals are shown face on, with the smaller of the two galaxies, IC 2163, at the upper left of the larger galaxy, NGC 2207, which dominates the center and lower right of the image. Both galaxies have long, spiraling, silver blue arms, dotted with specs of blue and red. Toward our upper left, the curving arms overlap, and bend toward their neighbors' core. James Webb mid-infrared image (white, gray, and red) and adds the X-ray view from Chandra (blue).
X-ray: NASA/CXC/SAO; Infrared: NASA/ESA/CSA/STScI/Webb; Image Processing: NASA/CXC/SAO/L. Frattare

Mid-infrared data from NASA’s James Webb Space Telescope (in white, gray, and red) and X-ray data from NASA’s Chandra X-ray Observatory (in blue) come together in this photo of colliding spiral galaxies released on Dec. 1, 2025. The pair grazed one another millions of years ago; billions of years in the future, they will merge into a single galaxy.

Image credit: X-ray: NASA/CXC/SAO; Infrared: NASA/ESA/CSA/STScI/Webb; Image Processing: NASA/CXC/SAO/L. Frattare

A Dance of Galaxies

22 December 2025 at 11:26
This Webb image shows two interacting galaxies. NGC 4490 occupies the left side of the image, while NGC 4485 appears as a white glowing hue in the top right of the field. Both galaxies are connected by a bright stream of red stretching from the top left of the image, through the bottom center, and ending at the right under galaxy NGC 4485. There are regions of bright blue ionized gas visible in concentrated areas of the red stream. The background is black with multiple galaxies in various shapes throughout.
These two galaxies are named NGC 4490 and NGC 4485, and they’re located about 24 million light-years away in the constellation Canes Venatici (The Hunting Dogs). They are the closest known interacting dwarf-dwarf galaxy system where astronomers have observed the interactions between them, as well as been able to resolve the stars within.
ESA/Webb, NASA & CSA, A. Adamo (Stockholm University), G. Bortolini, and the FEAST JWST team

NASA’s James Webb Space Telescope captured two nearby dwarf galaxies interacting with each other in this image released on Dec. 2, 2025. Dwarf galaxies can give us insights into galaxies in the early universe, which were thought to have less mass than galaxies like the Milky Way, and also contain a lot of gas, relatively few stars, and typically have small amounts of elements heavier than helium. Observing dwarf galaxies merge can tell us how galaxies billions of years ago might have grown and evolved.

Read more about this cosmic pair.

Image credit: ESA/Webb, NASA & CSA, A. Adamo (Stockholm University), G. Bortolini, and the FEAST JWST team

Hubble Glimpses Galactic Gas Making a Getaway

19 December 2025 at 07:00

2 min read

Hubble Glimpses Galactic Gas Making a Getaway

A nearly edge-on spiral galaxy. Its disk holds pink light from star-forming nebulae and blue light from clusters of hot stars. Thick dark clouds of dust block the strong white light from galaxy’s center. A faint, glowing halo of gas surrounds the disk, fading into the black background of space. A bluish plume of gas also extends from the galaxy’s core extending toward the lower-right corner of the image.
This NASA/ESA Hubble Space Telescope image features the galaxy NGC 4388, a member of the Virgo galaxy cluster.
ESA/Hubble & NASA, S. Veilleux, J. Wang, J. Greene

A sideways spiral galaxy shines in this NASA/ESA Hubble Space Telescope image. Located about 60 million light-years away in the constellation Virgo (the Maiden), NGC 4388 is a resident of the Virgo galaxy cluster. This enormous cluster of galaxies contains more than a thousand members and is the nearest large galaxy cluster to the Milky Way.

NGC 4388 appears to tilt at an extreme angle relative to our point of view, giving us a nearly edge-on prospect of the galaxy. This perspective reveals a curious feature that wasn’t visible in a previous Hubble image of this galaxy released in 2016: a plume of gas from the galaxy’s nucleus, here seen billowing out from the galaxy’s disk toward the lower-right corner of the image. But where did this outflow come from, and why does it glow?

The answer likely lies in the vast stretches of space that separate the galaxies of the Virgo cluster. Though the space between galaxies appears empty, this space is occupied by hot wisps of gas called the intracluster medium. As NGC 4388 moves within the Virgo cluster, it plunges through the intracluster medium. Pressure from hot intracluster gas whisks away gas from within NGC 4388’s disk, causing it to trail behind as NGC 4388 moves.

The source of the ionizing energy that causes this gas cloud to glow is more uncertain. Researchers suspect that some of the energy comes from the center of the galaxy, where a supermassive black hole spins gas around it into a superheated disk. The blazing radiation from this disk might ionize the gas closest to the galaxy, while shock waves might be responsible for ionizing filaments of gas farther out.

This image incorporates new data, including several additional wavelengths of light, that bring the ionized gas cloud into view. The image holds data from several observing programs that aim to illuminate galaxies with active black holes at their centers.

Facebook logo
Instagram logo

Media Contact:

Claire Andreoli (claire.andreoli@nasa.gov)
NASA’s Goddard Space Flight CenterGreenbelt, MD

NASA’s SPHEREx Observatory Completes First Cosmic Map Like No Other

By: scarney1
18 December 2025 at 12:56

6 min read

Preparations for Next Moonwalk Simulations Underway (and Underwater)

This panoramic view of SPHEREx’s first all-sky map shows how the sky looks to the telescope. It transitions between observations of colors emitted by hot hydrogen gas (blue) and cosmic dust (red), and those primarily emitted by stars.
Credit: NASA/JPL-Caltech

Launched in March, NASA’s SPHEREx space telescope has completed its first infrared map of the entire sky in 102 colors. While not visible to the human eye, these 102 infrared wavelengths of light are prevalent in the cosmos, and observing the entire sky this way enables scientists to answer big questions, including how a dramatic event that occurred in the first billionth of a trillionth of a trillionth of a second after the big bang influenced the 3D distribution of hundreds of millions of galaxies in our universe. In addition, scientists will use the data to study how galaxies have changed over the universe’s nearly 14 billion-year history and learn about the distribution of key ingredients for life in our own galaxy.  

“It’s incredible how much information SPHEREx has collected in just six months — information that will be especially valuable when used alongside our other missions’ data to better understand our universe,” said Shawn Domagal-Goldman, director of the Astrophysics Division at NASA Headquarters in Washington. “We essentially have 102 new maps of the entire sky, each one in a different wavelength and containing unique information about the objects it sees. I think every astronomer is going to find something of value here, as NASA’s missions enable the world to answer fundamental questions about how the universe got its start, and how it changed to eventually create a home for us in it.” 

Circling Earth about 14½ times a day, SPHEREx (which stands for Spectro-Photometer for the History of the Universe, Epoch of Reionization, and Ices Explorer) travels from north to south, passing over the poles. Each day it takes about 3,600 images along one circular strip of the sky, and as the days pass and the planet moves around the Sun, SPHEREx’s field of view shifts as well. After six months, the observatory has looked out into space in every direction, capturing the entire sky in 360 degrees. 

Managed by NASA’s Jet Propulsion Laboratory in Southern California, the mission began mapping the sky in May and completed its first all-sky mosaic in December. It will complete three additional all-sky scans during its two-year primary mission, and merging those maps together will increase the sensitivity of the measurements. The entire dataset is freely available to scientists and the public.  

“SPHEREx is a mid-sized astrophysics mission delivering big science,” said JPL Director Dave Gallagher. “It’s a phenomenal example of how we turn bold ideas into reality, and in doing so, unlock enormous potential for discovery.”  

NASA’s SPHEREx has mapped the entire sky in 102 infrared colors, which are invisible to the human eye but can be used to reveal different features of the cosmos. This image features a selection of colors emitted primarily by stars (blue, green, and white), hot hydrogen gas (blue), and cosmic dust (red).
NASA/JPL-Caltech
This SPHEREx image shows a selection of the infrared colors primarily emitted by stars and galaxies. The space telescope is observing hundreds of millions of distant galaxies across the sky. Its multiwavelength view will help astronomers measure the distance to those galaxies.
NASA/JPL-Caltech
The infrared colors emitted primarily by dust (red) and hot gas (blue), key ingredients for forming new stars and planets, are seen in this SPHEREx image. Though these clouds of material cover a massive portion of the sky, they are invisible in most wavelengths of light, including those the human eye can detect.
NASA/JPL-Caltech

Superpowered telescope 

Each of the 102 colors detected by SPHEREx represents a wavelength of infrared light, and each wavelength provides unique information about the galaxies, stars, planet-forming regions, and other cosmic features therein. For example, dense clouds of dust in our galaxy where stars and planets form radiate brightly in certain wavelengths but emit no light (and are therefore totally invisible) in others. The process of separating the light from a source into its component wavelengths is called spectroscopy.  

And while a handful of previous missions has also mapped the entire sky, such as NASA’s Wide-field Infrared Survey Explorer, none have done so in nearly as many colors as SPHEREx. By contrast, NASA’s James Webb Space Telescope can do spectroscopy with significantly more wavelengths of light than SPHEREx, but with a field of view thousands of times smaller. The combination of colors and such a wide field of view is why SPHEREx is so powerful. 

“The superpower of SPHEREx is that it captures the whole sky in 102 colors about every six months. That’s an amazing amount of information to gather in a short amount of time,” said Beth Fabinsky, the SPHEREx project manager at JPL. “I think this makes us the mantis shrimp of telescopes, because we have an amazing multicolor visual detection system and we can also see a very wide swath of our surroundings.” 

To accomplish this feat, SPHEREx uses six detectors, each paired with a specially designed filter that contains a gradient of 17 colors. That means every image taken with those six detectors contains 102 colors (six times 17). It also means that every all-sky map that SPHEREx produces is really 102 maps, each in a different color.  

The observatory will use those colors to measure the distance to hundreds of millions of galaxies. Though the positions of most of those galaxies have already been mapped in two dimensions by other observatories, SPHEREx’s map will be in 3D, enabling scientists to measure subtle variations in the way galaxies are clustered and distributed across the universe.  

Each frame of this movie shows the entire sky in a different infrared wavelength, indicated by the color bar in the top right corner. Taken by NASA’s SPHEREx observatory, the maps illustrate how viewing the universe in different wavelengths of light can reveal unique cosmic features.
Credit: NASA/JPL-Caltech

Those measurements will offer insights into an event that took place in the first billionth of a trillionth of a trillionth of a second after the big bang. In this moment, called inflation, the universe expanded by a trillion-trillionfold. Nothing like it has occurred in the universe since, and scientists want to understand it better. The SPHEREx mission’s approach is one way to help in that effort. 

More about SPHEREx 

The SPHEREx mission is managed by JPL for NASA’s Astrophysics Division within the Science Mission Directorate in Washington. The telescope and the spacecraft bus were built by BAE Systems. The science analysis of the SPHEREx data is being conducted by a team of scientists at 10 institutions across the U.S., and in South Korea and Taiwan. Data is processed and archived at IPAC at Caltech in Pasadena, which manages JPL for NASA. The mission’s principal investigator is based at Caltech with a joint JPL appointment. The SPHEREx dataset is publicly available. 

For more information about the SPHEREx mission visit: 

https://science.nasa.gov/mission/spherex/

News Media Contacts

Calla Cofield 
Jet Propulsion Laboratory, Pasadena, Calif. 
626-808-2469 
calla.e.cofield@jpl.nasa.gov 

2025-144

💾

Each frame of this movie shows the entire sky in a different infrared wavelength, indicated by the widget in the top right corner. Taken by NASA’s SPHEREx ob...

NASA’s Fermi Spots Young Star Cluster Blowing Gamma-Ray Bubbles

18 December 2025 at 10:15

4 min read

NASA’s Fermi Spots Young Star Cluster Blowing Gamma-Ray Bubbles

For the first time, astronomers using NASA’s Fermi Gamma-ray Space Telescope have traced a budding outflow of gas from a cluster of young stars in our galaxy — insights that help us understand how the universe has evolved as NASA explores the secrets of the cosmos for the benefit of all.

The cluster, called Westerlund 1, is located about 12,000 light-years away in the southern constellation Ara. It’s the closest, most massive, and most luminous super star cluster in the Milky Way. The only reason Westerlund 1 isn’t visible to the unaided eye is because it’s surrounded by thick clouds of dust. Its outflow extends below the plane of the galaxy and is filled with high-speed, hard-to-study particles called cosmic rays.

“Understanding cosmic ray outflows is crucial to better comprehending the long-term evolution of the Milky Way,” said Marianne Lemoine-Goumard, an astrophysicist at the University of Bordeaux in France. “We think these particles carry a large amount of the energy released within clusters. They could help drive galactic winds, regulate star formation, and distribute chemical elements within the galaxy.”

A paper detailing the results published Dec. 9 in Nature Communications. Lemoine-Goumard led the research with Lucia Härer and Lars Mohrmann, both at the Max Planck Institute for Nuclear Physics in Heidelberg, Germany.

A cluster of multicolored stars
This image of super star cluster Westerlund 1 was captured with the Near-InfraRed Camera on NASA’s James Webb’s Space Telescope. The cluster is largely hidden at visible wavelengths by dust clouds, which infrared light penetrates. Westerlund 1’s large, dense, and diverse stellar population of massive stars has no other known counterpart in the Milky Way.
ESA/Webb, NASA & CSA, M. Zamani (ESA/Webb), M. G. Guarcello (INAF-OAPA) and the EWOCS team

Super star clusters like Westerlund 1 contain more than 10,000 times our Sun’s mass. They are also more luminous and contain higher numbers of rare, massive stars than other clusters.

Scientists think that supernova explosions and stellar winds within star clusters push ambient gas outward, propelling cosmic rays to near light speed. About 90% of these particles are hydrogen nuclei, or protons, and the remainder are electrons and the nuclei of heavier elements.

Because cosmic ray particles are electrically charged, they change course when they encounter magnetic fields. This means scientists can’t trace them back to their sources. Gamma rays, however, travel in a straight line. Gamma rays are the highest-energy form of light, and cosmic rays produce gamma rays when they interact with matter in their environment.

Most gamma-ray observations of stellar clusters have limited resolution, so astronomers effectively see them as indistinct areas of emission. Because Westerlund 1 is so close and bright, however, it’s easier to study.

A top-down view of the Milky Way galaxy
Westerlund 1 is located closer to the center of the Milky Way than our Sun, as shown in this artist’s concept. Westerlund 1 is one of only a few known super star clusters in our galaxy and is the closest, brightest, and most massive one discovered so far.
NASA’s Goddard Space Flight Center/Conceptual Image Lab
A view of the underside of the Milky Way galaxy
This artist’s concept shows the location of Westerlund 1 relative to our Sun as seen from the underside of our Milky Way galaxy. The magenta bubble illustrates what the nascent outflow might look like in gamma rays. Westerlund 1 is located slightly below the middle of the galactic disk, so stellar activity pushes gas preferentially along a path of lower density beneath the disk.
NASA’s Goddard Space Flight Center/Conceptual Image Lab

In 2022, scientists using a group of telescopes in Namibia operated by the Max Planck Institute called the High Energy Spectroscopic System detected a distinct ring of gamma rays around Westerlund 1 with energies trillions of times higher than visible light.

Lemoine-Goumard, Härer, and Mohrmann wondered if the cluster’s unique properties might allow them to see other details by looking back through nearly two decades of Fermi data at slightly lower energies — millions to billions of times the energy of visible light.

Fermi’s sensitivity and resolution allowed the researchers to filter out other gamma-ray sources like rapidly spinning stellar remnants called pulsars, background radiation, and Westerlund 1 itself.

What was left was a bubble of gamma rays extending over 650 light-years from the cluster below the plane of the Milky Way. That means the outflow is about 200 times larger than Westerlund 1 itself.

Fermi and Webb data of Westerlund 1 and its early outflow
Data from NASA’s Fermi Gamma-ray Space Telescope reveal the budding gas bubble of star cluster Westerlund 1. Brighter colors indicate a stronger likelihood that gamma rays arise from specific types of point sources, notably two pulsars located at center and in the brightest portion of the image. Pink contours denote steep changes in likelihood. An underlying orange-magenta feature extends down the image, starting from the cluster’s location, and represents the nascent outflow. The grey lines indicate distance below the galactic plane. The bubble is over 650 light-years long and angles slightly away from us. Westerlund 1’s stellar activity more easily pushes gas outward into lower-density regions of the galaxy’s disk.
NASA’s Goddard Space Flight Center/Lemoine-Goumard et al. 2025; ESA/Webb, NASA & CSA, M. Zamani (ESA/Webb), M. G. Guarcello (INAF-OAPA) and the EWOCS team

The researchers call this a nascent, or early stage, outflow because it was likely recently produced by massive young stars within the cluster and hasn’t yet had time to break out of the galactic disk. Eventually it will stream into the galactic halo, the hot gas surrounding the Milky Way.

Westerlund 1 is located slightly below the galactic plane, so the researchers think the gas expanded asymmetrically, following the path of least resistance into a zone of lower density below the disk.

“One of the next steps is to model how the cosmic rays travel across this distance and how they create a changing gamma-ray energy spectrum,” Härer said. “We’d also like to look for similar features in other star clusters. We got very lucky with Westerlund 1, though, since it’s so massive, bright, and close. But now we know what to look for, and we might find something even more surprising.”

“Since it started operations 17 years ago, Fermi has continued to advance our understanding of the universe around us,” said Elizabeth Hays, Fermi’s project scientist at NASA’s Goddard Space Flight Center in Greenbelt, Maryland. “From activity in distant galaxies to lightning storms in our own atmosphere, the gamma-ray sky continues to astound us.”

By Jeanette Kazmierczak
NASA’s
Goddard Space Flight Center, Greenbelt, Md.

Media Contact:
Claire Andreoli
301-286-1940
NASA’s Goddard Space Flight Center, Greenbelt, Md.

Facebook logo
Instagram logo

NASA IXPE’s Longest Observation Solves Black Hole Jets Mystery

By: Lee Mohon
16 December 2025 at 16:23

4 min read

Preparations for Next Moonwalk Simulations Underway (and Underwater)

The Perseus Cluster. Left: Imaging X-ray Polarimetry Explorer (IXPE); Right: Chandra X-ray Observatory.
Two composite images show side-by-side observations of the Perseus Cluster from NASA’s IXPE (Imaging X-Ray Polarimetry Explorer) and Chandra X-ray Observatory. Scientists used data from both observatories, along with data from Nuclear Spectroscopic Telescope Array (NuSTAR), and Neil Gehrels Swift Observatory, to confirm measurements of the galaxy cluster.
X-ray: (Chandra) NASA/CXC/SAO, (IXPE) NASA/MSFC; Image Processing: NASA/CXC/SAO/N. Wolk and K. Arcand

Written by Michael Allen

An international team of astronomers using NASA’s IXPE (Imaging X-ray Polarimetry Explorer) has identified the origin of X-rays in a supermassive black hole’s jet, answering a question that has been unresolved since the earliest days of X-ray astronomy. Their findings are described in a paper published in The Astrophysical Journal Letters, by the American Astronomical Society, Nov. 11.

The IXPE mission observed the Perseus Cluster, the brightest galaxy cluster observable in X-rays, for more than 600 hours over a 60-day period between January and March. Not only is this IXPE’s longest observation of a single target to date, it also marks IXPE’s first time observing a galaxy cluster.

Specifically, the team of scientists studied the polarization properties of 3C 84, the massive active galaxy located at the very center of the Perseus Cluster. This active galaxy is a well-known X-ray source and a common target for X-ray astronomers because of its proximity and brightness.

Because the Perseus Cluster is so massive, it hosts an enormous reservoir of X-ray emitting gas as hot as the core of the Sun. The use of multiple X-ray telescopes, particularly the high-resolution imaging power of NASA’s Chandra X-ray Observatory was essential to disentangle the signals in the IXPE data. Scientists combined these X-ray measurements with data from the agency’s Nuclear Spectroscopic Telescope Array (NuSTAR) mission and Neil Gehrels Swift Observatory.

Fast facts

  • Polarization measurements from IXPE carry information about the orientation and alignment of emitted X-ray light waves. The more X-ray waves traveling in sync, the higher the degree of polarization.
  • X-rays from an active galaxy like 3C 84 are thought to originate from a process known as inverse Compton scattering, where light bounces off particles and gains energy. The polarization measurements from IXPE allow us to identify the presence of either inverse Compton scattering or other scenarios.
  • “Seed photons” is the term for the lower-energy radiation undergoing the energizing process of inverse Compton scattering.
  • You may remember the Perseus Cluster from this sonification replicating what a Black Hole sounds like from May 2022.

“While measuring the polarization of 3C 84 was one of the key science goals, we are still searching for additional polarization signals in this galaxy cluster that could be signatures of more exotic physics,” said Steven Ehlert, project scientist for IXPE and astronomer at NASA’s Marshall Space Flight Center in Huntsville.

Chandra & IXPE composite image of the Perseus Cluster.
X-ray: (Chandra) NASA/CXC/SAO, (IXPE) NASA/MSFC; Image Processing: NASA/CXC/SAO/N. Wolk and K. Arcand

“We’ve already determined that for sources like 3C 84, the X-rays originated from inverse Compton scattering,” said Ioannis Liodakis, a researcher at the Institute of Astrophysics – FORTH in Heraklion, Greece, and lead author on the paper. “With IXPE observations of 3C 84 we had a unique chance to determine the properties of the seed photons.”

The first possible origin scenario for the seed photons is known as synchrotron self-Compton, where lower-energy radiation originates from the same jet that produces the highly energetic particles.

In the alternative scenario known as external Compton, seed photons originate from background radiation sources unrelated to the jet.

“The synchrotron self-Compton and external Compton scenarios have very different predictions for their X-ray polarization,” said Frederic Marin, an astrophysicist at the Strasbourg Astronomical Observatory in France and co-author of the study. “Any detection of X-ray polarization from 3C 84 almost decisively rules out the possibility of external Compton as the emission mechanism.”

Throughout the 60-day observation campaign, optical and radio telescopes around the world turned their attention to 3C 84 to further test between the two scenarios.

NASA’s IXPE measured a net polarization of 4% in the X-rays spectrum, with comparable values measured in the optical and radio data. These results strongly favor the synchrotron self-Compton model for the seed photons, where they come from the same jet as the higher-energy particles.

“Separating these two components was essential to this measurement and could not be done by any single X-ray telescope, but by combining the IXPE polarization data with Chandra, NuSTAR, and Swift, we were able to confirm this polarization measurement was associated specifically with 3C 84,” said Sudip Chakraborty, a researcher at the Science and Technology Institute of the Universities Space Research Association in Huntsville, Alabama, and co-author on the paper.

Scientists will continue to analyze IXPE’s data from different locations in the Perseus Cluster for different signals.

More about IXPE

NASA’s IXPE, which continues to provide unprecedented data enabling groundbreaking discoveries about celestial objects across the universe, is a joint NASA and Italian Space Agency mission with partners and science collaborators in 12 countries. The IXPE mission is led by NASA’s Marshall Space Flight Center in Huntsville, Alabama. BAE Systems, Inc., headquartered in Falls Church, Virginia, manages spacecraft operations together with the University of Colorado’s Laboratory for Atmospheric and Space Physics in Boulder.

Learn more about IXPE’s ongoing mission here:

https://www.nasa.gov/ixpe

❌
❌