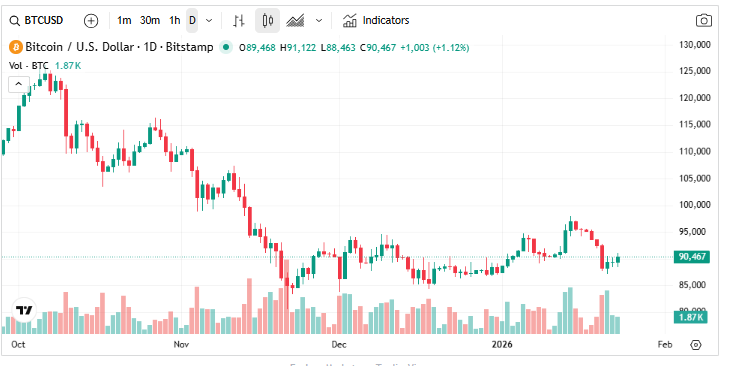
US-based spot Bitcoin exchange-traded funds pulled funds for a fifth straight trading day, and the totals added up quickly. According to Farside data, about $103.5 million left on Friday, bringing the five-day sum to roughly $1.72 billion.
Bitcoin was trading near $89,160 at the time of these reports — still well below the $100,000 mark it last reached on November 13. This movement has sent a clear signal: many investors are stepping back right now.
ETF Flows And Who Is Selling
Reports note that ETF flows are often on the radar as a quick read on investor mood, but the picture is not always simple. Large outflows can reflect institutional rebalancing or tactical moves by funds, not only mass retail selling.
The US market had a four-day trading week because of Martin Luther King Jr. Day on Monday, which may have concentrated trades into fewer sessions and amplified the numbers. Still, losing more than a billion dollars in a few days will get attention.
Market Mood And Metals
The wider mood has soured. The Crypto Fear & Greed Index registered an Extreme Fear score of 25, and sentiment trackers have been flashing caution. Reports say Santiment believes retail traders are pulling back while attention drifts toward more traditional assets.
Meanwhile, metals have been strong. Reports disclose that with gold trading near $5,000 and silver approaching $100, some market players feel Bitcoin has been left out of a rally that lifted metals, which has weighed on confidence in the crypto market.
Bitcoin Price Action
Bitcoin has struggled to find a steady rhythm over the past week. Prices slipped below the $89,000 to $90,000 range as traders reacted to fresh geopolitical tension and renewed trade worries, before stabilizing as nerves eased.
This was driven higher after some soft political indicators around tariff threats, only to substantiate the idea that markets rarely react to conflict but rather to changes in tone and expectations.
Signals That Could Matter
These movements illustrate how Bitcoin behaves more like a risk asset rather than an asset shelter, falling in tandem with equities when unexpected financial shocks hit the globe, before rebounding when the fever subsides to gather fresh buyers.
Current price patterns indicate caution, where traders are weighing short-term political risks against medium- and long-term macro patterns, as well as institutional interests.
There are some quieter indications that the rout could be losing steam. To this effect, there are assertions suggesting that supply distribution on-chain and social chatter can be circumstantial evidence showing there is less selling pressure.
Featured image from Money; Shutterstock, chart from TradingView
GameStop has transferred its entire Bitcoin stash to Coinbase Prime, triggering fresh speculation that the video game retailer may be preparing to unwind its short-lived Bitcoin treasury strategy.
Key Takeaways:
GameStop moved its entire 4,710 BTC stash to Coinbase Prime, sparking speculation of a potential exit from its Bitcoin treasury.
If sold near current prices, the company would realize an estimated $75M–$85M loss on its Bitcoin holdings.
The transfer comes as corporate crypto treasury strategies face pressure amid falling digital asset prices.
“GameStop throws in the towel?” CryptoQuant asked in a post on X, suggesting the transfer was “likely to sell.”
GameStop Faces Potential $75M–$85M Loss on Bitcoin Bet if Sold
If liquidated near recent market prices, the sale would lock in a sizable loss.
CryptoQuant estimates GameStop accumulated its Bitcoin in May at an average price of around $107,900 per coin, implying unrealized losses of roughly $75 million to $85 million, depending on execution price.
GameStop announced its Bitcoin purchase earlier this year after CEO Ryan Cohen met with Strategy chairman Michael Saylor in February to discuss corporate crypto treasury models.
At the time, the move aligned the meme-stock retailer with a growing group of public companies experimenting with digital assets as balance-sheet holdings.
GameStop throws in the towel?
Their on-chain wallets just moved all BTC holdings to Coinbase Prime, likely to sell.
Between May 14–23, 2025, they bought 4,710 BTC at an avg. price of $107.9K, investing ~$504M.
Since the transfer, GameStop has not publicly confirmed whether it has sold or intends to sell the Bitcoin.
While moving funds to Coinbase Prime often precedes a sale, given the platform’s deep liquidity and execution tools, such transfers do not always signal imminent liquidation.
Coinbase Prime also provides custody and wallet management services through its regulated trust business, leaving open the possibility of an internal restructuring.
The timing has fueled debate. Corporate Bitcoin treasuries surged in popularity throughout 2024 and early 2025, but the model has faced growing scrutiny as crypto prices pulled back sharply in recent months.
Several firms that adopted similar strategies are now sitting on steep paper losses, prompting some to trim holdings to shore up balance sheets.
Ethereum-focused ETHZilla, for example, recently disclosed selling part of its Ether reserves to reduce debt.
Cohen Stock Purchase Lifts GameStop Shares as Bitcoin Questions Swirl
The transfer also coincides with renewed activity from Cohen himself.
A regulatory filing this week revealed the CEO purchased an additional 500,000 GameStop shares worth more than $10 million, helping push GME shares up over 3% on Thursday.
The stock move added another layer of intrigue, with some investors viewing the buy as a vote of confidence amid uncertainty around the company’s crypto exposure.
Despite the recent pressure, corporate crypto treasuries remain embedded in traditional markets.
Support is growing for a Bitcoin proposal that would temporarily limit the amount of data embedded in transactions, as a debate over network spam and node decentralization intensifies.
Key Takeaways:
BIP-110 has gained early traction, with 583 Bitcoin nodes signaling support for a temporary cap on transaction data.
The proposal seeks to reverse recent Bitcoin Core changes that removed OP_RETURN limits.
Supporters argue stricter data limits are needed to curb spam and preserve node decentralization.
Bitcoin Improvement Proposal 110 (BIP-110) is currently signaling support from 583 nodes, or about 2.38% of the network, according to data from The Bitcoin Portal.
Out of roughly 24,481 reachable nodes, those backing the proposal are primarily running Bitcoin Knots, an alternative node implementation often favored by operators critical of recent changes to Bitcoin Core.
BIP-110 Proposes One-Year Cap on Bitcoin Transaction Data
BIP-110 proposes a temporary soft fork that would reintroduce strict limits on transaction data at the consensus level.
Specifically, it caps transaction output sizes at 34 bytes and restricts OP_RETURN data, a script used to embed arbitrary information into transactions, to 83 bytes.
The soft fork is designed to last for one year, after which the limits could be extended, modified or allowed to expire.
The proposal emerged in response to changes introduced in Bitcoin Core version 30, released in October 2025.
That update removed the long-standing 83-byte limit on OP_RETURN data following a pull request first introduced earlier in the year.
The move was controversial and met with widespread criticism from parts of the Bitcoin community, which argued the change was made without sufficient consensus.
OP_RETURN has long been a flashpoint in Bitcoin governance debates. While it enables use cases such as timestamping and metadata anchoring, critics say uncapped data fields encourage blockchain spam and non-financial use of block space.
Larger data payloads increase storage and bandwidth requirements for nodes, raising concerns that running a full node could become cost-prohibitive for everyday users.
Critics of the Core update argue that higher hardware demands risk undermining one of Bitcoin’s defining features, which is the ability for individuals to verify the network using consumer-grade hardware.
As node operation becomes more expensive, they warn, the network could drift toward greater centralization.
Bitcoin educator Matthew Kratter compared unchecked data usage to a parasitic threat. He has argued that excessive spam could overwhelm the network’s underlying structure, weakening Bitcoin’s resilience over time.
BIP-110 Backers Frame Proposal as Temporary Fix
Supporters of BIP-110 see the proposal as a corrective measure rather than a permanent policy shift.
By making the soft fork explicitly temporary, its authors aim to give the network time to assess the impact of restored limits without locking Bitcoin into a long-term rule change.
Others remain unconvinced. Bitcoin Core contributor Jameson Lopp has defended the removal of OP_RETURN limits, arguing that artificial caps do little to deter spam and may instead push unwanted activity into other parts of the protocol.
From this view, market fees should determine how block space is used.
US spot Bitcoin exchange-traded funds recorded their weakest performance in nearly a year, shedding $1.33 billion in net outflows during a shortened four-day trading week, according to data from SoSoValue.
Key Takeaways:
US spot Bitcoin ETFs logged their weakest week in nearly a year, with $1.33 billion in outflows.
Selling peaked midweek, led by heavy redemptions from BlackRock’s IBIT.
Ether ETFs also turned negative, shedding $611 million over the same period.
The pullback marks the worst weekly showing since February 2025 and reflects a sharp reversal in investor sentiment after strong inflows the previous week.
The outflows follow a period of optimism, when spot Bitcoin ETFs pulled in $1.42 billion in net inflows.
Midweek Bitcoin ETF Outflows Surge as $709M Exits in Single Day
Selling pressure peaked midweek. Wednesday alone saw $709 million exit Bitcoin ETFs, making it the heaviest outflow day of the week.
Tuesday followed closely behind with $483 million in redemptions. Outflows eased toward the end of the week, with $32 million leaving on Thursday and $104 million on Friday.
The magnitude of the withdrawals echoes the turbulence seen in late February 2025, when Bitcoin ETFs lost $2.61 billion in a single week during a sharp market downturn.
That episode, often referred to by analysts as the “February Freeze,” coincided with Bitcoin’s drop from above $109,000 to below $80,000 and included a record $1.14 billion single-day outflow on Feb. 25.
BlackRock’s iShares Bitcoin Trust (IBIT), the largest spot Bitcoin ETF by assets under management, posted outflows on all four trading days last week.
Data from SoSoValue shows the fund experienced its heaviest redemptions on Tuesday and Wednesday, accounting for a significant share of the overall decline.
1/ US Spot Crypto ETF Weekly Flows (Jan 12-16, ET)
• BTC ETFs: +$1.42B • ETH ETFs: +$479M • SOL ETFs: +$46.88M • XRP ETFs: +$56.83M
IBIT currently holds about $69.75 billion in net assets, representing roughly 3.9% of Bitcoin’s total circulating supply.
Despite the recent pullback, the broader picture for spot Bitcoin ETFs remains positive.
Since their launch in January 2024, cumulative net inflows stand at $56.5 billion, with total net assets across all US spot Bitcoin ETFs reaching approximately $115.9 billion.
Ethereum ETFs were not spared from the broader risk-off move. Spot Ether ETFs posted $611 million in net outflows for the week, reversing the prior week’s $479 million inflow streak.
Wednesday was again the worst day, with $298 million redeemed, followed by $230 million on Tuesday.
Total net assets for Ether ETFs now sit around $17.7 billion, with cumulative inflows of $12.3 billion since their July 2024 debut.
Solana ETFs Defy Broader Sell-Off as Bitcoin, XRP Funds See Outflows
Not all crypto-linked funds followed the same pattern. Spot Solana ETFs continued to attract capital, recording $9.6 million in net inflows over the week, extending a multi-week positive trend.
Bitwise’s BSOL remained the category leader by assets. Spot XRP ETFs, meanwhile, saw mixed flows, ending the week with $40.6 million in net outflows after a sharp $53 million exit on Tuesday.
The ETF drawdowns come amid signs of shifting market dynamics on-chain. According to a CryptoQuant report, Bitcoin holders have begun realizing net losses for the first time since October 2023.
The firm noted the market has moved from a profit-taking phase into a loss-realization phase, with roughly 69,000 BTC in realized losses since Dec. 23, a pattern reminiscent of past transitions from bull to bear markets.
The Bitcoin price is showing signs of history repeating itself, as current price action mirrors key patterns from the 2021 cluster. With resistance near $91,000–$92,000 and the macro downtrend looming, traders are watching closely to see if BTC will break higher or face renewed pressure. The coming days could prove decisive in shaping the next major move.
Bitcoin Mirrors 2021 Cluster: History In Motion
Bitcoin continues to mirror the price patterns seen during the 2021 cluster. Crypto analyst Rekt Capital noted that the current market structure is echoing historical behavior, suggesting that similar dynamics are at play. Traders are closely watching these familiar patterns to gauge whether the cycle is repeating itself or if new trends may emerge.
The rules of the game remain consistent. A bearish acceleration would likely be triggered if Bitcoin breaks down from the macro descending triangle base, currently positioned around $82,000. Conversely, a bullish bias would require a decisive break above the macro downtrend, which sits near $100,000. These levels serve as critical decision points for the market, dictating whether bulls or bears gain control in the coming sessions.
So far, Bitcoin has encountered rejection in the high $90,000s, falling just short of the macro downtrend. This mirrors previous market behavior, in which the asset developed a basing structure near the triangle’s base before attempting to push higher toward the downtrend’s upper boundary. It demonstrates that history is repeating itself for now, with the market consolidating and preparing for its next directional move.
If the macro downtrend continues to act as resistance, the triangle’s base may gradually weaken over time. Such a development would increase the risk of further downside, making the reaction at both the base and the downtrend crucial.
BTC Surpasses $91,000 Before Facing Selling Pressure
In a recent market update by Ted, it was noted that while Bitcoin broke above the $91,000 threshold yesterday, the rally met significant resistance. Sellers entered the market with substantial force at these local highs, effectively capping the momentum and preventing a sustained breakout.
As a result of this rejection, Bitcoin has retreated into the “no-trading zone.” Ted suggests that this period of sideways price action is likely to persist through the next couple of days, largely driven by the typical low-liquidity environment seen during the weekend.
Looking ahead, the outlook remains cautious. Ted emphasizes that any upward movements will likely be short-lived until BTC can decisively clear the $91,000 to $92,000 resistance zone. Meanwhile, such a move must be backed by strong spot demand to prove its validity.
Swiss banking giant UBS, with assets under management (AuM) of up to $7 trillion, is set to launch Bitcoin trading for some of its clients. This comes amid predictions that regulatory clarity and broader adoption could send the BTC price to as high as $200,000.
UBS To Offer Bitcoin Trading To Some Wealth Clients
Bloomberg reported that UBS is planning to launch crypto trading for some of its wealth clients, starting with its private bank clients in Switzerland. The bank will reportedly begin by offering these clients the opportunity to invest in Bitcoin and Ethereum. At the same time, the crypto offering could further expand to clients in the Pacific-Asia region and the U.S.
The banking giant is currently in discussions with potential partners, and there is no clear timeline for when it could launch Bitcoin and Ethereum trading for clients. This move is said to be partly due to increased demand from wealth clients for crypto exposure. UBS also faces increased competition as other Wall Street giants are working to offer crypto trading.
Morgan Stanley, in partnership with Zerohash, announced plans to launch crypto trading in the first half of this year, starting with Bitcoin, Ethereum, and Solana. The banking giant may soon also be able to offer its crypto products, as it has filed with the SEC to launch spot BTC, ETH, and SOL ETFs.
Furthermore, JPMorgan, another of UBS’ competitors, is considering offering crypto trading to institutional clients, although this plan is still in the early stages. The bank already accepts Bitcoin and Ethereum as collateral from its clients. Last year, it also filed to offer BTC structured notes that will track the performance of the BlackRock Bitcoin ETF.
Can Bank’s Entry Trigger A BTC Rally To $200,000
Kevin O’Leary predicted that Bitcoin could rally to between $150,000 and $200,000 this year, driven by the passage of the CLARITY Act. His prediction came just as White House Crypto Czar David Sacks said banks would fully enter crypto once the bill passes. As such, there is a possibility that BTC could reach this $200,000 psychological level in anticipation of the amount of new capital that could flow into BTC from these banks once the bill passes.
BitMine’s Chairman, Tom Lee, also predicted during a CNBC interview that Bitcoin could reach between $200,000 and $250,000 this year, partly due to growing institutional adoption by Wall Street giants. Meanwhile, Binance founder Changpeng “CZ” Zhao said that a BTC rally to $200,000 is the “most obvious thing in the world” to him.
At the time of writing, the Bitcoin price is trading at around $89,600, up in the last 24 hours, according to data from CoinMarketCap.
Bitcoin (BTC) is mirroring the same setup from its 2022 bull cycle, which led to a massive price crash to $20,000. According to market expert Crypto Bullet, this recurring structure could signal another major correction for BTC ahead. However, this time the leading cryptocurrency could give up almost a quarter of its current value.
2022 Bitcoin Chart Pattern Signals Over 20% Crash
In his technical analysis released on X, Crypto Bullet revealed that Bitcoin is currently repeating a 2022 structure that could lead to a more than 20% decline in its value. To support his bearish outlook, the analyst presented a parallel chart comparing Bitcoin’s price action from 2023-2022 and 2025-2026, highlighting similar technical patterns, price behavior, and Moving Averages (MA).
During the 2022 cycle, Bitcoin experienced a similar pattern, beginning with a test of the 100-day Moving Average (MA100), highlighted as the blue trendline on the chart. After facing rejection at that level, the price pulled back to a nearby support zone inside a rising channel. From there, BTC staged a sharp rally, surging to fresh highs around $48,500, where it aligned with the 200-day Moving Average (MA200), marked in orange.
However, the recovery proved short-lived. Bitcoin soon reversed course and failed to reclaim the MA200 as support. Once the cryptocurrency’s price structure was lost, downside momentum accelerated, pushing the price into a much deeper correction toward the $20,000 level.
According to Crypto Bullet, Bitcoin is repeating this exact pattern in 2026. It has already retested the MA100, gotten rejected, and moved lower into a support zone within a similar ascending channel. The chart also showed that in both cycles, BTC reached a “market cycle top,” first around December 2023 and then again in November 2025, before breaking down and entering a consolidation phase.
Given how closely Bitcoin is mirroring its 2022 setup, Crypto Bullet has forecast another dramatic price crash, predicting a more than 23.5% drop from its current price near $89,500 to $68,450. Before this decline happens, the analyst expects BTC to experience a short-term recovery, potentially climbing back above the $100,000 psychological level to reach $102,000.
Bitcoin Could Still Rally To $92,000
Crypto analyst Tyrex has stated that Bitcoin has been consolidating for the past 48 hours, with price holding above $89,000 for most of that period. Despite the muted price action, he believes that BTC could soon rally to $92,000. The analyst also noted that the broader market is in a state of fear, with many traders anticipating further declines in Bitcoin.
However, the analyst cautions that this expected drop may be a trap. He points out that an ascending channel is forming on Bitcoin’s chart, prompting him to adopt a more bullish outlook despite the prevailing bearish sentiment and sideways price movement.
Featured image from Unsplash, chart from TradingView
Over the past week, the price of Bitcoin faced a significant setback in its goal of reclaiming the six-figure threshold. The flagship cryptocurrency has been hovering around the $90,000 mark, as the market can’t seem to make a decision concerning the next price direction.
As Bitcoin faced a mild sell-off, which, in turn, drove its price to fall from its recent highs, specific market participants were under severe pressure, including the miners. Interestingly, a recent on-chain evaluation has raised the possibility that miners’ stress might be ending soon.
Miner Financial Health Flashes Classic Reversal Sign
In a January 23 post on the social media platform X, market expert Axel Adler Jr highlighted that the Bitcoin miners might have started their post-capitulation recovery journey. The relevant indicator here is the Miner Financial Health Index (7D-SMA).
For context, this metric tracks the balance between miner revenue and miner selling pressure. Hence, it reflects whether miners are net BTC distributors or accumulators. Simply put, the metric shows if Bitcoin miners are under pressure, stable, or even profitable.
Capitulation events often reflect on the Miner Health Index as a negative value, as the amount of BTC spent surpasses the amount of BTC earned. On the other hand, miners are typically said to be in the recovery phase when the balance between revenue and spending starts to lean away from the negative.
From the chart shared by the analyst, it is apparent that the index has taken on an uptrend, targeting neutral levels on the metric’s charts. History shows that the index does not merely target the neutral mark when it trends upward.
Hence, if history were to repeat itself, the Bitcoin miners could be in for a rewarding ride, having survived the most recent capitulation event. Interestingly, the price of Bitcoin appears to have a directly proportional relationship with the Miner Health Index.
Bitcoin Price Gathers Momentum As Market Condition Shifts
In a separate post on X, Bitcoin Vector highlighted that Bitcoin might be garnering strength for a significant move in the near term. According to the analytics platform, this development coincides with the market exiting what was previously a “high-risk environment.”
Bitcoin Vector explained that this exit from a risky market environment was last seen in April 2025, just before the bull run resumed. The on-chain analytics firm explained that we could be witnessing the late stages of a classic momentum bottoming pattern, which historically leads to large rallies.
Essentially, there has to be one last push lower in price and, at the same time, a momentum boost to the upside, for the bullish signal to be completely formed. As of this writing, Bitcoin is valued at around $89,830 with no significant movement in the past 24 hours.
The Bitcoin price had a relatively rough trading period over the past week, as it hovered around the psychological $90,000 mark. The flagship cryptocurrency, which looked set for a return to six-figure valuation barely over a week ago, now seems to have lost all its bullish momentum.
Broadly speaking, these recent struggles put to rest questions around the “relief rallies” to the upside, and correlate more with the current bear market structure. However, the latest on-chain evaluation shows that the Bitcoin price woes could worsen from here on out.
Expert Explains Why $60,000 Is Possible For BTC Price
In a recent post on the X platform, Alphractal CEO and founder Joao Wedson said that the Bitcoin price could still have room to fall below the $60,000 level. This not-so-optimistic prediction is based on the number of days Bitcoin has traded at prices higher than today.
According to Wedson, there have been 355 days when the Bitcoin price has traded at levels higher than today. This figure was derived from the “Days Spent at a Profit” metric, which tracks the number of days in Bitcoin’s history where the market price was higher than the current price.
This indicator measures how much price action — in the past — has occurred above the current price level. From a historical standpoint, an increase in the number of “Days Spent at a Profit” tends to occur during bear cycles or extended periods of sideways movement, implying that different investor groups are holding BTC at a price higher than their cost bases.
As Wedson highlighted, the “Days Spent at a Profit” metric reached around 775 days as the Bitcoin price approached a bottom. Going by this historical context, the current level of this indicator (355 days) suggests that the flagship cryptocurrency is still a distance away from extreme levels often associated with bearish market bottoms.
Ultimately, this deduction means that the price of Bitcoin could still be at risk of an extended decline over the next 300 days. According to the Alphractal, this extended period of price decline could see BTC revisit $60,000, potentially triggering significant liquidations among retail investors and institutional players who entered the market post-ETF.
Bitcoin Price At A Glance
As of this writing, the price of BTC stands at around $89,900, reflecting no significant change in the past 24 hours. However, the market leader is currently down by over 5% on the weekly timeframe, while nearly 30% adrift its all-time high of $126,080.
Las Vegas Valley businesses, from restaurant chains to small juice bars, are embracing Bitcoin payments as mainstream adoption accelerates, with companies avoiding credit card processing fees averaging 2.5% to 3.5% while tapping into a growing customer base actively seeking crypto-friendly merchants.
The shift follows Square’s November 2025 decision to enable roughly 4 million U.S. merchants to accept Bitcoin payments with zero processing fees through 2026.
According to Fox5Vegas, at Cane Juice Bar and Cafe on Rainbow near Windmill, district manager Tyler Peterson serves fresh-pressed sugar cane juice that customers can pay for with cash, card, or Bitcoin after eight months of crypto implementation.
“Bitcoin is getting very popular with mainstream people, not just the people that are actually into things like cryptocurrencies,” Peterson said, noting the payment option helps the business “move forward” while attracting new customers who specifically seek Bitcoin-accepting locations.
According to FOX5, more businesses across Las Vegas are now accepting Bitcoin payments, from chains like Steak ’n Shake to small shops and medical practices. Merchants said Bitcoin helps attract new customers and cut costs, while Square has enabled about 4 million U.S. merchants…
Peterson confirmed customers who normally wouldn’t know about his shop come in specifically to use Bitcoin, with calls and inquiries arriving regularly.
“So actually some customers we have generated off of accepting Bitcoin,” Peterson said. “That Bitcoin map is helping us out a lot.”
Consumers can locate Bitcoin-accepting businesses through dedicated Bitcoin maps or Cash App’s directory feature, creating organic discovery channels for merchants willing to accept crypto payments.
Jeremy Querci, a Bitcoin consultant with Sovreign, explained that businesses accepting Bitcoin now range from medical practices to juice bars to children’s play places, with payment processing requiring just a few taps on a phone.
“At the time of checkout, you say you want to pay in Bitcoin and the business can bring up a QR code that you scan with your phone with any Bitcoin app,” Querci said, while Peterson asserted the technology will become progressively easier as “it’s the future.”
National Chains Lead Corporate Bitcoin Adoption
The momentum extends beyond small businesses into major restaurant chains, with Steak ‘n Shake announcing this week plans to pay all hourly employees at company-operated restaurants a Bitcoin bonus of $0.21 for every hour worked starting March 1, with funds accessible after a two-year vesting period.
Steak 'n Shake announces Bitcoin hourly bonus for workers starting March 1, expanding its treasury strategy that contributed to 15% same-store sales growth.#Bitcoin#Salaryhttps://t.co/HjlPK3TLtN
CEO Will Reeves positioned the move as part of the 91-year-old burger chain’s transformation into “a real bitcoin company, putting sound money into the hands of working Americans.“
Lightning Network payments enabled across all U.S. Steak ‘n Shake locations in mid-May 2025 brought transaction fee savings of nearly 50% compared with credit cards, alongside roughly 15% increases in same-store sales in the months following launch.
The rollout received public backing from Jack Dorsey, who enthusiastically endorsed the chain’s Bitcoin adoption plans when the company first polled followers about accepting crypto.
Cash App rolled out Bitcoin Lightning payments and stablecoin transfers in November 2025, allowing eligible users to pay over the Lightning Network in seconds with no fee using either BTC or USD balances after scanning a Lightning QR code.
The app introduced Bitcoin Map, an in-app directory that helps customers find nearby Square merchants and other businesses accepting Bitcoin, enabling users to locate stores, get directions, and pay directly over Lightning at checkout.
Just yesterday, crypto payments firm Mercuryo partnered with Visa to enable near-real-time conversion of digital assets into fiat currency, allowing users to send proceeds directly to Visa debit and credit cards via Visa Direct.
“This partnership with Visa will further enhance Mercuryo’s ability to deliver a fast, low-cost user experience,” said Mercuryo co-founder and CEO Petr Kozyakov, noting the integration reduces friction historically associated with moving funds across borders or cashing out digital assets.
The corporate adoption mirrors explosive growth across the broader crypto payments landscape, with crypto card volumes surging from roughly $100 million monthly in early 2023 to over $1.5 billion by late 2025, representing a 106% compound annual growth rate, according to Artemis Analytics.
Source: Artemis
Annualized volumes now exceed $18 billion, while traditional peer-to-peer stablecoin transfers grew just 5% to $19 billion over the same period.
At the time of publication, Bitcoin is trading around $89,500, down roughly 5% over the previous week, as Bitcoin spot ETFs experienced steep outflows totaling $1.62 billion across four trading days amid compressed yields on basis trades that dropped below 5% from around 17% a year ago.
On-chain data shows the Bitcoin mining Difficulty has seen a downward adjustment following the decline in the network Hashrate.
Bitcoin Blockchain Has Eased Mining Difficulty
According to data from CoinWarz, the Bitcoin mining Difficulty has gone through a decline in the latest network adjustment. The “Difficulty” here refers to a metric built into the blockchain that controls how hard miners would find it to discover a block.
The indicator’s value automatically changes roughly every two weeks in events called adjustments, based on how miners performed since the last such event. The blockchain follows one simple rule to adjust the Difficulty: miner blockchain production rate should converge to 10 minutes per block.
If miners find the average block in an interval greater than 10 minutes, then the network responds by raising its Difficulty just enough that these validators are slowed back down to the standard rate. On the other hand, this cohort performing slower than needed forces the blockchain to ease things up.
The latest Bitcoin Difficulty adjustment occurred on Thursday, and as the below chart shows, it resulted in a decrease for the metric.
Prior to the change, the indicator had a value of 146.47 trillion hashes. Now, it has dropped to 141.67 trillion hashes, indicating a decrease of 3.28%. This is the second-consecutive reduction in the network Difficulty.
In fact, the indicator has been in a long-term decline since November, with five of the six Difficulty changes that have occurred in the period leading to a drop in its value. Even the one adjustment that didn’t lead to a decrease in the metric had an almost neutral effect, so while the decline didn’t strengthen during it, it didn’t correspond to a change of direction either.
The reason for this long drawdown in the Bitcoin Difficulty lies in the trend witnessed by the Hashrate, a measure of the total amount of computing power connected by the miners to the network.
As data from Blockchain.com shows, the 7-day average value of the Hashrate has been going down during the last few months.
On January 18th, the 7-day average Bitcoin Hashrate fell to 978.8 exahashes per second (EH/s), its lowest level since the first half of September. The indicator has observed a rebound since this low, but its value still remains notably lower than earlier in the month.
Miners’ pace tends to directly correlate with the amount of computing power that they possess, so a decline in the Hashrate usually results in a correction for the Difficulty. The continued downtrend in the former since October is why the latter has also plunged.
BTC Price
At the time of writing, Bitcoin is trading around $90,000, down more than 5% over the last week.
Bitcoin is trading below the $90,000 level once again, as the market continues to drift through a phase defined by indecision, rising caution, and growing fear. After repeated failures to reclaim this psychological threshold, price action has started to reflect a lack of conviction on both sides, with buyers hesitating to step in aggressively and sellers pressing every rebound attempt. While the broader trend has not fully collapsed, the inability to hold key levels is increasing uncertainty around Bitcoin’s next major move.
Top analyst Darkfost argues that on-chain signals are starting to mirror conditions typically seen near the end of prolonged drawdowns. According to his analysis, Bitcoin’s unrealized profits and losses are sliding back toward levels that have historically appeared only at the exit of bear markets, when the market has already absorbed a deep reset in sentiment. This shift suggests that stress is building under the surface, even if price has not yet entered a full capitulation phase.
Since Bitcoin’s last all-time high, Darkfost notes that many late-arriving investors have moved into uncomfortable territory, facing mounting downside pressure as the market cools. As a result, unrealized profits are shrinking, unrealized losses are expanding, and the overall balance continues to deteriorate—an environment that often forces traders into a decisive choice between holding through volatility or exiting under stress.
Decision Point For Bitcoin Investors
Darkfost highlighted a chart based on an adjusted version of NUPL (Net Unrealized Profit/Loss), designed to capture investor stress more accurately during shifting market regimes. Instead of relying solely on the standard market cap, the model incorporates the realized capitalization of both Short-Term Holders (STHs) and Long-Term Holders (LTHs), then compares that blended realized foundation against Bitcoin’s traditional market cap.
The result is a clearer view of how much profit or loss sits “on paper” across the market, filtered through a more structural lens. To reduce noise and better define trend shifts, the metric is smoothed using an average, producing what Darkfost refers to as aNUPL.
The key takeaway is that Bitcoin is approaching levels that have historically forced investors into a binary decision. When unrealized profits compress and unrealized losses expand to these ranges, holders typically face two outcomes: hold and continue accumulating, or capitulate and lock in losses. That difference in behavior becomes critical because it shapes liquidity, sentiment, and the next directional trend.
If long-term participants absorb the pressure and keep holding, the market can stabilize and rotate back into recovery. But if selling accelerates from stressed cohorts, the decline can deepen into a broader bear phase. This is why tracking realized and unrealized profit dynamics remains essential, especially during periods of uncertainty.
Bitcoin Consolidates After Sharp Weekly Breakdown
Bitcoin is trading around $89,000 on the weekly chart after a steep selloff that pushed the price out of its prior distribution zone. The latest candle reflects heavy downside pressure, with BTC dropping roughly 4.8% on the week and struggling to stabilize near a key pivot that has repeatedly acted as support and resistance throughout the cycle.
After failing to hold above the psychological $90,000 threshold, the market is now trapped in a tight consolidation range, suggesting traders are waiting for confirmation before committing to a larger move.
From a trend standpoint, Bitcoin remains vulnerable as it trades below the blue moving average, which is now acting as overhead resistance near the low-$100K region. The rejection from that dynamic level aligns with the broader structure: BTC topped near the mid-$120K range, then entered a sharp corrective leg that reset momentum into early 2026. While the green moving average continues to slope upward and is approaching the current price zone, the market has not yet shown the strength needed to reclaim its former trend trajectory.
Importantly, the weekly structure is now compressing. If buyers can defend the $88K–$90K region and push BTC back above $92K–$95K, it would signal a recovery attempt toward the moving average band. However, a sustained failure here increases the risk of a deeper retracement toward the low-$80K zone, where prior demand previously emerged.
Featured image from ChatGPT, chart from TradingView.com
On-chain data from CryptoQuant shows GameStop has deposited its entire Bitcoin stack into Coinbase Prime, a potential sign of selling.
GameStop Has Transferred 4,710 BTC To Coinbase Prime
In a new post on X, on-chain analytics firm CryptoQuant has revealed how GameStop just moved all its Bitcoin holdings to Coinbase Prime, the institutional prime brokerage wing of cryptocurrency exchange Coinbase. GameStop is an American videogame retailer that’s considered the largest chain of its kind in the world. In recent years, the company has seen a decline as physical gaming stores have increasingly lost relevance in the digital era.
In 2025, the struggling retailer diversified by adopting a Bitcoin treasury reserve, following in the footsteps of other firms like Strategy. As the chart below, shared by CryptoQuant, shows, the company bought 4,710 BTC between May 14th and 23rd. These purchases involved an average buying price of $107,900 per token, costing GameStop a total of $504 million.
It’s also visible in the graph that the company has cleared out all of its wallets recently, with its total holdings dropping to zero. GameStop has made these moves as the asset has gone through a bearish turn since October.
As this other chart showcases, the firm’s reserve was trading a notable amount below its investment value before the outflows occurred.
According to CryptoQuant, the transfer of GameStop’s holdings to Coinbase Prime could be a sign that the retailer is preparing to sell, a move that would lock in losses of around $76 million at current prices.
The potential sale of GameStop’s Bitcoin reserve has come alongside a significant number of store closures. According to a blog that compiles data using the retailer’s online store locator, 470 stores have so far either been confirmed to be closing or closed this January.
Back in 2021, GameStop was the highlight of a “meme stock” frenzy, in which its share price saw a 1,500% spike alongside a short squeeze over the course of two weeks.
Later in that year, the company decided to take a gamble on a non-fungible token (NFT) marketplace, attempting to ride the NFT craze of the period. Its platform hit the market in 2022, but it wasn’t long before GameStop started winding it down, and ultimately shuttered its doors in early 2024.
If the latest Bitcoin transactions represent sales, then it would mean that GameStop’s BTC treasury initiative has met a similar end as its NFT venture.
BTC Price
Bitcoin has returned to the $89,100 mark following this week’s pullback.
Bitcoin continues to struggle as it attempts to reclaim the $90,000 level, with traders facing a market defined by hesitation rather than conviction. After yesterday’s bearish breakdown below $90K, price action has slipped back into indecisive territory, raising fresh questions about whether this pullback is a temporary shakeout or the start of a deeper corrective phase.
According to top analyst Axel Adler, a macro indicator called Trend Pulse helps explain why momentum has faded. Adler notes that since January 19, the market has remained in Bear Mode, with the Bull phase absent for 83 consecutive days. Two separate charts reinforce this shift, showing that both short-term momentum and quarterly performance have turned negative at the same time.
Trend Pulse recently shifted from Neutral to Bear, driven by a double-negative setup: the 14-day return has flipped red, and the SMA30 versus SMA200 trend signal is also negative. Meanwhile, Bitcoin’s quarterly return sits at -19%, confirming macro weakness, but without the kind of extreme that often signals a definitive bottom.
Bitcoin Remains Stuck In Bear Mode As Macro Signals Stay Negative
Adler notes that Bitcoin’s last Bull Mode signal was printed on November 2, 2025, when BTC traded near $110,000—roughly 83 days ago. Since then, the market has failed to regain structural strength. Even the Neutral stretch between December 30 and January 18 proved too short and too weak to restore the long-term trend, leaving Bitcoin vulnerable once selling pressure returned.
Adler explains that the first trigger for improvement is the 14-day return moving back above 0, which would shift the regime from Bear to Neutral. However, a full transition back into Bull Mode requires a second condition: SMA30 breaking above SMA200. Given the current divergence between the two averages, that crossover would likely demand 3–4 weeks of sustained upside rather than a short-lived bounce.
The Bitcoin Price Performance chart adds macro context by tracking quarterly return (90D) as a sentiment proxy. Historically, readings above +75% align with euphoria, while values below 0% signal pessimism, and drops below -30% reflect capitulation.
Bitcoin’s quarterly return sits near -19%, negative but far from deep bear-market extremes. Yet the 7-day change (-6.8%) suggests downside momentum is accelerating after the $90K breakdown.
Together, Trend Pulse and quarterly returns point to moderate pessimism without final capitulation, leaving the market at a decision point.
BTC Moving Averages Cap Recovery
Bitcoin is trading near $89,000 after failing to hold above the $90,000 psychological level, reinforcing the market’s current indecision. The chart shows BTC printing a lower-high structure since the early November peak, followed by a sharp selloff that reset price into a wide consolidation range. After bottoming in late November, Bitcoin rebounded but struggled to build sustained momentum, repeatedly stalling on push attempts toward the mid-$90K zone.
From a trend perspective, BTC remains pressured beneath its key moving averages. Price is trading below the green long-term average and the blue mid-term average, both of which are now sloping downward, signaling that broader momentum continues to lean bearish.
The most recent rejection occurred as BTC briefly pushed into the $95K–$97K area, only to roll over and break back down toward the range lows. Meanwhile, the red long-term average remains well above price near the low-$100Ks, highlighting how far BTC would need to recover to reestablish a stronger macro uptrend.
Volume has picked up on selloffs relative to bounces, suggesting that downside moves are still being met with more urgency. For bulls, reclaiming $90K and then holding above $92K–$94K is key. Otherwise, the chart keeps risk open for a deeper pullback toward the mid-$80K region.
Featured image from ChatGPT, chart from TradingView.com
Bitcoin’s push to $97,600 last week drew a burst of bullish options activity, but Glassnode argues the derivatives tape looked more like short-dated positioning than broad-based conviction. In a Jan. 23 thread, the on-chain analytics firm pointed to a split between front-end call demand and longer-dated risk pricing that stayed anchored in downside protection.
“Let’s deep dive into options market behavior during last week’s move to 97.6K, and how options metrics help gauge conviction behind the move,” Glassnode wrote. The core takeaway: upside flow showed up, but it didn’t meaningfully change how the market priced risk further out the curve.
What Bitcoin Traders Can Learn From Last Week’s Rally
Glassnode first focused on near-term skew. Around mid-January, BTC rose roughly 8% over a few days, and the 1-week 25-delta skew moved sharply toward neutral from “deep put territory.” That kind of front-end shift can look like a market flipping bullish—until you check whether the same repricing is happening in longer expiries.
“Careful though,” Glassnode warned. “Near-dated call demand is often misread as directional conviction.” The thread paired that point with flow data: the options volume put/call ratio dropped from 1 to 0.4, signaling a surge in call activity. But, as Glassnode framed it, the question is not whether calls were bought, but how short-dated that demand actually was.
The longer-dated picture was notably less enthusiastic. Glassnode said the 1-month 25-delta skew “only moved from 7% to 4% at the low,” staying in put asymmetry even as the 1-week skew fell from 8% to 1%. On the 3-month 25-delta skew, the shift was even smaller (less than 1.5%) and it “stayed firmly in put territory,” continuing to price asymmetric downside.
For Glassnode, that divergence matters because it separates “flow” from “risk pricing.” Upside participation can be real, but if the market does not reprice skew across maturities, it suggests traders are not extending that optimism into a higher-conviction, longer-horizon view.
The volatility tape reinforced the same message. “Layering in ATM implied volatility, we see vol being sold as price moved higher,” Glassnode wrote. “Gamma sellers monetized the rally. This is not the volatility behavior typically associated with sustained breakouts.”
That combination: front-end call demand alongside vol supply can align with tactical positioning rather than a regime change. It can also leave spot moves more vulnerable if follow-through buying does not materialize once short-dated structures roll off.
Glassnode closed with a checklist for what a cleaner breakout would look like: “An ideal breakout setup combines spot pressing key levels, skew pointing higher with conviction across maturities, and volatility being bid. Last week’s move didn’t meet those conditions.”
For traders watching whether BTC can revisit $97,600, the thread’s implication is straightforward: monitor whether longer-dated skew begins to lift out of put territory and whether implied volatility starts to get bid, not sold, as spot tests key levels again.
Michael Saylor says Strategy’s evolving capital-markets machine is starting to resemble a “central bank of Bitcoin,” positioning the company as a conduit between traditional money markets and the Bitcoin network. In an interview with Gatecast, the Strategy executive chairman argued the firm’s shift toward perpetual preferred equity and “digital credit” instruments is designed to fund continuous bitcoin accumulation while stripping out refinancing risk.
Saylor traced the company’s pivot to the COVID-era shock of 2020, when “the physical economy of the world came to a grinding halt and the financial system was turned upside down.” Facing what he framed as an existential decision, he said Strategy discovered Bitcoin during “the war on COVID and the war on currency,” and used it to “escape a pretty miserable existence and turned into something digital and modern and much better.”
Strategy Is Building A ‘Central Bank of Bitcoin’
That transformation now sits on a scale Saylor claims is often misunderstood. Addressing criticism that Strategy is simply levering up to buy more Bitcoin, he said the firm has raised roughly $44 billion over the past year and a half and characterized “most of that” as equity rather than debt. “There isn’t really leverage,” Saylor said. “Equity is capital that you have forever. We’re funneling that capital into the crypto economy. We’re buying Bitcoin.” He added that Strategy has acquired “about $48 billion worth of Bitcoin” across “like 88 different transactions,” purchasing “as soon as we raise the capital.”
When asked whether Strategy is still just a buyer or something closer to a “shadow central bank of Bitcoin” given its holdings, Saylor leaned into the analogy. “Bitcoin is digital capital. It is the world reserve capital network. It’s replaced gold as the global non-sovereign store of value for the human race,” he said. Then came the framing: “Banks normally buy credit. We actually sell credit. So what we’re doing is the reverse of commercial banking, retail banking. It is sort of like central banking. We are sort of like the central bank of Bitcoin.”
Saylor’s “central bank” claim hinges on a product stack meant to translate Bitcoin’s balance-sheet asset into yield-bearing instruments for investors who won’t hold BTC directly. He described STRC as “a currency that’s pegged to the dollar” and “backed […] with Bitcoin,” with proceeds recycled into BTC purchases. In his telling, that mechanism links “the Bitcoin economy” to “the traditional finance economy and to the money markets of the world.”
The more material shift, he argued, is Strategy’s progression away from maturity-driven debt toward perpetual structures. Saylor laid out a four-stage evolution: initial use of credit and leverage, a senior note secured by BTC collateral that the company later refinanced and vowed not to repeat, then non-recourse convertible bonds, an approach he said became constrained by market size and retail inaccessibility and finally “digital credit,” which he described as “an equity […]a perpetual preferred equity.”
In one of his clearest statements of intent, Saylor said Strategy’s priority is to prevent principal from ever coming due. “We don’t want to have leverage. We want to have amplification via equity. We never want the principal to come due. We’d rather pay a higher dividend forever,” he said. “I’d rather pay 10% forever than pay 5% for 5 years.” Strategy, he added, has “announced a $1.44 billion cash reserve for the dividends,” giving it “the option to not raise any capital in the capital markets for up to two years,” and in his view “effectively stripped the credit risk off of the business.”
Saylor also pitched liquidity as a differentiator. He said Strategy has raised $7 billion over the last nine months via these instruments and described an emerging market of about $8 billion outstanding. Where preferred stocks typically trade thinly, he argued Strategy’s “digital credit instruments were trading 30 million a day,” with “Stretch […] more than a hundred million a day,” which he framed as a step-change in market access.
The firm’s investor pitch, as Saylor described it, splits the world into capital and credit buyers. “Bitcoin is digital capital. The world will be built on digital capital. But the world will run on digital credit,” he said, arguing that products like Stretch can offer a money-market-like alternative “powered by digital capital” while sidestepping Bitcoin’s volatility.
Bitcoin’s price is fluctuating below the $90,000 mark as volatility increases across the entire cryptocurrency market. During the bearish price action, attention is now being shifted to the cautious signal from the Bitcoin Open Interest in BTC terms, which has remained below past all-time high in years.
Open Interest Tells A Different Story When Measured In BTC
Amid the ongoing volatile action of the crypto market, the derivatives market for Bitcoin is providing a more subdued message. This message is unfolding on the Bitcoin Open Interest (OI) in BTC terms as outlined in a recent research by Joao Wedson, a market expert and founder of the Alphractal analytics platform.
In the report shared on the X platform, the market expert highlighted that the open interest measured in BTC terms has failed to reach new all-time highs since 2022. The BTC-based perspective shows a more restricted usage of leverage over cycles, whereas dollar-denominated measures frequently climb in tandem with price.
On Thursday, the metric experienced a bounce, but Wedson stated that the upward move was mainly in USD-dominated open interest. This pattern suggests that traders are becoming more cautious in the market by allocating capital more carefully as opposed to putting it all into risky positions.
According to the expert, the trend simply suggests that speculation is present in the market and it’s currently expanding. However, the chart shows that the broader market is still far from any form of extreme or irrational euphoria.
Not Enough Profit To Trigger A Bullish Recovery
BTC’s inability to produce another major rally is linked to the level of investors in profit. Darkfost stated that there are still not enough investors in profit to hope for a sustainable bullish recovery. Thus, it is crucial to understand that latent profits are not harmful to a market; it is quite the opposite.
When investors are most in profit, the situation is much more comfortable, which motivates them to hold. However, this only holds up to a certain point. Also, when the supply in profit surpasses 95% or even 100%, latest profits begin to impact the market and may trigger essential corrective phases.
The ongoing correction remained moderate with a drawdown to around 31%, but it was able to sharply reduce the percentage of supply in profit, suggesting very late entry by many investors. Currently, over 71% of BTC is in profit after dropping as low as 64%, a very concerning level that has typically been observed only when Bitcoin was entering a bear market.
However, in Darkfost’s view, the market must reclaim above 75% supply in profit to regain a more stable structure. As long as it stays above this level, the supply in profit has historically been associated with positive periods, as shown in the chart.
With the recent price rebound, the supply in profit saw a brief climb back to 75% before getting rejected. Meanwhile, many BTC investors possibly used this opportunity to exit at break-even or to cut their losses.
Bitcoin spot exchange-traded funds have experienced steep outflows over four trading days, losing a combined total of $1.62 billion.
The exit has raised a question on whether hedge funds are withdrawing their Bitcoin exposure as the market conditions change.
The withdrawals occur as Bitcoin fails to regain momentum around critical price points, while a once-popular institutional arbitrage strategy steadily loses its appeal.
As of January 22, 2026, US-listed spot Bitcoin ETFs recorded net daily outflows of $32.11 million, extending a streak of redemptions that peaked at $708.71 million on January 21, following $483.38 million on January 20, Sosovalue data shows.
In the last one week, net outflows amounted to 1.22 billion.
Trading activity stayed strong on January 22, with Bitcoin spot ETFs recording $3.30 billion in volume, even as assets under management dipped to $115.99 billion, about 6.49% of Bitcoin’s market cap.
BlackRock’s iShares Bitcoin Trust led daily outflows, with $22.35 million redeemed, equivalent to roughly 249.5 BTC.
Despite the withdrawal, IBIT remains the dominant product, holding $69.84 billion in assets and nearly 4% of the Bitcoin supply represented in ETFs.
Fidelity’s FBTC followed with $9.76 million in outflows, while Grayscale’s GBTC reported flat daily flows but remains deeply negative overall, with $25.58 billion in cumulative net outflows as investors continue rotating away from its higher 1.5% fee.
Other issuers, including Bitwise, Ark and 21Shares, VanEck, Invesco, Valkyrie, Franklin, and WisdomTree, recorded largely unchanged flows, showing a pause rather than broad panic selling.
The ETF pullback has unfolded alongside weakness in Bitcoin’s price.
BTC was trading around $89,982 on January 22, down 1.3% on the day and nearly 5% over the past week, after briefly dipping to $88,600.
Trading volume has also cooled, falling nearly 28% to $37.77 billion, a sign that market participation is thinning as prices consolidate below $90,000.
Compressed Yields Trigger Hedge Fund Exit From Bitcoin ETFs
Market observers point to hedge fund positioning as a key driver behind the ETF outflows.
Amberdata shows that yields on the Bitcoin basis trade, a strategy that buys spot Bitcoin via ETFs while selling futures to capture price spreads, have dropped below 5%, down from around 17% a year ago.
As returns compress and approach the yield available on short-dated US Treasuries, fast-moving capital has less incentive to stay deployed.
Analyst noted that while hedge funds likely represent only 10% to 20% of ETF holders, their activity can overwhelm flows in the short term when the trade stops working.
Bloomberg data shows that the unwind is visible in derivatives markets as well.
Bitcoin futures open interest on Chicago Mercantile Exchange (CME) has fallen below Binance’s for the first time since 2023, showing reduced participation in cash-and-carry trades by US institutions after ETFs launched there.
One-month annualized basis yields now hover near 4.7%, barely clearing funding and execution costs, as spreads tighten and arbitrage opportunities fade.
CryptoQuant indicators show apparent demand turning negative, whale and dolphin wallets shifting from accumulation to distribution.
Also, the Coinbase premium remained deeply negative, suggesting weaker appetite from US institutions.
At the same time, leverage in Bitcoin futures has climbed to its highest level since November, increasing the market’s sensitivity to sharp moves in either direction.
Flows in other crypto ETFs underline that the sell-off is not uniform.
Ethereum spot ETFs also recorded heavy outflows this week, including $41.98 million on January 22, while XRP and Solana-linked products saw modest inflows, pointing to selective institutional repositioning rather than a wholesale exit from digital assets.
The crypto market is down today after a brief jump. The cryptocurrency market capitalisation decreased by 2.2% over the past 24 hours, pulling back to $3.11 trillion. At the time of writing, 70 of the top 100 coins have seen their prices drop. The total crypto trading volume stands at $110 billion.
TLDR:
Crypto market cap is down 2.2% on Friday morning (UTC);
70 of the top 100 coins and 8 of the top 10 coins are down;
BTC decreased by 0.4% to $89,477 and ETH fell by 2% to $2,945;
Geopolitical uncertainty may leave BTC oscillating between its safe-haven narrative and its high-beta risk asset role;
Ukraine-Russia talks may help ease markets’ tail-risk fears, but only temporarily;
BTC’s outlook is driven by macro conditions and actual capital flows;
BTC is no longer trading in a state of euphoria;
‘The most plausible near-term scenario is for Bitcoin to continue consolidating in a cautious manner’;
US SEC and CFTC Chairmen will hold a crypto-focused joint event on 27 January;
Ledger is reportedly planning a US IPO that could value it over $4 billion;
US BTC and ETH spot ETFs saw $32.11 million and $41.98 million in outflows, respectively;
Crypto market sentiment remained unchanged within the fear zone.
Crypto Winners & Losers
As of Friday morning (UTC), 8 of the top 10 coins per market capitalisation have seen their price drop over the past 24 hours.
Bitcoin (BTC) fell by 0.4%, currently trading at $89,477. This is the smallest drop on the list,
Bitcoin (BTC)
24h7d30d1yAll time
Ethereum (ETH) decreased by 2%, changing hands at $2,945. This is the second-highest drop in the category.
The highest fall among the top 10 is XRP’s 2.2%, now standing at $1.91.
On the other hand, two coins are currently green. Tron (TRX)appreciated by 3.3% to the price of $0.309.
Binance Coin (BNB) is technically also green, but its increase is so low that the price is practically unchanged. It’s up 0.1% to $890.
At the same time, of the top 100 coins per market cap, 70 have seen their price drop today.
Pump.fun (PUMP) fell the most among these: 6.4% to $0.002481.
On the green side, Rain (RAIN) appreciated the most: 8.4% to $0.00997.
River (RIVER)is next, with a rise of 7.4% to $49.83.
Meanwhile, in the US, SEC Chairman Paul Atkins and CFTC Chairman Michael Selig will hold a joint event on 27 January to discuss ending regulatory chaos, as well as efforts to make the United States the global crypto capital.
“For too long, market participants have been forced to navigate regulatory boundaries that are unclear in application and misaligned in design, based solely on legacy jurisdictional silos,” the chairmen said in their statement.
I'm looking forward to joining @ChairmanSelig next week at our @SECgov and @CFTC joint event to discuss harmonization between our two agencies.
Together we will discuss our efforts to deliver on President Trump’s promise to make the US the crypto capital of the world.
According to Bitunix analysts, the recent developments around the Russia-Ukraine war may be beneficial for the markets, but possibly only in the short term. The US will facilitate talks between Ukraine and Russia in Abu Dhabi today.
At the macro level, analysts say, “this initiative may help ease markets’ tail-risk fears of a full-scale escalation in the near term, but it does not imply a rapid end to the conflict.” A limited ceasefire could be more realistic.
Moreover, geopolitical risk premia could ease in the short term, supporting risk assets and dampening volatility in energy prices, they add.
Yet, the symbolism of these talks may outweigh any immediate breakthroughs. Over the medium term, “markets will need to see tangible room for Russian concessions; absent that, sentiment is likely to swing back and forth.”
For crypto markets, “a scenario in which geopolitical uncertainty merely ‘cools but does not thaw’ would leave Bitcoin oscillating between its safe-haven narrative and its role as a high-beta risk asset,” they conclude.
BTC is No Longer in State of Euphoria
Linh Tran, Senior Market Analyst at XS.com, commented that Bitcoin’s short-term outlook is centred on interest rates, liquidity, and institutional capital flows.
“After the sharp volatility seen toward the end of 2025, BTC is no longer trading in a state of euphoria, but instead reflects the cautious sentiment of global investors amid persistently high rates and financial conditions that have yet to meaningfully ease,” Tran writes.
One of the most important factors influencing BTC is the level of U.S. Treasury yields. “BTC struggles to attract sustained new inflows unless markets begin to believe that the monetary policy cycle is approaching a turning point.”
Meanwhile, the US Federal Reserve will likely hold a cautious stance at the late-January meeting. Therefore, “only sufficiently strong economic data capable of shifting expectations around the rate path are likely to generate meaningful volatility in BTC; otherwise, the market is likely to remain locked in a tug-of-war,” the analysts argue.
Still, the most decisive factor for BTC’s near-term outlook are institutional flows, they conclude. “Bitcoin only establishes a durable uptrend when ETF flows remain consistently positive, rather than through sporadic inflows that are quickly reversed.”
Moreover, the dip-buying demand has not been strong enough to push prices through key resistance levels. Therefore, “without the support of fresh inflows, each rebound risks turning into a profit-taking opportunity, leaving the short-term trend choppy and lacking clear direction.”
“From my perspective,” Tan writes, “the most plausible near-term scenario is for Bitcoin to continue consolidating in a cautious manner, with downside risks persisting if ETF outflows continue. For a more constructive scenario to emerge, the market would need to see improvement on two fronts simultaneously: easing financial conditions and a steady return of institutional net buying.”
Conversely, Tan says, “if yields rebound or global markets shift decisively into a defensive, risk-off stance, Bitcoin is likely to face renewed downside pressure in the short term, given its high sensitivity to changes in risk appetite.”
Levels & Events to Watch Next
At the time of writing on Friday morning, BTC was changing hands at $89,477. It was quite a choppy trading day for the coin. The coin initially and briefly climbed to the intraday high of $90,159 and then dropped to the day’s low of $88,557. It continued trading in this range.
Over the past 7 days, BTC decreased by nearly 7%, trading in the $87,653–$95,649 range.
We now found the support at $89,300, followed by the $87,400 level. The latter previously acted as demand. On the other hand, the resistance levels stand at $91,800 and $94,200.
Bitcoin Price Chart. Source: TradingView
At the same time, Ethereum was trading at $2,945. It saw a similarly choppy trading day. Earlier in the day, it fell from $3,012 to the intraday low of $2,909. For most of the day, it traded in the $2,944-$2,953 range.
Moreover, ETH fell 11.3% over the past seven days, moving between $2,898 and $3,361.
Should the downward push continue, the price may fall further below $2,900, followed by $2,830 and $2,745. If the tide turns, ETH may reclaim the $3,000 level, and if it manages to hold it firmly, the move could open doors for additional notable increases.
Ethereum (ETH)
24h7d30d1yAll time
Meanwhile, the crypto market sentiment remained unchanged over the past day, firmly maintaining its position within the fear zone.
The crypto fear and greed index currently stands at 34 today, the same level as yesterday.
This highlights the overall uncertainty and caution in the market, with participants waiting to see in which direction the needle will move.
ETFs See the Highest Drop in Two Months
The US BTC spot exchange-traded funds (ETFs) posted minor outflows on 22 January, totalling $32.11 million. This is the lowest amount of flows in nearly a month. The total net inflow now stands at $56.6 billion.
Of the twelve ETFs, only two recorded outflows, and none saw inflows.
BlackRock let go of $22.35 million, and Fidelity followed with $9.76 million in outflows.
Additionally, the US ETH ETFs posted minor negative flows as well, with $41.98 million. Like their BTC counterparts, this is also the lowest amount since late December. With this, the total net inflow pulled back further for a third day in a row to $12.34 billion.
Of the nine funds, two ETH ETFs posted outflows, and two saw inflows. Grayscale took in 17.63 million in total.
At the same time, BlackRock recorded $44.44 million in outflows, followed by Bitwise’s $15.16 million.
It would do so in collaboration with Wall Street banks Goldman Sachs, Jefferies, and Barclays.
Exclusive: The French cryptocurrency group, which sells devices that allow investors to securely store tokens, is working with bankers at Goldman Sachs, Jefferies and Barclays on an initial public offering that could take place as soon as this year. https://t.co/SLDJma0xX1pic.twitter.com/FdoOGh6B58
After a single day of increases, the crypto market reverted to downward action that governed this week. Meanwhile, the US stock market closed the Thursday session higher for the second consecutive day. By the closing time on 22 January, the S&P 500 was up 0.55%, the Nasdaq-100 increased by 0.76%, and the Dow Jones Industrial Average rose by 0.63%. Presumably, the TradFi markers are still digesting the US’s apparent decision not to use military force in Greenland or impose tariffs on eight NATO allies.
Is this drop sustainable?
For now, we may continue to see further decreases in the crypto market, at least in the short term. Nonetheless, the price action is not closed for a renewed upward trajectory, though how stable it would be is still unclear.
Lawmakers in the US state of Kansas are weighing new legislation that would establish a state-managed Bitcoin and digital assets reserve funded by unclaimed digital property already held by the state.
Key Takeaways:
Kansas is weighing a state-managed Bitcoin reserve funded by unclaimed digital assets.
The proposal avoids direct Bitcoin purchases, relying instead on abandoned crypto, airdrops, and staking rewards.
The bill updates state law on how unclaimed digital assets are defined and managed.
Kansas Senate Bill 352 (SB 352), introduced on Wednesday by Senator Craig Bowser, proposes the creation of a “Bitcoin and digital assets reserve fund” within the state treasury.
The fund would be administered by the Kansas state treasurer and would rely on abandoned digital assets rather than taxpayer-funded cryptocurrency acquisitions.
Kansas Bitcoin Bill To Be Funded by Airdrops, Unclaimed Digital Assets
Under the bill, the reserve would be built from airdrops, staking rewards, and interest generated from digital assets that fall under Kansas’ unclaimed property laws.
These assets may include Bitcoin, cryptocurrencies, and other digital-only assets that have been deemed abandoned after owners fail to claim them within a legally defined period.
Notably, the proposal explicitly avoids direct purchases of Bitcoin by the state. Instead, it reflects a broader policy approach gaining traction at both state and federal levels, where governments seek exposure to digital assets without buying them on the open market.
This mirrors the White House’s plan to establish a US Strategic Bitcoin Reserve using forfeited Bitcoin rather than newly acquired coins.
SB 352 outlines how funds would be allocated once digital assets enter the reserve. Ten percent of each deposit would be transferred to Kansas’ general fund, while Bitcoin itself would be excluded from general fund use and retained within the reserve.
State of Kansas introduces State Senate Bill 352 to create a Strategic State Bitcoin and Crypto Reserve.
The remaining assets would stay under the reserve fund’s management, potentially allowing the state to benefit from long-term appreciation or yield.
The bill also introduces amendments to Kansas’ unclaimed property statutes, formally defining terms such as “digital assets” and “airdrops.”
It further clarifies how the state should custody, manage, and account for these assets once they are classified as abandoned.
After clearing the Federal and State Affairs Committee, SB 352 was referred on Thursday to the Senate Committee on Financial Institutions and Insurance, where it will face further review.
Kansas Bitcoin Reserve Proposal Follows Pension Fund ETF Bill
The proposal follows earlier digital asset initiatives in Kansas.
Senate Bill 34, introduced in January 2025, would allow the Kansas Public Employees Retirement System to allocate up to 10% of its portfolio to spot Bitcoin exchange-traded funds. That bill remains under consideration in the same committee.
Kansas is one of several US states exploring crypto-related legislation, including reserve concepts, regulatory task forces, and limited investment frameworks.
At the federal level, the administration of President Donald Trump has reiterated plans to move forward with a national Bitcoin reserve funded through seized assets.
A senior White House official said in January that the initiative remains a priority.
Internationally, countries such as El Salvador and Bhutan have already taken more direct approaches, incorporating Bitcoin into national strategies through state holdings, mining initiatives, and development projects tied to digital assets.