Technical analysis of XRP’s price action on the 3-week candlestick timeframe chart shows that the cryptocurrency is about to play out a road to the double-digit threshold based on its long-term structure.
The analysis, which was shared on the social media platform X alongside a multiyear chart, points to XRP trading in what is labeled Phase 4. At the center of this setup is a clear technical target of a break above the previous all-time high and a run to at least $21.5
XRP Price Action In Phases
Technical analysis of XRP price action shows that the cryptocurrency has been trading in a series of four phases for more than a decade. One full sequence of four phases unfolded between mid-2013 and mid-2017 as the foundation for XRP’s first rally to price peaks. Since then, a second set of four phases has been developing and following a similar pattern.
XRP transitioned into a new phase 1 and phase 2 sequence that led to a 2018 peak for phase 1 and then a pullback for phase 2 between 2018 and 2020. This was followed by an unusually long p3 that stretched from 2019 to mid-2024, visible on the chart as a broad, multi-year consolidation with converging trendlines of lower highs and higher lows. During this time, XRP’s price action was trapped inside the compression structure, just like the behavior seen during phase 3 of the first cycle.
According to the technical analysis, phase 4 began in 2025, when XRP finally broke above the compression range in mid-2024. This breakout was the same structural transition seen in mid-2017, when XRP exited consolidation and entered expansion.
Phase 4 has already been in progress for several months and includes the period when XRP rallied to new all-time highs in mid-2025, eventually topping out at $3.65 in July. Since that peak, however, XRP’s price action has been playing out a corrective downward trend and is down by roughly 48% at the time of writing.
Despite the ongoing correction, the projection is that XRP is still in phase 4 and is going to break into new all-time highs soon. This shows that phase 4 could unfold over an extended period and not with a single impulse move. The current all-time high of $3.65 is the first major technical hurdle, and a break above it will serve as confirmation that XRP is back into price discovery.
Based on this technical analysis, past expansion ratios from the previous cycle are applied and a 6.618 Fibonacci extension is measured from the phase 3 support low. This points to a projected price level near $21.5. At the time of writing, XRP is trading at $1.89, meaning a move to that level would represent an increase of roughly 1,040% from current prices.
Featured image from Pexels, chart from TradingView
A growing number of chart watchers are pointing to a long stretch of sideways trading for XRP and saying this setup has come before big rallies. According to a widely followed analyst known as CryptoBull, the current price action echoes earlier runs in the token’s history.
The signal is simple: long quiet periods sometimes lead to sharp moves when buying pressure returns. That does not mean a jump is guaranteed. Markets can stay quiet for a long time, and timing is uncertain.
Pattern Mirrors Prior Cycles
Based on reports, XRP’s weekly structure shows a stretch of range trading after strong breakouts from earlier years. The comparison reaches back several cycles. In past examples, long ranges eventually gave way to impulsive runs that pushed the price far above prior highs.
The next impulse will take #XRP to $11 and the last wave to $70. The price pattern is copying the previous bullrun, only difference is time, which makes sense, as we need longer accumulation for higher prices. pic.twitter.com/WJxzYDVRKT
CryptoBull argues the present consolidation has lasted longer than previous ones, which, he says, could compress price action and build fuel for a larger expansion when momentum flips. The idea rests on history repeating itself in broad strokes, not in exact moves.
Longer Accumulation Could Support Bigger Targets
Some analysts see a sixfold move as plausible if the same pattern plays out. That kind of rise would put XRP near $11, a figure being discussed by multiple commentators. There is also talk of a further, final wave lifting the token much higher in a later stage — talk that reaches $70 in extreme scenarios.
A bottom test—where price revisits support to confirm strength before a new push—has appeared in a few past cycles and is being watched closely now.
The presence of such tests can either validate a base or warn that the range has more work to do. Timelines are vague, and a long accumulation period can stretch for years before any decisive breakout.
RLUSD Rumors Fuel Speculative Calls
Reports that BlackRock may use Ripple’s RLUSD stablecoin have added fuel to the fire. News like that has pushed sentiment upward and sparked fresh technical calls, with some forecasts ranging from $6 to $14 in near- to mid-term scenarios.
Other voices go far beyond, naming targets that would imply market caps so large they would be hard to reconcile with today’s market size.
These more extreme numbers should be treated with caution, because they assume near-perfect conditions and massive capital flows that may never arrive. Still, adoption whispers can tilt sentiment and speed up moves when buyers pile in.
Featured image from Unsplash, chart from TradingView
Reports say the Ethereum Foundation has started a new team to prepare the network for possible quantum computer attacks. These machines could one day break the math behind wallets and signatures. The team’s work is moving from research into practical tests and experiments, which has drawn attention across the crypto community.
Ethereum Launches Post-Quantum Team
Based on reports, Thomas Coratger will lead the effort. The team includes cryptographers and engineers already testing new systems on devnets. Some work ties into a project called leanVM and a researcher named Emile, who focuses on building simple quantum-safe tools. The goal is to test new algorithms in real software while keeping current transactions running smoothly.
Today marks an inflection in the Ethereum Foundation’s long-term quantum strategy.
We’ve formed a new Post Quantum (PQ) team, led by the brilliant Thomas Coratger (@tcoratger). Joining him is Emile, one of the world-class talents behind leanVM. leanVM is the cryptographic…
A $1 million prize has been set for improvements to the Poseidon hash function. Another $1 million prize supports broader post-quantum research. In total, roughly $2 million are being offered to labs and independent developers to design and test quantum-resistant solutions. Reports say this funding is meant to speed up work and show what can realistically replace current signatures.
Early Tests And Community Involvement
Multi-client devnets are already active. Developers are experimenting with new signature types to see what works and what fails. Biweekly sessions led by researchers like Antonio Sanso let teams share results and update code. A Post-Quantum Day is scheduled for March 2026 before ETHCC, with a larger event planned in October 2026 to show progress and plan next steps.
Quantum computers could, in theory, break the ECDSA and secp256k1 schemes used today. That risk is not immediate but serious enough that Ethereum is acting now. Reports note users should watch for official guidance, follow wallet updates, and avoid reusing addresses once upgrades roll out.
Community reaction has been mixed. Some online discussions praised the careful planning, while traders noticed a small dip in ETH price. Others questioned how upgrades would reach millions of wallets and what happens to old keys. The Foundation’s approach is to test solutions early so users and services are better protected when changes happen.
This step is part of Ethereum’s long-term plan for safety. Tests will continue, standards will be debated, and progress will be shared publicly. By acting now, Ethereum aims to reduce risk and make future transitions smoother for everyday users and the network as a whole.
Featured image from Unsplash, chart from TradingView
Nifty Gateway, the marketplace that once helped bring NFT drops to a wider audience, will stop running its marketplace on February 23, 2026. The company put the site into a withdrawal-only mode the same day it made the announcement, and users were told they must move any remaining funds and NFTs off the platform before that date.
Withdrawal Window Opens
According to the company, withdrawal tools are available now. Reports note users can pull USD or ETH balances through a linked Gemini Exchange account or send funds to their bank via Stripe.
Emails with step-by-step instructions will be sent to account holders, and a shutdown notice already appears on the Nifty Gateway homepage. The aim, as described by the owner, is to let people retrieve what they own before the platform goes dark.
Today, we are announcing that the Nifty Gateway platform will be closing on February 23, 2026. Starting today, Nifty Gateway is in withdrawal-only mode.
Nifty Gateway was launched in 2020 with the vision of revolutionizing digital art. Since launching, Nifty supported dozens of…
Based on reports from Gemini, the closure is meant to let the parent firm concentrate on building one bigger app for customers. The move highlights how interest and trading activity in many NFT markets have cooled from the highs seen in earlier years.
Some collectors and artists are left scrambling to rehome items they once sold or stored on Nifty Gateway.
End Of An Early Player
Nifty Gateway helped make buying NFTs easier for people who preferred credit cards and familiar checkout flows. It launched as a high-profile marketplace and hosted major drops from well-known creators.
The platform supported hundreds of millions in sales at its peak and played a clear part in bringing NFT art into mainstream headlines. Its exit marks the end of an important chapter for that wave of marketplaces.
What Owners Must Do Now
Owners should check their inboxes for the official instructions, confirm where their tokens are stored, and move assets before the deadline. If NFTs are stored in custodial wallets on the site, they will need to be transferred out.
USD and ETH balances should be withdrawn or moved into a connected Gemini account if that option suits the owner. Waiting past the closure date will reduce options.
A Quiet Turning Point
For many collectors, this will feel like another sign that the early boom years have passed. For creators, the change raises questions about where drops and secondary sales will happen next.
Gemini says it will keep supporting NFTs through its other products, including the Gemini Wallet, but the specific ways that creators and buyers reconnect with those audiences will depend on new tools and services that arrive in the next months.
Featured image from Unsplash, chart from TradingView
A growing number of analysts believe Ethereum’s current price action is being misunderstood. Although frustration is growing due to Ethereum’s inability to hold above $3,000, some technical analysts are quick to point out that the structure forming beneath the surface tells a very different story. According to one analyst, the real risk right now is not being bullish on Ethereum and trying to short in anticipation of a downside breakout.
Higher Lows And A Structure That Keeps Tightening
The analyst’s technical view on Ethereum is focused less on short-term momentum and more on the structure developing on the chart, which he argues is even clearer than what is currently visible on Bitcoin’s chart.
Notably, Ethereum’s price action is carving out a series of higher lows on the daily candlestick timeframe chart to form a tightening triangular pattern since December 2025. This kind of behavior shows that each pullback is being absorbed at progressively higher levels, which is how strong trends reset before continuation.
Ethereum needs to avoid a breakdown below key support zones in order for this trend continuation setup to still be valid. According to the analyst, a dip under $2,860 would begin to weaken the pattern, while a close below $2,780 would invalidate the higher-low structure.
At the time of writing, Ethereum is trading around $2,950, which is dangerously close to the lower boundary of this setup. Therefore, some traders will be tempted to short Ethereum at this level, but the analyst called it the dumbest thing to do here.
As long as those levels ($2,860 and $2,780) hold, the analyst sees no technical justification for betting against ETH, especially near the lower boundary of the channel where buyers have repeatedly stepped in.
If support holds, the next move would be a gradual return to the upper trendline of the channel, which is just below $3,340. A move into that region would bring price back into direct contact with overhead resistance and set the stage for a breakout if buying pressure continues to increase.
Ethereum is entering 2026 without clear bullish momentum, a reality that has dampened sentiment across the spot and derivatives markets. Spot ETF inflows into Ethereum and Bitcoin have slowed down, and issuers have been highlighted with consistent days of outflows.
Speaking of staking, BitMine Technologies recently amped up its ETH staking to over $5.71 billion worth of Ethereum. On-chain data from Arkham Intelligence shows that the firm has staked an additional 171,264, worth $503.2 million, pushing its total stake to over 1.94 million ETH.
Featured image from Unsplash, chart from TradingView
XRP has spent most of the past few months trading with lower highs since July 2025, frustrating traders and compressing price action into an increasingly tight range.
However, a technical breakdown shared by crypto analyst ChartNerd argued that what looks like stagnation may actually be the final preparation phase before a historic move. The price structure suggests something far bigger that sends XRP on its most aggressive rally in eight years, but the implications only become clear when the full setup is examined.
A 400-Day Rectangular Reaccumulation Still Holding Structure
According to technical analysis done by ChartNerd, XRP’s price action has been locked inside a rectangular reaccumulation zone for about 400 days, and this has led to the formation of what looks like a rectangular bull flag on a macro timeframe. The technical chart shows a strong impulsive move from July 2024 to December 2024 acting as the flagpole, right when XRP peaked at the $3.4 price zone back then.
This impulsive flagpole has been followed by a long period of sideways trading where XRP’s price has repeatedly respected a clearly defined support around $1.8 and resistance boundaries around $3.6. This type of structure is associated with reaccumulation within the support and resistance zones, especially when it is playing out after a sharp expansion move and holding for this length of time.
Each dip into reaccumulation support has been absorbed, preventing any sustained breakdown and keeping the broader pattern intact. ChartNerd noted that the rectangular flag will be valid as long as this support level is defended, and this will activate the expansion journey.
Macro Breakout Projection Puts XRP Price Target At $23
According to ChartNerd, bearish participants are increasingly pressured by the fact that this fractal is still holding despite repeated attempts to invalidate it. The longer XRP’s price action is trapped inside the rectangle without breaking down, the more likely it becomes that the eventual resolution favors the dominant trend that preceded the consolidation. In this case, that trend was bullish, which strengthens the case for an upside breakout once resistance is cleared.
If the rectangular bull flag resolves to the upside as projected, the chart outlines a breakout trajectory that would carry XRP into double-digit territory, with a long-term target region near $23. This price target projection is derived from the height of the flagpole extended from the top of the reaccumulation range.
ChartNerd labelled this possible move as one of the most aggressive rallies XRP could see in seven to eight years. At the time of writing, XRP is trading around $1.92, meaning a move toward the $23 region would represent a gain of over 1,000% from current levels, which is a type of percentage expansion XRP has played out well in the past.
Featured image from Unsplash, chart from TradingView
US authorities have arrested former Canadian Olympic snowboarder Ryan Wedding, ending a years-long international manhunt for a figure investigators describe as a major cocaine trafficker who relied on cryptocurrency to move and conceal illicit profits.
Key Takeaways:
Former Olympian Ryan Wedding was arrested in Mexico and extradited to the US after years on the FBI’s Most Wanted list.
Authorities allege he ran a cartel-linked cocaine network and used crypto to launder proceeds.
US officials say the operation generated over $1 billion annually and spanned multiple countries.
Wedding, 44, was taken into custody in Mexico late Thursday and transferred to the United States on Friday, according to US officials.
The former athlete, who competed for Team Canada at the 2002 Winter Olympics in Salt Lake City, had been listed among the FBI’s Ten Most Wanted fugitives, with a reward of up to $15 million offered for information leading to his capture.
Former Olympic Snowboarder Faces US Charges in Global Drug Case
US Attorney General Pam Bondi said Wedding, whom she described as a “onetime Olympian snowboarder-turned alleged violent cocaine kingpin,” will face federal charges in the US related to drug trafficking, murder, and operating a criminal enterprise spanning multiple countries.
FBI Director Kash Patel confirmed the arrest in a post on X, crediting cooperation with Mexican authorities for locating Wedding after more than a decade on the run.
UPDATE: After landing in LA today to transfer Top Ten Most Wanted Fugitive Ryan Wedding, our FBI/DOJ teams are now landing in Charlotte, NC to transfer another – Alejandro Castillo – the Top Ten Most Wanted Fugitive arrested one week ago today in Mexico.
Investigators allege that Wedding played a senior role in cocaine distribution networks tied to Mexico’s Sinaloa Cartel, overseeing shipments from Colombia into the United States and Canada.
According to US officials, the operation generated more than $1 billion annually in illegal proceeds at its peak.
The US Treasury Department’s Office of Foreign Assets Control sanctioned Wedding in November, accusing his organization of using cryptocurrency to move and launder drug profits.
In its notice, the Treasury said digital assets were used to obscure the flow of funds and conceal large sums derived from narcotics trafficking.
Mexico’s Security Secretary Omar García Harfuch said Wedding voluntarily surrendered at the U.S. Embassy before being handed over to the FBI.
Patel later told reporters that Wedding had been hiding in Mexico for over 10 years and was believed to be under cartel protection.
Wedding arrived Friday at Ontario International Airport in Southern California, where federal officials held a press conference following his transfer.
Authorities said they seized firearms, luxury vehicles, artwork, and other assets connected to the alleged criminal enterprise, and indicated further arrests may follow as the investigation continues.
Ryan Wedding’s Earlier Cocaine Case Predates Latest US Charges
This is not Wedding’s first encounter with US law enforcement. In 2008, he was arrested in California in a cocaine trafficking sting involving a Vancouver-based operation.
He was convicted in 2009 and sentenced to four years in prison, before being released around 2011.
The arrest comes as crypto-related crime remains a growing concern. According to Chainalysis, illicit cryptocurrency addresses received a record $154 billion in 2025, a sharp increase from the year before.
In another case, US prosecutors have charged a 23-year-old Brooklyn resident, Ronald Spektor, with stealing roughly $16 million in cryptocurrency from around 100 Coinbase users through an alleged phishing and social engineering scheme.
Wearing a pair of interesting sunglasses, Binance founder CZ said that Bitcoin could enter a supercycle in 2026. If that happens, altcoins like XRP and Ethereum could explode.
Bitcoin is currently trading around $88,000 after getting rejected near the $98,000 level for the second time.
Fundamentally, nothing has gone wrong. Bitcoin, XRP, and ETH continue to improve over time. Technically, though, these coins are still in a weak phase. Below is how things could play out for the three as we head into 2026.
Bitcoin (BTC)
24h7d30d1yAll time
Bitcoin Price Prediction: What If BTC Just Broke Out?
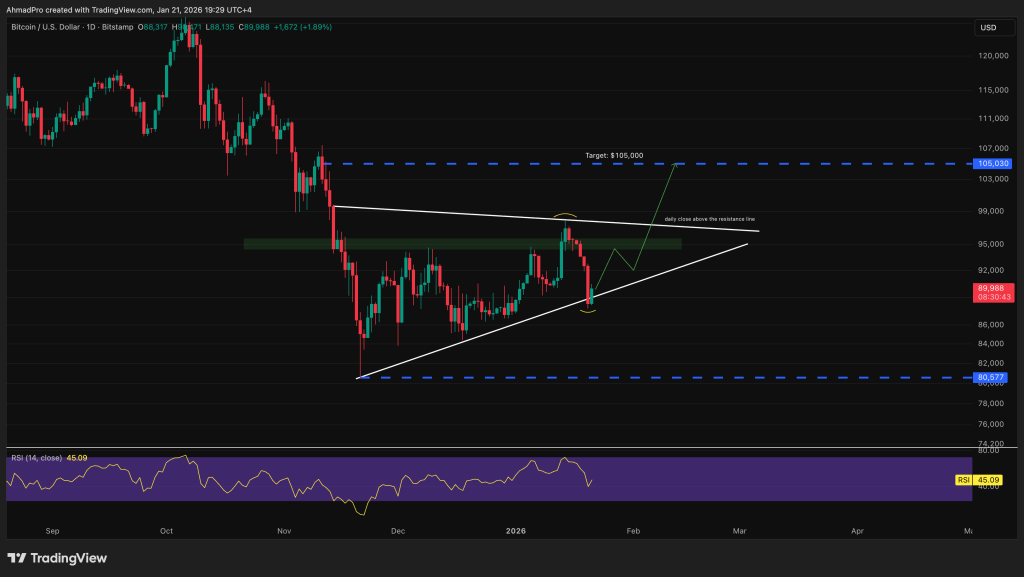
BTC is starting to tighten up inside a squeezing structure, with rising support pushing price into a descending resistance line. It is basically a classic compression setup.
The main level to watch is the $96,000–$98,000 resistance zone, which has shut down every bounce so far. A daily close above that area would be a big deal and could open the door for a move toward $102,000, then $105,000.
On the downside, rising support from the recent lows in the low $80,000s has held up well, keeping higher lows intact and stopping a deeper breakdown.
Momentum is neutral but slowly improving. For now, Bitcoin is stuck in consolidation after the recent drop, and this is a patience game.
Ethereum Price Prediction: ETH Holds Support but Lacks Conviction
Ethereum spot ETFs continue to record outflows. However, the recent outflows are low compared to past days’ outflows, which is a good sign. ETH spot ETFs recorded $42 million in outflows
ETH price is trying to hold its structure after a rough pullback, with price riding along rising support but struggling to break through the $3,400–$3,500 resistance zone.
That area has rejected price multiple times, which is why ETH keeps stalling instead of trending higher. As long as the rising support around the high $2,600s to $2,700 zone holds, the bigger structure stays constructive, and this move looks more like consolidation than a full breakdown.
A clean break above $3,500 would be the first real sign of strength and could open the door for a push toward $4,300, with $5,000 as the larger upside target.
Momentum is still weak but starting to stabilize. RSI needs to push back above 50 to support a stronger bullish move.
XRP Price Prediction: XRP Tries to Escape the Downtrend, Is $2.50 Next?
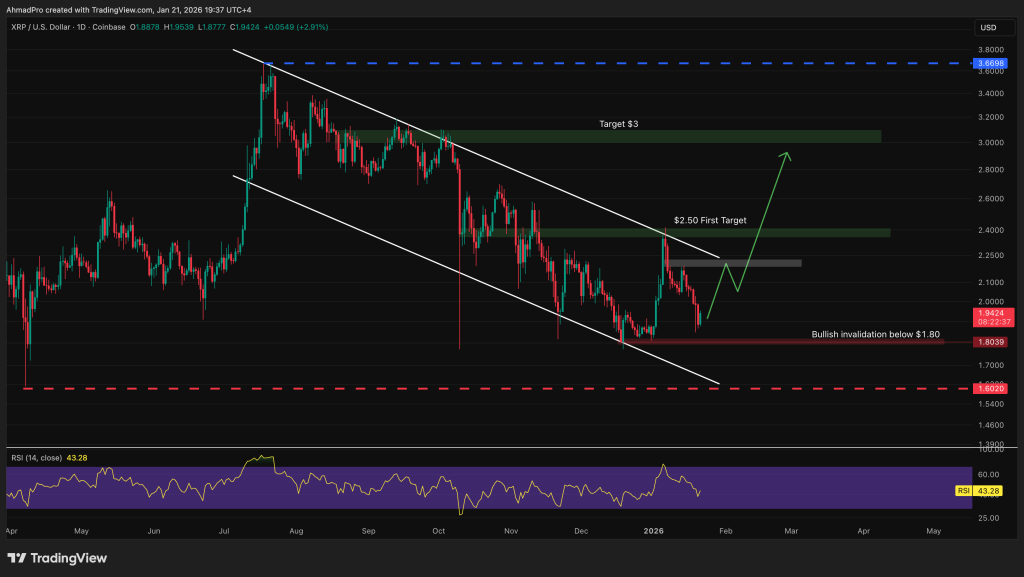
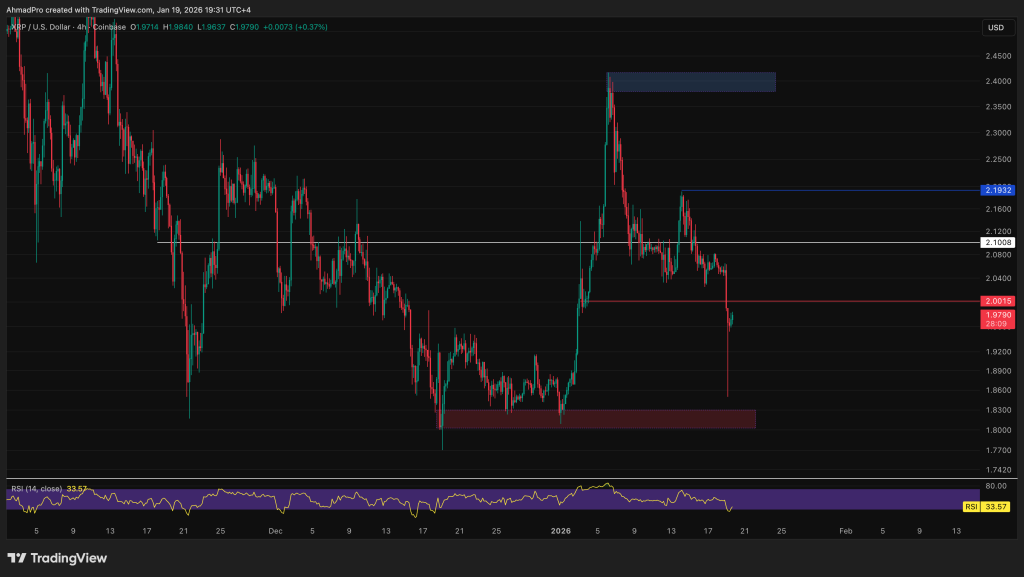
XRP is still stuck inside a well-defined descending channel, which explains why rallies keep getting sold into instead of turning into real trend reversals.
Price recently bounced from the $1.80 area, which is acting as a key demand zone and the main bullish invalidation level.
As long as XRP holds above that level, this bounce remains technically valid, but the structure is still weak overall. The first real test for buyers sits around the $2.40–$2.50 zone, where the price previously broke down and where the upper channel resistance lines up.
A clean break and daily hold above that area would be the first sign that momentum is shifting, opening the door for a move toward the $3.00 target zone.
Momentum is still mixed. RSI is sitting around 42. Notice something? All three are sitting at the same point waiting for the major move.
Holding above $1.80 keeps the bullish scenario alive, while a break below that level would invalidate the setup and likely send XRP back toward lower support
Bitcoin Hyper Is Loading While the Market Sleeps
With Bitcoin compressing under $100,000, Ethereum stuck below major resistance, and XRP still fighting its downtrend, the market is clearly in a waiting phase. That is usually when attention quietly shifts to projects that do not need a confirmed breakout to start moving.
That is where Bitcoin Hyper is starting to stand out.
Bitcoin Hyper is being positioned as a high-beta play built specifically for volatility cycles like the one CZ is hinting at. When Bitcoin enters a supercycle, capital does not just flow into majors. It spills into smaller, faster-moving narratives that offer asymmetric upside, especially while the big names are still consolidating.
The project has already raised over $30.9M, showing strong early conviction even while the broader market remains cautious. On top of that, Bitcoin Hyper offers staking rewards around 39% APY, giving holders an incentive to stay locked in instead of trading short-term noise.
Historically, the biggest winners of new cycles are rarely the assets that break out last. They are the ones accumulated quietly while Bitcoin ranges, Ethereum chops, and XRP frustrate traders. Bitcoin Hyper is clearly targeting that window.
If Bitcoin really does enter a supercycle in 2026, the projects built and accumulated during this compression phase are often the ones that move first and hardest once momentum returns. Bitcoin Hyper is shaping up to be one of those names traders keep an eye on.
If you compare Bitcoin to gold, the underperformance is clear. Altcoins like XRP, Solana, and SUI have followed the same pattern and are still sitting deep below their all-time highs.
Bitcoin has recently tried to regain strength, but each rally keeps getting rejected at key resistance levels as market uncertainty persists.
Fundamentally, nothing has gone wrong. XRP, SOL, and SUI continue to improve over time. Technically, though, these coins are still in a weak phase. Below is how things could play out for the three as we head into 2026.
Bitcoin (BTC)
24h7d30d1yAll time
XRP Price Prediction: Could A Collapse Below $1.80 Be Possible?
Ripple price is currently down 60% from its highs and has been in a downtrend for eight days in a row. Momentum has faded, but RSI at 43 has not yet signaled oversold conditions.
XRP is trading inside a clear descending channel. This explains why every bounce lately has been corrective rather than trend-changing.
Price recently pushed off the lower boundary near the $1.80 area, which is acting as a short-term demand zone and a key bullish invalidation level. As long as XRP holds above $1.80, this bounce remains technically valid, but the structure is still fragile.
The first real test for buyers sits around the $2.40–$2.50 zone. It lines up with prior resistance and the upper part of recent consolidation. A clean break and hold above that area would be the first signal that momentum is shifting. Also, it will open the door for a move toward the $3.00 level next.
Solana Price Prediction: SOL Stuck in Descending Channel
Solana is still stuck inside a clear descending channel, which is why every bounce lately has been corrective instead of a real trend change.
Price recently bounced off the lower boundary around the $118 area, which is acting as short-term demand and a key support to watch. As long as SOL stays above that zone, the bounce remains technically valid, but the structure is still weak.
The level bulls need to reclaim is $144, since it lines up with channel resistance and prior supply. A clean break and hold above $144 would be the first real sign of strength and could open the door toward $200, with a bigger resistance waiting near $250.
RSI is sitting around 42, showing momentum is still weak; it would need to push back above 50 to support a stronger move higher.
SUI Price Prediction: $1.40 Acts Like The Most Important Level
SUI is trying to find its bottom after a huge selloff, with price now narrowing up between rising support around $1.40 and a descending resistance from the prior downtrend.
So far, that $1.40 area has held well and is acting as a key demand zone, keeping the short-term bullish setup alive.
If buyers can push price above the downtrend trendline and reclaim the $1.90–$2.00 area, that would be the first real sign of momentum turning and could open the door for a bigger bounce toward the $3.50–$4.00 resistance zone.
Holding above $1.40 is crucial. A clean break above $2.00 would add potential to the bullish scenario, while losing support would likely put SUI back under downside risk.
Maxi Doge ($MAXI) is Thriving While Majors Stay Stuck
While XRP, Solana, and SUI are all trapped in downtrends and waiting on clean technical breaks, some traders are skipping the patience game and looking for where momentum does not need perfect charts to work. That is where Maxi Doge comes in.
Maxi Doge is built for exactly this kind of market. When majors underperform, confidence is low, and rallies keep failing at resistance, capital often rotates into high-beta memecoins with simple narratives and asymmetric upside. That rotation usually starts quietly, long before charts flip bullish.
The project has already pulled in strong early funding, even as broader altcoin sentiment stays weak. On top of that, Maxi Doge offers aggressive staking rewards, with APY hovering around 70%, giving holders a reason to sit tight while the rest of the market chops sideways.
Historically, some of the biggest memecoin runs have kicked off when Bitcoin and large caps looked stuck and boring. Maxi Doge is positioning itself for that exact window. If volatility picks up heading into 2026, the tokens accumulated during periods of frustration are often the ones that move first and hardest.
For traders tired of waiting on XRP, SOL, and SUI to break their downtrends, Maxi Doge stands out as a high-risk, high-reward play worth keeping on the radar.
Despite this lift, PI remains down by 9% in a week and by 7% in a month, with the altcoin suffering a 93% decline since posting a record high of $2.99 in February of last year.
Yet today’s rally suggests that PI may have bounced up from a key support level in the $0.180 region, having hit a bottom in recent days.
And when taken with ongoing community efforts to make the coin and its platform more useful, the longer term Pi Coin price prediction is starting to look very promising right now.
Pi Coin Price Prediction: Token Bounces from Critical Support Level – Long-Term Setup Could Surprise Everyone
As we can see from today’s Pi Coin price chart, the token has begun a strong rebound after spending too long in oversold territory.
Indeed, apart from a couple of brief bounces in late October and late November, PI’s relative strength index (yellow) has around eight months below 50.
Source: TradingView
This is very rare for a top-100 cryptocurrency, so rare that it points to either one of two conclusions, with the first being that the Pi Coin price is about to enjoy a massive breakout.
On the other hand, pessimists may argue that such behavior indicates a coin suffering a terminal decline, which may be true given how PI has failed to attract listings on numerous major exchanges (e.g. Binance, Coinbase, Kraken).
One thing worth highlighting, however, is that PI has broken out of the steeply descending channel we see in the chart above.
And when combined with Pi hitting a bottom a few days ago, we could indeed see the coin reaching new levels soon.
It continues to have a big and strong community, which will help boost its usability and value over the long term.
SUBBD Raises $1.4 Million As It Prepares to Launch AI-Powered Content Platform
If PI doesn’t seem promising enough, traders may want to diversify into newer alternatives, including presale coins.
Such coins can have the potential to rally impressively when they list for the first time, particularly if they’ve had a popular sale.
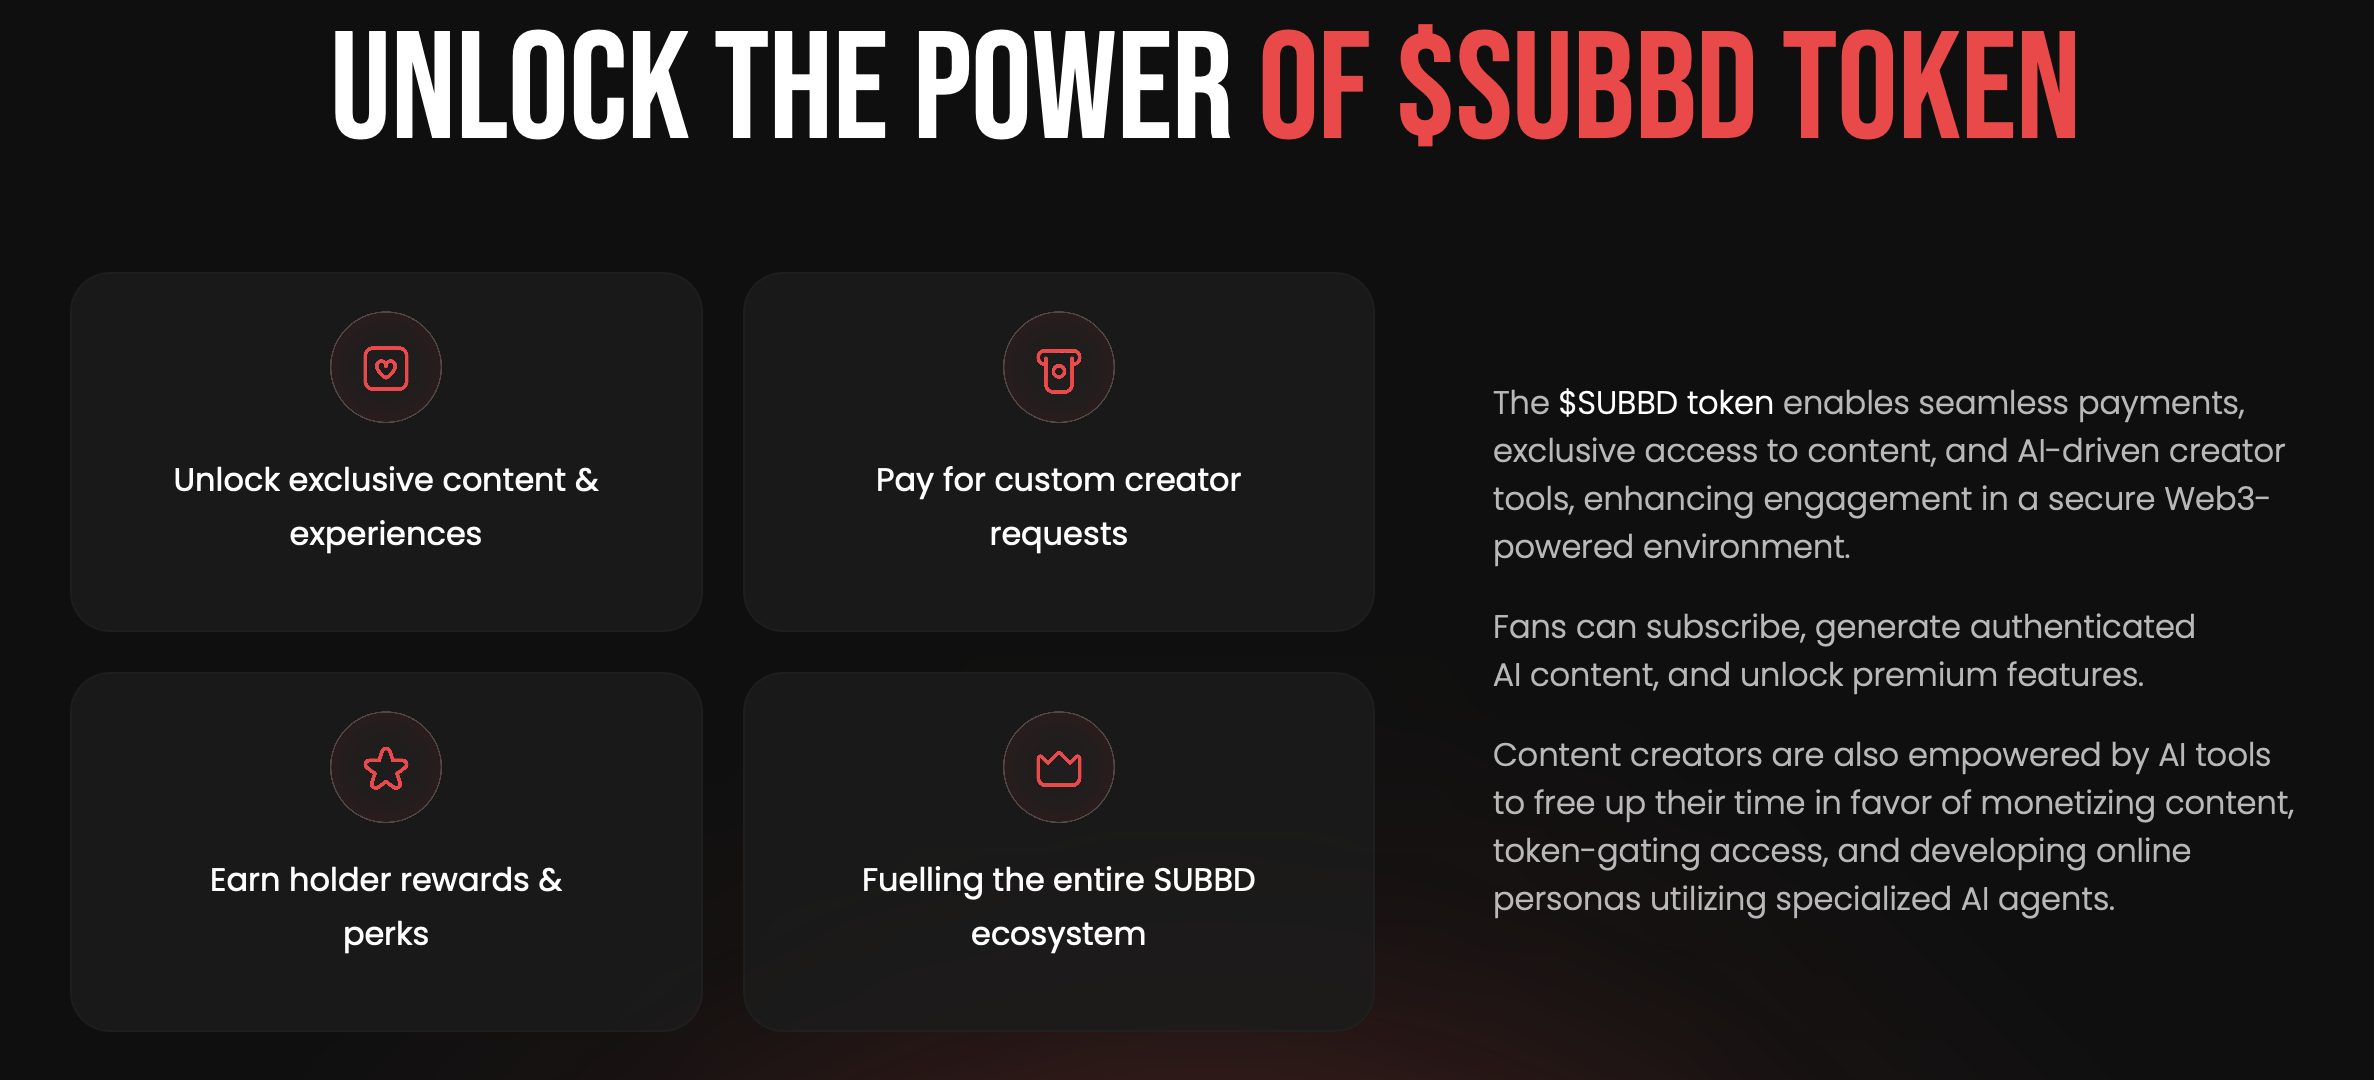
And one new token that is gaining more popularity right now is ERC-20 cryptocurrency SUBBD ($SUBBD), which has raised over $1.4 million in its ongoing sale.
SUBBD is about to launch an AI-powered content creation platform, one which gives creators more power over how they produce and earn from adult-themed media.
Its AI tools can generate everything from ideas to videos and the performers who star in them, making creators more productive than ever before.
And the use of crypto means that payments are transparent and quick, in contrast to pre-existing content platforms.
If you are anything like me, you believe in the bright long-term future of crypto. Well, that does not change the fact that prices for XRP, Bitcoin, and Ethereum do not look great at the moment.
These dips across the market were triggered by Bitcoin dropping back toward $89,000 after getting rejected near the $98,000 level.
Fundamentally, nothing has gone wrong; these coins are improving as time goes by. Technically, though, the market is going through a weak phase. Every rally is getting shut down at key resistance levels. Below is how things could play out for these three as we head into 2026.
Bitcoin (BTC)
24h7d30d1yAll time
Bitcoin Price Prediction: Collapse Toward $80,000 Is Possible?
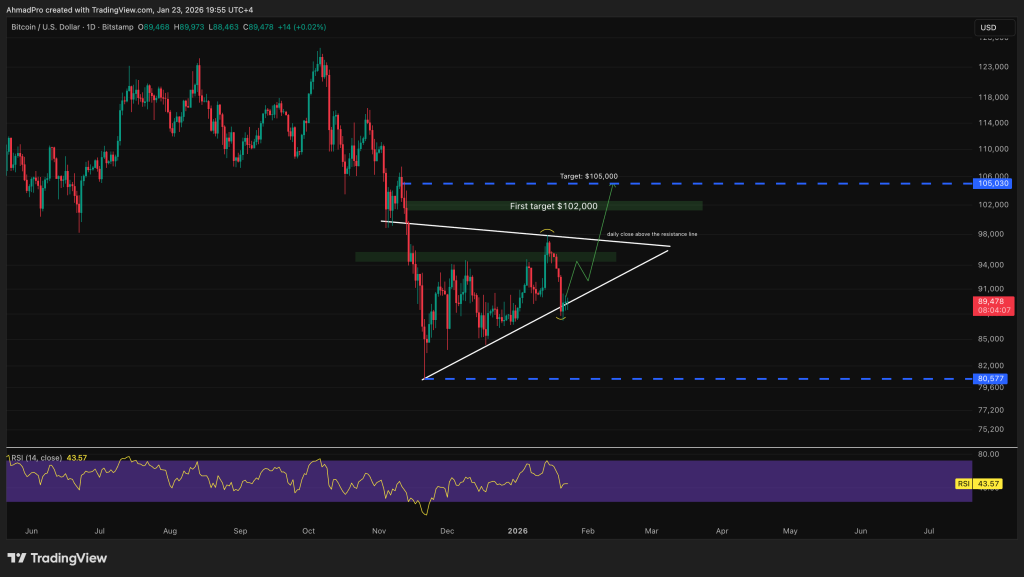
BTC price is consolidating inside a symmetrical triangle after a sharp downside move, driven by growing risk-off sentiment as political uncertainty continues to weigh on markets.
The purple highlighted zone marks the area where Bitcoin was previously rejected before the selloff. Bitcoin is currently trading at $89,500. A break below the support trendline would likely open the door for a deeper correction toward the $80,000 level.
RSI is sitting around 43, showing weakening momentum. Combined with the recent rejection and ongoing uncertainty, the bearish scenario is currently favored.
That said, support is starting to build in the $87,000–$85,000 area. If this zone holds and Bitcoin manages a daily close above the resistance trendline, the bearish outlook would be invalidated, and a bullish shift could take shape. In that case, the next major resistance sits near the $105,000 level.
Ethereum Price Prediction: $3,000 Breakdown Puts Structure at Risk
When Bitcoin is down, the rest of the market usually follows, and Ethereum is no exception. ETH is currently trading below $3,000, which puts the higher lows structure it has been building at risk.
A clean loss of this level could lead to a deeper correction toward the $2,700–$2,800 support zone.
ETHUSD is currently trading below a key resistance zone, forming an ascending consolidation that often leads to a breakout, but that move is not confirmed yet.
From a momentum perspective, the higher timeframe structure remains in place, but RSI is still below 50, which means it’s currently leaning bearish.
For a bullish continuation to be confirmed, Ethereum needs a strong daily close above resistance, ideally followed by a clean retest and improving momentum. Until then, this remains a developing bullish setup rather than a confirmed breakout.
XRP Price Prediction: XRP Feels Trapped in Downtrend
XRP price is currently down 60% from its highs and has been in a downtrend for eight days in a row. Momentum has faded, but RSI at 43 has not yet signaled oversold conditions.
XRP is trading inside a clear descending channel. This explains why every bounce lately has been corrective rather than trend-changing.
Price recently pushed off the lower boundary near the $1.80 area, which is acting as a short-term demand zone and a key bullish invalidation level. As long as XRP holds above $1.80, this bounce remains technically valid, but the structure is still fragile.
The first real test for buyers sits around the $2.40–$2.50 zone. It lines up with prior resistance and the upper part of recent consolidation. A clean break and hold above that area would be the first signal that momentum is shifting. Also, it will open the door for a move toward the $3.00 level next.
Maxi Doge ($MAXI) Is Quietly Building Momentum While the Majors Struggle
While Bitcoin, Ethereum, and XRP are all stuck fighting heavy resistance and fading momentum, some traders are already shifting their focus to where upside does not depend on perfect technical breakouts. That is where Maxi Doge is starting to stand out.
Maxi Doge is built for high volatility phases exactly like this one. When majors grind lower, chop sideways, and frustrate traders, capital often rotates into aggressive memecoin narratives with asymmetric upside. That rotation usually starts before the broader market realizes risk is turning back on.
The project has already raised strong early capital, showing conviction even while sentiment across large caps stays weak. On top of that, Maxi Doge offers eye-catching staking rewards, the current APY sitting around 70%, giving traders a yield angle while waiting for sentiment to flip.
Historically, some of the biggest memecoin runs have started when Bitcoin looked shaky, and altcoins were stuck in downtrends. Maxi Doge is positioning itself for that exact moment. If momentum shifts heading into 2026, the projects accumulated during uncertainty are often the ones that move first and hardest.
For traders looking beyond the current chop in BTC, ETH, and XRP, Maxi Doge is shaping up as a high-risk, high-reward alternative worth watching closely.
A macro stress test for global markets as risk appetite fractures
Global markets are sending a clear and uncomfortable signal. Stocks are selling off across major indices. Cryptocurrencies are falling faster and with greater volatility. Gold, meanwhile, is moving higher, absorbing capital that is actively exiting risk assets.
This divergence is not a short-term anomaly or a technical coincidence. It reflects a deeper shift in how investors are interpreting policy risk, liquidity conditions, and the durability of the current market regime. When equities and crypto fall together while gold rises, markets are not simply reacting to bad news. They are reassessing assumptions about stability, correlation, and protection.
Over the past several sessions, the alignment has been striking. U.S. equities recorded one of their sharpest single-day declines in months. Bitcoin slipped below key psychological levels, underperforming stocks on a relative basis. Crypto-linked equities, including miners and exchanges, sold off aggressively. At the same time, gold rallied to fresh highs, reinforcing its role as the preferred hedge during moments of macro uncertainty.
This pattern matters because it reveals how capital behaves when confidence weakens. Investors are not rotating within risk assets. They are exiting risk altogether. That distinction is critical.
The question now is not whether markets will remain volatile. Volatility is already here. The real question is whether this divergence marks a temporary stress episode or the early stages of a broader regime shift that could define asset performance for months ahead.
To answer that, we need to unpack what triggered this move, why stocks and crypto fell together, why gold diverged, and what the next set of outcomes could realistically look like.
The Trigger: Policy Shock Meets Fragile Positioning
Market selloffs rarely happen in a vacuum. They occur when a catalyst collides with vulnerability. In this case, renewed tariff threats from the U.S. administration acted as the spark, but the fire was already waiting.
The immediate trigger was a sharp escalation in trade rhetoric directed at several European economies, tied to broader geopolitical tensions. While tariff threats themselves are not new, the timing and tone mattered. Markets were already navigating a delicate balance between slowing growth, uncertain monetary policy, and elevated valuations across both equities and crypto assets.
In that environment, policy surprises carry outsized impact. Tariffs introduce multiple layers of uncertainty at once. They raise the risk of higher inflation by increasing import costs. They threaten growth by disrupting trade flows and corporate planning. And they complicate central bank decision-making by pulling inflation and growth in opposite directions.
This combination is particularly damaging for risk assets. Equities depend on earnings visibility and stable discount rates. Cryptocurrencies depend on liquidity, confidence, and speculative capital. Tariff-driven uncertainty undermines all three simultaneously.
What made the reaction sharper was positioning. Many investors entered this period with expectations of policy normalization, easing financial conditions, and continued institutional inflows. Instead, they were confronted with a reminder that geopolitical risk remains unresolved and unpredictable.
As a result, selling cascaded quickly. Equity markets repriced growth assumptions. Crypto markets, which tend to amplify moves due to leverage and thinner liquidity, experienced accelerated downside. Gold, by contrast, benefited immediately as capital sought assets perceived as insulated from policy missteps.
The key takeaway is that this was not a random selloff. It was a policy shock hitting markets that were already stretched and sensitive to disappointment.
Why Stocks and Crypto Fell Together
1. Risk assets now share the same liquidity backbone
One of the most important changes in modern markets is the increasing integration of cryptocurrencies into the traditional financial system. Bitcoin and major digital assets no longer operate on the fringes of global capital markets. They are embedded within them.
Over the past several years, institutional adoption has transformed crypto’s market structure. Spot ETFs, regulated custody solutions, derivatives markets, and prime brokerage services have brought crypto exposure into the same portfolios that hold equities, bonds, and commodities. As a result, crypto now responds to many of the same liquidity forces that drive stock prices.
When liquidity is abundant and risk appetite is strong, this integration works in crypto’s favor. Capital flows freely. Correlations compress. Prices rise together. But when liquidity tightens or uncertainty increases, the same integration becomes a vulnerability.
During this recent selloff, equities and crypto moved lower in tandem because they are drawing from the same pool of global risk capital. When investors de-risk, they reduce exposure across the entire risk spectrum. Crypto, with its higher volatility and leverage, often absorbs the largest impact.
This is why Bitcoin’s decline mirrored equity weakness rather than offsetting it. Crypto did not serve as a hedge. It behaved as a high-beta extension of the same risk trade.
Understanding this shift is essential. The idea that crypto automatically diversifies equity risk is outdated in the short term. In stress environments, correlation rises, not falls.
2. Tariffs revive inflation and growth fears at the same time
Tariffs are uniquely destabilizing because they attack markets from two directions. On one hand, they introduce inflationary pressure by raising the cost of imported goods and disrupting supply chains. On the other hand, they suppress growth by increasing uncertainty, reducing trade volumes, and discouraging investment.
For equities, this creates a valuation problem. Higher inflation pushes interest rates higher or delays rate cuts, increasing discount rates. Slower growth reduces earnings expectations. Together, they compress multiples and pressure prices.
For crypto, the impact is different but equally damaging. Crypto assets thrive in environments of expanding liquidity and speculative confidence. When tariffs threaten growth and complicate monetary policy, liquidity expectations weaken. Investors become more selective. Risk tolerance declines.
This dual effect explains why both markets sold off simultaneously. Investors were not choosing between stocks and crypto. They were choosing whether to remain exposed to risk at all.
Gold, by contrast, benefits from this exact setup. It does not depend on growth. It does not generate cash flows that need to be discounted. It thrives when inflation risk rises and confidence in policy coordination weakens.
3. Crypto-Specific Fragility Amplified the Move
While macro forces triggered the initial wave of selling, crypto’s internal market structure significantly intensified the downside. This was not a random or isolated breakdown. It reflected a market that had become structurally fragile beneath the surface, even as headline prices appeared stable.
In the weeks leading into the selloff, several warning signs were already present. Bitcoin and major altcoins had recently tested or exceeded prior highs, inviting profit-taking from early entrants and long-term holders. Momentum slowed, but positioning did not adjust accordingly. Derivatives markets remained heavily skewed toward long exposure, particularly in perpetual futures. Funding rates signaled optimism that had not yet been validated by fresh inflows.
At the same time, retail participation had thinned. Spot volumes declined relative to prior rallies, suggesting that price action relied increasingly on institutional flows and leveraged positioning rather than broad-based demand. This matters because institutional flows tend to be episodic, not continuous. When they pause or reverse, markets lose a critical stabilizing force.
Once prices began to slip, leverage became the accelerant. Liquidations triggered mechanically as margin thresholds were breached. Forced selling added pressure regardless of fundamentals or longer-term conviction. Support levels failed more rapidly than in equity markets, where circuit breakers, passive flows, and diversified ownership structures slow declines.
Crypto markets remain reflexive by design. Price declines trigger liquidations, liquidations trigger further declines, and feedback loops emerge quickly. This reflexivity has diminished over time but has not disappeared. Even as infrastructure matures and institutional participation grows, leverage remains deeply embedded in market behavior.
This dynamic does not imply that crypto is inherently unstable. It does mean that volatility amplification remains a defining risk characteristic. In moments of macro stress, crypto often absorbs pressure faster and more violently than traditional assets. Understanding this mechanical reality is essential for interpreting price moves without overreacting to them.
Why Gold Stayed Green While Everything Else Turned Red
Gold Responds to Policy Credibility Risk, Not Momentum
Gold’s resilience during this selloff had little to do with technical patterns or speculative enthusiasm. It reflected a deeper function that gold has served for centuries. Gold responds to credibility risk in policy and governance, not to short-term momentum or earnings expectations.
Tariff threats strike at the foundation of global economic coordination. They introduce uncertainty into trade relationships, supply chains, and inflation management. When investors sense that policy direction may become unpredictable or confrontational, they seek assets that sit outside the policy framework entirely.
Gold fits that role uniquely. It carries no counterparty risk. It does not depend on corporate profits, growth forecasts, or monetary accommodation. It is not issued by any government and cannot be diluted by policy decisions. It exists independently of the systems that are being questioned.
In moments when investors reassess trust rather than chase returns, gold becomes the first destination for defensive capital. This explains why gold often rises not during recessions themselves, but during periods when confidence in decision-making erodes.
Importantly, gold’s strength does not require a crisis narrative. It does not rely on fear alone. It benefits from uncertainty, ambiguity, and policy friction. That is precisely the environment created by escalating tariff rhetoric and geopolitical tension.
This distinction helps explain why gold can rise even as equities and crypto fall together. Stocks and digital assets remain embedded within the economic system. Gold stands apart from it.
Central Bank Behavior Reinforces Gold’s Role
Another powerful force supporting gold is sustained central bank demand. Over the past several years, central banks have accumulated gold at some of the fastest rates seen in decades. This behavior is deliberate and strategic, not reactive.
Central banks buy gold to diversify reserves, reduce exposure to any single currency, and hedge against geopolitical fragmentation. These motivations align closely with the current global environment, where economic blocs are becoming more fragmented and policy coordination is less certain.
Unlike speculative flows, central bank buying creates a steady, price-insensitive bid. These institutions are not trading volatility. They are managing long-term reserve stability. As a result, gold prices benefit from structural support even when broader markets experience stress.
This contrasts sharply with crypto markets, where flows remain more cyclical and sentiment-driven. While institutional crypto adoption has grown, it has not yet reached the level of strategic reserve allocation that gold enjoys.
The difference matters. Structural demand dampens volatility and anchors confidence. Cyclical demand amplifies moves in both directions.
The Digital Gold Narrative Failed Another Real-Time Test
Bitcoin is frequently described as digital gold, but this episode highlights an important and often misunderstood distinction. In moments of acute macro stress, Bitcoin still behaves like a high-beta risk asset rather than a defensive hedge.
That observation does not undermine Bitcoin’s long-term thesis as a scarce digital asset. It does not negate its potential role in a future monetary system. What it does clarify is Bitcoin’s current position in the market hierarchy.
Bitcoin remains highly sensitive to liquidity conditions, risk appetite, and policy expectations. When uncertainty rises sharply and capital prioritizes preservation over opportunity, Bitcoin tends to fall alongside equities rather than diverge from them.
Gold does not require belief or narrative reinforcement. Its role as a store of value is deeply institutionalized. Bitcoin’s role is still evolving. It attracts capital during periods of monetary expansion and confidence. It struggles when liquidity tightens and policy uncertainty rises.
This does not mean the digital gold thesis is invalid. It means it is incomplete. Bitcoin may serve as a long-term hedge against monetary debasement, but it has not yet proven itself as a short-term hedge against geopolitical or policy shocks.
Recognizing this distinction helps investors avoid misplaced expectations. It allows Bitcoin to be evaluated on its actual behavior rather than aspirational comparisons.
What Search Data and Market Behavior Are Telling Us
Search behavior offers a valuable window into investor psychology. At present, the dominant queries are not about upside targets or breakout predictions. They focus on explanation, causality, and risk assessment.
People are searching for why markets are moving together, why traditional hedges are diverging, and whether current conditions signal something more systemic. This shift in attention is meaningful.
It suggests that uncertainty, not greed, is driving engagement. Investors are not rushing to deploy capital. They are pausing to understand the environment. This behavior typically appears during reassessment phases rather than panic phases.
Market behavior reinforces this interpretation. While prices have fallen, there has been no widespread disorder. Liquidity remains intact. Credit markets have not seized. Volatility has risen, but not uncontrollably.
This combination of elevated concern and controlled behavior points to a market that is re-pricing risk rather than collapsing under it. In such environments, clear and disciplined analysis carries more value than bold forecasts.
For content creators and analysts, this moment rewards clarity over confidence and explanation over speculation.
What Happens Next?
Base Case: Volatility Persists, Leadership Remains Defensive
The most likely scenario is one of continued volatility without systemic crisis. Equities may stabilize but struggle to regain leadership. Crypto may remain under relative pressure as leverage resets and confidence rebuilds. Gold is likely to hold gains as long as policy uncertainty remains unresolved.
This environment favors patience and balance. It does not reward aggressive directional bets.
Downside Risk Case: Escalation and Liquidity Stress
If tariff rhetoric escalates into concrete policy actions, downside risks increase materially. Growth expectations would weaken. Inflation risk could rise. Central banks could face constrained policy choices.
In this scenario, risk assets could reprice lower in a more disorderly fashion. Crypto would likely underperform due to leverage sensitivity. Gold would benefit disproportionately as capital seeks insulation from systemic risk.
Upside Recovery Case: De-Escalation and Clarity
If tensions ease and policy signals stabilize, markets could recover. Equities may rebound selectively. Crypto could recover faster due to higher beta. Gold may consolidate rather than reverse sharply.
This outcome requires clarity, not optimism. Markets respond to reduced uncertainty more than to positive headlines.
What This Means for Investors
This environment does not reward impulsive decisions. It rewards understanding.
Investors should focus on correlation risk, liquidity sensitivity, time horizon alignment, and exposure sizing. This is a moment to reassess assumptions, not to double down on narratives.
Markets are signaling caution, not catastrophe. Those who listen carefully will be better positioned for whatever comes next.
FAQs
1. Why are stocks and crypto falling together? Stocks and cryptocurrencies are both sensitive to global liquidity, risk appetite, and policy expectations. When uncertainty rises around trade, geopolitics, or interest rates, investors reduce exposure to assets tied to growth and confidence. This causes correlations to rise. In these moments, diversification breaks down temporarily as capital moves away from risk across markets at the same time.
2. Why is gold rising while other assets fall? Gold tends to benefit when investors question policy credibility, geopolitical stability, or fiscal discipline. It carries no credit risk and does not rely on earnings or growth assumptions. Central bank accumulation also provides structural support. These factors make gold a preferred destination for defensive capital when uncertainty increases and confidence in risk assets weakens.
3. Is Bitcoin failing as an asset? No. Bitcoin is not failing, but it is behaving according to its current role in markets. In periods of stress, Bitcoin still trades like a high-beta risk asset rather than a safe haven. This does not invalidate its long-term scarcity thesis. It highlights that Bitcoin remains sensitive to liquidity conditions and investor confidence in the short to medium term.
4. Does this mean the digital gold narrative is wrong? The digital gold narrative is incomplete rather than wrong. Bitcoin may serve as a long-term hedge against monetary debasement, but it has not yet proven itself as a short-term hedge during geopolitical or policy-driven shocks. Gold has centuries of institutional trust, while Bitcoin’s role is still evolving within the global financial system.
5. Are markets signaling an upcoming crisis? At this stage, markets are signaling reassessment, not crisis. Liquidity remains functional, and there is no evidence of systemic breakdown. Volatility has increased, but price action reflects caution rather than panic. Investors are repricing risk and waiting for clearer policy signals before committing capital, which is typical during transitional phases.
6. What role is policy uncertainty playing in this selloff? Policy uncertainty is a central driver. Tariff threats, geopolitical tensions, and unclear monetary direction introduce unpredictability into growth and inflation expectations. Markets dislike ambiguity more than bad news. When policy signals lack clarity or consistency, investors reduce risk exposure until they gain better visibility into potential outcomes.
7. Why does crypto fall faster than equities during stress? Crypto markets still contain higher leverage and more reflexive mechanics than equity markets. When prices decline, liquidations can accelerate moves mechanically. Retail participation is also more volatile. These factors cause crypto to absorb shocks faster and more aggressively, even as institutional participation continues to grow.
8. Should investors expect continued volatility? Yes, continued volatility is likely until policy clarity improves. Markets are sensitive to headlines, macro data, and geopolitical developments. Until uncertainty fades or stabilizes, price swings across equities, crypto, and commodities may persist. Volatility does not imply collapse, but it does require disciplined risk management and patience.
9. What indicators matter most right now? Investors should focus on policy developments, interest rate expectations, inflation data, and cross-asset correlations. Gold behavior relative to equities, crypto performance versus stocks, and liquidity conditions offer more insight than short-term price targets. These indicators help assess whether markets are stabilizing or preparing for further repricing.
10. How should long-term investors approach this environment? Long-term investors should prioritize balance, position sizing, and time horizon alignment. This is a moment to reassess assumptions rather than chase narratives. Avoid overreacting to short-term moves. Markets are recalibrating, not resetting. Those who focus on fundamentals, risk control, and patience are better positioned for the next phase.
The Bottom Line
Markets are not broken. They are recalibrating.
What we are witnessing is not a systemic failure or a loss of control. It is a repricing of risk in response to rising uncertainty. When stocks and cryptocurrencies bleed red while gold stays green, markets are sending a clear message about where confidence stands. Capital is not chasing opportunity. It is prioritizing protection.
This shift reflects a change in investor psychology rather than panic. Participants are reassessing assumptions that had quietly become embedded during periods of stability and liquidity. Trade policy uncertainty, geopolitical friction, and questions around monetary direction have introduced enough ambiguity to warrant caution. In response, investors are reducing exposure to assets that depend on growth, liquidity, and confidence, and reallocating toward assets that offer insulation from policy risk.
Importantly, this behavior does not signal the end of the cycle. It signals a pause. Markets often move in phases where risk is priced aggressively, then reassessed, then selectively re-embraced. The current phase is one of reassessment. Investors are waiting for clearer signals before committing fresh capital.
What happens next will depend far less on short-term chart patterns and far more on policy behavior and communication. Markets are listening closely to governments, central banks, and geopolitical developments. Clarity can stabilize sentiment. Escalation can deepen caution.
For now, the message is unmistakable. When uncertainty rises, protection comes first. Growth opportunities do not disappear, but they take a back seat until confidence is rebuilt.
Solana Mobile has launched an airdrop of its native token, SKR, opening claims to users of its Seeker smartphone and select developers active in its decentralized app ecosystem.
Key Takeaways:
Solana Mobile launched a 90-day SKR airdrop for Seeker phone users and early dApp developers.
SKR underpins governance and incentives, with 30% of its 10 billion supply allocated at launch.
The airdrop coincides with Seeker’s Season 2 expansion across DeFi, gaming, and payments.
In a statement released Tuesday, Solana Mobile said the airdrop reflects its broader vision of user ownership in mobile platforms.
“Seeker and SKR are a bet that there’s another way for mobile: that the people who use the network should own the network,” the company said, adding that more than 100,000 users are eligible to claim tokens.
Solana Mobile Opens 90-Day SKR Airdrop Claims for Seeker Users
Owners of the Seeker phone can claim their allocation directly through the device’s built-in wallet.
The claim window is set at 90 days, after which any unclaimed tokens will be returned to the airdrop pool, according to the announcement.
Eligibility also extends beyond hardware users. Developers who launched what Solana Mobile described as “quality apps” on the Solana dApp Store during Season 1 are included in the distribution, underscoring the company’s push to reward early ecosystem contributors.
SKR is positioned as the core asset underpinning governance, incentives, and economic activity across the Solana Mobile ecosystem.
Got your SKR? Put it to work.
Stake on Seeker: 1. Open Seed Vault Wallet 2. Go to SKR Staking 3. Choose your amount 4. Stake to earn SKR rewards
The token has a fixed supply of 10 billion units, with 30% allocated to airdrops and unlocks at launch.
Solana Mobile said this structure is intended to prioritize early participation while maintaining long-term issuance controls.
Airdrop recipients are being encouraged to stake their SKR tokens. According to the project’s documentation, inflation events occur every 48 hours under a linear schedule that starts with 10% annual inflation.
That rate is designed to decline by 25% each year until it reaches 2%, at which point inflation will remain constant.
The token launch coincides with the rollout of Seeker’s Season 2 campaign, which introduces new apps, rewards, and early-access programs.
Focus areas include decentralized finance, gaming, payments, trading, and decentralized physical infrastructure networks (DePIN).
The Solana Seeker includes a Genesis NFT providing owners access to future airdrops, exclusive content, and reward programs, with particular focus on the planned native ecosystem token, SKR.
SKR represents the native ecosystem token for Solana mobile devices, operating on Solana’s layer-1 blockchain and expected to be “airdropped directly to builders and users for ecosystem participation.”
According to CoinGecko data, SKR was trading at $0.01062 at the time of publication, up 54% over the past 24 hours.
Trove Markets’ new token collapsed almost immediately after trading began, wiping out the vast majority of early gains and leaving many backers angry and confused. The drop was brutal. Traders who bought early watched their holdings shrink by about 95% in a matter of hours.
Token Price Plunges After Launch
Initial prices implied a market value near $20 million. Based on reports, the token fell to roughly $0.0008 per unit, trimming the market cap to below $1–2 million.
Some wallets unloaded huge chunks of coins right after the token generation event. That selling pressure coincided with a flood of posts on social platforms calling the launch a rug pull.
Trove Had Raised Millions Before The Fall
According to reports, the project raised roughly $11.5 million in its public sale. The Trove team announced it would keep about $9.4 million to fund further work and pay for a switch of blockchains.
Refunds totaling about $2.44 million were returned to some investors, and another $100,000 was earmarked for additional reimbursements. The numbers left many buyers feeling shortchanged and asking why a large share of the money stayed with the team.
Team Keeps Majority Of Funds
On-chain analysts and tracing tools flagged unusual transfers tied to a handful of new accounts. Reports note that a meaningful slice of the token supply moved into one cluster of wallets, and some transfers were routed through services like ChangeHero.
That activity raised questions about whether all token allocations were handled openly. Legal calls and demands for public audits followed soon after.
Investors reacted quickly. Some demanded full refunds. Others threatened legal steps. Community moderators and influencers amplified complaints and demanded clear timelines for fixes.
We’re pivoting Trove to Solana.
After recent sentiment around Trove, the liquidity partner that had been supporting our Hyperliquid path chose to unwind their 500k $HYPE position. That was their decision and we fully respect it.
Trove posted updates, saying a partner had pulled out and that the pivot to Solana was necessary to keep the project alive.
The team promised to continue building and to be more open about their choices, while pledging to deliver a working platform that might justify holding the funds.
What happens next will matter more than the words now being exchanged. If the team can show tangible progress on the exchange and create real trading depth, some anger may fade.
If not, the episode could be used as a warning: token sales that change terms late in the process can trigger swift market punishment and reputational damage. Regulatory scrutiny could also increase if large sums are held after a collapse like this.
Featured image from Unsplash, chart from TradingView
If you are anything like me, you believe in the long-term future of crypto. That does not change the fact that prices for XRP, Cardano, and Shiba Inu do not look great at the moment.
These dips across the market were triggered by Bitcoin dropping back toward $90,000 after getting rejected near the $98,000 level.
Fundamentally, these coins are improving over time. Technically, though, the market is going through one of its weakest phases, with every rally getting shut down at key resistance levels. Below is how things could play out as we head into 2026.
Bitcoin (BTC)
24h7d30d1yAll time
XRP Price Prediction: How Far Could the Downtrend Continue Amid Risk-Off Mood
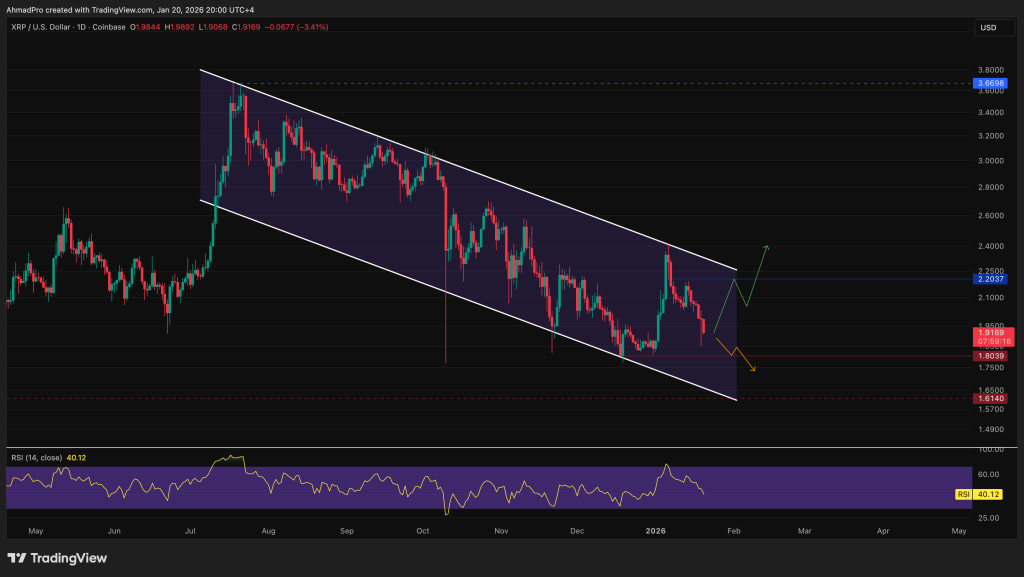
Gold price is currently retesting its all-time high as risk assets like stocks and crypto continue to dump.
This shows it is not just a crypto problem. Investors are rotating into safe-haven assets like gold to protect capital amid growing uncertainty tied to tariffs and ongoing Greenland talks.
After a strong start to the year, the XRP rally stalled at the $2.50 resistance level and has since slipped back into a downtrend.
At the time of writing, XRP is trading around $1.90 and moving toward $1.80, which has acted as the main support level over the past 12 months. A clean loss of this area would likely open the door for a deeper correction toward the lower end of the downtrend channel near $1.61.
RSI is still leaning bearish at 41. If bulls manage to regain momentum and spark a bounce, the next immediate resistance sits at $2.20. Buyers would need to push XRP back above the downtrend line to signal a potential trend change.
Cardano Price Prediction: $0.33 Support Is “Last Man Standing.”
ADA is no stranger to a downtrend, having spent most of 2025 struggling and losing over 65% of its value. After a bounce toward $0.40, the ADA price was rejected and is now slipping again toward new lows.
ADAUSD is currently moving toward the $0.33 support level. If price manages to bounce there, the first step in the right direction for ADA would be reclaiming the $0.40 level.
RSI is sitting around 40 and has not signaled oversold conditions yet. ADA needs stronger momentum, and buyers must defend the $0.33 support. Otherwise, price could slide toward the October 10 low near $0.27.
Shiba Inu Price Prediction: Is The Memecoin Rally Done?
Risk-off mode means the riskiest assets tend to suffer the most. That is exactly what is happening to memecoins, especially with Shiba Inu price action right now.
Yes, it is that bad. SHIBUSD is now potentially retracing the entire early-year rally. Momentum is fading, with RSI sitting at 41, leaning bearish and not yet oversold.
There is likely more downside ahead if SHIB loses the $0.0000068 support, which marked the lowest level even when memecoin interest was almost nonexistent throughout 2025.
A break above the trendline near $0.0000094 would be the first step toward confirming a bullish shift. Otherwise, SHIB is likely to continue ranging lower.
What About Maxi Doge ($MAXI), Could It Save Memecoins?
When the market flips full risk-off and majors like XRP, ADA, and SHIB are stuck grinding lower, history shows one thing clearly: speculative capital does not disappear; it relocates.
MAXI is built for moments like this. It is not trying to fix crypto or sell a long-term infrastructure story. It is a pure memecoin designed for volatility, momentum, and sentiment-driven moves, which is exactly where traders rotate when large caps lose direction.
As confidence fades in established names, smaller, earlier-stage memecoins often attract attention because they offer asymmetric upside. Maxi Doge sits right in that zone, early in its lifecycle, highly speculative, and priced for percentage moves rather than slow recoveries.
What separates MAXI from most meme launches is the staking layer. Holders can stake MAXI for daily smart-contract rewards, with current APY sitting around 70%, giving traders a yield angle while waiting for sentiment to flip.
With the broader market weak and fear building, Maxi Doge is positioning itself as a high-risk, high-upside play for traders willing to front-run the next shift in memecoin momentum heading into 2026.
XRP’s next big rise could come with hardly any warning, traders and analysts warn. Markets are quiet now. That quiet has happened before, and it has sometimes been followed by sharp moves that catch most people off guard.
History Of Sudden Moves
According to several community analysts, XRP has a pattern of long quiet periods followed by fast spikes. It rarely creeps steadily upward for weeks before a charge. Instead, price often treads water, people lose faith, and then momentum arrives quickly.
That behavior has left many short-term traders on the sidelines when runs happen. A move looks obvious only after it is already well under way.
Legal Overhang Gone
Reports say the SEC lawsuit changed XRP’s timing for years. While other tokens took part in big market swings, XRP traded under heavy regulatory pressure. That pressure is now removed.
The major $XRP breakout will come when many least expect it. Its always a “catch-off-guard” move.. but we’re prepared.
The market has since been allowed to price XRP without that cloud. In late 2024, a notable rally began after US President Donald Trump’s win and the exit of SEC Chair Gary Gensler. Momentum pushed XRP from roughly $0.50 to above $3 in a matter of weeks. But the gains were followed by a long reset.
Exposure Beats Perfect Timing
According to a number of commentators, being already invested matters more than hitting the exact bottom. When the price starts to climb fast, buyers who jump in late often pay too much and panic-sell when the heat fades.
Early holders tend to capture most of the upside. Reports note this has repeated across multiple cycles. Emotion drives late entry; calm positioning often wins.
At the time of writing, XRP was trading near $1.93, down about 4% on the day and roughly 55% below its recent high. Many who bought above $3 over the past year have cut losses or reduced positions, which has left sentiment thin.
On Quick Inflows & Short-Term Squeeze
Liquidity in key ranges is lighter than traders might assume. Volume patterns and derivatives flows will matter if price begins to move again.
An array of factors could start the run — quick inflows, a shift in macro appetite, or a big buyer showing up. On-chain signs, exchange flows, and futures positioning would give clearer clues, but those signals can flip fast.
Featured image from Unsplash, chart from TradingView
The Optimism Foundation’s proposal for a token buyback goes to a vote on January 22, 2026.
OP price has fallen sharply over the past year, and sentiment is largely bearish.
The buyback could catalyze gains, with OP eyeing $0.52-$0.75.
Optimism’s OP token changed hands around $0.30 on Tuesday, January 20, 2026, slightly up in the past 24 hours as the community edges towards a key governance vote.
But having traded to intraday highs of $0.37 last week, the token’s dip to current levels risks allowing for a pullback to all-time lows of $0.25 reached in December.
Can Optimism Foundation’s plans for a buyback program that commits Superchain revenue to monthly OP purchases bolster bulls?
Optimism buyback details and implications
Optimism is set for a governance vote on January 22, 2026, following a proposal floated earlier this month.
The Optimism Foundation wants community approval to allocate half of the sequencer fees for open-market buybacks of OP.
A proposal for the next chapter of Optimism 🔴
The Optimism Foundation is putting forward a proposal to align the OP token with growing Superchain demand by directing 50% of incoming Superchain revenue to regular OP buybacks https://t.co/VSDazlbRdXpic.twitter.com/jBQoJyxDCF
If the vote passes, the program will start in February, with 50% of Superchain revenue flowing to Optimism. Repurchases are set to occur over the next year.
The remaining 50% funds will be allocated to ecosystem grants, maintaining flexibility.
As with other models, such as dYdX’s 75% fee buybacks, Optimism aims to buy from the market. However, the tokens go back to the OP treasury rather than direct burns.
If the latter happens, supply reduction will signal confidence in OP and Superchain’s dominance.
“With this buyback mechanism, OP transitions from a pure governance token to a token that is tightly aligned with the growth of the Superchain,” Optimism wrote at the time.
The mechanism targets every enterprise that creates a new chain on the Superchain, with these expected to add to the underlying demand for OP.
OP token price forecast
The Optimism (OP) price is down nearly 94% from its peak of $4.85 reached in March 2024. The downtrend has crushed holder sentiment, and despite the buyback proposal, the outlook is largely bearish.
Bears may hold this advantage unless Optimism for instance, burns the repurchased tokens. BNB’s quarterly burns have helped the token’s price storm to new highs.
In the short term, a post-vote rally could push prices to $0.52.
ONDO has lost over 65% of its value since October as heavy selling pressure continues to dominate the altcoin market. While Bitcoin has shown relative stability at key levels, many mid-cap tokens like ONDO have struggled to find consistent demand. This drawdown has pushed sentiment toward the bearish side, especially as traders remain cautious around liquidity events and token unlocks.
Still, some analysts argue that the current dip is not purely a sign of weakness. A CryptoQuant report explains that the headlines may scream “price drop,” but the on-chain data is pointing toward “opportunity” instead. The focus is now on ONDO’s massive 1.94 billion token unlock scheduled for January 18, 2026. Historically, unlocks can trigger panic selling, as investors anticipate higher circulating supply and additional distribution pressure.
However, this time may be different. The report suggests that larger market participants are actively positioning through the decline, using the fear as a liquidity window. Rather than treating the unlock as a reason to exit, the data hints that “smart money” is stepping in to absorb supply while retail confidence remains fragile. That sets the stage for a critical test.
Smart Money Absorption Signals Are Building
The CryptoQuant report outlines why larger investors appear to be ignoring the noise around ONDO’s decline. The first signal is the “whale shield.” Despite the sharp correction since the December 2024 peak, Spot Average Order Size continues to be dominated by “Big Whale Orders,” shown through consistent green dots on the chart. This implies institutions are using weakness to absorb liquidity, with the $0.35–$0.40 zone acting as a primary accumulation range.
Second, ONDO has officially entered a Taker Buy Dominant phase. The 90-day Cumulative Volume Delta (CVD) remains positive and continues rising, showing that market buy pressure has outweighed market sells for months. This is important because takers represent aggressive participants who buy at the ask without waiting for better entries.
The report frames this alignment as “taker alpha.” When large whale orders and aggressive taker buying strengthen while the price falls, it often reflects absorption. If this continues through the unlock, ONDO could be building a coiled-spring setup for a 2026 RWA breakout.
ONDO Extends Downtrend as Bulls Defend Key Demand Zone
ONDO remains under heavy pressure after a prolonged decline that has erased most of its 2025 upside. The 3-day chart shows a clear breakdown from the former consolidation range near $0.90–$1.00, where price repeatedly failed to reclaim momentum during the second half of the year. Once sellers forced a decisive move lower, the market quickly transitioned into a steep downtrend marked by weak bounces and consistent lower highs.
At the time of writing, ONDO is trading near $0.33 after slipping below the $0.40 handle, a psychological level that previously acted as temporary support. This drop places the token deep below its key moving averages, with the shorter trend lines rolling over and acting as overhead resistance. The failed recovery attempts throughout late 2025 confirm that sellers have stayed in control, while buyers have struggled to generate enough volume to shift the trend.
However, price is now approaching a potential demand zone around $0.30–$0.35, where volatility historically increases and dip buyers may try to step in. If this area fails, the chart suggests downside could accelerate. Still, a strong defense could open the door for a stabilization phase before any meaningful rebound.
Featured image from ChatGPT, chart from TradingView.com
Upon Trump’s tariff threats to Europe, Bitcoin price dumped around 2% to below $93,000, leading to deeper corrections across coins like XRP, Cardano, and Bitcoin Hyper.
These three remain among the strongest picks in the market right now.
XRP and Cardano have yet to see a true breakout rally and are still down over 50% from their all-time highs. Bitcoin Hyper, meanwhile, is being viewed as a high-potential project heading into 2026.
Bitcoin (BTC)
24h7d30d1yAll time
XRP Price Prediction: Breaking Under $2.00 Tests Bulls
Ripple clearly saw where the market was heading and went all in on stablecoins. Its RLUSD stablecoin alone grew to over a $1.3B market cap in 2025, which is no small feat.
That steady stablecoin adoption, paired with improving regulatory clarity and continued ETF inflows, is giving XRP a real edge going into what could be a strong year ahead.
XRP price is back under $2 again, and it is sparking concern. A leading technical indicator, the RSI, is sitting around 33, signaling bearish momentum.
If the XRP chart fails to reclaim the $2.00 level, a retest toward the 18-month support around $1.80 could happen.
The $2.10 and $2.19 zones are the nearest potential resistance levels if a bounce from the current price near $1.97 occurs. A clean breakout above $2.10 would invalidate the bearish case.
Cardano Price Prediction: $0.40 Breakdown Puts Focus Back on Range Lows
Hoskinson’s “locking in” does not seem to be helping much, as Cardano is slipping back under $0.40 again.
However, the Cardano founder recently provided a more encouraging outlook on Cardano’s development and growth, predicting that the layer-one network could see “huge growth” in its DeFi ecosystem.
ADA’s price was moving quite well after bouncing from the range low, before the downtrend started again. It is currently being dragged down toward the $0.36 level.
If the correction continues, the price could revisit the $0.33 range low again, where it has bounced from before.
To invalidate this bearish case, ADA price needs a sustained breakout above the $0.40 level and a clear shift in momentum, as the current RSI is around 32, signaling bearish conditions.
While majors like XRP and Cardano are grinding through corrective phases, some traders are shifting toward higher-beta plays that react more aggressively to Bitcoin moves. That is where Bitcoin Hyper comes into focus.
Bitcoin Hyper is built as a Bitcoin-linked momentum project, designed to amplify market moves rather than compete with Bitcoin itself. When BTC volatility picks up, projects like HYPER tend to attract speculative capital looking for faster percentage moves.
With Bitcoin pulling back on macro uncertainty and traders positioning for the next leg, rotation into higher-risk, higher-reward setups is already starting. That environment historically favors projects tied directly to Bitcoin sentiment.
Bitcoin Hyper has already gained traction early, raising strong interest from traders positioning ahead of the broader market recovery. The project has already raised $30.80 million in record time, with early investors jumping in before momentum hits full speed.
For traders looking beyond large caps and into more aggressive Bitcoin-linked exposure heading into 2026, Bitcoin Hyper remains one of the names getting early attention.
The Pi Coin price has slumped by 8% in the past 24 hours, with its fall to $0.188 coming as the crypto market as a whole suffers a 2.5% drop today.
PI is now down by 9% in a week and by 11% in a month, while the altcoin has suffered a catastrophic 93.7% collapse since reaching its ATH of $2.99 on February 26.
However, as bad as things are right now, PI has bottomed out in the past day, providing a very strong signal that it could begin a reversal.
And with the token having one of the biggest communities of any alt, there remains a good chance that the Pi Coin price prediction could turn positive very soon.
Pi Coin Price Prediction: Down 90% and Volume Collapsing – But Is This Exactly Where the Reversal Begins?
If we look at PI’s chart today, we see that its indicators have hit steep lows.
This is particularly the case with its relative strength index (yellow), which has plunged to 11.5, its lowest level in a year.
Its MACD has also turned distinctly negative in the past few days, and judging by other dips in recent months, it may have to sink lower before the Pi Coin price begins a concerted recovery.
Indeed, one particularly notable feature of the chart above is that PI has been trading within a steadily declining band since reaching $1.24 in May of last year.
And at the moment, its price is actually above this band, implying that it may fall back within this range before any rebound begins.
On a more positive note, previous steep falls did lead to noticeable rebounds, as we saw in October, when the Pi Coin price reached $0.289
We could therefore see something similar happen within the next few weeks, with PI’s next medium-term target being $0.35.
Longer term, much will depend on the organic growth of Pi Network as a platform, as well as on the possibility of new exchange listings (e.g. on Binance or Coinbase).
To be fair, the Pi Network does roll out regular updates and new features, making the platform more efficient for users and developers alike.
It therefore has the foundation for greater use and uptake, and longer term it could end the year above $1 or $1.50.
AI Content Platform SUBBD Has Raised $1.45 Million in Its Presale: How to Buy
If traders remain unimpressed with PI, they may prefer to look into newer alternatives, including presale coins.
Presale coins can present good opportunities for diversification, since the biggest and best presale tokens can go on to rally strongly when they list for the first time.
It has so far raised just over $1.45 million in this sale, a sign that interest in the token is beginning to grow.
And what is interesting about SUBBD is that it will launch an adult content creation platform, one which will harness artificial intelligence (and crypto) to provide creators with a much better experience.
Its platform will feature AI tools creators can use to generate ideas, content and also AI agents, who will star in their posts and help them earn money.
And with SUBD running on the Ethereum blockchain, payouts will be transparent and instantaneous, making it a fairer platform than many of its rivals.
These features help to explain why the presale for SUBBD is gaining steam, with the coin necessary to pay for subscriptions and content on the platform.
It could therefore attract substantial demand, with investors able to buy it early by going to the official SUBBD website.