Normal view

There are new articles available, click to refresh the page.
Today — 11 December 2025NewsBTC

Dogecoin Price Volatility Returns as Market Weighs Bullish Indicators Against Recent Dip

11 December 2025 at 11:30

The Dogecoin price has entered another period of volatility as traders attempt to weigh improving technical signals against renewed short-term weakness. The memecoin has been shifting between modest recoveries and sudden pullbacks, creating a landscape where both bullish and bearish narratives remain active.

With macro uncertainty, DOGE ETF inflows, exchange outflows, and key chart patterns emerging at the same time, the market is now deciding which direction will dominate heading into late December.

Dogecoin DOGE DOGEUSD_2025-12-11_12-52-13

Mixed Trading Conditions Shape Short-Term Direction for Dogecoin

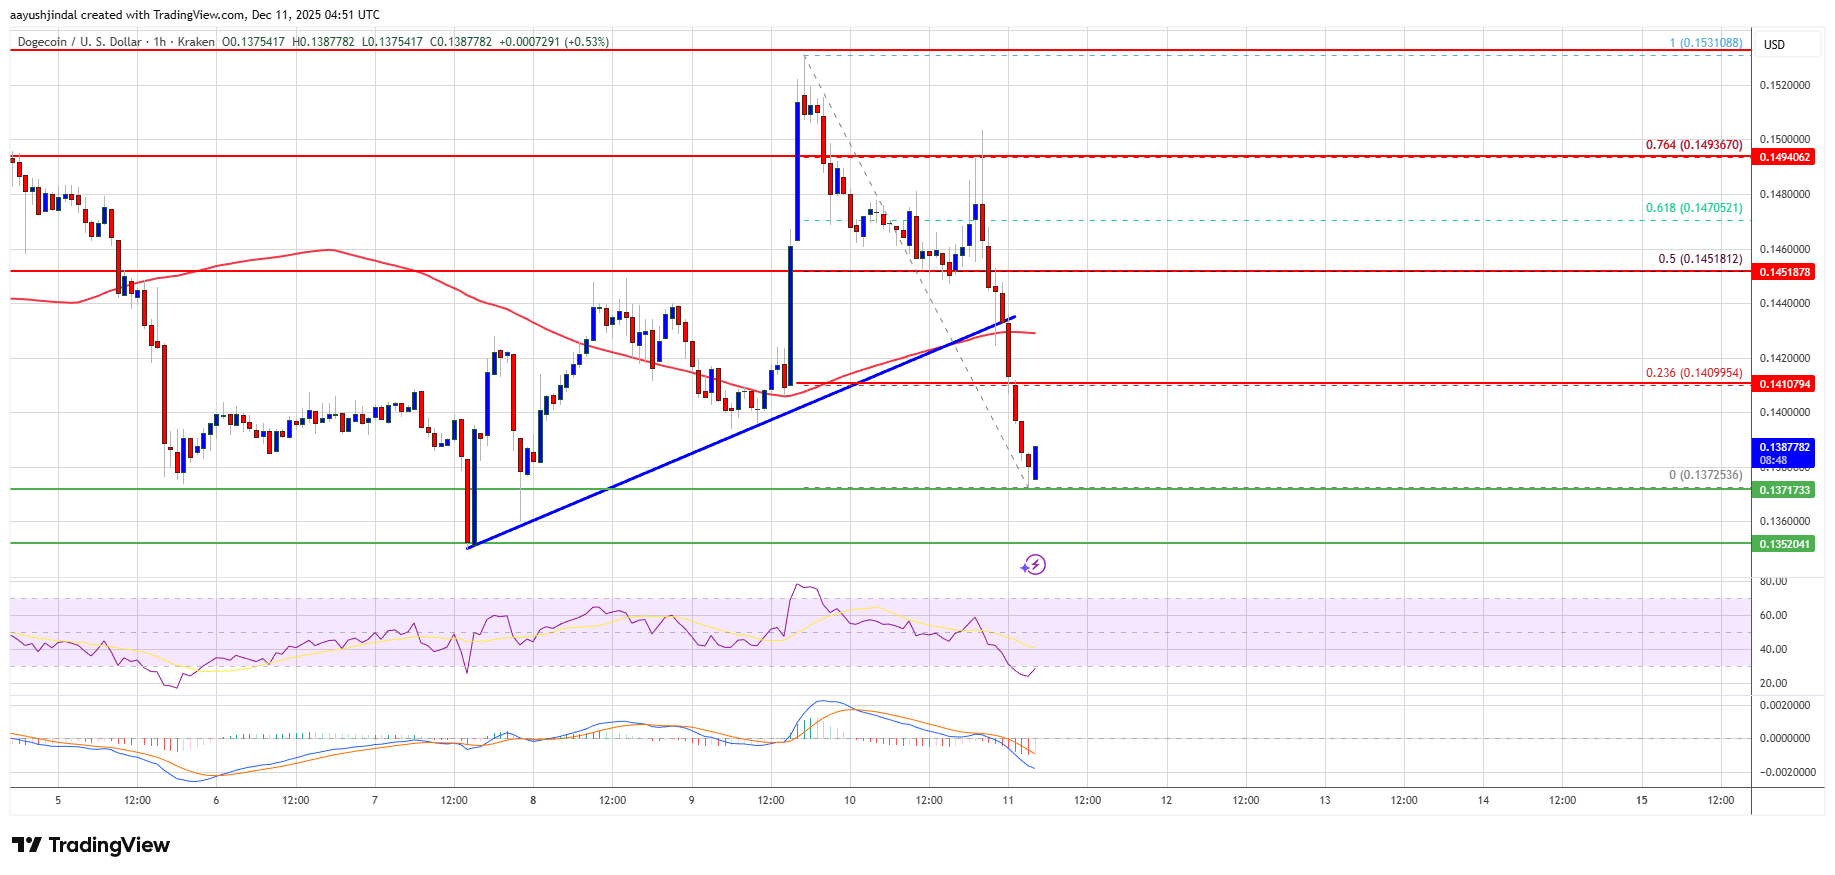
The Dogecoin price slipped back below the $0.145 region after failing to hold above $0.150 earlier in the week. The latest dip saw price break below an hourly trend line, touching lows near $0.131 before stabilizing. DOGE now trades below $0.140 on lower timeframes, with immediate resistance forming around $0.142 and $0.145.

Yet the broader view remains less gloomy. The weekly chart shows a developing MACD bullish crossover, complemented by rising histogram bars. Historically, this signal has marked early phases of momentum recovery.

The Dogecoin price continues to defend the long-standing $0.13–$0.15 support band, a range that has held for nearly two years. Repeated rebounds from the $0.135 zone highlight ongoing buyer activity despite intraday volatility.

Traders are also watching the upper boundary of the recent range at $0.155–$0.156. A close above this area would signal a break from the consolidation pattern that has persisted since late November.

ETF Volume and Exchange Outflows Show Accumulation

While the spot price fluctuates, underlying market activity points to steady participation. The Dogecoin ETF has recorded $3.23 million in daily trading volume, adding a layer of institutional-style flows that did not exist in previous cycles.

Similarly, exchange data shows between $20 million and $60 million in recent outflows, suggesting large holders continue moving tokens off trading platforms.

This combination, ETF demand and declining exchange balances, implies accumulation, particularly during price weakness. With fewer tokens available for immediate sale, selling pressure could ease if these trends continue.

Traders Await Breakout Signals as Volatility Tightens

Dogecoin’s trading volume has surged more than 60% at times this week, reflecting renewed interest ahead of broader market catalysts, including the Fed Reserve’s policy decision. DOGE now trades in a tightening range between $0.131 – $0.156, with analysts noting that prolonged compression often precedes larger moves.

Technical targets remain unchanged: $0.18–$0.20 as the first major resistance, followed by $0.21 and $0.27. A move toward the broader $0.30 barrier would require a break above short-term resistance and confirmation that buyers can sustain momentum.

The Dogecoin price sits at the center of contrasting signals, accumulation on the one hand and near-term weakness on the other, leaving the market to determine which will take priority as volatility returns.

Cover image from ChatGPT, DOGEUSD chart from Tradingview

Why Now Is The Perfect Opportunity To Short Bitcoin Down To $40,000

11 December 2025 at 10:00

A recent post by crypto analyst Stockmoney Lizards on X suggests that the current Bitcoin structure is giving bears “the perfect opportunity” to short the market down to $40,000. His message was paired with a chart showing Bitcoin falling below an important resistance ever since it broke below $100,000, creating what appears to be a clean continuation setup for traders expecting deeper losses. 

However, although the chart highlights a similar bearish structure in 2022, the analysis behind his post points to a more layered interpretation of what may come next for Bitcoin.

The Setup Bears Believe Is Finally Here

In the chart he shared, Stockmoney Lizards showed how Bitcoin’s latest breakdown resembles the 2022 pattern, when the price action rejected a major resistance level and fell sharply into what later became a large accumulation zone.  The current structure shows a similar rejection just above the $100,000 zone, followed by a drop below the weekly EMA50. This move has brought Bitcoin into a region that is similar to the range where accumulation formed in the earlier cycle. 

An overlay of the new price action on top of the previous one shows the path downward seems almost predetermined, creating the impression that the Bitcoin price is setting up a natural decline to as low as $40,000 in the coming weeks and months. Bitcoin is currently trading at $90,240. A crash to $40,000 would mean wiping out roughly 55% of its value from here, effectively erasing the entire progress it has built over the past two years.

Bitcoin price 1

Bitcoin Price Chart. Source: @StockmoneyL On X

Why The Perfect Short Is Not The Analyst’s Real Message

After the post gained traction, Stockmoney Lizards stepped in to clarify that his message had been taken too literally. His invitation for traders to short down to $40,000 was intentionally exaggerated, and the market does not behave this way. 

He clarified that he does not foresee a collapse into a deep bear market. Instead, he believes Bitcoin may consolidate, possibly sweep local lows, but not have a prolonged breakdown. Furthermore, he noted that the worst-case scenario would be a touch of the weekly EMA200, and this is not a place where bull markets end. The real midterm prediction is a higher move for the Bitcoin price.

Before posting the supposedly bearish prediction, Stockmoney Lizards had shared another analysis describing Bitcoin as being close to the endboss at the weekly EMA50 indicator. 

Bitcoin price 2

Bitcoin Price Chart. Source: @StockmoneyL On X

That earlier chart offered a clearer view of his actual stance. In it, he predicted that Bitcoin was approaching a major technical pivot and that he expected upward movement into the end of December and Q1 2025. Therefore, the weekly EMA50 is the barrier that Bitcoin needs to reclaim in order to launch its next phase of bullish momentum.

Bitcoin price chart from Tradingview.com

Bitcoin Realized Losses From Entities Surges To 2022 Levels Following Crash Below $90,000

11 December 2025 at 08:30

Bitcoin’s price action in the past two weeks has opened a new phase of stress among traders, with on-chain data showing realized losses climbing to heights last observed in 2022. 

Glassnode’s latest Week-On-Chain report shows Bitcoin is trading above an important cost-basis level but is also visibly straining under intensified loss realization, fading demand and weakening liquidity, which has placed short-term investors in a difficult position. 

Realized Losses Return To Deep Territory

According to Glassnode, realized losses among Bitcoin entities have risen massively, and is now almost at the same magnitudes recorded during the deep retracements of the 2022 bear market. Particularly, the Relative Unrealized Loss (30D-SMA) has climbed to 4.4% after nearly two years below 2%.

The escalation in loss realization reflects how the recent drawdown below $90,000 has forced a large number of market participants to offload coins at prices below their acquisition cost. This, in turn, has disrupted the gradual improvement in profitability seen earlier in the year. 

Bitcoin’s recent bounce from the November 22 low to above $92,000 hasn’t eased the strain on holders. Glassnode noted that entities are still locking in losses at an increasing pace, with the 30-day average of realized losses now at around $555 million per day. 

Bitcoin

These conditions mean that investors are losing confidence in short-term upside prospects for Bitcoin and choose to reduce exposure, even at unfavorable prices. Therefore, the report noted that resolving it will require a renewed wave of liquidity and demand to rebuild confidence.

Glassnode also highlights a sharp rise in profit-taking among long-term holders, whose realized gains have climbed to roughly $1 billion per day and briefly set a new record above $1.3 billion. 

Even with this elevated level of distribution, Bitcoin is currently positioned just above the True Market Mean, which is a long-standing cost-basis benchmark that serves as a point of structural support. The recent price downturn below $90,000 has pushed this zone close to its limits, but the glimpse of demand reflected around it suggests that price could revisit the 0.75 quantile near $95,000 and possibly approach the short-term holder cost basis as well.

Spot ETF, Futures, And Options Markets Indicate Weakness

Glassnode’s report points to persistent softness across ETF flows, which have cooled notably after a period of strong inflows earlier in the year. This slowdown represents a reduction in one of the largest and most immediate sources of buy-side liquidity for Bitcoin.

Spot market liquidity has also faded, with order books on major exchanges near the lower bound of their 30-day range. This has created an environment where trading activity has weakened through November and into December, and fewer liquidity flows are available to absorb volatility or sustain directional moves.

Derivatives positioning reflects similar caution, with funding rates pinned near neutral. Futures open interest has also been subdued and has failed to meaningfully rebuild since the breakdown below $90,000. 

Across all major venues, the tone is the same: liquidity is lighter, sentiment is softening, and participants are leaning defensive rather than pursuing short-term rallies. The attention is now on how Bitcoin will respond in the aftermath of the Federal Reserve’s recent rate cut.

Bitcoin

American Bitcoin Makes Big Buy, Adds 416 BTC To Its Stack

11 December 2025 at 07:00

American Bitcoin Corp. reported a fresh addition to its Bitcoin reserve after buying 416 BTC, bringing its total holdings to around 4,783 coins.

According to company disclosures and market reports, American Bitcoin (NASDAQ: ABTC) acquired about 416 BTC in the week ending December 8, increasing its on-balance stash to roughly 4,783 BTC. The purchase came from a combination of mined coins and selective market acquisitions, the company said.

American Bitcoin Boosts Holdings

The cash value of the latest pick-up was roughly in the $38 million range when reported, based on market prices at the time. That addition places the firm among the larger corporate BTC holders and increases the amount of Bitcoin the company holds for treasury purposes.

Reports have linked the buying to the firm’s stated strategy of growing its reserve alongside ongoing mining operations.

Shares Slide While Reserves Grow

While the balance sheet shows accumulation, the stock has struggled. Since ABTC’s market debut in September, shares have fallen by more than 70% from earlier highs, and the company has faced volatile trading as lock-up periods and market swings played out.

Some analysts continue to cover the name, but investors watching the share price have been cautious even as the firm expanded its Bitcoin holdings.

Mining, Custody And Pledges

Based on reports, the newly reported total includes coins held in custody and some that are pledged under agreements tied to miner purchases. The company noted that a portion of its BTC comes directly from mining operations while other pieces were bought on the market.

That mixed supply route means not all additions are simple open-market buys; some are internal production converted to treasury stock.

Satoshis Per Share And What Investors See

According to the company’s latest breakdown, its Satoshis Per Share (SPS) metric rose as a result of the accumulation, giving investors a clearer read on how much Bitcoin each share represents.

The metric is being used by some market watchers to compare ABTC’s treasury strength against other public firms. Analysts have pointed to the SPS figure in their notes while also flagging the stock’s recent pressure.

Family Backing And Public Profile

American Bitcoin was launched with backing from the Trump family and other partners, and the firm’s public profile has been higher than many peers because of that link.

Reports have highlighted the involvement of Eric Trump and Donald Trump Jr., while also referring to US President Donald Trump as part of the broader family context that has helped draw attention to the business.

Featured image from Unsplash, chart from TradingView

More Eurozone Countries Will Buy Bitcoin, Says Coinbase’s Institutional Chief

11 December 2025 at 06:00

An experiment in Prague might end up mattering more for Bitcoin than the usual ETF inflow chart.

Speaking on the “Crypto In America” show on 10 December, Coinbase Head of Institutional John D’Agostino highlighted that the Czech National Bank has begun testing Bitcoin in its national treasury and for payments, and argued that this sort of move by a Eurozone central bank is likely to spread.

Czech Bitcoin Pilot Could Spread Across Eurozone

“The Czech national bank chose very well in their service providers,” he said, adding that the central bank is “putting Bitcoin on their national treasury and they are experimenting with and learning in real time using Bitcoin for payments.” The pilot is small — “a million dollars of Bitcoin” — but for D’Agostino the signal is not in the size, it is in who is doing it and why.

He drew a deliberate contrast with earlier sovereign experiments: “No disrespect to El Salvador… this wasn’t a ‘I want to shake up my economy because I’m heading in the wrong direction’… This is, we are a stable Euro zone country… we don’t have to do this.”

Instead, the Czech move followed “all the bells and whistles” of a traditional process: RFPs, vendor selection, formal adoption into policy. That, he suggested, is exactly what makes it dangerous — for the status quo. “That type of thing is contagious and I can see more Euro zone [countries] following suit very very shortly,” he said.

The comment did not come in isolation. Throughout the interview, D’Agostino hammered a consistent thesis: institutional adoption has always been less about perfect regulatory clarity and more about liquidity, credible market structure and having the “right” types of participants in the pool.

“I’ve always been a bit of a skeptic on the argument that the reason institutions haven’t invested… is regulatory clarity,” he said. Clarity is “top three,” but in his ranking it comes after liquidity and sits alongside alpha potential. If two of the three are present, “people will find a way.”

Bitcoin’s spot ETFs, in his view, have already created something the asset previously lacked: a cohort of structurally compelled participants. “The ETFs, in my view, are kind of the surrogate commercial users of Bitcoin,” he argued. They “have to rebalance… it’s codified into their business model,” acting as a stabilizing force similar to industrial users in commodities markets.

A Eurozone central bank experimenting with Bitcoin on its balance sheet pushes that logic one step further up the food chain. D’Agostino did not spell out a grand theory of “Bitcoin as reserve asset” — he was careful, almost lawyerly, about what he could say — but the implication is not terribly subtle: when a central bank with access to normal EU funding “doesn’t have to do this” and still chooses to, it normalizes Bitcoin inside the most conservative layer of the monetary system.

That sits alongside a broader reputational repair job he thinks the industry still has to finish. Crypto, he argued, has had no more structural failures than other markets — he pointed to the London Metal Exchange’s cancellation of billions in nickel trades as an under-discussed parallel to FTX — but “we tend to push the jokers to positions of prominence,” whereas TradFi “does a good job of hiding their jokers.”

Between cleaner narratives, ETF-driven “surrogate” demand and now a Eurozone central bank quietly wiring a million dollars into Bitcoin, D’Agostino’s message was that the institutional story is less about a sudden wave and more about erosion. “There’s no wave,” he said earlier in the conversation. “It’s this gradual erosion as opposed to this crashing wave.”

If he is right about the Czech experiment being contagious, that erosion may soon be happening from the inside of the Euro system as well, not just from asset managers in New York.

At press time, BTC traded at $90,234.

Bitcoin price

Forget Bitcoin’s Old Cycle—A New Institutional Era Has Begun: Cathie Wood

11 December 2025 at 04:00

Ark Invest CEO Cathie Wood says Bitcoin’s long-running four-year pattern may be losing its grip as big financial players buy and hold more of the supply, a shift that could tame price swings and change how investors plan ahead.

Institutional Buying Is Changing Markets

According to Wood, large firms and spot ETFs are slowly locking up coins that used to flow in and out of retail hands. The most recent halving, on April 20, 2024, cut the miner reward to 3.125 BTC.

On a daily basis, that reduction translated to about a 450 Bitcoin drop in supply each day, a figure some analysts call small compared with the trillions attributed to the market’s value and the billions moving into ETFs.

Ark has been active too, buying shares in Coinbase, Circle and its own Ark 21Shares Bitcoin ETF (ARKB), a signal that institutional demand is more than a rumor.

Cycle Rules Are Being Questioned

Based on reports from banks and crypto firms, the familiar cycle—rises tied to halvings followed by deep crashes of 75–90%—is under debate.

Standard Chartered cut its 2025 price forecast from $200,000 to $100,000, arguing ETF inflows weaken the halving’s price punch.

Bitwise’s Matt Hougan and CryptoQuant founder Ki Young Ju have said institutional flows have changed or even erased the classic rhythm.

Markets hit a peak near $122,000 in July, and some analysts now say future drawdowns may be shallower, in the 25% to 40% range rather than the extreme collapses seen earlier.

Market Structure Still Shows Old Patterns

Not all evidence points to a finished cycle. Reports published by on-chain analytics firms such as Glassnode show behaviors among long-term holders that look like past up-and-down swings.

Demand from late-cycle buyers has softened in ways that mirror prior years, according to that research. It is being argued that halvings remain meaningful interruptions inside a longer trend, not irrelevant events.

Macro observers add that broader economic forces—rates, fiat liquidity, and institutional appetite—are increasingly important in the price story.

Investors should expect longer moves more often, with rallies stretching over more months and volatility generally lower, analysts say.

Wood suggested volatility is falling and that markets may already have hit a low a couple of weeks earlier.

Featured image from Unsplash, chart from TradingView

Crypto Tanks After Fed Cut: Santiment Breaks Down The Trap

11 December 2025 at 03:00

Crypto markets lurched lower after the Federal Reserve delivered exactly what everyone said they wanted: the third straight 25bps cut to close out 2025. Santiment’s latest deep dive makes a simple, slightly uncomfortable point: retail treated it as a green light, whales treated it as exit liquidity.

Bitcoin shortly rallied to $94,044, Ether surged to $3,433, XRP hit $2.10 and Solana managed to reach $142, but the momentum was short-lived. The BTC price fell by more than 5% at one point, ETH even fell by more than 8.5%.

What Caused The Crypto Market Plunge?

On 11 December, the FOMC confirmed another quarter-point reduction, completing what Santiment calls the “trifecta of cuts at the end of 2025.” Lower rates mean cheaper borrowing, more risk-taking, and—on paper—a friendlier backdrop for crypto. The Fed still describes an economy growing at a “moderate” pace with inflation above target, and in both the October and December meetings it cut because “the balance of risks (like slowing job growth) supported easing policy.”

The key shift is liquidity. On 29 October, the Fed decided to slow the reduction of its securities holdings from 1 December, easing the pace of balance-sheet runoff. By 10 December, it went further, saying bank reserves had fallen “too much” and announcing renewed purchases of short-term Treasury bills to keep reserves “ample.” That is a move from shrinking the balance sheet to quietly adding money back into the system. As Santiment notes, the Fed is still data-dependent but clearly more willing to lean dovish to protect financial conditions.

Markets, however, front-ran the story. Prediction platform Polymarket showed an “overwhelming amount of optimism” in the hours before Jerome Powell spoke. At the same time, on-chain data flagged abnormal activity: @DeFiTracer spotted a whale selling roughly 100 million dollars’ worth of Bitcoin within an hour, triggering “a healthy mix of sensationalized panic.” The expected outcome—another cut—arrived, but positioning around it was anything but balanced.

Bitcoin’s price reaction looked bullish at first. BTC spiked to about $94,044 after the announcement. Yet Santiment’s social data shows that the positive-versus-negative commentary ratio for Bitcoin had already peaked well before Powell’s remarks. The crowd’s emotional high came in anticipation; when the actual rally hit, traders were “quite modestly reactive” despite the move to 94K. Sentiment was spent.

Ethereum was worse. Over the same 24-hour window, ETH surged to around $3,433, and the positive comment ratio “was a LOT more interesting.” Santiment describes “a lot of FOMO after a mini surge immediately after Powell spoke,” with many traders who bought the breakout “eventually [getting] burned when ETH fell back down to 3,170.” It is the textbook “buy the rumor, sell the news” pattern: bullish macro headline, short-term bearish price action, retail buying the spike while larger holders “gladly” offload into the mini-rally.

Structurally, though, the report is not outright bearish. Year-to-date, Santiment notes, Bitcoin is down about 3.6%, versus a 17.6% gain for the S&P 500 and a striking 61.1% for gold. “It’s quite the dramatic difference,” the team writes, arguing that “a regression to the mean for BTC would be justified.”

With three cuts now locked in and reserves being topped up via T-bill purchases, the “catch-up” case for crypto versus equities and metals “becomes even stronger.” Historically, crypto “has reacted later than equities or commodities when macro trends shift.”

On-chain, so-called smart money appears to be acting as if that delayed reaction is coming. Wallets holding 10–10,000 BTC have added 42,565 Bitcoin since 30 November. What is “still [remaining],” Santiment says, is “a notable dump from retail, which would be indicative of the perfect recipe for a major bull run.” For now, they expect smaller traders to “run on fumes from this positive news of rates getting cut, for at least a couple of days.”

The bottom line of the report is deliberately sober. The final FOMC decision of 2025 “reinforces a narrative of gradual easing, improving liquidity, and a cautiously supportive environment for risk assets.”

After a rough year, “ending the year with three consecutive rate cuts from the Fed is a strong sign.” If inflation drifts toward target and economic data stays stable, Santiment argues, 2026 could finally give digital assets “the breathing room they’ve been waiting for.” Just do not confuse that with an invitation to chase the first post-Fed spike—because, as this week just reminded everyone, that is still where crypto tourists go to get burned.

At press time, the total crypto market cap was at $3.04 trillion.

Total crypto market cap

Bitcoin Lacks Fresh Momentum As Realized Cap Growth Still Declining

11 December 2025 at 01:00

On-chain data shows the Bitcoin Realized Cap Growth indicator has continued to decline recently, a sign new capital inflows lack momentum.

Bitcoin Realized Cap Growth Has Been Heading Down Recently

As explained by CryptoQuant community analyst Maartunn in a new post on X, the Bitcoin Realized Cap Growth has been trending lower recently. The “Realized Cap” is an on-chain capitalization model for BTC that calculates its total value by assuming the value of each individual token is equal to the spot price at which it was last transacted on the blockchain.

This is unlike the usual market cap, which simply calculates the total valuation of the asset by multiplying the number of tokens in circulation with the current spot price, considering the latest value of the cryptocurrency to be the one value for all coins.

In short, what the Realized Cap represents is the amount of capital that the Bitcoin investors as a whole used to purchase the asset’s supply. On the other hand, the market cap is the value that the investors are carrying in the present.

The Realized Cap itself isn’t the indicator of interest in the current discussion, but rather the Realized Cap Growth, measuring the 365-day changes occurring in the Realized Cap.

Changes in the indicator naturally reflect the amount of capital exiting or entering the cryptocurrency. In other words, the Realized Cap Growth contains information about the asset’s netflow.

Now, here is the chart shared by Maartunn that shows the trend in the 7-day and 59-day moving averages (MAs) of the Bitcoin Realized Cap Growth over the last few years:

Bitcoin Realized Cap Growth

As displayed in the above graph, the Bitcoin Realized Cap Growth has witnessed both its 7-day and 59-day MAs reverse down recently, with the former line crossing under the latter.

The trend indicates that growth in the Realized Cap has been slowing down during the recent market downturn. “This suggests Bitcoin is lacking momentum from new cost basis inflows,” noted the analyst.

With the 7-day MA falling below the 59-day MA, the indicator is now flagging the current market to be in a “bear phase.” The last time this signal maintained for an extended duration was alongside BTC’s decline over the first few months of 2025. It now remains to be seen how long momentum from new capital inflows will stay weak for Bitcoin this time around.

In some other news, the Bitcoin short-term holders are still under a notable amount of stress, as CryptoQuant author IT Tech has pointed out in an X post.

Bitcoin STH Profit/Loss Margin

Short-term holders (STHs) are defined as the Bitcoin buyers who got into the market during the past 155 days. Despite the rebound BTC has seen since its November low, STHs are still in a loss of 10%.

BTC Price

At the time of writing, Bitcoin is floating around $92,400, down 1.5% over the last 24 hours.

Bitcoin Price Chart

Dogecoin (DOGE) Slips Back Into the Red—Is Momentum Breaking Down?

11 December 2025 at 00:28

Dogecoin started a fresh decline below the $0.1450 zone against the US Dollar. DOGE is now consolidating losses and might face hurdles near $0.1420.

  • DOGE price started a fresh decline below the $0.1450 level.
  • The price is trading below the $0.140 level and the 100-hourly simple moving average.
  • There was a break below a key bullish trend line with support at $0.1450 on the hourly chart of the DOGE/USD pair (data source from Kraken).
  • The price could extend losses if it stays below $0.1420 and $0.1450.

Dogecoin Price Dips Further

Dogecoin price started a fresh decline after it closed below $0.150, like Bitcoin and Ethereum. DOGE declined below the $0.1450 and $0.1420 support levels.

More importantly, there was a break below a key bullish trend line with support at $0.1450 on the hourly chart of the DOGE/USD pair. The price even traded below $0.140. A low was formed near $0.1372, and the price is now showing bearish signs below the 23.6% Fib retracement level of the downward move from the $0.1531 swing high to the $0.1372 low.

Dogecoin price is now trading below the $0.140 level and the 100-hourly simple moving average. If there is a recovery wave, immediate resistance on the upside is near the $0.1410 level. The first major resistance for the bulls could be near the $0.1450 level and the 50% Fib retracement level of the downward move from the $0.1531 swing high to the $0.1372 low.

Dogecoin Price

The next major resistance is near the $0.1495 level. A close above the $0.1495 resistance might send the price toward the $0.1530 resistance. Any more gains might send the price toward the $0.1550 level. The next major stop for the bulls might be $0.1620.

More Losses In DOGE?

If DOGE’s price fails to climb above the $0.1450 level, it could continue to move down. Initial support on the downside is near the $0.1375 level. The next major support is near the $0.1350 level.

The main support sits at $0.1330. If there is a downside break below the $0.1320 support, the price could decline further. In the stated case, the price might slide toward the $0.1250 level or even $0.1240 in the near term.

Technical Indicators

Hourly MACD – The MACD for DOGE/USD is now gaining momentum in the bearish zone.

Hourly RSI (Relative Strength Index) – The RSI for DOGE/USD is now below the 50 level.

Major Support Levels – $0.1350 and $0.1250.

Major Resistance Levels – $0.1420 and $0.1450.

Strategy Calls For Withdrawal Of MSCI’s Exclusion Plan For Digital Asset Treasury Companies

11 December 2025 at 00:00

Strategy, formerly known as MicroStrategy, has expressed strong opposition to a proposal by the Morgan Stanley Capital International (MSCI) to exclude digital asset treasury companies (DATs) from its indexes. 

Calls For Fair Treatment Of Digital Asset Companies

In a recent letter signed by Michael Saylor and the firm’s CEO Phong Le, Strategy highlighted its support for MSCI’s efforts to establish consistent eligibility criteria across its indices. 

However, the company criticized the proposed threshold for excluding firms with more than 50% digital assets on their balance sheets, calling it “misguided.” The company argued that this measure could have negative implications not only for Strategy’s operations but also for the broader cryptocurrency market.

Strategy emphasized that, unlike traditional investment funds, it maintains the operational agility to adapt its value-creation strategies in tune with the evolving technology underlying Bitcoin. 

The firm asserts that this flexibility is a critical asset for investors and distinguishes Strategy and other DATs from traditional digital asset investment vehicles

The firm likened its investment approach in a singular asset class to that of real estate investment trusts (REITs) or oil companies, stating that MSCI categorizes those entities correctly without labeling them as investment funds. Therefore, it argued, DATs should be afforded similar treatment.

‘Discriminatory And Arbitrary’

The letter criticized the proposed 50% digital asset threshold as “discriminatory and arbitrary,” suggesting that it imposes uniquely unfavorable conditions on digital asset companies while allowing other industries—like oil, timber, and real estate—to maintain concentrated asset holdings without similar scrutiny. 

Strategy raised concerns that enforcing this rule would necessitate MSCI to create new methods for measuring balance sheet concentration, complicating the indexing process unnecessarily due to varying accounting principles across asset classes and jurisdictions.

Additionally, Strategy elaborated on how the exclusion of DATs could substantially inhibit innovation within the digital asset industry, which the current administration strongly promotes as part of its economic strategy. 

The company said that digital assets like Bitcoin have the potential to become foundational elements of global financial systems, but the proposed measures could limit access to these transformative technologies for pension plans and 401(k)s, ultimately redirecting billions away from the sector.

Strategy cautioned that a hasty exclusion of DATs could be based on misconceptions about their business models, asserting that it reflects a misunderstanding of the nature of these entities. 

The firm advocated for a more measured approach similar to MSCI’s past handling of the “Communication Services” sector, which underwent extensive consultation and a thorough review before reorganizing traditional telecom, media, and internet companies.

Strategy Urges MSCI To Reconsider

If implemented, Strategy warns that MSCI’s proposal could lead to the delisting of numerous companies heavily involved in digital assets. JPMorgan analysts estimate that Strategy alone might face liquidations of up to $2.8 billion as a direct consequence of this exclusion.

Such a move is also expected to potentially distort market dynamics by incentivizing Bitcoin miners to sell their assets immediately instead of holding them as part of their business strategy.

In light of these concerns, Strategy urged MSCI to withdraw the proposal for excluding companies with over 50% digital asset holdings from its Global Investable Market Indexes. 

The firm asserted that the proposal is rooted in a flawed understanding of DATs and would impose conditions unaligned with national interests, particularly those advocating for the responsible growth of the digital asset space.

Strategy

As of this writing, the company’s stock, trading under the ticker symbol MSTR, is trading at $185. There has been almost no difference since Tuesday’s trading session amid consolidating crypto prices. 

Featured image from DALL-E, chart from TradingView.com 

XRP Price Under Pressure—Can It Survive This Support Test?

10 December 2025 at 23:48

XRP price started a fresh decline below $2.10. The price is now struggling and faces resistance near the $2.050 pivot level.

  • XRP price started a fresh decline below the $2.040 zone.
  • The price is now trading below $2.020 and the 100-hourly Simple Moving Average.
  • There is a bearish trend line forming with resistance at $2.050 on the hourly chart of the XRP/USD pair (data source from Kraken).
  • The pair could continue to move down if it settles below $2.00.

XRP Price Dips Again

XRP price attempted a recovery wave above $2.120 but failed to continue higher, like Bitcoin and Ethereum. The price started a fresh decline below $2.10 and $2.050.

There was a move below the $2.00 support level. A low was formed at $1.993, and the price is now consolidating losses below the 23.6% Fib retracement level of the downward move from the $2.177 swing high to the $1.993 low.

The price is now trading below $2.050 and the 100-hourly Simple Moving Average. If there is a fresh upward move, the price might face resistance near the $2.0350 level. The first major resistance is near the $2.050 level. There is also a bearish trend line forming with resistance at $2.050 on the hourly chart of the XRP/USD pair.

XRP Price

A close above $2.050 could send the price to $2.085 and the 50% Fib retracement level of the downward move from the $2.177 swing high to the $1.993 low. The next hurdle sits at $2.10. A clear move above the $2.10 resistance might send the price toward the $2.150 resistance. Any more gains might send the price toward the $2.1850 resistance. The next major hurdle for the bulls might be near $2.220.

More Losses?

If XRP fails to clear the $2.050 resistance zone, it could start a fresh decline. Initial support on the downside is near the $2.00 level. The next major support is near the $1.9850 level.

If there is a downside break and a close below the $1.9850 level, the price might continue to decline toward $1.920. The next major support sits near the $1.880 zone, below which the price could continue lower toward $1.820.

Technical Indicators

Hourly MACD – The MACD for XRP/USD is now gaining pace in the bearish zone.

Hourly RSI (Relative Strength Index) – The RSI for XRP/USD is now below the 50 level.

Major Support Levels – $2.00 and $1.9850.

Major Resistance Levels – $2.050 and $2.10.

Yesterday — 10 December 2025NewsBTC

Shiba Inu Declared ‘Dead’—Unless This Game-Changer Arrives, Expert Says

10 December 2025 at 23:00

A noted Bitcoin adviser has warned that Shiba Inu faces an uphill climb unless it retakes a prior support band, a call that has stirred debate across crypto social channels.

According to posts by BingX Bitcoin adviser Nebraskan Gooner, the token must return above a horizontal region he marked between $0.000014 and $0.00001 to avoid a “dead” outlook.

Key Support Level Under Scrutiny

Gooner’s chart points to a multi-year zone that once acted as firm support. Reports show SHIB touched that band and later surged to about $0.000045 in early March 2024.

The importance of the area is highlighted by the token’s price action: it has spent much of Q4 2025 below that range, and at the time of reporting SHIB was trading around $0.000008618.

That places the coin roughly 33–38% below the $0.000013–$0.000014 region that many traders watch as critical.

$SHIB

Dead unless it reclaims red. pic.twitter.com/LOllFuyPYv

— Nebraskangooner (@Nebraskangooner) December 9, 2025

Technical Traders See Trouble Ahead

Breaking a long-held support level often flips buying interest into resistance, and that scenario is what traders fear here. Based on reports from market commentators, a failure to climb back into the red band would make upward moves harder and likely sap momentum.

Gooner used blunt language, saying “Dead unless it reclaims red” unless the token reclaims the zone. The phrase was repeated widely, feeding both bearish calls and pushback from supporters.

Community Response And Roadmap Calls

Across social threads, many users argued that SHIB is not unique; several altcoins appear stalled in the current phase. A number of holders said SHIB’s recovery chances may hinge on a wider altcoin rebound, sometimes called altcoin season.

According to Zach Humphries, members of the Shiba Inu project must refocus every ecosystem initiative around SHIB, reposition the token to attract renewed retail interest, and publish a clear, actionable roadmap to restore earlier momentum.

Bitcoin’s Role In A Possible Comeback

Some analysts pointed to Bitcoin as the likely spark for any broad recovery, expecting the alpha coin to rebound toward $125,000 from around $90,000, while others have projected a new peak near $150,000 in 2026. If Bitcoin climbs above $100,000, traders say speculative flows could return and lift meme tokens including SHIB.

Price Snapshot And What Comes Next

Short-term price moves show SHIB up 0.95% in the past 24 hours but down 4.8% over the last week. Many market observers emphasize that a return into the highlighted $0.000014–$0.00001 area would improve technical odds for a rally.

At the same time, others warn that even with historical liquidity and a large community, reclaiming a broken support is often difficult and can take time. The coming weeks will likely test whether market-wide momentum or renewed project direction can change SHIB’s path.

Featured image from Unsplash, chart from TradingView

Ethereum Price Retreats From Resistance—Is a Trend Reversal Starting?

10 December 2025 at 22:18

Ethereum price started a fresh increase above $3,350. ETH is now correcting gains from $3,450 and might decline further below $3,200.

  • Ethereum started a downside correction from the $3,450 zone.
  • The price is trading near $3,200 and the 100-hourly Simple Moving Average.
  • There was a break below a bullish trend line with support at $3,240 on the hourly chart of ETH/USD (data feed via Kraken).
  • The pair could continue to move down if it settles below the $3,200 zone.

Ethereum Price Declines Heavily

Ethereum price managed to stay above $3,200 and started a fresh increase, beating Bitcoin. ETH price gained strength for a move above the $3,320 and $3,350 resistance levels.

The bulls even pushed the price above $3,400. However, the bears were active below $3,450. A high was formed at $3,448 and the price is now correcting gains. There was a sharp decline below the 23.6% Fib retracement level of the upward wave from the $2,914 swing low to the $3,448 low.

Besides, there was a break below a bullish trend line with support at $3,240 on the hourly chart of ETH/USD. Ethereum price is now trading near $3,200 and the 100-hourly Simple Moving Average.

Ethereum Price

If there is another upward move, the price could face resistance near the $3,250 level. The next key resistance is near the $3,300 level. The first major resistance is near the $3,320 level. A clear move above the $3,320 resistance might send the price toward the $3,400 resistance. An upside break above the $3,400 region might call for more gains in the coming days. In the stated case, Ether could rise toward the $3,450 resistance zone or even $3,500 in the near term.

More Losses In ETH?

If Ethereum fails to clear the $3,250 resistance, it could start a fresh decline. Initial support on the downside is near the $3,200 level. The first major support sits near the $3,180 zone and the 50% Fib retracement level of the upward wave from the $2,914 swing low to the $3,448 low.

A clear move below the $3,180 support might push the price toward the $3,150 support. Any more losses might send the price toward the $3,050 region. The next key support sits at $3,000.

Technical Indicators

Hourly MACDThe MACD for ETH/USD is gaining momentum in the bearish zone.

Hourly RSIThe RSI for ETH/USD is now below the 50 zone.

Major Support Level – $3,180

Major Resistance Level – $3,300

Solana Enters Bear Territory: Realized Loss Now Outweighs Profit

10 December 2025 at 22:00

On-chain data shows the Solana Realized Profit/Loss Ratio has dipped into the loss-taking zone recently, a sign that SOL liquidity has thinned.

Solana Liquidity Back At Levels Associated With Bear Markets

According to data from on-chain analytics firm Glassnode, Solana liquidity has recently contracted to levels that are typically witnessed in a bear market. There are many ways “liquidity” of a cryptocurrency can be assessed, but here, Glassnode has used the Realized Profit/Loss Ratio.

This indicator measures, as its name already implies, the ratio between the amount of profit and loss that the SOL investors as a whole are realizing through their transactions.

The metric works by going through the transaction history of each coin being sold on the network to see what price it was last moved at. If the previous transaction price was less than the latest selling price for any token, then the indicator considers its sale to have realized a net gain. Similarly, the metric adds transactions to the loss-taking category in the opposite case.

The exact amount of profit or loss realized in any transfer is naturally equal to the difference between the latest price and last selling value. The indicator adds up this value for both categories and determines the ratio.

Now, here is the chart shared by the analytics firm that shows the trend in the 30-day moving average (MA) of the Solana Realized Profit/Loss over the last few years:

Solana Realized Profit/Loss

As displayed in the above graph, the Solana Realized Profit/Loss witnessed a sharp spike during the price rally in September. This suggests that profit taking saw an explosion. The indicator maintained at high levels for a while, but following the price peak in October, its value went downhill fast.

In November, the Realized Profit/Loss breached below the 1 mark as SOL plummeted. A value less than 1 on the metric implies loss realization is outpacing profit taking. Since this breakdown, the indicator has only gone lower inside the loss-taking region, a sign investor capitulation has only been becoming more dominant.

Glassnode has noted that the trend signals “liquidity has contracted back to levels typically seen in deep bear markets.” During the 2022 bear market, Solana remained in these conditions for a few months before its price found a bottom.

It now remains to be seen whether the low liquidity will also persist for the cryptocurrency this time, or if the fall into the loss region is only a temporary one for the indicator.

SOL Price

Solana surged to $144 on Tuesday, but the coin has seen a fall back to $138.

Solana Price Chart

Bitcoin Price Slides From Peak Levels—Is a Bigger Correction on Deck?

10 December 2025 at 21:55

Bitcoin price failed to continue higher above $94,000. BTC is now gaining bearish pace and might decline further below $89,500.

  • Bitcoin started a downside correction from the $94,500 zone.
  • The price is trading below $92,000 and the 100 hourly Simple moving average.
  • There was a break below a bullish trend line with support at $91,600 on the hourly chart of the BTC/USD pair (data feed from Kraken).
  • The pair might continue to move down if it settles below the $89,500 zone.

Bitcoin Price Dips Again

Bitcoin price failed to gain strength for a move above the $94,000 and $94,500 levels. BTC started a downside correction and traded below the $92,000 support.

There was a clear move below the 50% Fib retracement level of the upward move from the $87,777 swing low to the $94,583 high. Besides, there was a break below a bullish trend line with support at $91,600 on the hourly chart of the BTC/USD pair.

Bitcoin is now trading below $91,200 and the 100 hourly Simple moving average. The price is now approaching the $89,500 support, and the 76.4% Fib retracement level of the upward move from the $87,777 swing low to the $94,583 high.

Bitcoin Price

If the bulls remain in action, the price could attempt another increase. Immediate resistance is near the $91,200 level. The first key resistance is near the $91,500 level. The next resistance could be $92,000. A close above the $92,000 resistance might send the price further higher. In the stated case, the price could rise and test the $92,850 resistance. Any more gains might send the price toward the $93,500 level. The next barrier for the bulls could be $94,000 and $94,500.

More Losses In BTC?

If Bitcoin fails to rise above the $92,000 resistance zone, it could start another decline. Immediate support is near the $89,500 level. The first major support is near the $88,800 level.

The next support is now near the $87,750 zone. Any more losses might send the price toward the $86,500 support in the near term. The main support sits at $85,000, below which BTC might accelerate lower in the near term.

Technical indicators:

Hourly MACD – The MACD is now gaining pace in the bearish zone.

Hourly RSI (Relative Strength Index) – The RSI for BTC/USD is now below the 50 level.

Major Support Levels – $89,500, followed by $88,800.

Major Resistance Levels – $91,200 and $92,000.

Ethereum Should Be Valued Like Amazon, Says Dragonfly’s Qureshi

10 December 2025 at 21:00

Dragonfly managing partner Haseeb Qureshi has sharpened his defense of Ethereum’s valuation, arguing that critics are using the wrong financial framework and that ETH should be analyzed more like an early-stage Amazon than a mature “value” stock.

Speaking on the Milk Road Show on 9 December 2025, Qureshi revisited his now-viral valuation clash with investor Santiago “Santi” Santos, hosted by ThreadGuy, which reignited the debate over how to price layer 1 blockchains. At the core of Qureshi’s thesis is a simple but controversial claim: fee revenue on Ethereum is effectively pure margin and should be treated as profit, not as “revenue” in the traditional corporate sense.

“Blockchains don’t have revenue. They have profit,” he said. “When chains charge fees, that’s profit. There’s no expenses for a chain. Chains don’t pay expenses, right? There’s no AWS hosting cost for Ethereum.”

Qureshi Pushes Back On Claims Ethereum Is Overvalued

Santos had argued that Ethereum is trading at “300 plus” times sales, calling these price-to-sales (P/S) levels “embarrassing” relative to traditional companies and suggesting valuations are “way ahead of their skis.” Qureshi did not contest the magnitude of the multiples but rejected P/S as the right lens.

“He was insisting in the debate that the right way to look at these things is price of sales. So if you look at price sales for Ethereum, it’s something like 380. If you look at Amazon, I think Amazon topped out at price of sales of 42. And this was during the bubble,” Qureshi said.

He countered that for a blockchain, what equity investors would call “sales” is closer to the GDP or GMV of the on-chain economy, which is not directly measured at the protocol level. The only clean, observable line is fee income, which he treats as net income.

“The sales in some sense is like the GDP of the blockchain which we’re not measuring,” he argued. “The right thing to understand for a chain is the profit… The right thing to understand is what is the profit of Ethereum relative to the profit of Amazon.”

That opens the door to the Amazon analogy. Qureshi emphasized that Amazon delayed profitability for almost two decades to prioritize growth, yet public markets still assigned it extremely high earnings multiples.

“Amazon literally made no profit, no profit until basically about 20 years in as a business,” he said. “In the year I think it was 2013… Amazon had a PE ratio… over 600 whereas today the PE ratio of Ethereum of course is something like 380.”

Because Ethereum’s P/S and P/E converge under his “fees = profit” assumption, Qureshi’s argument is that investors should compare ETH’s 300–380x multiple to Amazon’s P/E history, not to its much lower P/S, if they are going to use a single headline ratio at all.

The broader context, he stressed, is that Ethereum and other L1s are still in an exponential build-out phase, more akin to early internet or e-commerce infrastructure than to late-cycle dividend payers.

“This technology has been getting bigger and bigger over time. It’s gobbling up the entire world of finance from where it started,” he said, referencing his essay “In Defense of Exponentials.” “None of [these technologies] started printing a bunch of profit immediately in the first five or even 10 years.”

Despite choppy price action and underperformance of altcoins versus AI equities and gold, Qureshi said his conviction in the long-dated Ethereum thesis has increased, not weakened, through the public debate.

“If anything, I have become more confident in my view,” he said, adding that nothing material had changed in the last months to justify a major portfolio rethink. “What exactly has changed in the last 2 months between, you know, ETH going to like $4,800 and ETH being at $3,000? The answer is basically nothing.”

Shared some post-debate reflections on my L1 debate with @santiagoroel, my rebuttal against the “crypto is all a big casino” doomers, and where I think we are in the crypto macro cycle 👇 https://t.co/9uMJFuLVrX

— Haseeb >|< (@hosseeb) December 9, 2025

For Qureshi, a genuine repositioning would require a clear invalidation of core assumptions—such as a quantum break of cryptography or a structural collapse in on-chain stablecoin demand. Short-term swings, in his view, are simply the pendulum of sentiment moving around a still-fixed fundamental anchor.

His message to skeptics is that if markets tolerated Amazon at 600x earnings while it scaled into a dominant platform, dismissing Ethereum at roughly 300–380x on a “too high on P/S” argument alone is analytically inconsistent.

At press time, ETH traded at $3,325.

Ethereum price

The Whale Who Can’t Stop Buying: BitcoinOG Scales Ethereum Long To $280M After Price Surge

10 December 2025 at 20:00

Ethereum is trading with renewed strength after breaking above the $3,300 level and briefly pushing toward $3,400, signaling a potential shift in short-term momentum. However, despite this recovery, bullish conviction remains fragile. Many analysts continue to warn that the broader trend still leans bearish, emphasizing that Ethereum has yet to reclaim the structural levels needed to confirm a macro reversal.

Yet one signal has captured significant attention: according to fresh data from Lookonchain, a major whale known as BitcoinOG has doubled down on his Ethereum long position. This trader is widely recognized for being the whale who successfully shorted Bitcoin during the October 10 market crash, a move that earned him substantial profits and elevated his reputation across the on-chain analysis community.

Rather than taking profits after ETH’s recent pump, he has expanded his long exposure—an unusually aggressive stance at a time when most traders remain cautious.

His renewed commitment raises questions about whether smart money is quietly positioning for a larger upside move, even as broader sentiment remains skeptical. If momentum holds, Ethereum may be preparing for a far more significant move than the market currently expects.

Whale Positioning and FOMC Impact

According to Lookonchain, the whale known as BitcoinOG has now expanded his position to 85,001 ETH, valued at roughly $280 million, and is currently sitting on more than $16 million in unrealized profit. Such an aggressive accumulation during a period of widespread caution signals a notable divergence between retail sentiment and whale behavior.

BitcoinOG Ethereum Position | Source: Lookonchain

When a trader with a proven track record positions this heavily on the long side, it often reflects a strategic conviction that market conditions could soon shift in favor of higher prices.

However, this positioning unfolds just as the market approaches a pivotal macro event: the FOMC meeting. The Federal Reserve’s decision on interest rates can dramatically influence liquidity, risk appetite, and short-term volatility across all risk assets, including Ethereum.

A rate cut could inject optimism into the market by weakening the US dollar and improving overall liquidity conditions. Conversely, a hawkish tone or a smaller-than-expected policy adjustment could trigger a sell-the-news reaction, especially with ETH nearing resistance.

For Ethereum, whale accumulation combined with macro uncertainty creates a high-stakes environment. If liquidity expands post-FOMC, ETH could gain momentum. If not, even strong whale positions may face short-term pressure.

ETH Testing Breakout Strength Ahead of Key Resistance

Ethereum’s 4-hour chart shows a decisive shift in momentum, with ETH pushing firmly above the $3,300 level after a clean breakout from its multi-week downtrend. This move marks one of the strongest bullish impulses since early November, supported by rising volume and a clear reclaim of the 50 EMA and 100 EMA.

The 200 EMA (red), which previously acted as dynamic resistance throughout the decline, has now been tested and is beginning to flatten—often an early indication that bearish momentum is losing dominance.

ETH setting a fresh high | Source: ETHUSDT chart on TradingView

However, ETH is now hovering directly below a critical resistance zone around $3,380–$3,420, a level where sellers previously stepped in aggressively. The current consolidation just beneath this zone reveals an undecided market: bulls attempt to establish acceptance above $3,300, while bears defend the next resistance layer.

If buyers manage to flip $3,320 into solid support, the path toward $3,500 becomes more achievable, especially if broader market sentiment improves. Conversely, a rejection from the $3,400 area could trigger a short-term pullback toward $3,200–$3,250, where moving averages are now stacked as layered support.

Featured image from ChatGPT, chart from TradingView.com

XRP’s Downtrend Shows Cracks — Are the Bulls Preparing A Counterstrike?

10 December 2025 at 19:00

XRP remains under the weight of its long-standing downtrend, but recent price action suggests the bears may be losing their grip. Upward moves are becoming sharper and more impulsive, while downward momentum slows, hinting that buyers are quietly stepping in. With a decisive breakout above key resistance, the bulls could be gearing up for a significant counterstrike.

Overarching Bearish Structure: The Red Trend Line Cap

According to the latest XRP chart update by MakroVision Research, the broader market structure remains firmly within a downward trajectory, clearly outlined by the steeply declining red trend lines. These trend lines continue to cap every attempt at recovery, leaving the larger technical picture unchanged and leaning bearish.

Although the internal structure of the market has begun to show notable signs of improvement. Short-term price behavior reveals that upward movements are becoming more impulsive, faster, and more defined. At the same time, the downward phases are gradually slowing, taking longer to unfold and displaying less momentum.

This shift is a classic indication of fading selling pressure and increasing buyer activity at lower levels. The market may still be sitting below a dominant resistance zone, but its internal dynamics are no longer as weak as before.

XRP

If XRP manages a decisive move above the red trend line around $2.48, it would unlock the bullish potential that has been quietly building beneath the surface. Without this breakout, the token remains technically under pressure, but the groundwork for a potential reversal is clearly forming.

Key price levels to watch include the $2.2 – $2.22 resistance zone, the major $2.48 breakout level, and the support region around $1.95 – $1.88, which aligns with both Fibonacci retracements and recent reaction points.

Dual Track Conflict: Bearish Trend Vs. Bullish Internal Structure

In conclusion, MakroVision Research has highlighted that XRP is currently positioned on a dual-track path. While the big trend remains technically downward, the internal price structure is becoming increasingly and noticeably bullish. This diminishing downward momentum makes the current chart highly exciting.

The immediate fate of XRP now depends entirely on whether the asset can achieve a sustainable breakout above the crucial resistance marks previously mentioned, specifically the $2.48 trend line. If XRP succeeds in converting that major resistance into support, the analyst warns that the built-up bullish momentum could unfold very quickly, leading to a rapid surge in price.

Currently, the critical question remains whether XRP can achieve a durable trend reversal and capitalize on its internal strength, or whether the overarching bearish pressure will ultimately prevail, forcing the price to fall deeper toward the significant $1.4 low.

XRP

America’s Largest Banks Quietly Embrace Bitcoin Loans, Saylor Says

10 December 2025 at 18:00

Michael Saylor, executive chairman of Strategy, told attendees at Binance Blockchain Week that the wall of skepticism inside big banks is breaking down faster than he once expected.

He said he had thought it might take four to eight years for major financial firms to move fully into Bitcoin. Now, he says, that timeline is compressing and the shift is visible right away.

Banking Giants Reverse Course

According to Saylor, the past 12 months have seen heavy hitters — including Citibank, BNY, Bank of America, PNC, JPMorgan, Wells Fargo and Vanguard — shift from hostility to a more welcoming stance on crypto.

Reports have disclosed that Vanguard has enabled clients to trade ETF shares linked to XRP and Bitcoin through its platform. Saylor added that internal plans are in motion at several institutions to roll out custody services and credit lines tied to crypto holdings.

Loans Backed By Bitcoin

Based on Saylor’s remarks, Charles Schwab is preparing to offer Bitcoin custody and to extend credit against BTC as soon as next year, and Citibank is said to be moving in a similar direction.

He recalled earlier struggles to secure bank loans using Bitcoin as collateral and said lenders have flipped their approach within roughly six months.


According to him, eight of the top 10 US banks are now issuing credit backed by Bitcoin, a claim that highlights how quickly attitudes appear to be changing inside the industry.

Political Climate Could Be Speeding Things Up

Saylor pointed to policy shifts under US President Donald Trump as a factor that has encouraged banks to leave the sidelines.

Many firms were already experimenting with blockchain years ago — Goldman Sachs, for example, issued one of the first Bitcoin-backed loans in 2022 — but a friendlier regulatory tone, he said, has accelerated planning and product development.

Still, banks face legal, operational and risk hurdles before these services reach broad retail customers.

Markets Watching Fed Announcement

Meanwhile, traders and analysts are watching the Federal Open Market Committee. The Fed is expected to cut rates by 0.25%, bringing the target to 3.5%–3.75%, a move that often boosts risk assets like Bitcoin. Volatility is likely around the announcement, and some market players warn that early rallies can reverse quickly when the Fed provides forward guidance.

Technical Signals And Sentiment

Bitcoin’s own moves were discussed alongside the banking story. The crypto fear gauge hit 10 this week, signaling extreme fear, and price rebounded from $86,700 to roughly $92,300.

One analyst flagged resistance near $94,200 and suggested a clean breakout could open a path toward $103,000. Another observer noted Bitcoin has lagged the Nasdaq’s recovery, a divergence that could work in either direction if markets shift.

Featured image from The Information, chart from TradingView

Why Ethereum’s Rally Isn’t Overheated – And Where Demand Must Grow Next

10 December 2025 at 17:00

Ethereum has pushed above the $3,350 level, injecting fresh momentum into the market after weeks of uncertainty. Yet despite this breakout, overall sentiment remains clouded by fear, with many analysts still warning that the broader structure points toward a developing bear market. Traders now find themselves at a pivotal juncture: is this the beginning of a sustained recovery, or merely a temporary rally before further downside?

According to a new CryptoQuant report, one of the most revealing indicators right now is Ethereum’s funding rate behavior across major exchanges. Unlike the explosive funding spikes seen during the two major rallies earlier this year, the current move shows a remarkably restrained funding environment. During those earlier surges, funding rates climbed aggressively into overheated territory, signaling euphoric long leverage and speculative excess — conditions that closely preceded short-term market tops.

This time, however, funding remains far more subdued. The absence of aggressive long positioning suggests that the current rally is not being driven by excessive leverage, which gives the move a different character compared to earlier spikes. Whether this signals healthier accumulation or simply a lack of conviction remains the core question as Ethereum approaches the next decisive phase.

Muted Funding Rates Highlight a Cautious But Potentially Constructive Rally

The CryptoQuant report highlights that, unlike previous explosive rallies, Ethereum’s current funding rates remain unusually low, even after its sharp recovery from the $2.8K region. This subdued funding environment signals that the derivatives market is not yet saturated with speculative long positions.

Buyers are stepping in, but modest leverage drives this move compared to past phases dominated by aggressive traders. Consequently, spot accumulation drives the current advance more than overheated futures activity.

Ethereum Funding Rates | Source: CryptoQuant

This difference carries important implications. Without a surge in speculative demand, Ethereum may struggle to ignite the kind of full bullish continuation leg seen in earlier breakout cycles. Historically, strong uptrends have required funding rates to expand meaningfully as traders chase price, forcing shorts to cover and fueling upward momentum. That behavior has not yet emerged in the current structure.

However, this muted landscape is not inherently bearish. Instead, it reflects a recovering market, not an overextended one. This leaves Ethereum with room to climb further — if demand strengthens. At the same time, the lack of leverage means the rally remains vulnerable; strong resistance rejections could quickly weaken momentum unless fresh buyers step in.

Testing Key Resistance as Momentum Builds

Ethereum’s daily chart shows a notable shift in momentum as the price pushes toward $3,320, extending its rebound from the sub-$2,800 lows. This recovery phase has been steady rather than explosive, reflecting a market that is stabilizing but still facing key overhead challenges.

ETH testing critical resistance level | Source: ETHUSDT chart on TradingView

The first major test is the 200-day moving average (red line), which ETH is now approaching after several weeks of trading below it. Historically, reclaiming this level has marked the transition from corrective phases into renewed bullish cycles, but a clean breakout is far from guaranteed.

The structure of the recent move highlights improving buyer confidence: ETH has formed a series of higher lows, indicating accumulation after the capitulation-like November drop. Although buyers are active, the relatively subdued volume profile suggests they lack broad-based conviction. A stronger influx of volume must flip the trend decisively bullish.

The 50-day and 100-day moving averages remain above the current price and are both aligned downward, reinforcing that ETH is still technically in a broader downtrend. For momentum to extend, Ethereum must break above the $3,350–$3,400 resistance zone, where prior support turned into resistance.

Featured image from ChatGPT, chart from TradingView.com

❌
❌