Normal view

There are new articles available, click to refresh the page.
Yesterday — 16 December 2025Cryptocurrency

Asia Market Open: Bitcoin Holds $87k As Shares Nudge Up On Mixed US Jobs Report

16 December 2025 at 22:46

Bitcoin rose about 2% in Asian hours on Wednesday as regional shares edged higher, and traders kept one eye on Thursday’s US inflation print for clues on how much room the Federal Reserve has to cut rates in 2026.

Equity markets remained measured across the region after a mixed US jobs report and soft purchasing managers’ data left investors debating whether growth is cooling fast enough to justify easier policy.

Akshat Siddhant, lead quant analyst at Mudrex, said “Despite this uncertainty, Bitcoin exchange reserves sitting at record lows have supported the upside, giving bulls an edge. Attention now turns to the upcoming CPI data, which will shape expectations around a potential Fed rate cut.”

“If momentum holds, BTC could advance toward $90,000, with support gradually moving higher to the $86,000 zone,” he added.

Market snapshot

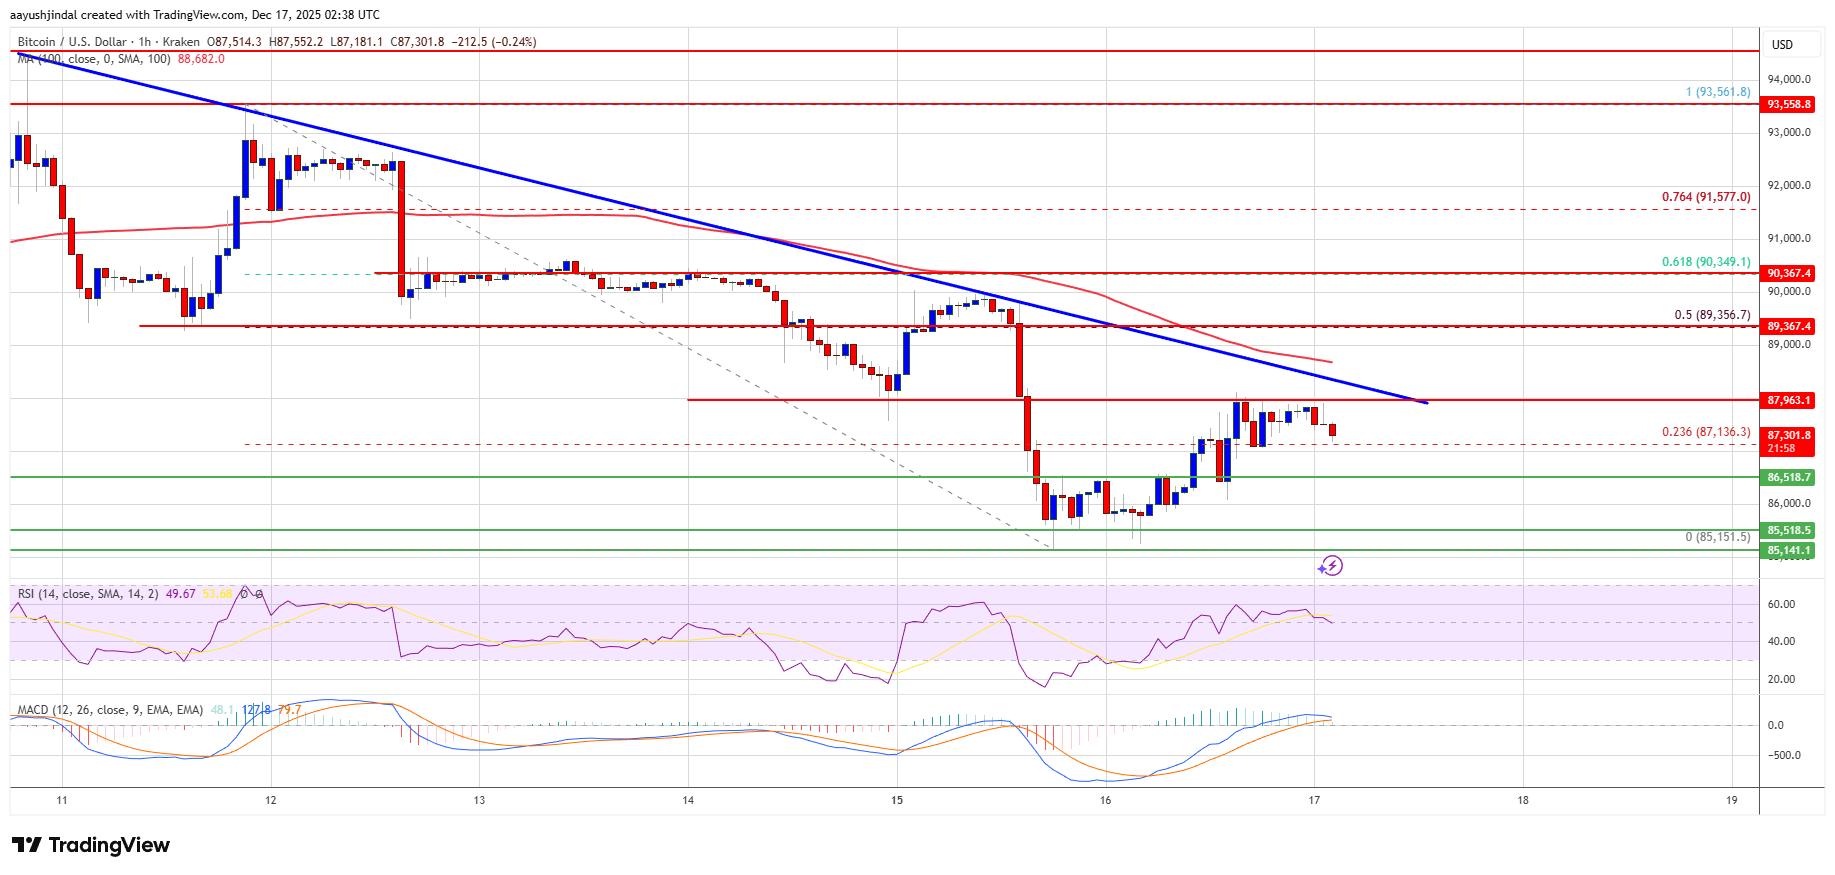
  • Bitcoin: $87,274, up 1.9%
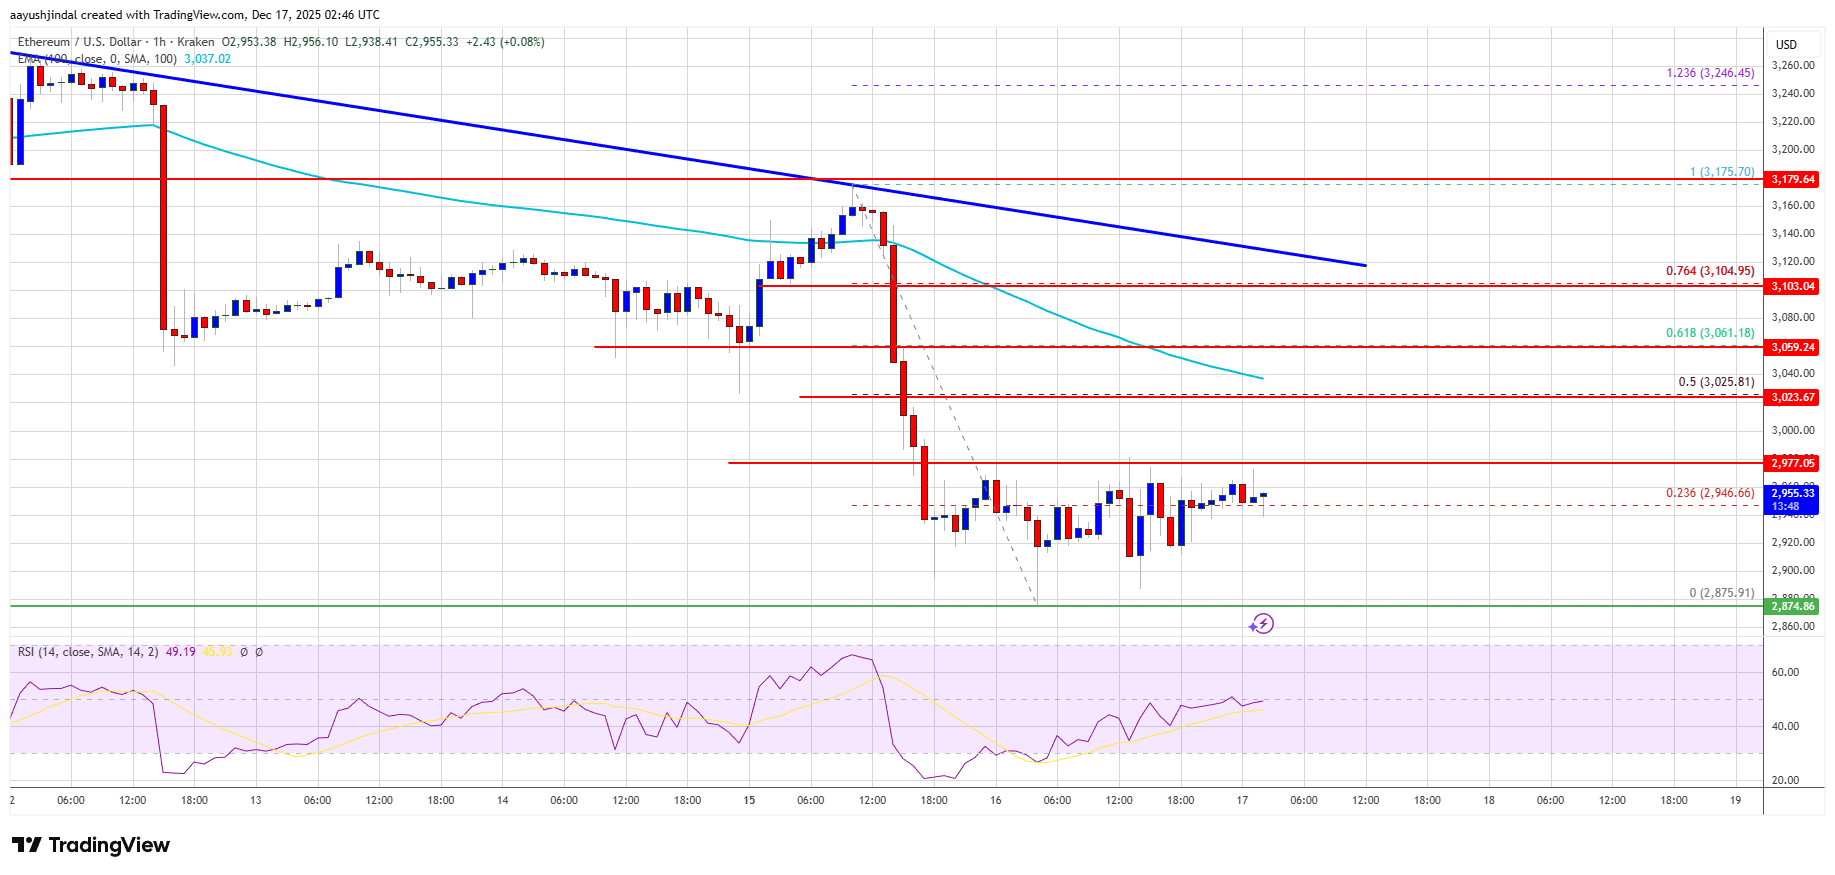
  • Ether: $2,948, up 0.5%
  • XRP: $1.93, up 3.4%
  • Total crypto market cap: $3.05 trillion, up 1.3%

Tech Rebound Lifts Asian Mood As CPI Looms

S&P 500 futures slipped 0.1% as the CPI release moved to the top of the macro calendar.

Technology shares helped lift sentiment after a bruising stretch. South Korea’s KOSPI gained 0.6% and Hong Kong’s Hang Seng added 0.3%, as buyers returned to large-cap tech names and the broader AI complex.

Some of that lift spilled into the robotaxi theme in Hong Kong. Pony AI and WeRide climbed more than 3% each, tracking strength in Tesla after chief executive Elon Musk said the carmaker was testing robotaxis with no human safety drivers.

On Wall Street, the Nasdaq finished Tuesday higher and the S&P 500 and Dow ended lower, with healthcare and energy weighing. Investors parsed delayed economic releases after a recent government shutdown slowed data collection, and the market treated the numbers as directionally useful rather than definitive.

Payroll Surprise Fails To Ease Growth Concerns

A Labor Department report showed nonfarm payrolls rose by 64,000 jobs in November after an October drop linked to government spending cuts, and the unemployment rate climbed to 4.6%. Separate figures showed retail sales were flat in October, slightly below economists’ expectations.

Nic Puckrin, an investment analyst and co-founder of Coin Bureau, said year-end tax-loss selling is adding pressure, with Bitcoin among the assets where many investors are sitting on losses.

He said that dynamic could weigh on prices into the end of 2025 and leaves room for a slide below $80,000 if the sell-off deepens. In the near-term, he pointed to the ETF cost basis around $83,800 as a key level, with further support near $81,200, which he described as the market’s true mean.

Japan Gains On Trade Data As Rate Hike Bets Build

In Greater China, the Shanghai Shenzhen CSI 300 rose 0.5% and the Shanghai Composite stayed flat, as investors waited for clearer signs of fiscal support from Beijing after a run of soft November data.

Elsewhere, Australia’s ASX 200 dipped 0.2% and Singapore’s Straits Times index fell 0.3%, and data showed Singapore’s non-oil exports rose in November.

Japan’s Nikkei 225 added 0.3% and the broader Topix gained 0.1% after trade data showed exports beat expectations, a signal that overseas demand is supporting growth into year-end. Traders also watched the Bank of Japan ahead of Friday’s policy decision, with markets leaning toward a rate increase as the yen stays weak and inflation remains sticky.

US rate expectations also sat under a leadership storyline, after the Wall Street Journal reported President Donald Trump is set to interview Fed Governor Christopher Waller on Wednesday for the chair role, adding another variable to a week already driven by CPI risk.

The post Asia Market Open: Bitcoin Holds $87k As Shares Nudge Up On Mixed US Jobs Report appeared first on Cryptonews.

Why Ethereum Is Chosen As A Settlement Layer For New Money Market Fund

16 December 2025 at 23:00

In a significant milestone for the evolution of on-chain finance, a new money market fund has selected Ethereum as its primary settlement layer toward blockchain-native infrastructure for traditional financial products. This decision reflects growing confidence in ETH security, scalability, ecosystem maturity, and qualities that institutional investors and asset managers increasingly demand when moving regulated financial instruments onto public blockchains.

How The New On-Chain Settlement Improves Operational Efficiency

The largest money whale in institutional finance just made its biggest move by launching a new money market fund on Ethereum, and it’s coming from J.P. Morgan Asset Management. According to an analyst known as Milk Road on X, the company oversees roughly $4 trillion in client assets, and seeds these funds with $100 million of its own capital before opening them up to the public. This fund is called My On-Chain Net Yield Fund (MONY), which is similar to a normal money market fund.

It is set to hold assets designed to preserve capital and remain liquid. A key difference between the fund and others is that shares are issued and tracked on ETH using JPMorgan’s Kinexys platform. The feature allows the fund to settle faster, issue and redeem shares continuously, and transfer ownership without waiting on the traditional clearing system.

Furthermore, this product is limited to large investors, individuals with at least $5 million investments, and institutions with $25 million, including a $1 million minimum to get started. The risk profile and purpose are familiar, and it’s a safe yield for investors. 

Meanwhile, for JPMorgan, this is a major operational upgrade offering faster cash transactions, tighter integration with treasury systems, and smoother collateral movement. Larger asset managers are starting by moving the safest, most conservative products on-chain first, because that’s where efficiency gains would show up immediately. “Adoption is accelerating,” Milk Road noted.

Why Ethereum Is More Than Just Technology

According to AdrianoFeria, the world’s greatest misunderstanding of Ethereum is viewing it solely as a technology. AdrianoFeria has pointed out that ETH is a network of economic actors coordinating around shared rules. It is also a social contract and a system that is designed to enable collaboration in the most adverse situations. 

At the core, ETH functions as a global and neutral arbitrator. Over time, it has proven itself to be the most long-standing, reliable, and trustworthy neutral arbitrator in the world. This arbitrator is the most valuable aspect of ETH, and any valuable model must account for it to have a chance of estimating realistic ETH price targets.

“If you are stuck with a cash flow-centric valuation for ETH, then it is time to sit down and study the system more deeply, and if you believe cash flow explains most of ETH’s value, you haven’t dug deep enough,” the expert mentioned.

Ethereum

Ethereum Price Ranges Under $3K—Is Direction About to Change?

16 December 2025 at 22:18

Ethereum price started a fresh decline below $3,000. ETH is now consolidating and might soon aim to start a recovery wave if it clears $3,025.

  • Ethereum started a fresh decline below the $3,050 zone.
  • The price is trading below $3,000 and the 100-hourly Simple Moving Average.
  • There is a connecting bearish trend line forming with resistance at $3,110 on the hourly chart of ETH/USD (data feed via Kraken).
  • The pair could continue to move down if it settles below the $2,900 zone.

Ethereum Price Starts Consolidation

Ethereum price failed to stay above $3,050 and started a fresh decline, like Bitcoin. ETH price dipped below $3,020 and $3,000 to enter a bearish zone.

The bears even pushed the price below $2,920. A low was formed at $2,875 and the price is now consolidating losses. There was a minor recovery toward the 23.6% Fib retracement level of the downward move from the $3,175 swing high to the $2,875 low.

Ethereum price is now trading below $3,000 and the 100-hourly Simple Moving Average. Besides, there is a connecting bearish trend line forming with resistance at $3,110 on the hourly chart of ETH/USD.

If there is another upward move, the price could face resistance near the $2,975 level. The next key resistance is near the $3,025 level and the 50% Fib retracement level of the downward move from the $3,175 swing high to the $2,875 low. The first major resistance is near the $3,050 level.

Ethereum Price

A clear move above the $3,050 resistance might send the price toward the $3,110 resistance and the trend line. An upside break above the $3,110 region might call for more gains in the coming days. In the stated case, Ether could rise toward the $3,200 resistance zone or even $3,250 in the near term.

Another Decline In ETH?

If Ethereum fails to clear the $3,025 resistance, it could start a fresh decline. Initial support on the downside is near the $2,920 level. The first major support sits near the $2,900 zone.

A clear move below the $2,900 support might push the price toward the $2,840 support. Any more losses might send the price toward the $2,800 region. The next key support sits at $2,765.

Technical Indicators

Hourly MACDThe MACD for ETH/USD is losing momentum in the bearish zone.

Hourly RSIThe RSI for ETH/USD is now near the 50 zone.

Major Support Level – $2,920

Major Resistance Level – $3,025

Visa Deepens Crypto Push With New Stablecoin Advisory Unit

16 December 2025 at 23:00

According to reports, Visa has created a new stablecoin advisory service through its Visa Consulting & Analytics (VCA) division.

The initiative is designed to help banks, fintechs, merchants, and other large companies explore how stablecoins can be used for payments, treasury operations, and other business processes.

The program combines market research, technology integration support, and training to give clients practical guidance as they test and adopt stablecoin solutions.

Visa Expands Advisory Services

Sources indicate the advisory practice will provide market-fit assessments, strategy development, go-to-market planning, and technical enablement.

Visa has even launched a specialized stablecoin course via Visa University to train clients on the fundamentals and practical application of these digital assets.

The service aims to help organizations move from pilot programs to fully operational stablecoin systems while maintaining compliance with regulatory requirements.

🚨 BREAKING: Visa launches Stablecoin Advisory Practice

Every bank is asking the same question right now: “What’s our stablecoin strategy?”

And when they don’t know the answer, who do they call?

Their card network.

Visa just formalized what was probably happening…

— Simon Taylor (@sytaylor) December 15, 2025

Early Clients And Market Context

Based on reports, several US financial institutions are among the first clients, including Navy Federal Credit Union, VyStar Credit Union, and Pathward.

The digital payments technology company has reported that its stablecoin settlement volume has reached an annualized run rate of roughly $3.5 billion as of late November 2025. The company supports over 130 stablecoin-linked card programs across more than 40 countries.

The overall stablecoin market has surpassed $250 billion in total value, highlighting strong interest from both retail and institutional participants.

Partnerships And Pilot Programs

Reports show Visa has been piloting stablecoin settlements for several years, including early work with USDC in 2023. Partnerships with firms like Aquanow have expanded settlement capabilities in regions such as Central and Eastern Europe, the Middle East, and Africa.

Visa also experimented with initiatives allowing businesses to make cross-border payments using stablecoins for pre-funding, in an effort to lower transaction costs and manage liquidity.

The Importance And Rise Of Stablecoins

According to analysts quoted in news reports, the use of stablecoins by banks and fintechs for various purposes such as cross-border payments and business-to-business payments is being explored.

The advisory service offered by Visa assists the traditional firm in understanding the options available to them while implementing controls and incorporating new technology into existing payment systems. Such overall expertise in technology and regulations puts the company on their advisory panel to pilot their stablecoin offering.

Featured image from Wikimedia, chart from TradingView

Cantor Fitzgerald Projects Major Growth For Hyperliquid (HYPE) In Explosive New Report

16 December 2025 at 22:00

Cantor Fitzgerald, one of the world’s leading asset management firms, has released an in-depth report highlighting the promising future of the decentralized exchange (DEX) Hyperliquid (HYPE). 

The 62-page analysis predicts significant growth for both the platform and its native token over the next decade, painting a bullish outlook for investors. 

Hyperliquid As ‘The Exchange Of All Exchanges’

As detailed in the report, Hyperliquid operates as a decentralized exchange specializing in trading perpetual futures and is built on a custom layer-1 blockchain. Currently, HYPE has a fully diluted market cap of approximately $15.8 billion. 

Year-to-date (YTD) 2025, the platform has generated an impressive $874 million in fees from a staggering $2.947 trillion in trading volume. 

A key feature that makes HYPE particularly attractive, and highlighted in the report, is its unique fee structure: approximately 99% of all fees generated by the protocol are allocated to repurchasing and burning the underlying token. 

This mechanism not only supports the value of HYPE but also reduces its circulating supply. In early 2025 alone, about 2.6% of all HYPE tokens expected to be in circulation, or roughly 5% of the current supply, were repurchased and burned. 

With the anticipation of new product launches, Cantor Fitzgerald views HYPE as “the exchange of all exchanges” and believes there’s a realistic path for annual fees to soar to $5 billion within the next decade.

Why Market Dynamics Favor HYPE

When it comes to the platform’s native token, HYPE has successfully captured considerable market share and emerged as one of the standout products in the cryptocurrency space over the past year. 

In addition to perpetual trading, Hyperliquid has launched spot trading and HIP-3 markets, enabling users to create new markets for a variety of assets including stocks and commodities.

Cantor Fitzgerald’s report emphasizes that the immediate determinant of HYPE’s market price will hinge on industry sentiment regarding competition. The ability of emerging rivals to challenge HYPE and affect its fee-generating capacity is paramount. 

However, the report argues that current fears surrounding competition may be overstated. It posits that “point tourists”—those who shift from platform to platform seeking incentives—are likely to return to the platform offering the deepest liquidity and best execution, which, according to Cantor Fitzgerald, is Hyperliquid.

A mere 1% increase in market share from CEX competitors in the perpetuals sector could translate to approximately $600 billion in trading volume. Based on existing perpetual fee rates, this could result in an additional $272 million in annual fees. 

By applying a conservative 25x valuation multiple to these fees, the potential market capitalization would rise to $6.8 billion.

HYPE Price To Reach $271?

Assuming moderate share gains over the next decade—projecting around 17% in perpetual trades and 18% in spot trading—Hyperliquid’s annual fees could surpass the $5 billion mark. 

A conservative valuation multiple of 25x, this would suggest a future market capitalization of approximately $125 billion. Given that nearly all generated fees will be used to repurchase HYPE tokens, a large portion of the circulating supply could potentially be bought back by the time the platform reaches these fee levels.

With a forecasted expansion of the fully diluted market cap from roughly $15.8 billion today to $125 billion in the future, combined with a declining supply of HYPE tokens, the projected share price is poised to increase at an even faster pace. 

If 20% of the Hyperliquid token float is repurchased—valued at around $3.5 billion today—the report suggests that the HYPE price could reach $271 at a fully diluted valuation of $125 billion.

The projections suggest that if HYPE captures just 1% of the market share annually and maintains consistent trading volumes from CEXs, the price of HYPE could grow substantially. 

By year 10, the asset manager believes that circulating supply could decrease from 577.2 million to approximately 144.9 million, while the market cap could remain around $16.1 billion based on conservative fee estimates excluding spot and HIP-3 revenues.

Hyperliquid

At the time of writing, Hyperliquid’s native token is trading at $26.49, having recorded major losses of almost 32% over the past month. This represents a 55% gap from the current trading levels and the all-time high of $59.30.

Featured image from DALL-E, chart from TradingView.com 

Bitcoin Price Regroups After Losses—Is Directional Break Near?

16 December 2025 at 21:44

Bitcoin price declined further and traded below the $87,000 support zone. BTC is now consolidating and might struggle to clear the $89,350 zone.

  • Bitcoin started a fresh decline below the $87,500 zone.
  • The price is trading below $88,000 and the 100 hourly Simple moving average.
  • There is a bearish trend line forming with resistance at $88,500 on the hourly chart of the BTC/USD pair (data feed from Kraken).
  • The pair might continue to move up if it settles above the $89,350 zone.

Bitcoin Price Consolidates Losses

Bitcoin price struggled to stay above the $89,000 and $88,500 levels. BTC started a fresh decline and traded below the $88,000 support.

The price even spiked below the $86,500 support. However, the bulls were active near the $85,000 zone. A low was formed at $85,151 and the price recently started an upside correction. There was a move above the 23.6% Fib retracement level of the downward move from the $93,560 swing high to the $85,151 low.

The bears are active near $89,000. Bitcoin is now trading below $88,000 and the 100 hourly Simple moving average. If the bulls remain in action, the price could attempt more gains. Immediate resistance is near the $88,000 level. The first key resistance is near the $88,500 level. There is also a bearish trend line forming with resistance at $88,500 on the hourly chart of the BTC/USD pair.

Bitcoin Price

The next resistance could be $89,350 or the 50% Fib retracement level of the downward move from the $93,560 swing high to the $85,151 low. A close above the $89,350 resistance might send the price further higher. In the stated case, the price could rise and test the $90,000 resistance. Any more gains might send the price toward the $91,200 level. The next barrier for the bulls could be $92,000 and $92,500.

Another Drop In BTC?

If Bitcoin fails to rise above the $88,500 resistance zone, it could start another decline. Immediate support is near the $87,000 level. The first major support is near the $86,500 level.

The next support is now near the $85,500 zone. Any more losses might send the price toward the $85,000 support in the near term. The main support sits at $83,500, below which BTC might accelerate lower in the near term.

Technical indicators:

Hourly MACD – The MACD is now losing pace in the bearish zone.

Hourly RSI (Relative Strength Index) – The RSI for BTC/USD is now near the 50 level.

Major Support Levels – $85,500, followed by $85,500.

Major Resistance Levels – $88,500 and $89,350.

TechCrunch Founder Names XRP Among His Largest Crypto Positions

16 December 2025 at 21:00

Michael Arrington, the founder of TechCrunch and CrunchBase, has placed XRP among his largest personal crypto holdings, according to a recent social post.

He listed XRP as one of his top five positions by dollar value, alongside Bitcoin, Ethereum, Solana and Immutable. The disclosure landed plenty of attention online and reignited debate about who is buying what and why.

Arrington’s Holdings And Community Reaction

Reports have disclosed that his post drew heavy engagement, with replies running the gamut from Bitcoin-only stances to more mixed portfolios.

Several industry figures echoed Arrington’s mix; Tony Edward, for example, listed XRP with BTC and ETH when discussing core positions.

The debate was loud and fast on social feeds. Some users framed the move as a vote of confidence. Others warned that one investor’s choices do not equal a market-wide shift.

Tell me your top five crypto holdings (by total dollar value).

Mine are XRP, BTC, ETH and IMX

— Michael Arrington 🏴‍☠️ (@arrington) December 13, 2025

Institutional Moves Follow

Based on reports, Arrington’s public support is tied to direct institutional activity. In October, Arrington Capital joined Ripple and SBI Holdings to back an initiative by Evernorth aimed at building a large institutional XRP treasury.

The project, which has been described in some circles as among the biggest of its kind, aims to increase institutional use of XRP and to support on-ledger activity such as decentralized finance and lending.

That involvement means Arrington is more than a vocal supporter; he is also tied to projects that could change how institutions use the token.

XRP Market Moves And Key Figures

XRP’s market picture has been mixed. As of December 16, 2025, the token was trading around $1.98, having held in a roughly $2.00 to $2.20 band in recent sessions.

There was a small daily lift of about 1.2% to roughly $2.08 on Monday, which helped the token cover some ground after early-December weakness.

The year has seen bigger swings: XRP peaked near $3.65 in July before giving back some gains. Activity in regulated derivatives has also grown.

Reports point to XRP futures on the CME reaching a record open interest of roughly $3 billion in late October 2025, a figure that market watchers say reflects rising institutional appetite for regulated exposure.

A Past Claim That No Longer Holds

Arrington has previously highlighted XRP’s strong performance. In March, he tweeted that XRP had been the best-performing major asset across multiple time frames — 90 days, 180 days, one year and three years.

That claim no longer lines up with current rankings. Performance metrics have shifted since then, and the statement has been overtaken by later results.

Featured image from Bitpanda Blog, chart from TradingView

Why Bitcoin’s Current Weakness Is Structural, Not Emotional

16 December 2025 at 22:00

Bitcoin has lost the critical $90,000 level and is now hovering near the $86,000 area, a zone that is quickly becoming the last meaningful support in the current structure. The recent decline has unfolded with little resistance from buyers, as bullish participation has largely disappeared from the market. Momentum-driven demand has faded, spot buying remains weak, and rallies are consistently being sold. As a result, a growing number of analysts are openly shifting their outlook toward a bear market scenario.

According to a recent report by on-chain analyst Axel Adler, conditions beneath the surface reinforce this pessimistic view. Derivatives positioning remains firmly negative, indicating that short sellers continue to dominate short-term market dynamics.

At the same time, market sentiment metrics have fallen to levels historically associated with major capitulation phases. Fear is widespread, confidence is fragile, and risk appetite across crypto markets is clearly deteriorating.

The combination of negative futures positioning and extreme investor fear creates a challenging environment for Bitcoin. Rather than signaling an immediate bottom, these conditions suggest that selling pressure remains structurally embedded in the market.

Futures Positioning And Sentiment Signal Deep Stress

Adler explains that the Bitcoin Positioning Index provides a clear view of who controls the derivatives market. The indicator aggregates changes in open interest and funding rates to identify the dominant direction of futures positioning.

At present, the index sits at -4, firmly in negative territory. This reading corresponds to a bearish regime and aligns with an active downtrend signal. Visually, the chart is dominated by purple bars over the past four weeks, highlighting sustained pressure from short positions and a lack of bullish conviction in derivatives markets.

Bitcoin Positioning Index | Source: Axel Adler

Negative positioning combined with falling prices confirms that bears remain in control of short-term market dynamics. According to Adler, a meaningful regime shift will only occur if the index returns above zero and the price consolidates above local resistance levels. Without that confirmation, downside risk remains elevated.

The Bitcoin Fear and Greed Index reinforces this bearish backdrop. The index, which tracks market sentiment from extreme fear to extreme greed, has fallen deep into the extreme fear zone and well below the 25th percentile.

The 30-day SMA has dropped to 20, while the 90-day SMA sits near 32, signaling persistent sentiment deterioration since September. While extreme fear alone does not guarantee a reversal, its alignment with negative futures positioning suggests that selling pressure is structural rather than purely emotional.

Bitcoin Tests Critical Support As Downtrend Persists

The chart shows Bitcoin trading under sustained technical pressure after failing to reclaim higher levels. Price has decisively broken below the medium-term moving averages and is now consolidating around the $87,000–$88,000 zone, a level that previously acted as support during the mid-cycle advance. The rejection from the blue moving average signals that bullish momentum has weakened significantly, while the downward slope confirms a loss of trend strength.

BTC testing critical demand | Source: BTCUSDT chart on TradingView

More importantly, Bitcoin is now hovering just above the red long-term moving average, a level that historically acts as a key structural support during broader corrections. The recent bounce from the $85,000–$86,000 area suggests that buyers are still present, but the response lacks conviction. Volume remains muted compared to earlier distribution phases, indicating hesitation rather than aggressive accumulation.

Structurally, the sequence of lower highs since the $120,000 peak remains intact. Until Bitcoin can reclaim the $92,000–$95,000 range and hold above the declining mid-term average, downside risks persist. A clean loss of the long-term support could expose deeper retracement levels toward the low $80,000s.

In the short term, this price behavior reflects a market in repair mode. Bitcoin is no longer trending, but it has not yet shown the strength required to invalidate the corrective structure.

Featured image from ChatGPT, chart from TradingView.com

Will Quantum Computing Suppress Bitcoin Prices In 2026? Grayscale Answers

16 December 2025 at 21:00

Quantum risk has been getting louder in the Bitcoin conversation over the past few months. The question is whether that noise translates into price pressure in 2026.

Grayscale’s answer, in its updated 2026 Digital Asset Outlook: “Dawn of the Institutional Era” (last updated Dec. 15), is essentially no. Quantum belongs on the risk register and in the research pipeline, not on the list of themes the firm expects to steer Bitcoin’s valuation next year. In its view, it’s not “likely to move prices” in 2026.

Why The Quantum Computer Threat Won’t Move Bitcoin Price In 2026

That call matters because the quantum debate arrived while the market is already looking for new failure modes — everything from “the four-year cycle is dead” to renewed anxiety about large holders distributing supply. Grayscale’s framing is simpler: the threat is real in theory, but the relevant timelines don’t line up with a 2026 trading horizon.

The firm lays out the core concern in plain terms: “Theoretically, a sufficiently powerful quantum computer could derive private keys from public keys, which could then be used to create valid digital signatures to spend users’ coins. Therefore, Bitcoin and most other blockchains — and virtually everything else in the economy that uses cryptography — will eventually need to be updated for post-quantum tools.”

The key word is eventually. Grayscale points to expert estimates suggesting a machine capable of breaking Bitcoin’s cryptography is “unlikely before 2030 at the earliest.” That pushes 2026 into a preparedness bucket: more research, more coordination, more work on mitigation — but not a year where markets suddenly apply a quantum discount because a lab headline hit the wires.

Grayscale makes that explicit. “However, expert estimates suggest a quantum computer powerful enough to break Bitcoin’s cryptography is unlikely before 2030 at the earliest. Research on quantum risk and community preparedness efforts will likely accelerate in 2026, but this theme is unlikely to move prices, in our view,” the firm writes.

In the report’s taxonomy, quantum sits closer to “high attention, low near-term impact” than to a true 2026 catalyst. Grayscale groups it with other heavily discussed trades that may not drive returns on a one-year view, including the digital-asset-treasury (DAT) narrative that had its Michael Saylor copycat phase in 2025.

The broader outlook is firmly “institutional era” in tone. Grayscale expects 2026 to extend structural shifts in how digital assets are owned and allocated, driven by macro demand for alternative stores of value and an improving regulatory backdrop that reduces frictions for large investors. In that context, the firm is calling for Bitcoin to set a new all-time high in the first half of 2026, while arguing the classic four-year halving cycle is becoming less dominant as spot ETPs and slower-moving portfolio allocation play a bigger role.

That’s also why quantum looks like a mismatch for the 2026 price question. If the marginal buyer is an allocator working through due diligence checklists, the market’s response function changes. Those investors do not ignore tail risks — but they also tend not to liquidate positions on long-dated, low-probability scenarios unless the timeline becomes immediate.

Grayscale highlights one other, quieter point that fits the institutional framing: Bitcoin’s supply schedule. The report notes investors can be “highly confident” the 20 millionth bitcoin will be mined in March 2026 — a predictable, verifiable milestone that speaks to the protocol’s rule-based issuance.

So will quantum computing suppress Bitcoin in 2026? Grayscale’s base case is no — not because the problem is imaginary, but because it isn’t close on the timeline markets usually need before they reprice risk. For next year, the firm expects the bigger drivers to look familiar, even if they arrive in more institutional packaging: rates, regulation, ETP plumbing, and steady absorption of BTC into mainstream portfolios.

Quantum remains a theme to track. Just not, in Grayscale’s view, the theme that sets the price in 2026.

At press time, Bitcoin traded at $87,184.

Bitcoin price chart

Celebrating One Year of Hashrate Redirect™: How Abundant Mines Redefined Uptime and Protected Millions in Client Bitcoin Rewards

16 December 2025 at 21:45

Bitcoin Magazine

Celebrating One Year of Hashrate Redirect™: How Abundant Mines Redefined Uptime and Protected Millions in Client Bitcoin Rewards

Hood River County, Oregon – December 16th, 2025 – This month last year, Abundant Mines quietly began to launch a feature that would go on to change how the bitcoin mining industry defines performance. Today, the company is celebrating the one-year anniversary of Hashrate Redirect™, a pioneering system that ensures clients continue earning bitcoin even when their machines are offline.

For too long, mining providers have misled customers with uptime metrics that measure whether a facility has power, not whether a machine is actually hashing. A rig could be powered off, broken, or awaiting repairs and still count toward a provider’s claimed “98% uptime.” The result is lost bitcoin, lost revenue, and lost trust.


Abundant Mines set out to correct this.

“When we introduced Hashrate Redirect™ a year ago, we didn’t make a big announcement. We simply built the solution we wished had existed when we were clients,” said Beau Turner, Co-Founder and CEO of Abundant Mines. “Twelve months later, the results speak for themselves: our clients continue earning even when their machines are offline, and the industry standard for uptime is shifting toward truth and transparency.”

A Year of Real Results: Uptime That Actually Means Performance

Instead of measuring uptime by whether a building has power or not, Abundant Mines measures rig uptime – the percentage of time an individual machine is hashing and producing bitcoin. When a rig goes offline for repairs, RMA, or maintenance, Hashrate Redirect™ replaces the lost hashrate with hash from Abundant Mines’ operational fleet.


The loss of hash is tracked immediately, and the redirection happens within days, not at the end of the month or year. The result is a continuous bitcoin revenue stream for clients, even during downtime.

Over the past year, Hashrate Redirect™ has:

  • Protected clients from hours of lost earnings
  • Redirected hashrate for machines without interruption
  • Preserved significant bitcoin rewards that would otherwise have been missed.

“Hashrate Redirect™ is simple but powerful,” said Turner. “We give you hash, not cash. Because you’re not mining for credits or refunds, you’re here to earn bitcoin and help secure the network.”

Why Timing Matters: Capturing Bitcoin’s Full Value

Bitcoin’s value is time-sensitive. Block rewards are issued every 10 minutes, and once they’re gone, they’re gone forever. If a rig is offline during a price surge or halving cycle, the lost opportunity can compound into significant missed revenue.

By replacing hashrate continuously, not with delayed end- of -year credit, or even end-of-month credit, Abundant Mines ensures that clients capture the full earning potential of every block, especially during high-value market windows.

“With bitcoin’s price climbing and the network becoming more competitive, uptime precision isn’t just a technical detail. It is the difference between winning and falling behind,” said Turner. “Hashrate Redirect™ makes sure our clients stay ahead.”

Why Weekly Hashrate Matters More Than One-Time Credits

Most mining providers only offer compensation for downtime once or twice a year, often in the form of a one-time hashrate allocation or bill credit. On paper, this may seem like a fair solution. In reality, it is too little and far too late.

Bitcoin rewards are not static. They are distributed every 10 minutes, and their value changes constantly based on market price and network difficulty. If your machine is offline for weeks or months, those missed rewards cannot be recreated later – even if a provider offers you a lump sum or short burst of extra hashrate at the end of the year.

Abundant Mines takes a different approach. With Hashrate Redirect™, we replace any downtime with hashrate from our personal fleet. This means you continue earning bitcoin on a rolling basis, staying aligned with market conditions and capturing opportunities in real time.

This approach matters because:

  • Missed blocks are missed forever. Once they’re mined, they cannot be recreated later.
  • Network difficulty volatility impacts rewards. Weekly redirection ensures you maximize bitcoin earnings, so that you are not punished for hashing later when difficulty has risen significantly.Compounding matters. Bitcoin earned earlier can be held, deployed, or compounded, creating significantly greater long-term value.

“Timing is everything in bitcoin mining,” said Turner. “By replacing hashrate weekly instead of issuing delayed payouts, we ensure our clients never miss the most valuable moments to earn.”


Setting a Higher Standard

One year after launch, Hashrate Redirect™ has become more than a feature. It is a new benchmark for performance and a reflection of Abundant Mines’ commitment to transparency, accuracy, and client protection.

“Mining should mean performance, not just power,” Turner said. “Hashrate Redirect™ has proven that principle for a full year, and we are only getting started.”


About Abundant Mines

Abundant Mines is a premium bitcoin mining and energy infrastructure company based in Oregon. Committed to transparency, reliability, and impact, Abundant Mines designs, builds, and operates advanced mining facilities that align energy abundance with digital value creation. Its mission is to make bitcoin mining more accessible, more dependable, and more profitable for individuals and institutions worldwide.

Media Contact:

hello@abundantmines.com

www.abundantmines.com 

This post Celebrating One Year of Hashrate Redirect™: How Abundant Mines Redefined Uptime and Protected Millions in Client Bitcoin Rewards first appeared on Bitcoin Magazine and is written by Bitcoin Magazine.

Bitcoin Bottom Forecast: Top Expert Predicts $40,000 Target Next Year, Here’s The Analysis

16 December 2025 at 20:00

Bitcoin (BTC) has been struggling to regain momentum in the market, failing to surpass its nearest resistance level of $94,000 for over a month. The cryptocurrency is currently trading within a broad range between $85,000 and $93,000, leading to growing concerns about further price corrections in the upcoming months.

Amid this uncertainty, market expert NoLimit recently expressed on social media platform X (formerly Twitter) that he anticipates Bitcoin could bottom out at around $40,000 sometime in 2026. This forecast implies a significant 54% decline from current levels, which are just above $87,860.

A Historical Perspective On Market Cycles

NoLimit’s analysis outlines several reasons for this predicted downturn. He points out that Bitcoin has a historical tendency to surprise investors, often when confidence in the market is high. While each price cycle may appear unique on the surface, NoLimit argues that the underlying mechanics remain largely unchanged.

He emphasizes the cyclical nature of Bitcoin, noting that it moves within a four-year cycle influenced by liquidity, leverage, and human behavior rather than mere sentiment. 

According to him, the market is currently late in this cycle, and Bitcoin has consistently followed a three-step process during past upward movements.

First, Bitcoin tends to surge in price following the Halving event. This is typically followed by an influx of maximum leverage and late-stage buyers. Finally, the cycle concludes with a sharp and often chaotic reset before the next significant price expansion occurs.

Historically, Bitcoin has experienced steep declines during these resets, such as an approximate 85% drop in 2013-2014, an 84% drop in 2017-2018, and a 77% drop during the 2021-2022 cycle. In each scenario, investors were convinced that the conditions were different, yet the outcomes remained consistent.

$40,000 As Foundation For Bitcoin’s Next Bull Run 

Considering the current market situation, NoLimit highlights several critical indicators. He notes that Bitcoin has already seen substantial price appreciation, with institutional interest and exchange-trade fund (ETF) approvals now part of the landscape. 

He also observes that many traders are over-leveraged, market volatility is compressed, and there exists widespread hope for further price increases. These factors often signal a heightened risk of downside movement in the market.

A potential drop toward the $40,000 range should not be viewed as an unforeseen disaster, according to NoLimit. He argues that significant price declines have historically preceded major upward movements. 

Additionally, this price target aligns well with several technical indicators, including previous resistance levels that have turned into support, long-term moving averages, and the liquidity gap created by ETF approvals. 

Such factors suggest that a move toward this region could exhaust forced sellers and provide a solid foundation for recovery.

Bitcoin

Featured image from DALL-E, chart from TradingView.com 

Smart Money Outflow: 14,000 Ethereum Hit the Market As Two Major Holders Exit Positions

16 December 2025 at 20:00

Ethereum is trading below the $3,000 level as selling pressure continues to weigh on the broader crypto market. After weeks of unstable price action, ETH has failed to reclaim key psychological and technical levels, reinforcing a fragile market structure.

Sentiment remains decisively bearish, with fear and even apathy starting to dominate trader behavior. Volatility has compressed, participation has thinned, and many analysts are increasingly pointing toward a prolonged bear market scenario extending into 2026.

This lack of conviction is not limited to retail participants. According to data shared by Lookonchain, two large whales dumped a combined 14,000 ETH, worth approximately $40.82 million, in just the past two hours. Such aggressive selling during already weak conditions adds pressure to an asset that is struggling to attract sustained demand.

While isolated whale activity does not define the broader trend on its own, timing matters. Large distributions during periods of low liquidity often amplify downside moves and reinforce negative sentiment across the market.

Ethereum Whale Selling Meets Long-Term Conviction

Arkham data shared by Lookonchain reveals fresh evidence of large-scale selling as Ethereum trades under sustained pressure. Address 0x2802 sold 10,000 ETH, worth approximately $29.16 million, at an average price of $2,915.5 through decentralized exchanges.

Shortly after, another whale, 0x4c0A, offloaded 4,000 ETH, valued at around $11.66 million, distributing the sale across multiple centralized venues, including OKX, Binance, KuCoin, and Gate. The timing and coordination of these moves reinforce the current bearish tone, particularly as liquidity remains thin and broader market sentiment leans defensive.

Ethereum Whale Transactions | Source: Arkham

In the short term, such activity adds to downside pressure and fuels uncertainty among smaller investors, who often interpret whale selling as a signal of deeper weakness ahead. However, price action and sentiment do not tell the full story. Despite the drawdown, Ethereum’s fundamentals continue to strengthen at a pace rarely seen before. Institutional adoption is accelerating, not slowing.

Most notably, JP Morgan recently announced the use of Ethereum to launch its first tokenized money-market fund, a milestone that underscores growing confidence in Ethereum as a settlement and financial infrastructure layer. While markets may remain bearish in the near term, the divergence between price sentiment and fundamental progress is becoming increasingly difficult to ignore.

Ethereum Price Struggles to Hold Key Weekly Support

Ethereum continues to trade under pressure on the weekly chart, with price now sitting around $2,950 after a sharp rejection from the $3,200–$3,300 region. This area previously acted as a key pivot zone and has now clearly flipped into resistance. The inability to reclaim it confirms that sellers remain in control of the medium-term structure.

ETH consolidates around critical support level | Source: ETHUSDT chart on TradingView

From a trend perspective, ETH is consolidating around its 200-week moving average (red line), a historically important level that often determines whether corrections remain cyclical or evolve into deeper bearish phases. So far, this moving average is acting as dynamic support, preventing a more aggressive breakdown. However, momentum remains weak, and upside follow-through is limited.

The 50-week and 100-week moving averages (blue and green lines) are beginning to flatten and converge, reflecting indecision and reduced trend strength. Volume also remains muted compared to prior expansion phases, suggesting that neither strong accumulation nor capitulation is taking place at current levels.

Structurally, ETH remains in a wide consolidation range between $2,500 and $3,300. A weekly close below the $2,800–$2,900 area would expose downside toward the lower end of that range. Conversely, reclaiming $3,300 is required to reestablish bullish momentum. Until then, Ethereum remains technically fragile despite its long-term fundamentals.

Featured image from ChatGPT, chart from TradingView.com

❌
❌