Ethereum Price Prediction: $3,000 Rejected, But On-Chain Data Tells Another Story
Ethereum is trading in the $2,930–$2,950 range as of January 25, 2026, consolidating after a broader pullback from January highs above $3,400. The move lower reflects near-term macro caution and heavy ETF-related selling rather than a breakdown in network fundamentals.
With Bitcoin hovering near $89,000 and risk sentiment mixed, ETH has shifted into a range-bound phase where price is lagging underlying activity.
ETF Pressure Weighs on Price, Not Structure
Short-term pressure has largely come from spot ETH ETF outflows, which exceeded $600 million between January 20–23, led in part by a single-day $250 million exit from BlackRock’s ETHA. This selling has cooled momentum and kept ETH capped below the $3,000 handle.
However, the flow data points more toward rotation and profit-taking than institutional abandonment. On-chain tracking shows whales accumulating roughly $1 billion worth of ETH during the recent correction, while funding rates and open interest have reset from crowded long conditions. That combination suggests leverage is being flushed, not confidence.
On-Chain Activity Tells a Different Story
Beneath the price, Ethereum’s network activity remains strong. Daily active addresses have climbed toward 1.3 million, while transaction counts are holding between 1.9 million and 2.2 million per day.
Validator behavior reinforces this trend: exit queues are near zero, entry queues are rebuilding, and staking participation continues to rise, tightening circulating supply.
Low fees and improved efficiency post-upgrades are also driving sustained DeFi and app usage, reinforcing a “price weak, fundamentals firm” dynamic that has historically preceded larger trend moves.
Ethereum Rises Despite U.S.-Iran Tensions
On the geopolitical front, the tensions are rising between the U.S. and Iran as Iran’s Revolutionary Guard warns it is “more ready than ever” amid U.S. warships moving toward the Middle East. The warning comes after Iran’s recent crackdown on protests, which left thousands dead, and Trump has set strict red lines for military action, including preventing mass executions and violence against civilians.
Despite these geopolitical tensions, Ethereum (ETH) continues to rise. This shows that investors remain confident in Ethereum’s growth, likely supported by strong developments like the Ethereum Foundation prioritizing post-quantum security.
Today marks an inflection in the Ethereum Foundation's long-term quantum strategy.
— Justin Drake (@drakefjustin) January 23, 2026
We've formed a new Post Quantum (PQ) team, led by the brilliant Thomas Coratger (@tcoratger). Joining him is Emile, one of the world-class talents behind leanVM. leanVM is the cryptographic…
Ethereum Price Prediction: Compression Builds Near $2,950 as ETH Eyes Its Next Leg
Technically, Ethereum price prediction is bearish as ETH is holding above $2,850–$2,900, a key support zone aligned with prior demand and Fibonacci confluence. RSI remains subdued near 35–40, signaling caution but not capitulation.
A reset toward support followed by a reclaim of $3,060 would reopen upside toward $3,190–$3,400, while a clean break below $2,800 would risk a deeper retracement toward $2,700.
Looking ahead, Ethereum’s 2026 roadmap adds weight to the longer-term case. The upcoming Glamsterdam upgrade and later Hegota phase focus on scalability, efficiency, and sustainability, building on blob infrastructure progress and accelerating Layer-2 adoption.
With over 8.7 million new contracts deployed entering the year, analysts increasingly view 2026 as a potential breakout period if macro conditions stabilize.
Ethereum (ETH/USD) Trade setup: Accumulate near $2,850–$2,900, target $3,190–$3,400, invalidation below $2,700.
Bitcoin Hyper: The Next Evolution of BTC on Solana?
Bitcoin Hyper ($HYPER) is bringing a new phase to the BTC ecosystem. While BTC remains the gold standard for security, Bitcoin Hyper adds what it always lacked: Solana-level speed. The result: lightning-fast, low-cost smart contracts, decentralized apps, and even meme coin creation, all secured by Bitcoin.
Audited by Consult, the project emphasizes trust and scalability as adoption builds. And momentum is already strong. The presale has surpassed $30.9 million, with tokens priced at just $0.013635 before the next increase.
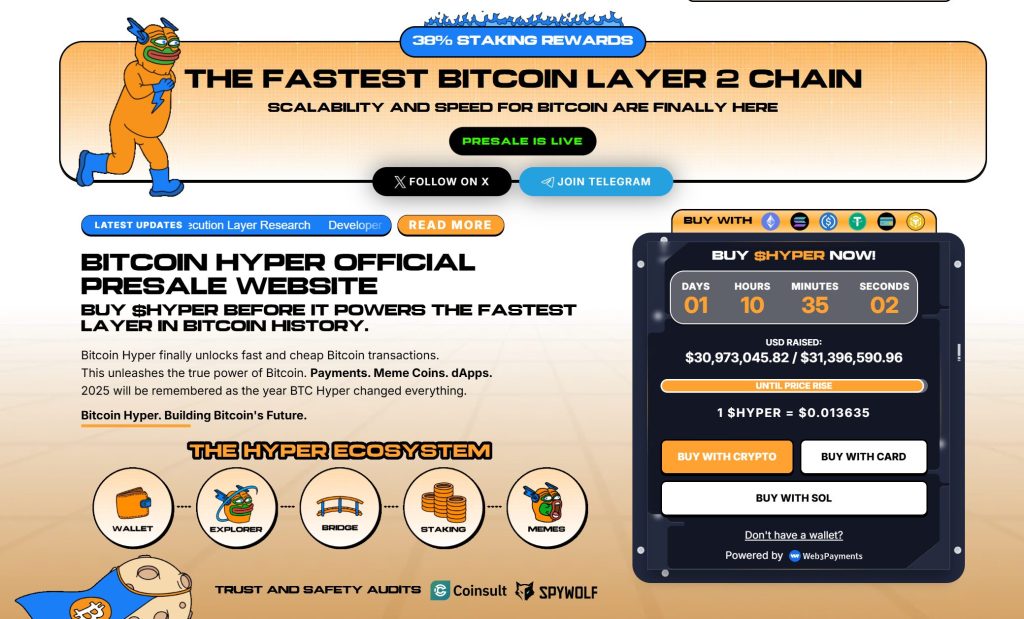
As Bitcoin activity climbs and demand for efficient BTC-based apps rises, Bitcoin Hyper stands out as the bridge uniting two of crypto’s biggest ecosystems. If Bitcoin built the foundation, Bitcoin Hyper could make it fast, flexible, and fun again.
Click Here to Participate in the PresaleThe post Ethereum Price Prediction: $3,000 Rejected, But On-Chain Data Tells Another Story appeared first on Cryptonews.
![]()