A new controversy has surfaced around Bitcoin (BTC) and other crypto assets held by the US government, following allegations raised by blockchain investigator ZachXBT.
Controlling Millions In Stolen Government Crypto
In a series of posts on social media platform X (previously Twitter), ZachXBT accused John “Lick” Daghita of stealing millions of dollars’ worth of seized digital assets from wallets linked to the US government.
John Daghita is the son of Dean Daghita, the president of CMDSS, a firm that publicly states it provides critical services to the US Department of Justice (DOJ) and the Department of Defense.
According to the investigation, the alleged theft came to light after a young hacker was provoked during a heated “band for band” argument on social media app Telegram.
During the exchange, which was fully recorded, the individual reportedly began screen-sharing his cryptocurrency wallets while boasting about his holdings. Those wallets were later traced to more than $40 million in seized crypto assets that belonged to the US government.
ZachXBT’s findings go further, claiming that the individual known online as “John (Lick)” was observed controlling wallets tied to more than $90 million in suspected illicit funds. Among those assets were cryptocurrencies linked to US government seizure addresses associated with the Bitfinex hack.
In the recordings reviewed by the investigator, John is seen actively managing multiple wallet addresses while millions of dollars’ worth of Ethereum (ETH) and Tron (TRX) were moved in real time, strongly suggesting direct control over the funds.
CMDSS Goes Dark, Suspect Alters Online Identities
Shortly after the allegations were made public, CMDSS appeared to remove its digital footprint. The company scrubbed its website, X account, and LinkedIn page.
Around the same time, John reportedly began changing his online usernames and deleting non-fungible token (NFT)-related handles from Telegram.
Despite these efforts, ZachXBT noted that John continued to taunt investigators and even sent him a small amount of ETH from one of the flagged wallets.
ZachXBT stated that he plans to return those funds directly to a US government seizure address, underscoring his position that the assets belong to the government.
Featured image from OpenArt, chart from TradingView.com
Chris Burniske, cofounder of Placeholder VC and former crypto lead at Ark Invest, is mapping out where he would consider stepping back into Bitcoin if the market keeps sliding, after earning fresh credit on X for calling major turning points this cycle. His framework lands in the mid-$80,000s down to the low-$50,000s, while a separate technical view from analyst Aksel Kibar points to a broader “base building” process with support clustered in the mid-$70,000s.
Price Levels Where To Buy Bitcoin
Burniske wrote that he is “not a buyer yet,” but outlined several price areas he’s monitoring. In his view, roughly $80,000 matters as the November 2025 low and a local trough of the current downswing. Below that, he highlighted roughly $74,000, tying it to the April 2025 low and describing it as the “Tariff Tantrum” bottom; he also noted it sits just under Strategy’s (MSTR) stated Bitcoin cost basis of around $76,000.
He then pointed to around $70,000 as the top of the prior $50,000–$70,000 band near the 2021 high, before shifting to a more structural level near $58,000. That zone, he wrote, aligns with the 200-week simple moving average and an on-chain cost basis, with RV around $56,000. Finally, he flagged $50,000 and below as a psychological line, arguing that a break under it would likely revive “death of BTC” narratives.
I’m not a buyer yet, but if I were to be a buyer, imo the areas to watch for $BTC are:
~$80K: Nov ’25 low, local low of this “bear”
~$74K: April ’25 low, Tariff Tantrum low, just below $MSTR‘s cost basis (~$76K)
~$70K: Top of $50-70K range, near ’21 high
~$58K: 200W SMA &…
Burniske’s posture is deliberately non-committal on timing. “Importantly, I don’t care what happens,” he wrote, adding that if Bitcoin rallies he will “ride what I have and diversify,” while a deeper unwind would have him buying more Bitcoin and “select crypto assets.”
The thread also touched altcoins. Asked how he thinks about alts versus Bitcoin, Burniske said it’s “best imo to buy alts after you think btc is near bottom,” reinforcing that he’s treating BTC’s downside process as the key gating factor for broader risk-taking. On positioning, he said he is sitting “in treasuries, where yield > inflation,” and when asked about an upside level that would force him back in, he replied that he “wouldn’t chase,” preferring to hold existing exposure rather than re-risk at higher prices.
Burniske’s renewed attention followed praise from Anthony Pompliano, who told him: “You nailed the SOL bottom and the BTC top over this cycle.” Burniske’s reputation for calling tops is partly tied to an October 2025 post in which he argued the market had likely been structurally damaged after a sharp selloff.
“We can always get another weak bounce, but I’ve taken action accordingly,” he wrote at the time. “I’ll likely get interested in the market again when I see BTC $75K or lower.”
Breakdown Or Bottoming Phase?
Separately, veteran technician Aksel Kibar posted a BTCUSD daily chart on Sunday without additional commentary. When asked directly about a breakout or breakdown, Kibar cautioned against overweighting diagonal formations: “Not giving too much weight to diagonal short-term patterns breakout/breakdown. I think this is part of the base building, searching for a bottom.”
Kibar had previously framed “technical support” as being “lower between 73.7K and 76.5K,” suggesting that if Bitcoin is indeed in a basing phase, the market may need time and repeated tests of those lower bands before a more durable trend reasserts itself.
The recent market downturn has not deterred analysts from maintaining a bullish outlook on the Bitcoin price. New reports from these market watchers suggest Bitcoin may be entering a new parabolic phase, potentially signaling the end of its prolonged correction. While one analyst points to BTC’s correlation with gold as a signal of a possible ATH, another applies an Elliott Wave analysis to set a new price target for the leading cryptocurrency.
Bitcoin Price Prepares For $245,000 Parabolic Move
A recent technical analysis by Crypto Tice suggests that gold has taken the lead, while Bitcoin currently stands at a transition point. The analyst presented a weekly price chart tracking both assets, and showing how gold’s price movement could be used to determine Bitcoin’s next parabolic move to a $245,000 all-time high.
The chart tracks gold and Bitcoin’s price action from 2016 through projected moves into 2026, showing a repeating pattern where uncertainty peaks in gold first. After which, capital flows into the precious metal, its price then breaks out and ranges, and then money rotates into BTC. Crypto Tice has said that this rotation phase has repeated in every market cycle.
In the first cycle, from July 2017 to Q4 2018, gold climbed to an all-time high before trading in a narrow range, signaling broader trend exhaustion rather than a breakdown. Shortly afterward, Bitcoin launched a strong rally, reflecting a rotation of capital from the precious metal into a higher-risk asset.
The same pattern appeared during the 2020-2021 cycle. Gold reached a new peak and stalled in a tight range, while Bitcoin followed with a powerful breakout to the upside. That surge aligned with another green profit rotation zone on the analyst’s price chart.
On the far right side of the chart, Crypto Tice has revealed that gold has once again reached a record high in the current cycle and is consolidating inside a red range. At the same time, Bitcoin has already moved sharply higher and is now experiencing a modest pullback. The analyst calls this overlap a “transfer window” between the two assets.
Crypto Tice noted that this recent pause mirrors the same pattern seen in past cycles before Bitcoin staged a major price rally. The analyst has predicted that if BTC continues to follow this historical trend, it could soon enter a new parabolic phase, potentially triggering a price surge above $245,000.
Elliott Wave Analyst Shares Next BTC Price Target
In a separate analysis, crypto market expert Merlijn the Trader has shared a video chart analysis showing a repeating Elliott wave structure that could indicate Bitcoin’s next potential bullish target. From late 2024 to mid 2025, BTC formed a five-wave pattern, creating higher lows and building a base that led to a significant price rally.
According to Merlijn the Trader, Bitcoin is repeating this five-wave pattern in the current cycle. Waves 1 through 3 are already complete, showing higher lows, while Waves 4 and 5 are forming a base following a massive price crash. Once this stage completes, the analyst predicts BTC could rally strongly from its current price above $87,900 toward $124,000.
Bitcoin traders are once again anchoring to FX, after intervention rumors around USD/JPY revived a familiar tug-of-war: short-term shock risk from a strengthening yen versus the longer-horizon bid that typically follows a softer dollar and easier global liquidity.
The spark over the weekend was a viral X thread (2.9 million views) from Bull Theory (@BullTheoryio), which framed reported “rate checks” by the Federal Reserve Bank of New York as a prelude to coordinated action. “The New York Fed has already done rate checks, which is the exact step taken before real currency intervention,” the account wrote. “That means the US is preparing to sell dollars and buy yen. This is rare. And historically, when this happens, global markets surge.”
Bitcoin In The Crosshairs
Bull Theory pointed to the macro backdrop in Japan, years of yen weakness, Japanese bond yields at multi-decade highs, and a still-hawkish Bank of Japan, as the pressure cooker forcing officials toward more aggressive signaling. In the thread’s telling, the key variable is coordination: Japan acting alone “does not work,” while joint US-Japan action “does,” citing 1998 and the Plaza Accord era as historical reference points.
A Bloomberg report cited by the account described the yen’s sharp jump on speculation that Japanese authorities could be preparing intervention to arrest the currency’s slide, after traders reported the New York Fed had conducted rate checks with major banks. The story said the yen rallied as much as roughly 1.6% to around 155.90 per dollar, marking its strongest level since December in that session.
THE FED IS PREPARING TO SELL U.S. DOLLARS AND BUY JAPANESE YEN FOR THE FIRST TIME THIS CENTURY.
The New York Fed has already done rate checks, which is the exact step taken before real currency intervention. That means the U.S. is preparing to sell dollars and buy yen.
The fight in the replies was less about whether markets moved and more about what a “rate check” actually signals.
Daniel Kostecki (@Dan_Kostecki) dismissed the viral framing outright, arguing the mechanism is often misread. “The Japanese asked the NY Fed to act as their agent in the American market,” Kostecki wrote. “NY Fed employees then started calling banks in New York to perform the ‘rate check’—strictly at the Japanese’s request. If officials from Tokyo had called New York banks, traders might have ignored it as a ‘local Japanese problem.’ But when the Fed calls, banks treat it as a signal that a joint intervention (USA + Japan) might be coming.”
That distinction matters for crypto because the thread’s “bull case” leans heavily on the idea that selling dollars to buy yen mechanically weakens the dollar and expands liquidity, conditions many macro-focused crypto traders associate with risk-asset upside.
Ted (@TedPillows) echoed the liquidity-first interpretation while flagging the path dependency. “The Fed is preparing for a possible yen intervention,” he wrote, before laying out the causal chain: dollars sold, yen bought, dollar weaker, liquidity higher, risk assets helped, then warning that “a strengthening yen could first cause a similar crash like in August 2024.” After that, he added, markets could stabilize and rally.
Michael A. Gayed (@leadlagreport), Portfolio Manager of The Free Markets ETF, offered a different rationale for why Washington would care, suggesting the Fed is acting to prevent a scenario where Japan would need to sell US Treasuries to raise dollars to intervene—“It’s not that Japan will panic. It’s the Fed that will panic,” he wrote.
Bull Theory’s most concrete crypto claim was that the setup contains both a near-term trap and a medium-term tailwind. The account argued there are “hundreds of billions of dollars tied into the yen carry trade,” meaning abrupt yen strength can force deleveraging in the very assets, stocks and crypto, funded with cheap yen borrowing.
As an example, the account pointed to August 2024, claiming a small BoJ rate hike pushed the yen higher and “Bitcoin crashed from $64K to $49K in six days,” with crypto losing “$600B in value.” Bull Theory framed that episode as the template for the “catch” in 2026: yen strength can be toxic in the first act, even if sustained dollar weakness ultimately improves the liquidity backdrop for Bitcoin.
LondonCryptoClub (@LDNCryptoClub) leaned into that lagged-liquidity framing, arguing that a weaker dollar tends to filter into risk assets with a delay, while also introducing an additional US liquidity variable. “Continued and accelerated breakdown of the dollar will be good for Bitcoin and broad risk over the next few months,” the account wrote, adding that the dollar “tends to act with a 3 months lag” outside of “knee jerk reactions.” It also warned that a potential US government shutdown and subsequent Treasury General Account rebuild could offset some of the positive liquidity impulse.
Over the weekend, volatility observed across the broader cryptocurrency market intensified, causing the price of Bitcoin to fall back to the $86,000 mark once again. Even with the bearish price action in the past few days, buying activity continues to pick up pace in the market, especially among large BTC holders.
Bitcoin’s Largest Wallets Show Conviction
Bitcoin’s price may have been struggling with heightened volatility as a result of the broader market bearish market action, but bullish sentiment remains present among investors. In the weakening condition, large BTC whales or deep-pocket investors’ sentiment turns positive and are steadily reentering the market.
Data from Santiment, a popular market intelligence and on-chain data platform, suggests that these major investors are building positions at an encouraging and steady pace, even though the broader momentum is demonstrating weakening conditions. In the past, long-term whale accumulation has typically happened in uncertain times when prices don’t accurately reflect underlying confidence.
Santiment noted that the buying activity is spotted among wallet addresses holding over 1,000 BTC. After months of consistent buying, the group has now collectively acquired about 104,340 BTC, which represents a more than 1.5% rise.
As a result of the recent purchase, the investors’ overall holdings are currently sitting at 7.17 million BTC, marking their largest level since September 15, 2025. These wealthy investors are subtly consuming available supplies rather than distributing into recent market swings, indicating confidence in Bitcoin’s medium- to long-term potential.
While buying pressure is growing among large Bitcoin holders, the number of whale transactions has also experienced a massive upswing. Santiment added that the amount of +$1 million daily transfers has exploded, reaching a 2-month high level.
A Continued Drop In BTC Open Interest
A continued drop in Bitcoin’s Open Interest is coinciding with the ongoing drop in price. Darkfost, a market expert and CryptoQuant author, highlighted that open interest is steadily declining, which does not support the emergence of a new trend as seen on the weekly change basis.
Since November, the metric has remained broadly negative, suggesting that the drop has continued for several weeks. Although there was a brief improvement earlier this month, it was followed by a price reaction.
Overall, when open interest rises, Darkfost stated that it mostly signals trend continuation to even a trend reversal, triggered by an influx of long positions. Furthermore, this is confirmed with funding rates, but this is what happens in most cases.
On Sunday, as BTC displays a steady correction, deleveraging also increased. While this is bearish in the short term, these phases simultaneously aid in cleaning the market of excessive leverage. Thus, it is critical to remember that futures are still the primary source of volume, making keeping an eye on developments there an essential move.
A new Bitcoin price prediction has been put forward following a long-term technical analysis shared on the social media platform X by crypto analyst Leshka.eth. The analysis compares Bitcoin’s current structure on the weekly timeframe to the 2021 market peak, showing how price behavior is repeating an identical pattern.
Based on how Bitcoin has interacted with a rising multi-year channel in previous cycles, the analysis proposes a projection as to how Bitcoin could be setting up for a powerful corrective move that sends the price back to as low as $30,000.
Bitcoin Weekly Structure About To Break
Technical analysis of Bitcoin’s price action on the weekly candlestick timeframe chart shows that the leading cryptocurrency has been trading with higher highs and higher lows since 2018. Interestingly, this trend of higher highs has led to repeated interaction with a rising resistance trendline that has defined every major cycle top.
As shown in the chart below, Bitcoin pushes into this upper boundary during each bull market, only to be rejected once momentum fades. These rejection points are clearly marked across multiple cycles, including the 2017 and 2021 peaks. This repeated failure is a defining feature of Bitcoin’s macro cycles of exhaustion after prolonged upside expansion.
Bitcoin once again rallied into this same long-term trendline when it broke to new all-time highs in October 2025 before stalling and rolling over. Bitcoin’s price failed to hold above the trendline and has corrected by about 30% since then. The leading cryptocurrency is now trading below $90,000, and this technical outlook introduces the possibility that the current pullback is not yet complete and could extend further.
The chart also highlights the depth of prior bear market declines once Bitcoin was rejected at this long-term structure. After the 2017 cycle top, Bitcoin fell roughly 84.99% from peak to trough. Following the 2021 high, Bitcoin once again declined by about 77.47% before finding a bottom near the lower boundary of the broader rising channel.
Based on the current setup, the projected downside move marked on the chart measures approximately 72.86%. Applying a drawdown of that magnitude from the recent cycle high places Bitcoin’s potential bottom around $30,000.
Interestingly, Grok AI offered a more optimistic interpretation of Bitcoin’s near-term outlook based on responses to questions under the same technical post. According to Grok, aggregated views from sources such as CNBC, Reddit, and Forbes suggest that the probability of Bitcoin dropping into the $30,000 to $40,000 range is relatively low, estimated at around 15% to 25% by bearish cycle models.
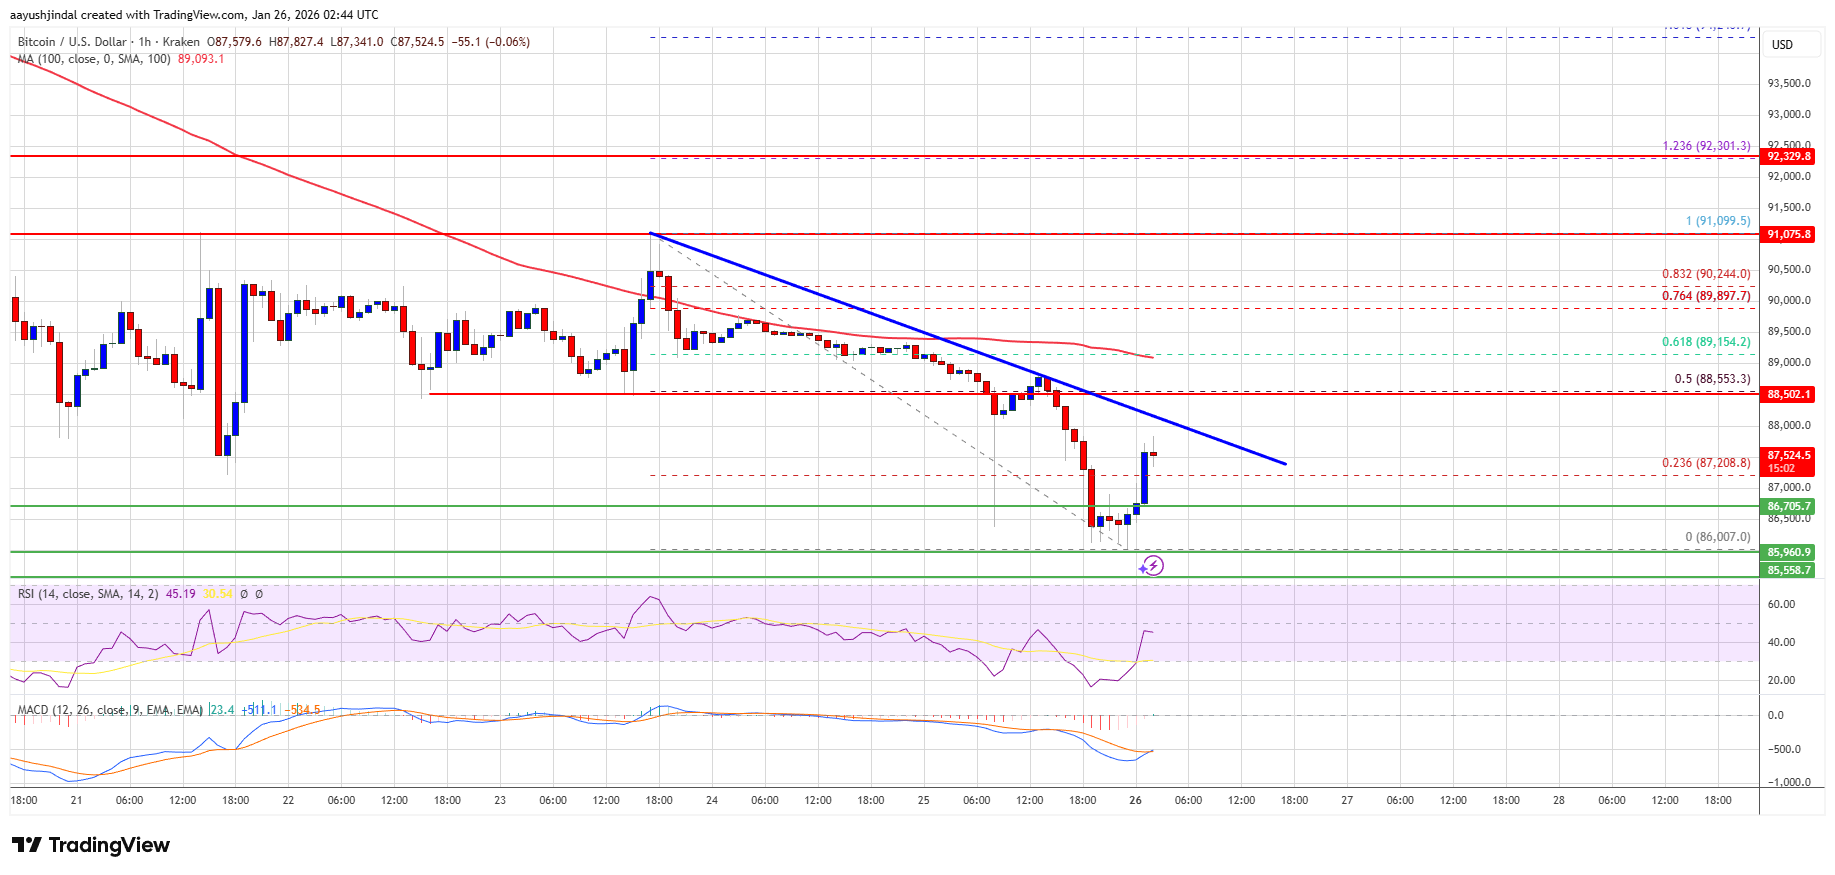
Bitcoin price extended losses and traded below $88,500. BTC is consolidating losses and might attempt a recovery wave if it clears $88,500.
Bitcoin started a minor recovery wave from the $86,000 level.
The price is trading below $88,200 and the 100 hourly Simple moving average.
There is a new bearish trend line forming with resistance at $88,000 on the hourly chart of the BTC/USD pair (data feed from Kraken).
The pair might recover if it manages to settle above $86,200 and $86,000.
Bitcoin Price Dips Further
Bitcoin price failed to stay above the $89,000 support and extended losses. BTC declined sharply below the $88,500 and $87,000 support levels.
The bears even pushed the price below $86,500. A low was formed at $86,007, and the price is now attempting a recovery wave. There was a move above the 23.6% Fib retracement level of the downward move from the $91,099 swing high to the $86,007 low.
Bitcoin is now trading below $88,500 and the 100 hourly Simple moving average. If the price remains stable above $86,500, it could attempt a fresh increase. Immediate resistance is near the $88,000 level. There is also a new bearish trend line forming with resistance at $88,000 on the hourly chart of the BTC/USD pair.
The first key resistance is near the $88,500 level since it is close to the 50% Fib retracement level of the downward move from the $91,099 swing high to the $86,007 low.
A close above the $88,500 resistance might send the price further higher. In the stated case, the price could rise and test the $89,200 resistance. Any more gains might send the price toward the $90,000 level. The next barrier for the bulls could be $91,000 and $91,500.
More Losses In BTC?
If Bitcoin fails to rise above the $88,500 resistance zone, it could start another decline. Immediate support is near the $86,700 level. The first major support is near the $86,200 level.
The next support is now near the $85,500 zone. Any more losses might send the price toward the $83,500 support in the near term. The main support sits at $82,500, below which BTC struggle to recover in the near term.
Technical indicators:
Hourly MACD – The MACD is now losing pace in the bearish zone.
Hourly RSI (Relative Strength Index) – The RSI for BTC/USD is now below the 50 level.
Major Support Levels – $86,700, followed by $86,000.
The calls of a potential Bitcoin supercycle in 2026 intensified over the past week after former Binance CEO Changpeng ‘CZ’ Zhao — yet another prominent voice in crypto — laid out his predictions for the new year. However, a popular analyst on the social media platform X has released an opposing view, predicting a deep bottom for the BTC price this year.
BTC Price At Risk Of Further 65% Decline
In a January 25th post on the X platform, prominent crypto trader Ali Martinez said, in a sarcastic tone, that “the super cycle is super cycling.” In what seemed like a response to the buzz around CZ’s Bitcoin supercycle projection, the market pundit tempered the expectations with a $31,000 price bottom call for the premier cryptocurrency in 2026.
This bearish prediction is based on the appearance of price fractals on the BTC chart. For context, fractals are repeating patterns in price charts that can help map and project potential price movements for a particular cryptocurrency (Bitcoin, in this scenario).
As observed in the chart above, the price of BTC is currently following a similar movement pattern as in 2022. The premier cryptocurrency, after initially setting a then all-time high around $67,000 in early 2021, witnessed a nearly 55% correction to just above the $30,000 level by mid-July.
While the price of Bitcoin recovered and went back to set a record high of above $69,000 by the end of 2021, the market leader spent the majority of the following year in a downward trend. Exacerbated by the various bearish events of 2022, BTC ended the year at a low of around $15,500.
Martinez believes that the Bitcoin price is undergoing a similar movement pattern, having experienced an over 32% decline before climbing to the current all-time high of $126,080. The market pundit postulates that the premier cryptocurrency is currently witnessing the extended decline that saw its price reach $15,500 in 2022.
However, it is worth mentioning that the target this time around lies at $31,800, nearly 65% drop from the current price point. Hence, if the historical patterns highlighted by Martinez are to go by, there seems to be a higher likelihood of the Bitcoin price embarking on an extended downward trend rather than a supercycle.
Bitcoin Price At A Glance
As of this writing, the price of BTC stands at around $88,528, reflecting an over 1% decline in the past 24 hours.
“Bitcoin is the digital gold” is one of the most popular narratives in the cryptocurrency industry, reiterating BTC’s growing status as a formidable store of value. However, while the premier cryptocurrency has floundered over the past months, gold and the metals market have largely witnessed explosive growth.
These contrasting performances have led to conversations about capital rotation between Bitcoin and gold, as the crowd expects one to always outperform the other at any given time. Recent data, however, suggests that the relationship between the BTC and gold price action is overrated.
Capital Flow Link Between BTC And Gold Overestimated
In a January 24 post on the X platform, on-chain analyst with the pseudonym Darkfost weighed in on the discourse surrounding capital rotation between gold and Bitcoin. According to the market pundit, the idea that investor funds flow from gold to Bitcoin is somewhat overblown.
To highlight this overestimation, Darkfost shared a chart showing periods where BTC outperforms or underperforms depending on gold’s trend. This chart typically provides two signals: positive (BTC above the 180-day moving average [MA] and gold below the 180-day MA) and negative (BTC below the 180-day moving average and gold below the 180-day MA).
As observed in the chart above and stated by Darkfost, the relationship between Bitcoin and gold does not appear to be fully substantiated. The on-chain analyst revealed that there have been as many positive periods as the negative ones, suggesting that the flagship cryptocurrency moves independently of gold.
Darkfost wrote:
This suggests that BTC continues to evolve independently, without clear evidence of a sustained capital rotation from gold.
Furthermore, Darkfost noted that a positive signal does not necessarily mean that capital is flowing out of gold into Bitcoin. According to the on-chain analyst, it is simply not possible to determine whether there is a capital flow relationship between the world’s largest cryptocurrency and gold.
Bitcoin & Gold Price Overview
While Bitcoin started the new year on a pretty strong note, the bullish momentum has pretty much waned over the past two weeks. Meanwhile, the gold price has continued to flourish this year, recently reaching a new all-time high above $4,900 per ounce.
As of this writing, the price of BTC stands at around $89,230, reflecting no significant movement in the past 24 hours. According to data from CoinGecko, the flagship cryptocurrency is nearly 30% adrift its all-time high above the $126,000 level.
The Bitcoin price action has been muted over the past few days, trading within the $90,000 and $88,000 levels. Classically, consolidation periods often precede major moves either to the upside or downside of the market.
As such, questions on the next trajectory of the flagship cryptocurrency are being asked. A latest on-chain evaluation has offered a positive prognosis on the next direction for the Bitcoin price.
Accumulation Demand Metric Surges To All-Time-High
In a Quicktake post on CryptoQuant, on-chain analyst CoinNiel hypothesized that the Bitcoin price could be at the beginning of a bullish trend. The market quant based this prognosis on two metrics — the Accumulator Address Demand and the Liquidity Inventory Ratio (month).
The Accumulator Address Demand metric monitors the net buying pressure coming from addresses that buy Bitcoin consistently, and without any significant selling. This behavior (of buying and rarely selling) is typical of the large-scale Bitcoin holders, commonly known as the whales.
Notably, CoinNiel also pointed out that when major withdrawals from exchanges occur, they are rarely ever incited by retailers, but by whales. As such, when the Bitcoin whales withdraw their holdings from exchanges, their buying pressure translates into an increase in the Accumulator Address Demand.
From the chart above, the indicator has reached an all-time high level. According to the crypto pundit, this could be a sign that the whales are currently experiencing, on intense levels, the “fear of missing out.”
The second metric, the Liquidity Inventory Ratio (Month), also reinforces CoinNiel’s bullish outlook. This metric tracks and compares existing Bitcoin demand to the supply available on exchanges, showing whether demand can overwhelm available supply.
When this ratio rises sharply, it is usually a sign that demand is absorbing newly created supply. From the data shared by the analyst, the Liquidity Inventory Ratio has also reached an extreme value of 3.8.
However, this extreme reading is only a reflection of what is happening on US exchanges. Hence, CoinNiel implied that, for the first time in years, US exchanges are recording exceptionally high demand relative to the coins available.
In theory, a 3.8 reading implies the imminence of a supply shock in the scenario where current conditions prevail. But, the analyst highlighted that it may not necessarily happen, as a 3.8 reading is more a sign of intensified whale demand than a surefire means to predict supply shocks.
The big picture, especially when these two metrics are looked at together, appears to be distinctly bullish. This is because available data points out that the whales are likely positioning for what could be a resumed bullish trajectory for the Bitcoin price.
Bitcoin Price At A Glance
As of this writing, Bitcoin is valued at $88,520, reflecting an over 1% decline in the past 24 hours.
The Bitcoin price is showing signs of history repeating itself, as current price action mirrors key patterns from the 2021 cluster. With resistance near $91,000–$92,000 and the macro downtrend looming, traders are watching closely to see if BTC will break higher or face renewed pressure. The coming days could prove decisive in shaping the next major move.
Bitcoin Mirrors 2021 Cluster: History In Motion
Bitcoin continues to mirror the price patterns seen during the 2021 cluster. Crypto analyst Rekt Capital noted that the current market structure is echoing historical behavior, suggesting that similar dynamics are at play. Traders are closely watching these familiar patterns to gauge whether the cycle is repeating itself or if new trends may emerge.
The rules of the game remain consistent. A bearish acceleration would likely be triggered if Bitcoin breaks down from the macro descending triangle base, currently positioned around $82,000. Conversely, a bullish bias would require a decisive break above the macro downtrend, which sits near $100,000. These levels serve as critical decision points for the market, dictating whether bulls or bears gain control in the coming sessions.
So far, Bitcoin has encountered rejection in the high $90,000s, falling just short of the macro downtrend. This mirrors previous market behavior, in which the asset developed a basing structure near the triangle’s base before attempting to push higher toward the downtrend’s upper boundary. It demonstrates that history is repeating itself for now, with the market consolidating and preparing for its next directional move.
If the macro downtrend continues to act as resistance, the triangle’s base may gradually weaken over time. Such a development would increase the risk of further downside, making the reaction at both the base and the downtrend crucial.
BTC Surpasses $91,000 Before Facing Selling Pressure
In a recent market update by Ted, it was noted that while Bitcoin broke above the $91,000 threshold yesterday, the rally met significant resistance. Sellers entered the market with substantial force at these local highs, effectively capping the momentum and preventing a sustained breakout.
As a result of this rejection, Bitcoin has retreated into the “no-trading zone.” Ted suggests that this period of sideways price action is likely to persist through the next couple of days, largely driven by the typical low-liquidity environment seen during the weekend.
Looking ahead, the outlook remains cautious. Ted emphasizes that any upward movements will likely be short-lived until BTC can decisively clear the $91,000 to $92,000 resistance zone. Meanwhile, such a move must be backed by strong spot demand to prove its validity.
Swiss banking giant UBS, with assets under management (AuM) of up to $7 trillion, is set to launch Bitcoin trading for some of its clients. This comes amid predictions that regulatory clarity and broader adoption could send the BTC price to as high as $200,000.
UBS To Offer Bitcoin Trading To Some Wealth Clients
Bloomberg reported that UBS is planning to launch crypto trading for some of its wealth clients, starting with its private bank clients in Switzerland. The bank will reportedly begin by offering these clients the opportunity to invest in Bitcoin and Ethereum. At the same time, the crypto offering could further expand to clients in the Pacific-Asia region and the U.S.
The banking giant is currently in discussions with potential partners, and there is no clear timeline for when it could launch Bitcoin and Ethereum trading for clients. This move is said to be partly due to increased demand from wealth clients for crypto exposure. UBS also faces increased competition as other Wall Street giants are working to offer crypto trading.
Morgan Stanley, in partnership with Zerohash, announced plans to launch crypto trading in the first half of this year, starting with Bitcoin, Ethereum, and Solana. The banking giant may soon also be able to offer its crypto products, as it has filed with the SEC to launch spot BTC, ETH, and SOL ETFs.
Furthermore, JPMorgan, another of UBS’ competitors, is considering offering crypto trading to institutional clients, although this plan is still in the early stages. The bank already accepts Bitcoin and Ethereum as collateral from its clients. Last year, it also filed to offer BTC structured notes that will track the performance of the BlackRock Bitcoin ETF.
Can Bank’s Entry Trigger A BTC Rally To $200,000
Kevin O’Leary predicted that Bitcoin could rally to between $150,000 and $200,000 this year, driven by the passage of the CLARITY Act. His prediction came just as White House Crypto Czar David Sacks said banks would fully enter crypto once the bill passes. As such, there is a possibility that BTC could reach this $200,000 psychological level in anticipation of the amount of new capital that could flow into BTC from these banks once the bill passes.
BitMine’s Chairman, Tom Lee, also predicted during a CNBC interview that Bitcoin could reach between $200,000 and $250,000 this year, partly due to growing institutional adoption by Wall Street giants. Meanwhile, Binance founder Changpeng “CZ” Zhao said that a BTC rally to $200,000 is the “most obvious thing in the world” to him.
At the time of writing, the Bitcoin price is trading at around $89,600, up in the last 24 hours, according to data from CoinMarketCap.
Bitcoin (BTC) is mirroring the same setup from its 2022 bull cycle, which led to a massive price crash to $20,000. According to market expert Crypto Bullet, this recurring structure could signal another major correction for BTC ahead. However, this time the leading cryptocurrency could give up almost a quarter of its current value.
2022 Bitcoin Chart Pattern Signals Over 20% Crash
In his technical analysis released on X, Crypto Bullet revealed that Bitcoin is currently repeating a 2022 structure that could lead to a more than 20% decline in its value. To support his bearish outlook, the analyst presented a parallel chart comparing Bitcoin’s price action from 2023-2022 and 2025-2026, highlighting similar technical patterns, price behavior, and Moving Averages (MA).
During the 2022 cycle, Bitcoin experienced a similar pattern, beginning with a test of the 100-day Moving Average (MA100), highlighted as the blue trendline on the chart. After facing rejection at that level, the price pulled back to a nearby support zone inside a rising channel. From there, BTC staged a sharp rally, surging to fresh highs around $48,500, where it aligned with the 200-day Moving Average (MA200), marked in orange.
However, the recovery proved short-lived. Bitcoin soon reversed course and failed to reclaim the MA200 as support. Once the cryptocurrency’s price structure was lost, downside momentum accelerated, pushing the price into a much deeper correction toward the $20,000 level.
According to Crypto Bullet, Bitcoin is repeating this exact pattern in 2026. It has already retested the MA100, gotten rejected, and moved lower into a support zone within a similar ascending channel. The chart also showed that in both cycles, BTC reached a “market cycle top,” first around December 2023 and then again in November 2025, before breaking down and entering a consolidation phase.
Given how closely Bitcoin is mirroring its 2022 setup, Crypto Bullet has forecast another dramatic price crash, predicting a more than 23.5% drop from its current price near $89,500 to $68,450. Before this decline happens, the analyst expects BTC to experience a short-term recovery, potentially climbing back above the $100,000 psychological level to reach $102,000.
Bitcoin Could Still Rally To $92,000
Crypto analyst Tyrex has stated that Bitcoin has been consolidating for the past 48 hours, with price holding above $89,000 for most of that period. Despite the muted price action, he believes that BTC could soon rally to $92,000. The analyst also noted that the broader market is in a state of fear, with many traders anticipating further declines in Bitcoin.
However, the analyst cautions that this expected drop may be a trap. He points out that an ascending channel is forming on Bitcoin’s chart, prompting him to adopt a more bullish outlook despite the prevailing bearish sentiment and sideways price movement.
Featured image from Unsplash, chart from TradingView
Over the past week, the price of Bitcoin faced a significant setback in its goal of reclaiming the six-figure threshold. The flagship cryptocurrency has been hovering around the $90,000 mark, as the market can’t seem to make a decision concerning the next price direction.
As Bitcoin faced a mild sell-off, which, in turn, drove its price to fall from its recent highs, specific market participants were under severe pressure, including the miners. Interestingly, a recent on-chain evaluation has raised the possibility that miners’ stress might be ending soon.
Miner Financial Health Flashes Classic Reversal Sign
In a January 23 post on the social media platform X, market expert Axel Adler Jr highlighted that the Bitcoin miners might have started their post-capitulation recovery journey. The relevant indicator here is the Miner Financial Health Index (7D-SMA).
For context, this metric tracks the balance between miner revenue and miner selling pressure. Hence, it reflects whether miners are net BTC distributors or accumulators. Simply put, the metric shows if Bitcoin miners are under pressure, stable, or even profitable.
Capitulation events often reflect on the Miner Health Index as a negative value, as the amount of BTC spent surpasses the amount of BTC earned. On the other hand, miners are typically said to be in the recovery phase when the balance between revenue and spending starts to lean away from the negative.
From the chart shared by the analyst, it is apparent that the index has taken on an uptrend, targeting neutral levels on the metric’s charts. History shows that the index does not merely target the neutral mark when it trends upward.
Hence, if history were to repeat itself, the Bitcoin miners could be in for a rewarding ride, having survived the most recent capitulation event. Interestingly, the price of Bitcoin appears to have a directly proportional relationship with the Miner Health Index.
Bitcoin Price Gathers Momentum As Market Condition Shifts
In a separate post on X, Bitcoin Vector highlighted that Bitcoin might be garnering strength for a significant move in the near term. According to the analytics platform, this development coincides with the market exiting what was previously a “high-risk environment.”
Bitcoin Vector explained that this exit from a risky market environment was last seen in April 2025, just before the bull run resumed. The on-chain analytics firm explained that we could be witnessing the late stages of a classic momentum bottoming pattern, which historically leads to large rallies.
Essentially, there has to be one last push lower in price and, at the same time, a momentum boost to the upside, for the bullish signal to be completely formed. As of this writing, Bitcoin is valued at around $89,830 with no significant movement in the past 24 hours.
The Bitcoin price had a relatively rough trading period over the past week, as it hovered around the psychological $90,000 mark. The flagship cryptocurrency, which looked set for a return to six-figure valuation barely over a week ago, now seems to have lost all its bullish momentum.
Broadly speaking, these recent struggles put to rest questions around the “relief rallies” to the upside, and correlate more with the current bear market structure. However, the latest on-chain evaluation shows that the Bitcoin price woes could worsen from here on out.
Expert Explains Why $60,000 Is Possible For BTC Price
In a recent post on the X platform, Alphractal CEO and founder Joao Wedson said that the Bitcoin price could still have room to fall below the $60,000 level. This not-so-optimistic prediction is based on the number of days Bitcoin has traded at prices higher than today.
According to Wedson, there have been 355 days when the Bitcoin price has traded at levels higher than today. This figure was derived from the “Days Spent at a Profit” metric, which tracks the number of days in Bitcoin’s history where the market price was higher than the current price.
This indicator measures how much price action — in the past — has occurred above the current price level. From a historical standpoint, an increase in the number of “Days Spent at a Profit” tends to occur during bear cycles or extended periods of sideways movement, implying that different investor groups are holding BTC at a price higher than their cost bases.
As Wedson highlighted, the “Days Spent at a Profit” metric reached around 775 days as the Bitcoin price approached a bottom. Going by this historical context, the current level of this indicator (355 days) suggests that the flagship cryptocurrency is still a distance away from extreme levels often associated with bearish market bottoms.
Ultimately, this deduction means that the price of Bitcoin could still be at risk of an extended decline over the next 300 days. According to the Alphractal, this extended period of price decline could see BTC revisit $60,000, potentially triggering significant liquidations among retail investors and institutional players who entered the market post-ETF.
Bitcoin Price At A Glance
As of this writing, the price of BTC stands at around $89,900, reflecting no significant change in the past 24 hours. However, the market leader is currently down by over 5% on the weekly timeframe, while nearly 30% adrift its all-time high of $126,080.
The price of Bitcoin registered a hot start to the new year, making a run to reclaim the highly coveted $100,000 level in the early days of January. While the premier cryptocurrency has cooled off over the past few days, optimism has never been this high in the market over the last couple of months. Adding to this optimism is Binance’s co-founder and former CEO, Changpeng ‘CZ’ Zhao, who predicted an extremely positive outlook for Bitcoin in 2026.
BTC Could Abandon 4-Year Cycle Theory In 2026: CZ
In a CNBC interview at the World Economic Forum, CZ said that he has “strong feelings” that the Bitcoin price will enter a supercycle in 2026. This prediction came as a response to the interviewer’s question about Zhao’s Bitcoin price outlook.
In an economic context, a supercycle refers to an extended period characterized by the explosive growth of an asset or sector. Unlike a typical short-term rally triggered by hype and speculation, supercycles signal a significant shift underpinned by strong fundamentals over an extended period.
Zhao explained to the interviewer that the price of Bitcoin moves in a four-year cyclical pattern, spanning periods of all-time highs and cycle lows. However, the former Binance CEO agreed with the ongoing narrative that believes that the premier cryptocurrency will break the four-year cycle theory this year.
When asked about his strategy and current portfolio, CZ mentioned that he doesn’t trade the crypto market but rather accumulates coins with long-term promise. Specifically, the prominent crypto leader said that he keeps accumulating Bitcoin and BNB, the Binance ecosystem’s native token.
In his interview, CZ also talked about life after his four-month stint in jail, mentioning his work with YZi Labs, Giggle Academy, and as a crypto advisor to various governments. Zhao, who received a pardon from United States President Donald Trump in October 2025, clarified the rumors around receiving clemency for violating the US Bank Secrecy Act.
It is worth noting that CZ is not the first personality in the crypto space to speak about the Bitcoin price abandoning the halving-associated four-year cycle for a supercycle. Fidelity Labs managing partner, Parth Gargava, had echoed a similar sentiment about the BTC market earlier in the new year.
Gargava highlighted three drivers as the factors behind the transition from the typical four-year cycle to a supercycle. “Steady buy-in by institutions focused on ETFs, policy, and market maturation and changing correlations,” the Fidelity executive listed as the catalysts behind the shifting market landscape.
Bitcoin Price At A Glance
As of this writing, the price of BTC stands at around $89,460, reflecting no significant movement in the past day.
Bitcoin’s push to $97,600 last week drew a burst of bullish options activity, but Glassnode argues the derivatives tape looked more like short-dated positioning than broad-based conviction. In a Jan. 23 thread, the on-chain analytics firm pointed to a split between front-end call demand and longer-dated risk pricing that stayed anchored in downside protection.
“Let’s deep dive into options market behavior during last week’s move to 97.6K, and how options metrics help gauge conviction behind the move,” Glassnode wrote. The core takeaway: upside flow showed up, but it didn’t meaningfully change how the market priced risk further out the curve.
What Bitcoin Traders Can Learn From Last Week’s Rally
Glassnode first focused on near-term skew. Around mid-January, BTC rose roughly 8% over a few days, and the 1-week 25-delta skew moved sharply toward neutral from “deep put territory.” That kind of front-end shift can look like a market flipping bullish—until you check whether the same repricing is happening in longer expiries.
“Careful though,” Glassnode warned. “Near-dated call demand is often misread as directional conviction.” The thread paired that point with flow data: the options volume put/call ratio dropped from 1 to 0.4, signaling a surge in call activity. But, as Glassnode framed it, the question is not whether calls were bought, but how short-dated that demand actually was.
The longer-dated picture was notably less enthusiastic. Glassnode said the 1-month 25-delta skew “only moved from 7% to 4% at the low,” staying in put asymmetry even as the 1-week skew fell from 8% to 1%. On the 3-month 25-delta skew, the shift was even smaller (less than 1.5%) and it “stayed firmly in put territory,” continuing to price asymmetric downside.
For Glassnode, that divergence matters because it separates “flow” from “risk pricing.” Upside participation can be real, but if the market does not reprice skew across maturities, it suggests traders are not extending that optimism into a higher-conviction, longer-horizon view.
The volatility tape reinforced the same message. “Layering in ATM implied volatility, we see vol being sold as price moved higher,” Glassnode wrote. “Gamma sellers monetized the rally. This is not the volatility behavior typically associated with sustained breakouts.”
That combination: front-end call demand alongside vol supply can align with tactical positioning rather than a regime change. It can also leave spot moves more vulnerable if follow-through buying does not materialize once short-dated structures roll off.
Glassnode closed with a checklist for what a cleaner breakout would look like: “An ideal breakout setup combines spot pressing key levels, skew pointing higher with conviction across maturities, and volatility being bid. Last week’s move didn’t meet those conditions.”
For traders watching whether BTC can revisit $97,600, the thread’s implication is straightforward: monitor whether longer-dated skew begins to lift out of put territory and whether implied volatility starts to get bid, not sold, as spot tests key levels again.
Litecoin is once again at a critical crossroads, with its long-term structure remaining intact after years of successful defenses. However, the margin for error is thin. As price hovers near key levels, $63 has emerged as the line bulls must protect. A break below it could shift momentum sharply, while holding above keeps the broader bullish structure alive and sets the stage for the next decisive move.
Structure Gives Way, Expansion Phase Begins
Columbus’s latest LTC update highlights that the multi-year compression that previously capped price action has finally resolved, resulting in a clean break of the long-term chart setup. This structural change confirms a shift from a neutral state to a clearly bullish one.
The current price action is described as a pause before expansion rather than the conclusion of the rally. In this phase, Litecoin is holding steady above old resistance levels, allowing the market to load for the next leg of the move, turning previous barriers into new support. Litecoin’s projected path forward is based on the typical behavior of expansion cycles following structural breaks.
The strategy follows a clear three-step progression: the initial breakout, followed by the current phase of acceptance. Once the market fully accepts these new price levels, the “real move” begins, representing a phase where the most significant gains are expected to materialize.
The 9-Year Trendline That Still Controls Litecoin
Matthew Dixon highlighted the immense historical significance of the Litecoin long-term trend line. This line has acted as an unbreakable floor for nine years, with the price never closing below it. While the market has dipped under this line multiple times in the past, every attempt to break down has ultimately failed, maintaining a remarkably consistent structural defense.
Currently, the market environment is putting this nearly decade-long support to the test once again. Dixon emphasizes that we cannot rely on intra-month volatility to determine the outcome. Instead, the definitive signal rests solely on the monthly candle close. This closing price will serve as a macro-economic pivot point that dictates the primary direction for the coming months.
A successful hold above the trend line would be a powerful bullish confirmation, suggesting the long-term uptrend remains intact despite external pressures. Conversely, a confirmed close below this line would shift the narrative to bearish, marking a historic breakdown of a nine-year support system.
Specific technical triggers are also in play, particularly the $63 level. Dixon warns that falling below $63 would be devastating, as it would effectively nullify the hidden bullish divergence currently supporting the price. Given these risks, Dixon recommends exercising patience until the monthly close or ensuring strict stop losses are in place for any active trades.
The US crypto market has welcomed a new entrant as 21Shares rolls out its Spot Dogecoin ETF, giving investors another avenue to engage with the infamous dog-themed meme coin. Trading kicked off amid a mix of curiosity and caution, with on-chain data already showing how much the DOGE ETF has performed so far.
21Shares Launches Dogecoin ETF
In a press release on Thursday, January 22, 21Shares announced the official launch of its Spot Dogecoin ETF, TDOG, which began trading on NASDAQ the same day. The new ETF provides investors with direct exposure to Dogecoin through a fully backed, regulated, and transparent vehicle. Each ETF share is also backed 1:1 by DOGE held in institutional-grade custody.
Notably, the launch of the new TDOG ETF brings the total number of US Dogecoin ETFs to three, joining Grayscale’s GDOG and Bitwise’s BWOW. 21Shares is also the only ETF provider endorsed by House of Doge, the official corporate arm of the Dogecoin foundation, highlighting the global asset manager’s close ties to the meme coin.
As one of the largest crypto ETF issuers, 21Shares continues to expand its crypto product lineup with the introduction of TDOG. This follows the investment company’s previous ETF offerings, including TSOL, a Solana ETF released in November 2025; ARKB, a Spot Bitcoin ETF launched in January 2024; and TETH, an Ethereum ETF introduced in July of the same year. Together, these products demonstrate 21Shares’ commitment to providing institutional-grade access to high-demand digital assets.
Federick Brokate, Global Head of Business Development at 21Shares, highlighted DOGE’s large and active global community, calling it a unique digital asset with constantly growing use cases. He added that the new TDOG ETF will give investors regulated, physically backed exposure through a familiar ETF structure they know and trust.
Marco Margiotta, the CEO of House of Doge, also shared comments on the recently launched 21Shares ETF. He said that TDOG is a step toward making Dogecoin easier to access through traditional financial systems. He also disclosed that House of Doge’s partnership with 21Shares will help more people get involved as the Dogecoin ecosystem grows.
How 21Shares Dogecoin ETF Has Performed So Far
Contrary to expectations, 21Shares’ recently launched Dogecoin ETF saw weak performance on the first day of trading, signaling investors’ lack of interest in the investment product. Data from SoSoValue shows that TDOG experienced no inflows on January 22 and instead declined by about 0.07%. Despite it being the second day of trading, the DOGE ETF has still not registered any flows.
This lackluster performance has been observed across all Dogecoin ETFs this week. Grayscales’ GDOG and Bitwise BWOW have reported zero inflows over the last week. The last time GDOG saw positive activity was on January 8, when it received around $333,083 in investments. Before that, the ETF recorded its highest inflows on January 2, totaling roughly $2.3 million. Since its launch in November 2025, GDOG ETF inflows have been unstable, with more days of inactivity than significant investment.
Michael Saylor says Strategy’s evolving capital-markets machine is starting to resemble a “central bank of Bitcoin,” positioning the company as a conduit between traditional money markets and the Bitcoin network. In an interview with Gatecast, the Strategy executive chairman argued the firm’s shift toward perpetual preferred equity and “digital credit” instruments is designed to fund continuous bitcoin accumulation while stripping out refinancing risk.
Saylor traced the company’s pivot to the COVID-era shock of 2020, when “the physical economy of the world came to a grinding halt and the financial system was turned upside down.” Facing what he framed as an existential decision, he said Strategy discovered Bitcoin during “the war on COVID and the war on currency,” and used it to “escape a pretty miserable existence and turned into something digital and modern and much better.”
Strategy Is Building A ‘Central Bank of Bitcoin’
That transformation now sits on a scale Saylor claims is often misunderstood. Addressing criticism that Strategy is simply levering up to buy more Bitcoin, he said the firm has raised roughly $44 billion over the past year and a half and characterized “most of that” as equity rather than debt. “There isn’t really leverage,” Saylor said. “Equity is capital that you have forever. We’re funneling that capital into the crypto economy. We’re buying Bitcoin.” He added that Strategy has acquired “about $48 billion worth of Bitcoin” across “like 88 different transactions,” purchasing “as soon as we raise the capital.”
When asked whether Strategy is still just a buyer or something closer to a “shadow central bank of Bitcoin” given its holdings, Saylor leaned into the analogy. “Bitcoin is digital capital. It is the world reserve capital network. It’s replaced gold as the global non-sovereign store of value for the human race,” he said. Then came the framing: “Banks normally buy credit. We actually sell credit. So what we’re doing is the reverse of commercial banking, retail banking. It is sort of like central banking. We are sort of like the central bank of Bitcoin.”
Saylor’s “central bank” claim hinges on a product stack meant to translate Bitcoin’s balance-sheet asset into yield-bearing instruments for investors who won’t hold BTC directly. He described STRC as “a currency that’s pegged to the dollar” and “backed […] with Bitcoin,” with proceeds recycled into BTC purchases. In his telling, that mechanism links “the Bitcoin economy” to “the traditional finance economy and to the money markets of the world.”
The more material shift, he argued, is Strategy’s progression away from maturity-driven debt toward perpetual structures. Saylor laid out a four-stage evolution: initial use of credit and leverage, a senior note secured by BTC collateral that the company later refinanced and vowed not to repeat, then non-recourse convertible bonds, an approach he said became constrained by market size and retail inaccessibility and finally “digital credit,” which he described as “an equity […]a perpetual preferred equity.”
In one of his clearest statements of intent, Saylor said Strategy’s priority is to prevent principal from ever coming due. “We don’t want to have leverage. We want to have amplification via equity. We never want the principal to come due. We’d rather pay a higher dividend forever,” he said. “I’d rather pay 10% forever than pay 5% for 5 years.” Strategy, he added, has “announced a $1.44 billion cash reserve for the dividends,” giving it “the option to not raise any capital in the capital markets for up to two years,” and in his view “effectively stripped the credit risk off of the business.”
Saylor also pitched liquidity as a differentiator. He said Strategy has raised $7 billion over the last nine months via these instruments and described an emerging market of about $8 billion outstanding. Where preferred stocks typically trade thinly, he argued Strategy’s “digital credit instruments were trading 30 million a day,” with “Stretch […] more than a hundred million a day,” which he framed as a step-change in market access.
The firm’s investor pitch, as Saylor described it, splits the world into capital and credit buyers. “Bitcoin is digital capital. The world will be built on digital capital. But the world will run on digital credit,” he said, arguing that products like Stretch can offer a money-market-like alternative “powered by digital capital” while sidestepping Bitcoin’s volatility.