Bitcoin Finds A Real-World Use Case In Las Vegas Stores
Small shops and some bigger chains in Las Vegas are now taking Bitcoin for everyday buys. People scan a QR code, pay from a phone, and the merchant gets paid. According to local reports, owners are trying this out to cut the cost of credit card processing and to attract customers who prefer crypto.
Merchants Cut Costs With Bitcoin
Reports say the move is largely about fees. Credit card processing often takes away 2.5–3.5% of a sale. For many small operators, that is painful. Payment tools that accept Bitcoin — often routed over the Lightning Network or through services that can convert crypto to cash — have lowered that burden for merchants.
According to FOX5, more businesses across Las Vegas are now accepting Bitcoin payments, from chains like Steak ’n Shake to small shops and medical practices. Merchants said Bitcoin helps attract new customers and cut costs, while Square has enabled about 4 million U.S. merchants…
— Wu Blockchain (@WuBlockchain) January 24, 2026
Square’s program, which lets millions of US merchants enable Bitcoin checkout with no processing fee through 2026, helped speed up adoption in the area.
Stores Report Real Transactions
Business owners are reporting real use, not just experiments. Juice stands and cafes have processed payments. Some larger outlets are listed on public payment maps so customers can find them.
This has meant more foot traffic from people who travel with crypto or who prefer to keep their cards for other uses. Reports note both new customers and savings on fees as clear benefits.
Lightning Network Speeds Up PaymentsThe Lightning Network is being used to make payments faster and cheaper at the cash register. It moves small Bitcoin payments quickly without the long wait a base-layer transfer can cause.
Merchants scan a code or show one on a screen. The payment is then sent from the buyer’s wallet and settled almost instantly. This technical fix has made in-person Bitcoin payments workable for the first time at many spots.
How Owners See ItOwners are balancing savings against new risks. Some keep crypto for a short time, then sell it for cash. Others leave part of their receipts in Bitcoin. Chargebacks, a problem with cards, are reduced when crypto is used.
A few places say small boosts in sales followed their switch to crypto, yet long-term patterns are still being watched. Reports have disclosed these mixed outcomes as part of a slow but clear shift.
Customers Find New Ways To PayShoppers are adapting. Tourists who carry crypto find these spots useful. Locals who are curious try the method at least once. Payment apps and merchant directories make the process easier for everyone.
For those who like simple steps, scanning a QR code and approving a payment on a phone works fine. For others it is a novelty that might stick.
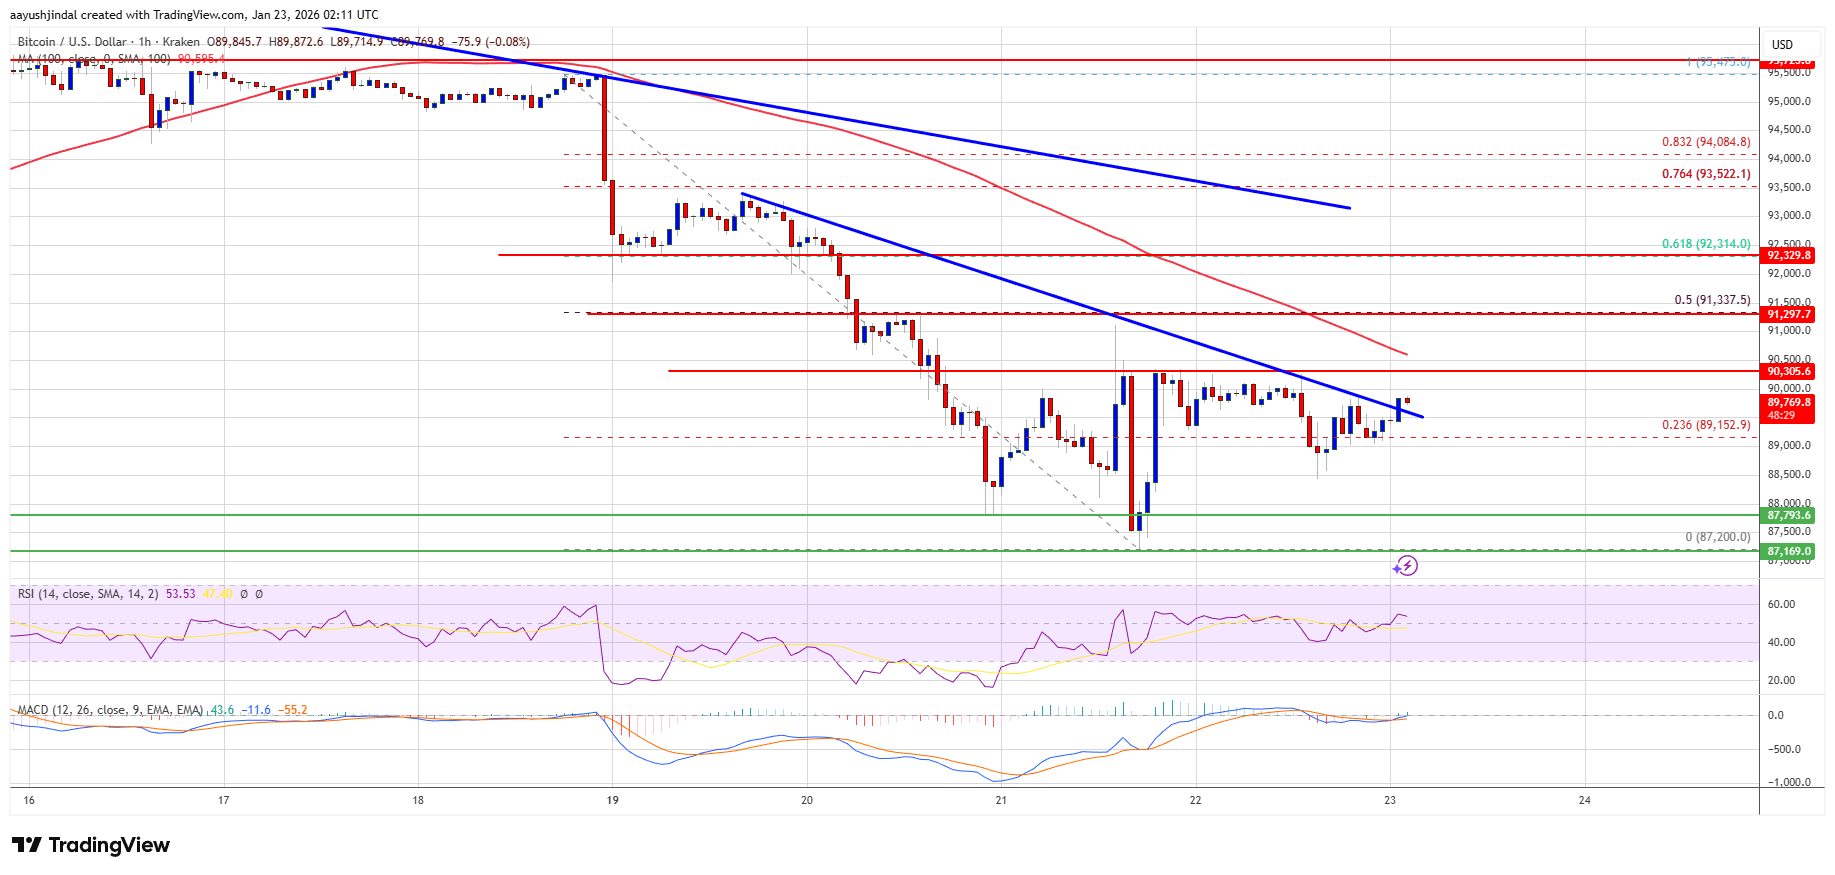
Featured image from Unsplash, chart from TradingView
![]()
![]()