Normal view

There are new articles available, click to refresh the page.
Yesterday — 5 December 2025Main stream

$62,000 Ethereum? Tom Lee Revives Bullish Call For 2026

5 December 2025 at 21:00

Tom Lee has reiterated one of the most aggressive Ethereum targets in the market, telling attendees at Binance Blockchain Week on 4 December that ETH could eventually trade at $62,000 as it becomes the core infrastructure for tokenized finance.

“Okay, so let me explain to you why Ethereum, now that we’ve talked about crypto, […] is the future of finance,” Lee said on stage. He framed 2025 as Ethereum’s “1971 moment,” drawing a direct analogy to when the US dollar left the gold standard and triggered a wave of financial innovation.

Lee’s Thesis For Ethereum

“In 1971, the dollar went off the gold standard. And in 1971, it galvanized Wall Street to create financial products to make sure the dollar would be the reserve currency,” Lee argued. “Well, in 2025, we’re tokenizing everything. So it’s not just the dollar that’s getting tokenized, but it’s stocks, bonds, real estate.”

In his view, this shift positions ETH as the primary settlement and execution layer for tokenized assets. “Wall Street is, again, going to take advantage of that and create products onto a smart contract platform. And where they’re building this is on Ethereum,” he said. Lee pointed to current real-world asset experiments as early evidence, noting that “the majority of this, the vast majority, is being built on Ethereum,” and adding that “Ethereum has won the smart contract war.”

Lee also stressed that ETH’s market behavior has not yet reflected that structural role. “As you know, ETH has been range bound for five years, as I’ve shaded here. But it’s begun to break out,” he told the audience, explaining why he “got very involved with Ethereum by turning Bitmine into an ETH treasury company, because we saw this breakout coming.”

The core of his valuation case is expressed through the ETH/BTC ratio. Lee expects Bitcoin to move sharply higher in the near term: “I think Bitcoin is going to get to $250,000 within a few months.” From there, he derives two key ETH scenarios.

First, if the ETH/BTC price relationship simply reverts to its historical mean, he sees substantial upside. “If ETH price ratio to Bitcoin gets back to its eight year average, that’s $12,000 for Ethereum,” he said. Second, in a more aggressive case where ETH appreciates to a quarter of Bitcoin’s price, his long-standing $62,000 target emerges: “If it gets to 0.25 relative to Bitcoin, that’s $62,000.”

🔥 TOM LEE CALLS FOR $62,000 $ETH

“I think Ethereum’s going to become the future of finance, the payment rails of the future and if it gets to .25 relative to Bitcoin that’s $62,000. Ethereum at $3,000 is grossly undervalued.” pic.twitter.com/VydvLou9IE

— CryptosRus (@CryptosR_Us) December 4, 2025

Lee links these ratios directly to the tokenization narrative. “If 2026 is about tokenization, that means Ether’s utility value should be rising. Therefore, you should watch this ratio,” he told the crowd, arguing that valuation should track growing demand for ETH blockspace and its role as “the payment rails of the future.”

He concluded with a pointed assessment of current levels: “I think Ethereum at $3,000, of course, is grossly undervalued.”

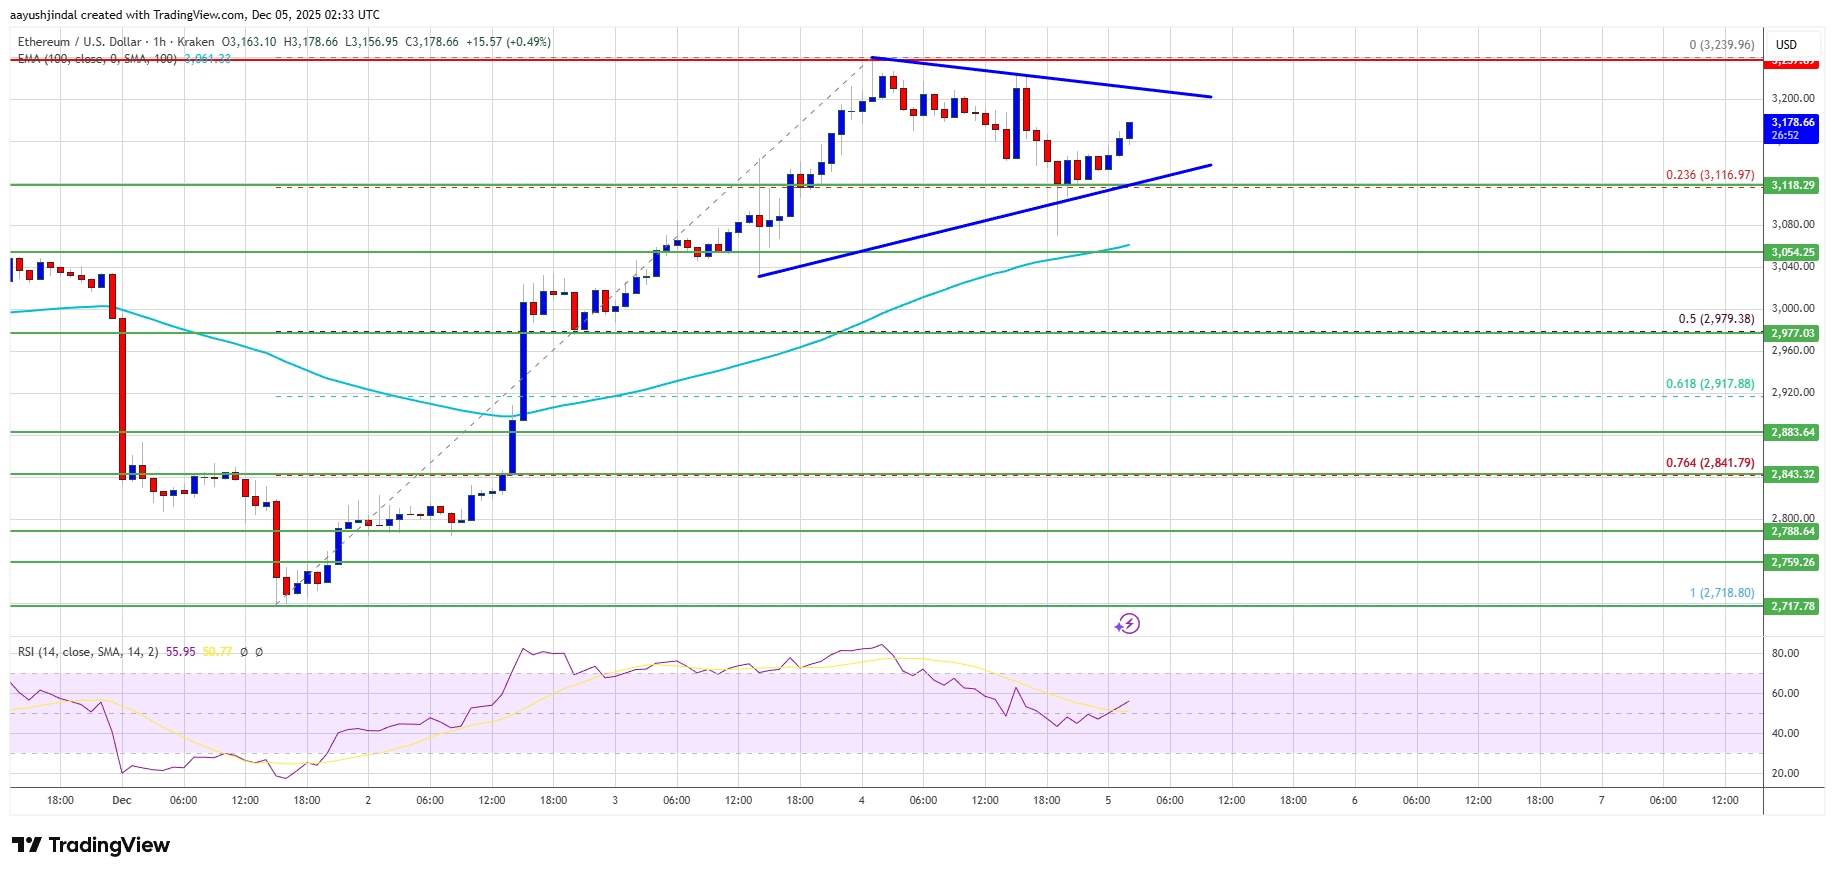
At press time, ETH traded at $3,128.

Ethereum price

Ethereum Spot Volume Weakens As Futures Take Control Of Price Direction

5 December 2025 at 15:00

Ethereum has retraced from the $3,240 level and is now testing the $3,150 zone as support, a key area that traders are closely watching. Bulls are attempting to defend this level after a modest rebound, but uncertainty remains high as the market tries to establish direction following weeks of volatility and aggressive selling pressure. While some analysts view this consolidation as the early stages of a recovery, others warn that ETH may still be vulnerable to deeper pullbacks if momentum fails to strengthen.

According to top analyst Darkfost, Ethereum’s recent price action is being shaped by a notable shift in market structure. Over the past few days, spot volumes have continued to decline, even as the price attempted a small recovery. This weakening in spot activity reduces the impact of actual buying and selling on the underlying asset, making futures markets increasingly influential in dictating short-term price direction.

As Darkfost explains, when spot volume thins out, futures often become the dominant driver of volatility. This dynamic can accelerate both upside and downside moves, depending on traders’ positioning. With Ethereum now sitting at a critical support level, the market awaits clearer signals to determine whether this rebound can evolve into a sustained recovery or merely represents a temporary pause in the downtrend.

Futures-Driven Momentum Raises the Stakes for Ethereum

Darkfost expands on this dynamic by noting that when spot volumes weaken to the extent seen over the past few days, the risk of heightened volatility increases sharply. Thin spot liquidity means fewer buy and sell orders are available to absorb sudden moves, allowing futures-driven momentum to exert an outsized influence on price. This environment often produces sharper swings and rapid directional shifts, as leveraged traders and algorithmic strategies dominate short-term market behavior.

Ethereum Spot Volume Bubble Map | Source: CryptoQuant

For now, the futures market is tilting upward, providing a constructive force that is helping Ethereum hold above the $3,150 support zone. Darkfost emphasizes that this upward pressure from futures could work in the bulls’ favor, as volatility—if it expands to the upside—may push the spot market to follow the same trajectory.

In other words, a sustained futures-led rebound could act as the spark needed for a broader recovery, especially if spot buyers gain confidence and begin re-entering the market.

However, this setup cuts both ways. Without stronger spot participation, any reversal in futures positioning could quickly translate into accelerated downside pressure. For now, Ethereum sits in a delicate phase where volatility is both a potential catalyst and a potential threat, making the next few sessions crucial for determining the market’s short-term direction.

ETH Weekly Structure Holds Key Support

Ethereum’s weekly chart shows a market attempting to stabilize after a steep downturn from the $4,500 region. ETH has rebounded toward $3,140, reclaiming its 100-week moving average (green line) — a historically important support level that often defines the boundary between mid-term bullish and bearish phases. This bounce signals renewed demand at a critical zone, especially after the strong wick rejection seen near $2,700, where buyers stepped in aggressively.

ETH consolidates around key level | Source: ETHUSDT chart on TradingView

However, Ethereum still faces meaningful resistance overhead. The 50-week moving average (blue line), now hovering near $3,400–$3,500, has flipped into resistance and remains the next major hurdle for bulls. A successful reclaim of this zone would materially improve ETH’s technical structure and open the door to a challenge of higher levels. Until then, the weekly trend remains neutral to slightly bearish.

Volume offers an encouraging signal: the recent rebound occurred with a noticeable uptick in buying activity compared to prior weeks, suggesting strengthened interest at these lower levels. Yet the broader structure shows a pattern of lower highs since August, meaning ETH must demonstrate follow-through to avoid slipping back into deeper consolidation.

Featured image from ChatGPT, chart from TradingView.com

Ethereum Shows Signs Of Accumulation As CVD Strengthens And Correlation Stays Elevated

5 December 2025 at 09:00

Ethereum is holding firmly above the $3,150 level as the market shifts into a more bullish phase after enduring weeks of heavy selling pressure and fear-driven liquidation. The recovery has sparked debate among analysts: some view the bounce as nothing more than a relief rally within a broader bearish trend, while others believe Ethereum may be building the foundation for a more sustained rebound.

A new CryptoQuant report offers one of the clearest insights. According to Ethereum data on Binance, the past several weeks have shown heightened volatility in the Cumulative Volume Delta (CVD) — a metric that tracks real-time buying and selling pressure. This volatility reflects sharp, rapid shifts in trader behavior as the market attempts to stabilize.

Although Ethereum remains in a downtrend from its August peak, recent CVD spikes point to the return of notable buying activity. However, the report emphasizes that these bursts of demand are sporadic and lack the sustained strength needed to confirm a full bullish reversal.

CVD Volatility Highlights Ongoing Battle Between Buyers and Sellers

According to the Arab Chain report, Ethereum’s CVD recently turned positive, coinciding with the price’s attempt to stabilize above the $3,100 level. This shift indicates fresh liquidity entering the market through short-term buy orders, suggesting that some traders are stepping in to accumulate during dips.

However, the sudden spikes and rapid pullbacks within the CVD reveal that the market remains locked in a strong tug-of-war between buyers and sellers. This volatility underscores the fact that Ethereum has not yet reached either temporal stability or a clear structural trend.

Binance Ethereum CVD Momentum & Price Correlation | Source: CryptoQuant

The report also highlights the importance of the 30-day correlation between price and CVD, which has held steady at around 0.6 despite lower price levels. This relatively high reading shows that liquidity flows continue to influence Ethereum’s price direction in a meaningful and consistent way. Even though buying pressure appears irregular, its recurring impact on price suggests that traders are still actively responding to market conditions.

Overall, this pattern reflects investors attempting to capitalize on volatility, especially as anticipation grows around potential liquidity inflows tied to upcoming network upgrades. Yet, Arab Chain stresses that without a more sustained accumulation phase and reduced short-term selling, Ethereum may struggle to generate a decisive upward movement.

Ethereum Attempts a Recovery but Faces Key Resistance

Ethereum’s latest price action shows a cautious recovery as ETH climbs back above the $3,150 level, but the chart reveals that the broader structure remains fragile. After a steep decline from the October highs near $4,500, ETH found support slightly above $2,700, where buyers stepped back in with increased volume—visible in the recent surge of green candles at the bottom of the chart. This reaction suggests renewed interest at lower levels, but not yet a decisive shift in trend.

ETH testing key resistance | Source: ETHUSDT chart on TradingView

The price is now pressing against the 100-day SMA (red line), a level that previously acted as support and has now flipped into resistance. Reclaiming this line would be an important step toward restoring bullish momentum. Above it, ETH faces another barrier at the 50-day SMA (blue line), which continues to slope downward, reflecting ongoing medium-term selling pressure.

Despite the rebound, volume remains inconsistent, indicating hesitation among market participants. ETH will need stronger follow-through buying to challenge the next resistance zone around $3,300–$3,350, a region aligned with previous breakdown levels.

Featured image from ChatGPT, chart from TradingView.com

Before yesterdayMain stream

Ethereum Tightens Uptrend Structure as Market Eyes Another Wave of Gains

4 December 2025 at 22:08

Ethereum price started a fresh increase above $3,200. ETH is now consolidating gains and might aim for more gains above $3,250.

  • Ethereum started a fresh increase above the $3,050 and $3,120 levels.
  • The price is trading above $3,120 and the 100-hourly Simple Moving Average.
  • There is a short-term contracting triangle forming with support at $3,130 on the hourly chart of ETH/USD (data feed via Kraken).
  • The pair could continue to move up if it settles above the $3,240 zone.

Ethereum Price Eyes Another Upside Break

Ethereum price managed to stay above $2,920 and started a fresh increase, like Bitcoin. ETH price gained strength for a move above the $3,000 and $3,050 resistance levels.

The bulls even pumped the price above $3,150.  However, the bulls struggled to clear $3,240 and $3,250. A high was formed at $3,239 and the price recently corrected some gains. There was a spike below the 23.6% Fib retracement level of the recent move from the $2,718 swing low to the $3,239 low.

Ethereum price is now trading above $3,120 and the 100-hourly Simple Moving Average. There is also a short-term contracting triangle forming with support at $3,130 on the hourly chart of ETH/USD.

Ethereum Price

If there is another upward move, the price could face resistance near the $3,200 level. The next key resistance is near the $3,240 level. The first major resistance is near the $3,250 level. A clear move above the $3,250 resistance might send the price toward the $3,320 resistance. An upside break above the $3,320 region might call for more gains in the coming days. In the stated case, Ether could rise toward the $3,450 resistance zone or even $3,500 in the near term.

Downside Correction In ETH?

If Ethereum fails to clear the $3,240 resistance, it could start a fresh decline. Initial support on the downside is near the $3,120 level. The first major support sits near the $3,050 zone.

A clear move below the $3,050 support might push the price toward the $3,000 support. Any more losses might send the price toward the $2,980 region and the 50% Fib retracement level of the recent move from the $2,718 swing low to the $3,239 low in the near term. The next key support sits at $2,850 and $2,840.

Technical Indicators

Hourly MACDThe MACD for ETH/USD is gaining momentum in the bullish zone.

Hourly RSIThe RSI for ETH/USD is now above the 50 zone.

Major Support Level – $3,130

Major Resistance Level – $3,240

Ethereum Coils For A Breakout As IH&S + Heavy Accumulation Emerges

4 December 2025 at 22:00

Ethereum is approaching a critical moment as multiple bullish signals begin to align. A clear Inverse Head & Shoulders formation, combined with rising accumulation and weakening trend rejection, suggests that the market may be gearing up for a powerful upside move. With momentum tightening and key levels coming into focus, ETH now stands on the verge of a breakout that could set the stage for its next major rally.

Inverse Head And Shoulders Signals Brewing Momentum

According to a recent update shared by crypto analyst Donald Dean, Ethereum may be gearing up for a significant move. He highlighted the development of a potential inverse head and shoulders pattern, a classic bullish reversal formation that often precedes strong upward momentum. This emerging structure suggests that ETH could soon shift into a more aggressive bullish phase if confirmed.

Dean also pointed out that the weekly chart is showing solid support near the 50% Fibonacci retracement level, positioned around $2,750. Adding to the bullish signals, a hammer candle has appeared on the weekly timeframe, hinting at buying pressure stepping back in after recent downside movement.

Ethereum

If the pattern plays out, Dean noted that Ethereum’s first major target lies at $4,109, a level that would allow ETH to challenge previous resistance/support zones. Reclaiming this region would mark a meaningful shift in momentum and strengthen the bullish outlook for the asset.

Beyond that, the next upside target sits near $5,766, which aligns closely with the 1.618 Golden Ratio extension calculated at approximately $5,793.51. Dean described this confluence as particularly noteworthy, suggesting that if Ethereum breaks above its nearer targets, a larger rally toward this golden-ratio level becomes a realistic possibility.

Growing Accumulation Suggests Bulls Are Preparing For Action

In an earlier analysis, LSTRADER reminded followers of the impressive move from $1,600 to $4,800, noting that this surge had been identified in advance through both the ETH chart and the ETH/BTC setup. The analysis captured the momentum shift that preceded the rally, reinforcing the value of tracking key structural signals.

In the current market structure, LSTRADER noted that the chart clearly shows multiple instances where the trend faced rejection. Despite these rejections, the trend is steadily losing strength while accumulation continues to build, a combination that typically reflects growing bullish interest and the potential for an upward breakout.

However, LSTRADER stressed that no major move should be assumed until the trendline itself is broken, and confirmation is still required. For now, patience is key as traders continue monitoring the structure and waiting for a decisive shift in trend direction.

Ethereum

Ethereum Back At $3,200 As Sharks Show Strong Accumulation

4 December 2025 at 20:00

Ethereum has witnessed a recovery surge recently as on-chain data shows the shark-sized investors have been participating in strong buying.

Ethereum Sharks Have Added 450,000 ETH Since Mid-November

According to data from on-chain analytics firm Santiment, the supply of the Ethereum sharks has gone up recently. The indicator of relevance here is the “Supply Distribution,” measuring the total amount of tokens that a given wallet group as a whole is holding right now.

In the context of the current topic, the cohort of focus is the one corresponding to a coin range of 1,000 to 10,000 ETH. At the current exchange rate, the lower bound of the range roughly converts to $3.2 million and the upper one to $32 million. Investors of this large size are popularly known as the sharks. While not as massive as the whales (addresses with more than 10,000 ETH), the sharks are still considered influential entities. This can make their behavior often worth keeping an eye on.

As the chart below, shared by Santiment, suggests, the latest Ethereum shark behavior has been one of accumulation.

Ethereum Shark Supply

During the November price decline, the Supply Distribution had been going down for the Ethereum sharks, but around the time of the market bottom, its trend began to reverse. Between November 18th and December 2nd, the sharks added a total of 450,000 ETH (worth about $1.4 billion) to their wallets, a massive amount. Alongside this sharp uptick in the metric, ETH went through its price recovery.

The cryptocurrency’s sharp retrace to start December didn’t dissuade these large hands, either, as their supply only continued to rise. This may be one of the factors behind the quick resumption of bullish momentum that the asset has seen. Another bullish factor has been the trend in the Network Growth, another on-chain indicator displayed in the chart. This metric measures the daily number of addresses that are coming online on the Ethereum network for the first time.

A wallet is considered “online” when it participates in transaction activity on the blockchain, so the Network Growth essentially tracks the addresses making their very first transfer.

From the graph, it’s visible that this Ethereum metric has also surged recently, hitting a peak value of 190,000 addresses. Generally, a surge in network activity is usually a positive sign for any rally’s sustainability, as it implies that the network is able to attract fresh attention.

That said, too much attention too fast can actually end up having a negative effect on the cryptocurrency. It now remains to be seen whether the sharks will continue to buy in the near future and if investor FOMO will remain at healthy levels.

ETH Price

At the time of writing, Ethereum is floating around $3,185, up more than 5% over the last seven days.

Ethereum Price Chart

Reversal Loading? Bitcoin, Ethereum, And Solana Build Powerful High-Time-Frame Structures

4 December 2025 at 19:00

In the volatile theatre of the cryptocurrency market, Bitcoin, Ethereum, and Solana are showing signs of a potential high-time-frame reversal. After weeks of stress and price compression, each of the top assets is now stabilizing at key structural support levels. The multiple leading cryptocurrencies are flashing similar recovery setups at the same time.

The current crypto landscape may be setting up one of the most powerful high-time-frame reversals across Bitcoin, Ethereum, and Solana. An investor and trader known as MacroCRG on X highlighted that yesterday, all three assets printed a bullish engulfing candle, a strong signal that buyers are stepping back in with intent.

Market Leaders Hint At A Shift Before Smaller Assets Follow

On the weekly chart, each asset is showing the early stages of an inside-week breakout paired with a false breakdown. MacroCRG pointed out that a similar structure on the ES (S&P 500 futures) chart from April, where the breakdown of inside-week structure led to a breakout that never looked back when the bull secured the weekly close.

Related Reading: Institutions Exit Bitcoin In Large Tranches, Ethereum, Solana And XRP See Massive Buy-Ins

For this setup to take hold, these prices need to close the week above the key highlighted highs on the chart. However, there’s still a long way to go before the weekly close will confirm the breakout, and the bulls need to follow through with conviction and remove any doubt.

The founder of the ProMintClub investment community, ProMint, has spotted a high-conviction whale trader aggressively building long positions across the crypto market. Currently, the trader is leading the Lighter leaderboard with over $64 million in profit and loss, while maintaining an 83% long bias. His Lighter account has the highest profit and loss with over $8 million. These are insane numbers compared to everyone else on the leaderboard.

Bitcoin

Data shows that the trader has made five deposits into his Lighter account, which total around $6 million in capital. His positions are spread across BTC, ETH, SOL, AAVE, along with smaller plays such as PAXG and PUMP, consistently entering at strong timing points and riding momentum higher.

Even though funding costs have flipped heavily negative, he is not backing down. Presently, this is the top-performing account on Lighter, and this is serious capital deployed with conviction.

How Increased Partners Drive Sustained Volume Demand

According to Chainflip Labs, November marked one of the strongest performance months in the protocol’s history, clearing over $583 million in swap volume, which is the second-best month ever for the network. 

Demand remained sustained across BTC, ETH, and SOL routes, and more partners are routing flow through the network than ever before. The trend clearly shows that Chainflip will continue to scale.

Bitcoin

Ethereum NUPL Holds Steady, Signaling Market Balance Amid Volatility

4 December 2025 at 18:00

Ethereum is demonstrating notable relative strength after reclaiming the $3,150 level and attempting to push higher, offering a refreshing shift in sentiment following weeks of intense selling pressure, fear, and market-wide uncertainty. As the broader crypto landscape begins to stabilize, ETH stands out as one of the assets showing early signs of recovery, drawing renewed attention from traders and long-term investors alike.

A key factor supporting this shift is the Net Unrealized Profit/Loss (NUPL) reading for Ethereum on Binance, which is currently sitting around 0.22 while price trades near $3,100.

This level reflects a delicate equilibrium between fear and optimism, indicating that a significant portion of ETH holders remain in moderate profit. Importantly, NUPL has not yet moved into the “greed” zone typically seen in the late stages of a bullish cycle, suggesting that the market is far from overheated.

Instead, Ethereum appears to be transitioning into a more neutral, constructive phase where investors are cautiously optimistic but not excessively euphoric. This balance often forms the foundation for a healthier recovery, especially after a deep correction. If momentum continues building and NUPL remains stable or trends higher, ETH could be positioning itself for a stronger upside move in the coming weeks.

NUPL Signals a Transitional Market Phase

Arab Chain notes that Ethereum’s NUPL index experienced a significant rise between June and August, reaching levels far higher than today and reflecting strong profitability across the network during mid-2025. At that time, investor sentiment leaned toward optimism, supported by rising prices and improving macro conditions.

Ethereum Net Unrealized Profit and Loss | Source: CryptoQuant

However, as Ethereum’s price began to decline steadily from October onward, unrealized profits started to shrink. This pushed NUPL down toward more neutral territory, signaling a shift in sentiment from elevated optimism to a more grounded, cautious outlook.

Crucially, NUPL has not fallen into negative territory, meaning the average ETH holder has not transitioned into unrealized losses. This is an important sign of underlying market strength. When investors remain in profit, they tend to be less motivated to sell aggressively at lower prices, reducing the risk of panic-driven capitulation and helping stabilize price action during corrections.

Taken together, these signals indicate that Ethereum is currently in a transitional phase. The market is neither euphoric nor fearful—rather, it is waiting for a decisive catalyst to define the next trend. As long as NUPL stays above 0.20, Ethereum retains a meaningful level of investor confidence, increasing the likelihood of a rebound if liquidity strengthens or positive fundamental developments emerge.

ETH Rebounds Strongly on the Weekly Chart

Ethereum’s weekly chart shows a powerful rebound as price surges back above the $3,150–$3,200 region, reclaiming a critical support band that had turned into resistance during the November sell-off. The long lower wick from last week’s candle confirms strong buy-side interest around the $2,700–$2,800 zone, an area that has historically acted as a major demand region during multi-month corrections.

ETH consolidates above key level | Source: ETHUSDT Chart on TradingView

ETH has now reclaimed the 100-week SMA, a key trend indicator currently positioned near $2,900, signaling renewed structural stability. The 200-week SMA, sitting comfortably lower, continues to reinforce the long-term uptrend. However, the 50-week SMA, which has flattened and now looms around the $3,350–$3,400 level, represents the next significant resistance level. ETH will need a decisive weekly close above this moving average to confirm a true shift back into bullish momentum.

Volume on the rebound is notably stronger than in previous consolidation phases, suggesting increased participation and growing confidence among market participants. However, ETH is not yet in the clear. The series of lower highs since the September peak forms a descending structure that must be broken for a sustained uptrend to resume.

Featured image from ChatGPT, chart from TradingView.com

Ethereum Whale Redistribution Continues: Moves 5,000 ETH As Price Reclaims $3K Level

4 December 2025 at 18:00

Ethereum is showing notable relative strength as it reclaims the $3,150 level and attempts to push higher, signaling early signs of recovery after weeks dominated by heavy selling pressure, fear, and uncertainty. The broader market rebound has helped restore confidence, but ETH’s ability to outperform key altcoins highlights growing demand and improved sentiment around the asset.

Adding to the renewed optimism, fresh on-chain data from Lookonchain reveals a significant move from one of the market’s most recognized whales. During the rebound, whale 0xdECF deposited another 5,000 ETH—worth approximately $15.52 million—into Binance.

This wallet has become well-known for sending large batches of ETH to exchanges throughout the recent downturn, often coinciding with moments of heightened volatility and capitulation.

Its latest deposit suggests that the whale remains highly active and responsive to market conditions. While such movements can sometimes introduce uncertainty, they also highlight increasing liquidity and engagement from major holders. With price reclaiming key levels and whales repositioning, Ethereum enters a critical phase where sustained strength could confirm a broader shift in market structure.

Ethereum Whale Distribution Highlights Market Caution

According to Lookonchain, whale 0xdECF has sold 25,603 ETH—valued at approximately $85.44 million—across Binance and Galaxy Digital since October 28. Despite this substantial distribution, the wallet still holds 5,000 ETH (around $15.52 million), suggesting that the whale has not fully exited its position but has significantly reduced exposure during the recent market decline.

Ethereum Whale Transfers | Source: Lookonchain

This pattern of behavior provides important insight into sentiment among large holders: while they are not abandoning Ethereum entirely, they are actively managing risk and responding to volatility more aggressively than usual.

Such persistent selling pressure from a large wallet often acts as a drag on price during periods of weakness, especially when market liquidity is thin. However, the fact that the whale continues to retain a meaningful position indicates an expectation of potential recovery—or at least a desire to remain strategically exposed to future upside.

Ethereum now finds itself in a critical phase. The asset has reclaimed key levels, but its mid-term structure remains highly sensitive to macro conditions and whale behavior. If selling from major holders slows and accumulation begins to outpace distribution, the recent rebound could solidify into a sustained trend. Otherwise, renewed sell flows could place Ethereum at risk of revisiting lower support zones.

ETH Reclaims Short-Term Momentum but Faces Heavy Resistance

Ethereum’s daily chart shows a clear improvement in momentum after reclaiming the $3,150–$3,200 region, but the broader structure remains fragile. The bounce from the $2,750–$2,850 support zone marked a decisive shift in buyer behavior, with strong lower wicks indicating aggressive demand. This rebound has pushed ETH back above key short-term levels, yet the asset still faces a challenging path forward.

ETH testing critical supply level | Source: ETHUSDT chart on TradingView

Price is now approaching the 50-day SMA, currently sloping downward just above $3,250, which now acts as immediate resistance. This moving average has capped every rally since late October and remains the first major barrier for bulls to reclaim. Beyond it, the 100-day SMA around $3,450 and the 200-day SMA near $3,600 form a tight cluster of overhead resistance that defines the medium-term downtrend.

Volume on the recent bounce is stronger than previous attempts, signaling that buyers are showing more conviction compared to the mid-November attempts to recover. However, the overall trend still leans bearish until ETH can break above the 50-day SMA and begin closing daily candles over $3,300.

Ethereum sits in a critical inflection zone: holding above $3,100 strengthens the case for continued recovery, while rejection from the $3,250–$3,300 band could trigger another retest of the $2,800 region. The next few sessions will determine whether this rebound evolves into a deeper trend reversal.

Featured image from ChatGPT, chart from TradingView.com

Fusaka Upgrade Reignites Confidence in Ethereum, Analysts Eye $3,500 Target

4 December 2025 at 17:00

Ethereum (ETH) is topping talks once again as its Fusaka upgrade goes live and the ETH price returns firmly above the $3,200 mark. After weeks of choppy trading and lingering fear across the broader crypto market, the combination of a major technical overhaul and rising on-chain activity is giving traders a fresh narrative to follow.

Related Reading: Eric Trump Says Bitcoin Could Hit $500,000, Stands By ABTC Strategy

In the last 24 hours, ETH has climbed around 4–5%, outperforming most large-cap cryptos and reclaiming a key psychological zone near $3,200. Market data shows rising volumes and a noticeable pickup in accumulation from larger holders, even as sentiment indicators still sit in “Fear” territory.

Ethereum ETH ETHUSD ETH price

Fusaka Upgrade Shifts Focus Back to Ethereum’s Scaling Roadmap

The Fusaka upgrade, Ethereum’s second major network update of 2025, activated at block height 18,200,000. At its core is PeerDAS, a data availability sampling system that lets nodes store only slices of blob data instead of entire payloads.

This change is estimated to expand blob throughput by roughly eight times, easing congestion and helping layer-2 networks push more transactions through Ethereum’s base layer.

Developers describe Fusaka as another step in Ethereum’s long-term scaling roadmap, aligning the main chain with growing layer-2 activity.

Beyond PeerDAS, the upgrade bundles a series of Ethereum Improvement Proposals that tweak gas limits, transaction sizes, cryptographic support, and block configuration, aiming to improve efficiency while keeping validator requirements manageable.

Whales, ETFs and Technical Signals Cluster Around $3,500

On-chain data shows “shark” wallets holding between 1,000 and 10,000 ETH have ramped up accumulation in recent weeks, buying aggressively on dips around $2,700–$3,000.

Institutional interest also appears to be rising. BitMine has reportedly added more than 18,000 ETH to its treasury ahead of Fusaka, while U.S. spot Ethereum ETFs have recorded notable net inflows.

Technically, ETH is trading around $3,200 with analysts watching resistance between $3,300 and $3,500. Short-term models project a move toward roughly $3,537 within days, implying upside of about 10% if the current trend holds.

However, indicators remain mixed. The broader setup is still labelled “bearish,” and any pullback could see ETH retesting support around $3,100, $3,000, or even the $2,850 zone.

Related Reading: XRP Price Is Performing As Expected; Analyst Reveals What Comes Next

For now, the Fusaka upgrade has shifted the conversation back to fundamentals, with Ethereum’s price action testing whether renewed confidence is enough to carry it through the $3,500 barrier.

Cover image from ChatGPT, ETHUSD chart from Tradingview

Ethereum Fusaka Is Live: Buterin Explains Why It Is ‘Significant’

4 December 2025 at 09:00

Ethereum’s Fusaka upgrade is now live on mainnet, marking a major structural change in how the network handles data and scaling. The upgrade was activated at epoch 411392 at 21:49:11 UTC, with the official Ethereum account first signalling “upgrade in progress . . . activating Fusaka @ epoch 411392 // 21:49:11 UTC” and then confirming that “Fusaka is live on Ethereum mainnet!”

In its announcement, the account highlighted three core elements of Fusaka. PeerDAS “now unlocks 8x data throughput for rollups,” substantially expanding the amount of data that rollup-based layer 2 networks can publish to the network. The upgrade also introduces “UX improvements via the R1 curve & pre-confirmations,” and is described as explicit “prep for scaling the L1 with gas limit increase & more.” The project added that community members and core developers will “continue to monitor for issues over the next 24 hrs.”

Why Fusaka Is ‘Significant’ For Ethereum

Vitalik Buterin framed the core of the upgrade in unusually direct terms. “PeerDAS in Fusaka is significant because it literally is sharding,” he wrote. “Ethereum is coming to consensus on blocks without requiring any single node to see more than a tiny fraction of the data. And this is robust to 51% attacks – it’s client-side probabilistic verification, not validator voting.” In other words, the network can now agree on blocks even though no node has to download all of the associated data, relying instead on probabilistic verification on the client side.

Buterin tied this to a long-running research line, noting that “sharding has been a dream for Ethereum since 2015, and data availability sampling since 2017,” and linking back to early research work on data availability and erasure coding. With Fusaka, that architecture is no longer just a roadmap concept but a live mechanism securing Ethereum’s data layer.

At the same time, Buterin was clear that Fusaka does not complete the sharding roadmap. He stressed that “there are three ways that the sharding in Fusaka is incomplete.” First, he argued that “we can process O(c^2) transactions (where c is the per-node compute) on L2s, but not on the ethereum L1,” adding that “if we want to scaling to benefit the ethereum L1 as well, beyond what we can get by constant-factor upgrades like BAL and ePBS, we need mature ZK-EVMs.”

Second, he pointed to the “proposer/builder bottleneck,” where “the builder needs to have the whole data and build the whole block,” and said “it would be amazing to have distributed block building.” Third, he noted bluntly: “We don’t have a sharded mempool. We still need that.”

Despite those caveats, Buterin called Fusaka “a fundamental step forward in blockchain design.” He argued that “the next two years will give us time to refine the PeerDAS mechanism, carefully increase its scale while we continue to ensure its stability, use it to scale L2s, and then when ZK-EVMs are mature, turn it inwards to scale ethereum L1 gas as well.”

He closed by sending “big congrats to the Ethereum researchers and core devs who worked hard for years to make this happen,” underscoring that for the Ethereum community, Fusaka is not a routine protocol update but the arrival of a long-promised sharding era on mainnet.

At press time, ETH traded at $3,194.

Ethereum price

Ethereum Surges Above $3,200 as Traders Eye a Stronger Bullish Extension

3 December 2025 at 22:18

Ethereum price started a fresh increase above $3,120. ETH is now attempting to clear the $3,250 resistance and might accelerate higher.

  • Ethereum started a fresh increase above the $3,000 and $3,120 levels.
  • The price is trading above $3,150 and the 100-hourly Simple Moving Average.
  • There is a bullish trend line forming with support at $3,120 on the hourly chart of ETH/USD (data feed via Kraken).
  • The pair could continue to move up if it settles above the $3,250 zone.

Ethereum Price Eyes More Gains

Ethereum price managed to stay above $2,880 and started a fresh increase, like Bitcoin. ETH price gained strength for a move above the $2,950 and $3,000 resistance levels.

The bulls even pumped the price above $3,120.  However, the price is now testing a key barrier at $3,250. A high was formed at $3,239 and the price is now consolidating above the 23.6% Fib retracement level of the recent move from the $2,718 swing low to the $3,239 low.

Ethereum price is now trading above $3,150 and the 100-hourly Simple Moving Average. If there is another upward move, the price could face resistance near the $3,250 level.

Ethereum Price

The next key resistance is near the $3,265 level. The first major resistance is near the $3,320 level. A clear move above the $3,320 resistance might send the price toward the $3,450 resistance. An upside break above the $3,450 region might call for more gains in the coming days. In the stated case, Ether could rise toward the $3,500 resistance zone or even $3,540 in the near term.

Downside Correction In ETH?

If Ethereum fails to clear the $3,250 resistance, it could start a fresh decline. Initial support on the downside is near the $3,160 level. The first major support sits near the $3,120 zone and the trend line.

A clear move below the $3,120 support might push the price toward the $3,050 support. Any more losses might send the price toward the $2,980 region and the 50% Fib retracement level of the recent move from the $2,718 swing low to the $3,239 low in the near term. The next key support sits at $2,920 and $2,880.

Technical Indicators

Hourly MACDThe MACD for ETH/USD is gaining momentum in the bullish zone.

Hourly RSIThe RSI for ETH/USD is now above the 50 zone.

Major Support Level – $3,120

Major Resistance Level – $3,250

DoD employees under Federal Wage System to get long-delayed pay raise

Tens of thousands of blue-collar Defense Department workers are slated to receive their long-delayed 2024 pay raises. The raises were stalled for nearly a year after Defense Secretary Pete Hegseth’s purge of advisory committees halted the DoD Wage Committee’s ability to authorize new wage schedules.

The DoD Wage Committee met last week for the first time this year to approve publication of 2024 updates to about 1,600 wage schedules covering 250 wage areas. 

These raises will match the General Schedule locality increases, and they will be applied retroactively according to when they should have taken effect last year. DoD workers could see the pay bump reflected in their next paychecks.

“It will probably be in the next paycheck, or possibly a separate check. It will depend on which payroll processor is being used,” Jacqueline Simon, American Federation of Government Employees’ director of public policy, told Federal News Network. 

“There might be some other agencies, like the Bureau of Prisons, Social Security, even the Department of Veterans Affairs that might be more delayed. But I’m told the Defense Finance and Accounting Service says it will be the next paycheck,” she said. 

For blue-collar federal employees under the Federal Wage System, the process of getting a pay raise is more complex than for most General Schedule employees. While the GS base pay schedule is adjusted annually each January with an across-the-board pay increase set by the president or Congress, FWS adjustments are based partly on that overarching raise and partly on wage surveys conducted by the DoD Wage Committee, which then votes to implement new schedules region by region throughout the year.

But in March, Hegseth launched a review of all advisory committees, requiring them to justify their existence. He instructed the committees to explain how their advice “benefited the DoD, the federal government, and the United States,” and how it aligned with President Donald Trump’s goals and the department’s priority of “restoring the warrior ethos.” Hegseth dismissed all members of the advisory committees in April.

The DoD Wage Committee — made up of three agency officials and two union leaders, and whose sole function is to approve wage schedules for FWS employees — has been unable to meet since then.

“We don’t provide advice per se. We look through all the data, at the way the calculations were done, make sure everything was done right, and then you vote that yes, this is okay. And sometimes it’s not okay. Sometimes there are errors and they’re found. But that’s what the DoD wage committee is,” Simon said.

“The surveys happened, the calculation and the new wage scales and wage rates were determined, but none of them could be actually implemented or paid because of the pause on the advisory committees. Everything was ready to go. So people who were due their raise in March and April and May, in June, July, August, September, none of them got their raises when they were supposed to,” she added.

Simon said the Office of the Secretary of Defense never offered any explanation of why the committee could not be exempted. “They just wouldn’t do it. They were not permitted to meet with us,” she said.

It appears that pressure from lawmakers eventually pushed the department to reverse its course.

“We certainly talked to a lot of lawmakers, and we talked to as many people in the administration as we possibly could and tried to put some political pressure on the secretary, and I guess he finally relented,” Simon said. 

The delay, Simon said, has been deeply frustrating for workers. “Across the board, people were absolutely furious. There’s no way to overstate how angry and resentful people were that this was happening. And, of course, there was a hardship, of course there was the shutdown, and then this on top of it, and it was a terrible outrage.”

AFGE estimates that more than 118,000 DoD employees are paid through the Federal Wage System.

If you would like to contact this reporter about recent changes in the federal government, please email anastasia.obis@federalnewsnetwork.com or reach out on Signal at (301) 830-2747.

The post DoD employees under Federal Wage System to get long-delayed pay raise first appeared on Federal News Network.

© Associated Press/Federal News Network

DoD budget 031919

Ethereum Fusaka Upgrade Goes Live Today: Experts Predict Potential Supply Crunch Ahead

3 December 2025 at 14:52

The highly anticipated Fusaka Upgrade for Ethereum is on the verge of going live on Wednesday, heralding significant enhancements to the network’s overall functionality. 

Analysts contend that this pivotal development could usher in a considerable supply crunch for ETH, potentially boosting its price during a challenging period for the broader cryptocurrency market.

Layer 2 Solutions To Boost ETH Burn

According to analysts at Bull Theory, the Fusaka Upgrade integrates components from previous upgrades—Osaka, Fulu, and PeerDAS—but its most impactful feature is its resolution of one of Ethereum’s biggest challenges. 

Layers 2 (L2) solutions have long utilized Ethereum’s security while contributing minimal fees back to the network. Despite L2 solutions like Base, Arbitrum, Optimism, and zkSync generating millions in fees from users, the fees recorded on Ethereum tended to diminish to nearly zero when they posted their data. 

Consequently, this meant that significant L2 activity did not result in substantial ETH being burned, even though approximately 85% of Ethereum transactions now occur on these Layer 2 solutions.

The Fusaka Upgrade fundamentally changes this dynamic. A key enhancement is EIP-7918, which mandates that Layer 2 transactions pay real fees to Ethereum. 

This adjustment ensures that every L2 transaction will contribute directly to the burning of ETH—something that was not previously guaranteed. The analysts assert that this feature represents one of the most significant value shifts since the introduction of EIP-1559.

Post-Fusaka Projections

The upgrade is further expected to broaden the scope of ETH burn from being predominantly derived from Layer 1 (L1) transactions to encompassing all L2 activity. 

Historically, most ETH burn has originated from mainnet transactions; thus, the network saw slight inflation in 2024–2025 as Layer 2s made transactions cheaper, leading to a decrease in ETH burn while staking continued to issue new ETH. 

Post-Fusaka, every L2 blob will incur a minimum cost, which will be burned. As Layer 2 adoption increases, the rate at which ETH is burned will also rise, contributing to increased scarcity of ETH.

This enhancement positions Ethereum to shift back towards deflation for the first time in several years. Currently, ETH issues around 620,000 new tokens annually for stakers while burning approximately 350,000 tokens. This results in a net slight inflation. 

However, projections following the Fusaka Upgrade, even with conservative estimates, suggest that the additional burn from L2 activity could range from 200,000 to 400,000 ETH per year. 

Combined with existing burn rates, this could bring the total to over 600,000 ETH, leading to a net neutral or slightly deflationary state for ETH. 

More bullish models predict that if L2 adoption flourishes and demand for blobs rises, burn rates could soar to between 900,000 and 1.2 million ETH annually, resulting in a supply decrease of 200,000 to 300,000 ETH each year. 

Monetary Transformation For Ethereum?

Another notable aspect of the Fusaka upgrade is PeerDAS, which enhances Layer 2 growth by reducing bandwidth requirements by 85%. This efficiency allows L2 solutions to publish more blobs at lower costs, resulting in increased fees and, consequently, more ETH burned.

The upgrade also increases the block gas limit from 36 million to 60 million, allowing more transactions to fit within each block. This increase means that more transactions can occur, leading to higher fees collected and a corresponding rise in burning. 

Furthermore, lower fees for transactions—such as swaps, bridges, on-chain gaming, and social applications—will likely drive more usage, resulting in increased transactions and higher ETH burn.

Ultimately, the analysts believe that the Fusaka Upgrade represents a significant monetary transformation for Ethereum, indicating that the network is not only scaling but also beginning to monetize that scaling effectively.

Ethereum

Featured image from DALL-E, chart from TradingView.com

Analysts Turn Bullish on SUI as Token Extends Gains Amid Renewed Institutional Interest

3 December 2025 at 14:00

Sui (SUI) is drawing renewed market attention after staging one of its strongest breakouts in months, rising sharply at a time when most large-cap altcoins remain range-bound.

The latest 31% surge was triggered by a series of developments that converged within days, most notably Coinbase’s approval to offer SUI trading to New York residents, a move that places the token inside one of the most heavily regulated crypto markets in the U.S.

The rally also arrived immediately after one of the largest token unlocks of the month, an event that would normally dampen prices but instead saw buyers step in with force.

SUI Network SUIUSD

New York Listing Boosts Liquidity and Institutional Demand

SUI surged between 25% and 32% over the past 24 hours after Coinbase confirmed that New York residents can now buy and trade the token across its web and mobile platforms.

The approval extends SUI’s reach into one of the most tightly regulated U.S. markets, strengthening its profile as a compliant layer-1 network and increasing accessibility for institutional investors.

The listing comes at a notable time. On December 1, SUI unlocked approximately $82–86 million worth of tokens, increasing circulating supply by more than 0.5%. Large unlocks typically pressure prices, but SUI moved higher instead, signaling strong demand absorption.

Trading volume has more than doubled, hitting roughly $1.5 billion, levels analysts say indicate genuine accumulation rather than short-lived speculation.

The launch of USDsui, a fiat-backed stablecoin designed for payments and DeFi use across the Sui ecosystem, also contributed to renewed interest. Combined with Coinbase’s expansion, these developments have strengthened confidence in Sui’s broader market positioning.

SUI Technical Indicators Point to Momentum Shift

Price action shows that SUI recently rebounded from November’s lows near $1.12, climbing above the $1.60 support zone.

Indicators such as RSI and MACD now suggest easing selling pressure and a potential shift in short-term momentum. Analysts note that breaking above the mid-Bollinger Band near $1.90 would confirm a broader trend reversal.

SUI has also moved above the Keltner mid-band for the first time in weeks, with volume delta readings showing strong spot-market buying.

The next major resistance sits between $1.80 and $1.95, followed by a wider zone extending to $2.30. A decisive close above $1.92 is viewed as critical for invalidating November’s downtrend.

Rally Depends on Volume Holding

Market watchers say the current rally hinges on sustained demand. If daily volume remains above $1.5 billion and price holds the $1.60–$1.67 support zone, institutional participation could continue to push the token higher toward the $1.90 level.

However, weakening volume or a drop below $1.48 may signal that SUI has formed a local top. For now, sentiment remains constructive as the token benefits from increased U.S. accessibility, improving technical signals, and expanding ecosystem activity.

Cover image from ChatGPT, SUIUSD chart from Tradingview

Ethereum Network Fatigue? Monthly On-Chain Transactions Drops As Activity Slows Down

3 December 2025 at 14:00

Over the past few weeks, the price of Ethereum has been on a downward trend due to a highly volatile market environment. ETH’s bearish action appears to have hampered on-chain activities, as evidenced by a decline in its total transactions carried out within a monthly period.

A Quiet Month For The Ethereum Network

Ethereum’s on-chain activity appears to have slowed down alongside the ongoing decline of ETH’s price. The blockchain, which is typically bustling with contract calls, exchanges, and transfers, now feels a little more roomy, suggesting a cooling pulse beneath the surface.

After examining the Transactions on the Ethereum Network metric in the monthly time frame, Everstake.eth, a market analyst and the head of the ETH segment at Everstake, revealed that the blockchain has recorded its worst month of the year. While price has declined, ETH’s total transactions executed in a month, particularly November, experienced a cool-off.

According to the data, the overall number of transactions carried out on the Ethereum network in November alone was approximately 32.2 million. Although this figure may seem large, it actually marks the lowest monthly count in the past 12 months.

Such a drop in transactions may suggest the renewed waning appetite for the network. In addition to suggesting a retreat, this delay reads more like a collective pause as users catch their breath, procedures recalibrating, and the market adjusting to its new rhythm. 

Ethereum

Everstake.eth highlighted that this kind of cooldown usually occurs when the market moves into a wait-and-see phase. During this phase, capital is observed sitting on the sidelines while developers continue to build on the blockchain. Despite this trend, the network still records more than 33 million transactions in a quiet month, which reflects its robust strength.

At a time like this, the expert noted that user behavior typically follows the market sentiment. As seen in the past, on-chain activity tends to cool down when volatility drops. However, Ethereum still retains the status as the most reliable network even during slow phases.

With the Fusaka Upgrade set to hit the market, Everstake.eth predicts that ETH transactions will see explosive growth. “If this is the worst month, imagine what the best will look like after Fusaka rolls out. It will be huge,” the expert stated.

ETH Active Transactions Pick Up

The monthly transactions may have slowed down, but the active addresses on the Ethereum network are heating up again. Leon Waidmann, the head of research at On-Chain Foundation, reported that active addresses throughout the entire ecosystem, Layer 1 and Layer 2s, bounced back above 9.5 million this week.

This surge points to a quiet resurgence of interest, utility, or a group readiness for the future. Waidmann highlighted that this marks the first meaningful reversal after several weeks of downside action.

ETH layer 2s such as Base, Arbitrum, Optimism, and World Chain have witnessed a strong rebound following a period of decline. Furthermore, multi-chain activity is starting to stabilize after the drop in Q3. These factors are painting a bullish picture for the network and its price prospects.

Ethereum

Bitmine Buys Another 18,345 Ethereum ($54.94M) In Fresh Accumulation Push – Details

3 December 2025 at 13:00

Ethereum has reclaimed the $3,000 level after a strong market reaction to improving macro conditions, offering investors a much-needed shift in momentum. The move comes just days after the Federal Reserve officially ended Quantitative Tightening (QT), a policy shift that immediately boosted liquidity expectations across all risk assets. With markets now pricing in an imminent interest rate cut, confidence has begun to return, and ETH is one of the first major assets to respond.

This rebound reflects more than just macro relief. According to data from Arkham, shared by Lookonchain, Bitmine continues to accumulate Ethereum at current prices, reinforcing bullish sentiment at a moment when many traders remain cautious. Bitmine’s persistent buying throughout the correction has become one of the most influential signals for on-chain analysts, suggesting that large players see long-term value even as the market wrestles with volatility.

Reclaiming $3,000 places Ethereum back above a key psychological level, and the combination of supportive macro policy and whale accumulation provides a stronger foundation than the market had just weeks ago.

Bitmine and Linked Wallets Expand Ethereum Holdings

According to data from Arkham reported by Lookonchain, Bitmine has purchased another 18,345 ETH, worth approximately $54.94 million, just a few hours ago. This marks yet another large buy in a growing series of aggressive accumulation moves that Bitmine has made throughout the correction. Their continued willingness to buy at current levels signals strong confidence in Ethereum’s long-term value, even as the market navigates heightened volatility.

Bitmine-Linked Wallet Transfers | Source: Arkham

Shortly after this report, Lookonchain highlighted activity from a newly created wallet, 0x52B7, which withdrew 30,278 ETH—valued at $91.16 million—from Kraken. The size and timing of the withdrawal have led analysts to speculate that this wallet may be linked to Bitmine or part of a broader accumulation strategy.

Large withdrawals from exchanges typically indicate that the owner intends to hold the assets off-exchange, often for long-term storage or staking, rather than preparing to sell.

Bitmine-Linked Wallet Transfers

If the wallet is indeed connected to Bitmine, this would bring their latest combined accumulation to nearly 50,000 ETH in a single day. Such behavior suggests strategic positioning ahead of potential macro-driven upside or internal confidence in Ethereum’s recovery.

This kind of synchronized whale activity often precedes significant price shifts, reinforcing the idea that large players are preparing for a stronger market phase.

ETH Reclaims $3,000 But Still Faces Key Resistance

Ethereum’s 3-day chart shows a notable improvement after reclaiming the $3,000 level, but the broader trend still carries signs of fragility. The recent bounce followed a deep corrective move that sent ETH from the $4,500 region down to the $2,700–$2,800 support zone, where buyers finally stepped in with conviction. The strong lower wicks around this area confirm that demand remains active, but Ethereum has yet to fully recover its bullish structure.

ETH consolidates around key level | Source: ETHUSDT chart on TradingView

Price now trades just below the 50 SMA, which sits near the $3,100–$3,150 zone—an important short-term resistance level. A clean break above this moving average would signal renewed momentum and increase the chances of retesting the $3,400–$3,600 range. Meanwhile, the 100 SMA and 200 SMA remain slightly above price, reflecting the broader downtrend that has dominated since September.

Volume has picked up slightly during the recovery, but it remains muted compared to the selling spikes seen during the drawdown. This indicates cautious buying rather than aggressive accumulation at these levels. To confirm a trend reversal, ETH must close above the 50 SMA and then challenge the cluster of resistance around $3,200–$3,300.

Featured image from ChatGPT, chart from TradingView.com

Here’s Why The Bitcoin Price Jumped Above $92,000, And Ethereum Price Reclaimed $3,000

3 December 2025 at 08:00

The crypto market delivered a dramatic rebound this week, with the Bitcoin price vaulting above $92,000 and Ethereum climbing back over $3,000. The sharp recovery in both leading cryptocurrencies has caught the market’s attention, with analysts now sharing the major reason for the unexpected pump. 

Why The Ethereum And Bitcoin Price Are Rebounding

Bitcoin is currently trading above $93,000 after experiencing a period of accelerated selling and heavy long liquidations that had briefly pushed its price down over the past few weeks. Now that forced selling has eased, the cryptocurrency has recovered significantly, adding an astonishing $75 billion to its market capitalization within 10 hours. 

Ethereum has followed the same upward swing. Data from CoinMarketCap shows that ETH has gained more than 9% in the past 24 hours, with steady accumulation pushing its price above $3,050. 

Crypto market analyst Wimar.X has explained the reason behind the sudden surge in both Bitcoin and Ethereum prices. He framed the resurgence as a rapid wave of high-volume coordinated institutional buying. In his words, the market pumped because a massive round of accumulation occurred within a single hour. 

Data from Arkham Intelligence shows that Wintermute, a leading algorithmic trading firm, had bought 8,577 BTC ahead of the market surge. Binance, the world’s largest crypto exchange, also acquired 7,658 BTC, while a major whale wallet added 6,010 BTC to its portfolio. Finally, BitMEX, a crypto exchange co-founded by Arthur Hayes, reportedly accumulated 5,818 BTC, while Bitfinex absorbed 5,778 BTC. 

Bitcoin price 1

According to Wimar.X analysis, the sudden accumulation and its timing appear coordinated. He described the activity as manipulation, implying that it was intended to influence market perception and artificially sway prices. 

Analysts Share Outlook For Bitcoin And Ethereum Price After Pump

As the crypto market showed renewed strength and BTC recovered above $90,000, crypto expert Michael van de Poppe took to X to highlight the significance of the rebound. He noted that the recent dip in Bitcoin’s price at the start of the month appeared unusual but was followed by a strong bounce. According to the analyst, surpassing $92,000 will be critical for Bitcoin and could pave the way for a new all-time high and a potential test of $100,000. 

Bitcoin price 2

On the other hand, a market analyst identified as ‘More Crypto Online’ on X has stated that Ethereum is currently testing the micro support zone between $2,907 and $2,974. He noted that holding this support area is crucial for sustaining the upward momentum that began earlier this week.

Bitcoin Price 3

As a result, the analyst has predicted that Ethereum’s next upside window sits between $3,165 and $3,210. He cautioned that a breach below the lower support level could trigger a deeper corrective wave. However, current trends suggest that ETH is mainly aiming higher. 

Bitcoin price chart from Tradingview.com (Ethereum)

❌
❌