Normal view

There are new articles available, click to refresh the page.
Today — 25 January 2026Main stream

Ethereum Open Interest Declines Across Exchanges, Binance Stands Out — Details

25 January 2026 at 05:00

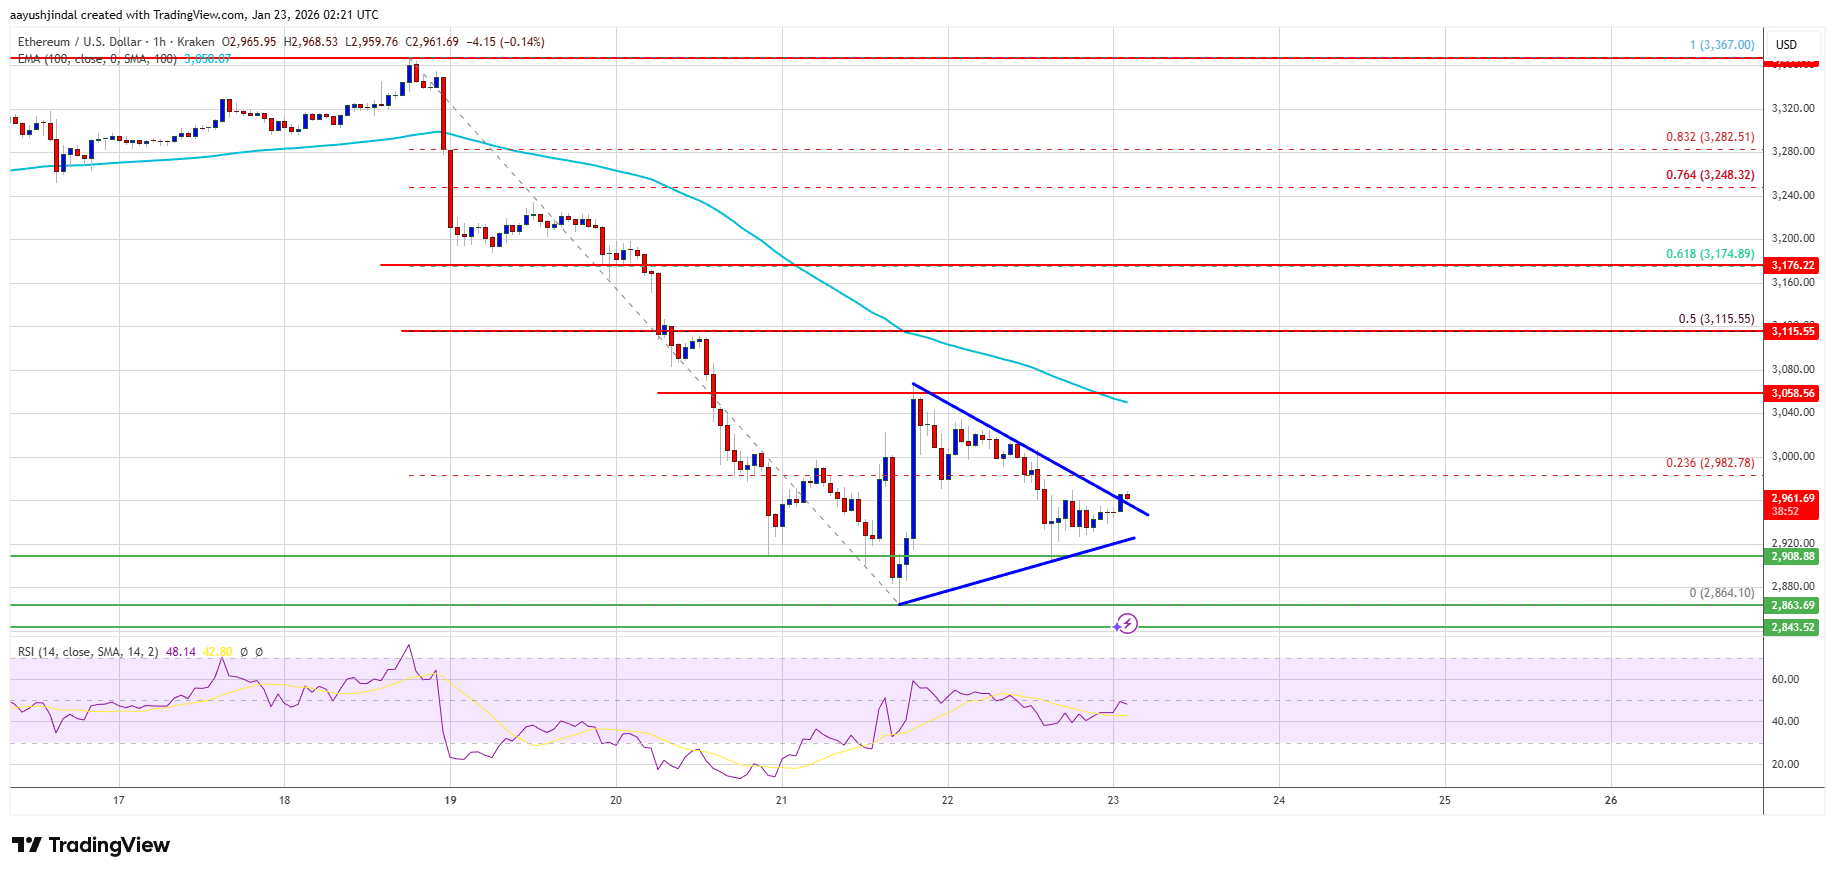
For most of the week, the Ethereum price has remained in a range-bound spell, putting in no significant movement outside of the $3,000 and $2,880 price boundaries. Amid rising speculations, an on-chain analysis has recently been put out, which provides an answer to the question.

Open Interest Across Exchanges Falls To $17 Billion

In their latest QuickTake post on CryptoQuant, analytics platform Arab Chain reveals that there has been a fall in active Ethereum derivatives contracts across major exchanges, as indicated by data from the Ethereum: Open Interest-All Exchanges, All Symbol metric. Typically, rising Open Interest (OI) across exchanges indicates that more traders are entering leveraged positions. On the other hand, falling OI reflects more exits of leveraged positions, and by extension, reduced aversion to risk.

In the Quicktake post, Arab Chain highlights that open interest across exchanges has dipped to about $16.9 billion, marking the lowest level reached since mid-December last year. This, in turn, reflects an overall reduction in risk appetite across the Ethereum derivatives market. Because there is less speculative activity, there are also reduced risks of liquidations. Hence, the Ethereum price stands a higher chance of consolidating.


Bitcoin

What’s Happening On Binance?

While exchanges in general are recording significant pull-outs from the derivatives market, Binance has shown an outlier performance. Arab Chain highlights that the world’s largest exchange by trading volume has instead recorded about $7.5 billion in Open Interest. Interestingly, this reading slightly exceeds the December average range of $6.8–$7.4 billion. 

The divergence between the Open Interest values across all exchanges and that of Binance suggests that, while market participants are reducing their risk exposure, there is still liquidity in the derivatives market. Rather than a blatant exit, it has been repositioned toward the deeper and more liquid venue.

Arab Chain also explains that this behavior indicates a change in market operations from a higher-risk trading environment to one more price and risk efficient. In conclusion, the large traders are yet to make their exits but are merely reducing their exposure, while holding high-quality positions on Binance.

In addition, Ethereum’s proximity to the $3,000 price — especially as OI declines — shows that the market has been absorbing the deleveraging events while showing little selling pressure. Ultimately, Binance’s OI retaining levels above December’s support the idea that the market still has strong derivatives backing. Hence, the broader picture remains bullish. As of this writing, Ethereum trades at $2,958, reflecting a 0.33% growth since the past day, according to CoinMarketCap data.

Ethereum

Featured image from Pexels, chart from Tradingview.com

Before yesterdayMain stream

Institutional-Scale Ethereum Lockup: Bitmine Crosses 1.94M ETH Staked Mark

23 January 2026 at 22:00

Ethereum has slipped below the critical $3,000 level, adding fresh pressure to a market that is already showing clear signs of hesitation. After weeks of choppy price action, ETH is now entering a more fragile phase where failed recoveries are starting to shift sentiment. With sellers gaining control and bullish momentum fading, several analysts are warning that this breakdown could open the door for a deeper correction if demand does not return quickly.

The timing is important. Ethereum is moving through a pivotal zone where short-term price direction could shape the broader narrative for 2026. If ETH continues to trade below $3,000 and lower support levels fail to hold, the market may transition into a prolonged risk-off regime. On the other hand, a fast recovery back above this psychological threshold could signal that the breakdown was only a liquidity sweep, setting up a rebound toward higher resistance.

Despite a weakening price structure, on-chain activity suggests large players remain active. Market data shows that Bitmine staked another 171,264 ETH, worth roughly $503.2 million, just a few hours ago. The move adds to the firm’s growing exposure and reinforces the idea that institutional-scale actors are still positioning aggressively, even as Ethereum faces one of its most decisive moments of the year.

Bitmine Ethereum Transfers | Source: Arkham

Bitmine’s ETH Staking Signals Long-Term Conviction Despite Short-Term Weakness

According to data from Arkham, Bitmine has now staked a total of 1,943,200 ETH, worth roughly $5.71 billion, marking one of the most aggressive Ethereum accumulation and yield-positioning moves currently visible on-chain.

Staking at this scale removes a significant amount of ETH from liquid circulation, effectively shifting supply away from exchanges and into long-term validator positions. In practical terms, it suggests Bitmine is not positioning for a short-term flip, but rather treating Ethereum as a strategic asset that can generate native yield while potentially appreciating over time.

This activity stands out because it is happening while Ethereum is under pressure after losing the $3,000 level. At the moment, the market is stuck in a fragile, risk-sensitive phase, where traders are reacting quickly to breakdowns and failed recoveries. Momentum has weakened, liquidity remains thin, and analysts are increasingly warning that a deeper correction could unfold if key supports continue to fail.

However, Bitmine’s staking expansion provides a counter-signal: large players appear willing to keep committing capital even as sentiment deteriorates. That divergence highlights the current split in the market—short-term participants are defensive, while longer-term allocators are still building exposure. If price stabilizes, this kind of staking-driven supply reduction can become a structural tailwind.

Ethereum Downtrend Pressure Builds

Ethereum is trading near $2,940 after losing the key $3,000 psychological level, putting the market back into a fragile position. The chart shows ETH has been trending lower since the October peak, with a clear sequence of lower highs and heavy sell-side volatility that accelerated into November. Although ETH managed to stabilize into a broad consolidation range between roughly $2,850 and $3,250, the most recent breakdown suggests buyers are struggling to defend support when momentum fades.

ETH testing key support | Source: ETHUSDT chart on TradingView

From a trend perspective, Ethereum remains capped beneath its major moving averages. Price is trading below the green long-term average and the blue mid-term average, both of which are sloping downward and acting as dynamic resistance.

The recent rebound attempt toward the $3,300–$3,400 zone failed right under the green line, reinforcing that sellers are still controlling rallies. Meanwhile, the red long-term average sits higher near the mid-$3,000s, highlighting that ETH remains far from reclaiming a macro bullish structure.

Volume has increased on the sharp red candles compared to the slower grind higher, which often signals distribution rather than healthy accumulation. If ETH cannot reclaim $3,000 quickly, downside risk opens toward the $2,850 range floor. A clean recovery back above $3,150–$3,250 would be needed to reduce bearish pressure and reset the near-term trend.

Featured image from ChatGPT, chart from TradingView.com 

Ethereum Emerges As Likely Candidate In BlackRock Tokenization Vision – Here’s Why

23 January 2026 at 15:30

Recent remarks from BlackRock CEO Larry Fink have pointed toward the need for a single, unified blockchain for tokenized markets, and have intensified the focus on platforms capable of handling institutional-scale liquidity, compliance, and settlement. With its long track record in smart contracts, extensive developer ecosystem, and growing role in regulated financial products, Ethereum is now emerging as the most likely candidate to serve as the settlement layer for tokenized capital markets.

Why Asset Managers Prefer Familiar Infrastructure

In an X post, the Ethereum Daily shared a video in which BlackRock CEO Larry Fink made it clear that tokenization is necessary. Speaking at the World Economic Forum, Fink said the financial system must move rapidly toward digitization, adding that a single, common blockchain could reduce corruption and improve transparency across the global markets.

While Fink did not name a specific network, the most plausible candidate could be ETH, based on BlackRock’s own initiatives and public statements that emphasized the role of ETH in asset tokenization. The firm has consistently highlighted ETH as a core platform for its on-chain strategy. Meanwhile, BlackRock launched its BUIDL tokenized money market fund directly on ETH, a product that has already grown to over $2 billion in total value locked. “There’s no second best,” Ethereum Daily noted.

In the staking space, Bitmine has turned Ethereum staking into a multi-billion-dollar business. An analyst known as Milk Road has revealed that the company now has 1.83 million ETH staked, worth roughly $6 million at current prices, and plans to scale that figure toward 4.2 million ETH over time. Over the past months, Bitmine Immersion Technologies Inc. (BMNR) has accounted for nearly 50% of all new ETH entering the staking queue.

Ethereum

Staking at this scale is important because it removes ETH from the liquid supply and locks it into long-term infrastructure rather than keeping it for short-term trading. When one player is willing to commit billions of dollars worth of ETH to staking, it reflects confidence in ETH’s future economic prospects. A lower liquid supply, combined with sustained network demand, will create structural pressure over time.

How Support Built Through Multiple Market Cycles

Analyst Milk Road has also highlighted that Ethereum is holding near a critical support zone around $3,000, hovering just above the lower boundary of its long-term rising structure, an area that has acted as a stress test for ETH throughout the cycle. Historically, when ETH drifts into this area, the market will need to decide whether the weakness is temporary or structural.

The $2,750 level remains the key line because it has repeatedly stopped downside pressure after macro-driven or narrative-driven pullbacks, making it a reliable floor for the broader trend. As long as ETH holds above that level, the broader multi-year uptrend will remain intact.

Ethereum

Ethereum Funding Rates Pushing Towards Negative: What’s Going On?

23 January 2026 at 14:00

Ethereum is currently trading under pressure after failing to push above the $3,000 level again over the past 24 hours, a move that is reflecting trader sentiment across the derivatives markets. ETH is currently trading at $2,925, down 2.7% on the day, after moving within a 24-hour range capped at $3,012.99 and finding lows around $2,909.60, according to price data from CoinGecko. 

As price action weakens, a notable change has been developing, with on-chain data showing funding rates drifting toward negative territory and derivative positioning beginning to tilt more defensively.

Funding Rates Slide As Shorts Gain Ground

Ethereum’s failure to hold above $3,000 is an important psychological break for traders, especially after several failed attempts to hold above that level in January. Price action over the past week shows sellers maintaining control after ETH rejected around $3,360 on January 18, followed by a steady push lower toward the high-$2,900s. 

Although the pullback has so far been orderly above $2,900, this decline has come alongside fading momentum across the derivatives market.

One of the clearest signals for this can be seen in Ethereum’s OI-weighted funding rate, which has been steadily compressing and is now edging toward negative levels. At the time of writing, Ethereum’s OI-weighted is at 0.0008%, close to breaking into negative territory and far below readings around 0.009%, which it registered earlier in the month.

Ethereum

Funding rates turning negative typically indicate that short positions are paying longs, meaning stronger demand for downside exposure. Funding spikes that previously accompanied the price rebound in early January have faded, and the overall trend suggests bearish positioning is slowly gaining the upper hand.

Open Interest, Liquidations, And What’s Next

Although Ethereum’s price action fell below $3,000, derivatives traders have stayed in the market, keeping total open interest at high levels. Data from CoinGlass shows aggregate Ethereum open interest increasing by 0.68% in the past 24 hours, which shows that many traders are not exiting Ethereum entirely. At the time of writing, the total open interest is sitting at about 13.36 million ETH, equivalent to roughly $39.19 billion.

Looking across major exchanges, Binance has the largest share of ETH open interest, accounting for about $8.95 billion, but it is down by 0.8% in the past 24 hours. CME follows with approximately $5.73 billion in open interest, up by 3.72% in the past 24 hours. Gate comes next at around $4.01 billion, while MEXC comes in close at $3.51 billion worth of ETH open interest.

Over the past 24 hours, Ethereum liquidations totaled $64.34 million, with long positions ($52.52 million) accounting for the majority of losses.

A hold above $2,900 could allow Ethereum’s funding rates to normalize and open the door for another rebound attempt to $3,000. However, a continued fall in funding rates into negative territory could see bearish control pushing Ethereum below $2,900.

Ethereum

Here’s How Ethereum Staking Transforms Into A Multi-Billion-Dollar Bet For Bitmine Immersion

23 January 2026 at 13:00

Over the years, Ethereum staking has become one of the most vital and successful aspects of the broader ETH ecosystem, with big companies steadily jumping into the field. The majority of these companies, especially Bitmine Immersion, are revolutionizing ETH staking, turning it into a massive financial sector and edge.

Bitmine Monetized Ethereum Staking At Scale

After the entry of institutional investors, Ethereum staking has been transformed into a significant business opportunity from a technical requirement. At the forefront of this evolution is Bitmine Immersion Technologies Inc. (BMNR), a leading digital asset platform dedicated to improving the ETH ecosystem.

With its remarkable involvement in ETH staking, Bitmine Immersion is proving just how large this opportunity can be. The digital asset platform has successfully transformed Ethereum staking into a multi-billion-dollar enterprise by growing its validator operations and staking infrastructure.

As outlined by Milk Road on the social media platform X, the company intends to increase its present investment of 1.83 million ETH, valued at approximately $6 billion at current rates, to 4.2 million ETH. Bitmine’s plan and robust participation in ETH staking are a clear sign of the growing institutional appetite for on-chain yield.

Ethereum

This expansion demonstrates how staking is now about creating profitable, long-lasting businesses around ETH’s proof-of-stake economy rather than just protecting the network. Over the past month, Bitmine has been responsible for almost half of all new ETH entering the staking queue. 

Milk Road stated that staking at this scale removes Ethereum from the liquid supply and locks it away in long-term infrastructure rather than short-term trading. When a single player expresses a willingness to commit billions of dollars’ worth of ETH to staking, it points to an increased confidence in ETH’s future economics.

According to the expert, structural pressure is created by a reduced liquid supply and ongoing network demand over time. Given the sustained growth in institutional staking, Milk Road is confident that ETH’s price will move higher in the foreseeable future.

ETH Powering Crypto Native Financial Rails

With crypto native financial rails expanding, Ethereum is increasingly being positioned as the core infrastructure for major financial firms. JP Morgan asset management firm has confirmed this narrative with its latest fund launched on the ETH network.

Milk Road has reported that JP Morgan has introduced a tokenized money market fund on ETH, which is now live and already holds over $100 million in US treasuries. The rails are native to cryptocurrency, and the product appears to be traditional finance.

In reality, there is no separation, and there is only a financial product operating on the trains that make the most sense. Interestingly, this is how institutions move into new systems. “Incrementally, and only after the rules are clear enough to deploy real capital. Once they are live, they don’t leave,” Milk Road stated.

Ethereum

Ethereum Whales’s $15 Million Move, Is This Another Insider Trader?

23 January 2026 at 11:30

An inactive Ethereum whale has just re-entered the trading scene, withdrawing over $15 million worth of ETH in just a single day. Considering Ethereum’s slow price growth over the past few months and the whale’s sudden appearance despite being dormant for months, there could be a possibility of insider trading.

Dormant Ethereum Whale Moves $15 Million ETH

A sudden $15.14 million Ethereum transaction has caught the crypto market’s attention, with the move either driven by insider knowledge or simple strategic positioning. According to data from blockchain analytics platform, Onchain Lens, the transfer shifted approximately 5,099 ETH from a dormant wallet address on Kraken into active circulation on Thursday, January 22. 

Based on on-chain records, the whale, identified by the address ‘0x761F2F,’ has remained inactive in the market for more than three months. The last few times the whale was actively moving in the market were when it executed a series of stablecoin and HYPE transactions. The anonymous whale had initiated multiple million-dollar trades in UETH, USDT, and USDC. Meanwhile, the HYPE transactions were primarily token burns. 

Ethereum 1

After withdrawing 5,099 ETH from Kraken, Arkham Intelligence reported that the whale had transferred the ETH to Lido Finance, converting it into 5,100 STETH. While there is currently no evidence of insider trading, the timing of the transaction raises questions, especially given Ethereum’s muted price action over the past few months and the mounting selling pressure from large scale holders

Typically, insider trading in crypto occurs when individuals with non-public information make large transactions ahead of major market events that could influence market price. Currently, there has been no spike in Ethereum’s price, nor any major news that could suddenly affect its movements. In fact, ETH continues to trade lower, down by roughly 1.7% over the past 24 hours. Its daily trading volume is also down by 34.89%, signaling reduced confidence among traders and investors. 

Whales Go Long On Ethereum

While dormant large-scale players are suddenly re-entering the market, some active whales remain bullish on Ethereum’s long-term prospects despite its ongoing downtrend. According to well-known market analyst Max Crypto, an anonymous whale has just opened a $202 million long position in ETH with 15x leverage. 

The scale of the trade is extraordinary considering Ethereum’s recent volatility. It shows strong confidence in the cryptocurrency’s future price action and its potential to overcome its ongoing downtrend. Notably, the position has a liquidation price of $2,495, meaning that if ETH falls to that level, the trade could be forcibly closed by the crypto exchange, resulting in substantial losses for the whale. 

Ethereum 2

Market participants are closely watching the whales’ positioning, with some calling it a brave but chaotic bet. Others have even speculated that the position may have been taken based on insider information, fueling discussions about potential market moves and a possible bullish turnaround for ETH.

Ethereum price chart from Tradingview.com

Ethereum Approaches A “Never Broken” Support Line: Accumulators Step In

22 January 2026 at 23:00

Ethereum is once again under pressure as it struggles to regain solid ground around the $3,000 level, reflecting a broader wave of uncertainty across the crypto market. With sentiment turning increasingly fragile, many altcoins remain stuck in corrective mode, and bulls are now forced to defend key support zones to prevent deeper downside. In this environment, Ethereum’s ability to push higher is becoming a critical signal for whether the market can stabilize or if the current bearish trend will extend.

Despite the weakness, on-chain data suggests that ETH may be nearing an important turning point. According to CryptoQuant, Ethereum is approaching a major support line that has historically acted as a strong floor during periods of heavy volatility.

The report highlights that the realized price of Ethereum accumulation addresses continues to climb and is now approaching the current market price, indicating that long-term accumulation remains active even as short-term traders hesitate.

This dynamic matters because accumulation-based cost levels often represent zones where large investors defend their positions aggressively. If ETH holds above this rising support range, the market may be setting the foundation for a broader recovery.

Ethereum Whale Cost Basis Signals a Potential Bottom Zone

CryptoQuant’s report suggests Ethereum may be approaching one of its most important structural support zones, anchored by the realized price of accumulation addresses. This metric tracks the average on-chain cost basis of entities that consistently accumulate ETH, and it often behaves as a “defense line” for whales who build long-term positions.

According to the analysis, this realized price level has historically acted as a reliable floor, with Ethereum never breaking below this range during prior drawdowns, even when broader market conditions turned sharply risk-off.

That historical behavior matters because it implies that accumulation whales tend to protect their cost basis aggressively, either by adding exposure near support or by reducing sell pressure when the price approaches their entry zone. In practice, this can limit downside momentum and create a stabilization area where volatility compresses before the next trend decision.

Ethereum Realized Price For Accumulation Addresses | Source: CryptoQuant

Based on the current trajectory, the report argues that even if ETH sees another leg down, the most probable “bottom zone” sits near $2,720. From current levels, that would represent an additional pullback of roughly 7%, keeping the move within a controlled correction rather than a full breakdown. If buyers defend this area, Ethereum could begin rebuilding a base for a renewed push back above $3,000.

ETH Price Slips Back Toward $3,000 As Bulls Struggle To Reclaim Control

Ethereum (ETH) continues to trade under heavy pressure as price struggles to stabilize around the $3,000 zone. The chart shows ETH printing another sharp rejection after failing to hold the recent rebound, reinforcing that the market remains in a corrective phase rather than a clean recovery. Even though buyers are attempting to defend current levels, momentum still looks weak, with each bounce being met by renewed selling.

ETH consolidates in a pivotal demand level | Source: ETHUSDT chart on TradingView

From a technical perspective, ETH is trading below its key moving averages, which highlights how resistance continues to stack above the price. The broader structure suggests a downtrend that is transitioning into consolidation, but without a confirmed breakout, the risk remains tilted to the downside.

The recent push toward the mid-$3,200 region failed to flip that zone into support, and the pullback toward $2,980 signals that bulls are still struggling to build sustainable demand.

Volume remains relatively muted compared to the larger selloffs seen earlier in the cycle, which supports the idea that this is a grinding distribution phase rather than full panic capitulation. For a bullish shift, ETH needs to reclaim $3,200–$3,300 and hold above it. Until then, the $2,900–$3,000 area remains the key line of defense.

Featured image from ChatGPT, chart from TradingView.com 

Ethereum Bulls Must Conquer $3,050 Or Momentum Quickly Fades

22 January 2026 at 22:08

Ethereum price started a minor recovery wave from the $2,865 zone. ETH is now consolidating losses and might aim for a recovery if it clears $3,050.

  • Ethereum started a consolidation phase below $3,050.
  • The price is trading below $3,040 and the 100-hourly Simple Moving Average.
  • There was a break above a contracting triangle with resistance at $2,950 on the hourly chart of ETH/USD (data feed via Kraken).
  • The pair could start a fresh increase if it stays above the $2,900 zone.

Ethereum Price Aims Recovery

Ethereum price failed to remain stable above $3,050 and extended losses, like Bitcoin. ETH price declined below $3,000 and $2,920 to enter a bearish zone.

The bears even pushed the price below $2,880. The price finally tested $2,865 and is currently consolidating losses. There was a minor upside above the 23.6% Fib retracement level of the downward wave from the $3,365 swing high to the $2,865 swing low.

Besides, there was a break above a contracting triangle with resistance at $2,950 on the hourly chart of ETH/USD. Ethereum price is now trading below $3,040 and the 100-hourly Simple Moving Average. If the bulls can protect more losses below $2,900, the price could attempt another increase.

Immediate resistance is seen near the $3,050 level. The first key resistance is near the $3,110 level or the 50% Fib retracement level of the downward wave from the $3,365 swing high to the $2,865 swing low. The next major resistance is near the $3,175 level. A clear move above the $3,175 resistance might send the price toward the $3,220 resistance.

Ethereum Price

An upside break above the $3,220 region might call for more gains in the coming days. In the stated case, Ether could rise toward the $3,280 resistance zone or even $3,300 in the near term.

Another Drop In ETH?

If Ethereum fails to clear the $3,050 resistance, it could start a fresh decline. Initial support on the downside is near the $2,910 level. The first major support sits near the $2,880 zone.

A clear move below the $2,880 support might push the price toward the $2,865 support. Any more losses might send the price toward the $2,820 region. The main support could be $2,750.

Technical Indicators

Hourly MACDThe MACD for ETH/USD is losing momentum in the bearish zone.

Hourly RSIThe RSI for ETH/USD is now above the 50 zone.

Major Support Level – $2,880

Major Resistance Level – $3,050

Ethereum Price Attempts Bounce While $3,000 Separates Bulls And Bears

21 January 2026 at 22:18

Ethereum price started a fresh decline from the $3,000 resistance. ETH is now consolidating losses and might aim for a recovery if it clears $3,120.

  • Ethereum started another decline and traded below $2,920.
  • The price is trading below $3,050 and the 100-hourly Simple Moving Average.
  • There was a break above a key bearish trend line with resistance at $3,000 on the hourly chart of ETH/USD (data feed via Kraken).
  • The pair could start a fresh increase if it stays above the $2,900 zone.

Ethereum Price Attempts Recovery

Ethereum price failed to remain stable above $3,050 and started a fresh decline, like Bitcoin. ETH price declined below $3,020 and $3,000 to enter a bearish zone.

The bears even pushed the price below $2,920. The price finally tested $2,865 and is currently consolidating losses. There was a minor upside above the 23.6% Fib retracement level of the recent downward move from the $3,366 swing high to the $2,865 swing low. Besides, there was a break above a key bearish trend line with resistance at $3,000 on the hourly chart of ETH/USD.

Ethereum price is now trading below $3,050 and the 100-hourly Simple Moving Average. If the bulls can protect more losses below $2,900, the price could attempt another increase.

Immediate resistance is seen near the $3,065 level. The first key resistance is near the $3,100 level. The next major resistance is near the $3,120 level and the 50% Fib retracement level of the recent downward move from the $3,366 swing high to the $2,865 swing low. A clear move above the $3,120 resistance might send the price toward the $3,175 resistance.

Ethereum Price

An upside break above the $3,175 region might call for more gains in the coming days. In the stated case, Ether could rise toward the $3,220 resistance zone or even $3,300 in the near term.

Another Decline In ETH?

If Ethereum fails to clear the $3,065 resistance, it could start a fresh decline. Initial support on the downside is near the $2,980 level. The first major support sits near the $2,900 zone.

A clear move below the $2,900 support might push the price toward the $2,840 support. Any more losses might send the price toward the $2,780 region. The main support could be $2,720.

Technical Indicators

Hourly MACDThe MACD for ETH/USD is losing momentum in the bearish zone.

Hourly RSIThe RSI for ETH/USD is now above the 50 zone.

Major Support Level – $2,900

Major Resistance Level – $3,065

Ethereum Supply Tightens On Binance As Reserves Hit Lowest Level Since 2016

21 January 2026 at 22:00

Ethereum has slipped below the $3,000 level again as selling pressure returns across the broader crypto market, keeping bulls on the defensive after a brief recovery attempt. The move back under this psychological zone suggests that traders remain cautious, with downside volatility re-emerging as risk appetite fades and liquidity thins near key support levels.

However, while price action looks heavy in the short term, on-chain data is flashing a different signal beneath the surface. According to Arab Chain, Ethereum reserves held across centralized exchanges have dropped to around 16.2 million ETH, marking their lowest level since 2016. That milestone matters because it highlights a steady, long-duration trend of withdrawals rather than a sudden one-off event.

In practical terms, fewer coins sitting on exchanges typically means less immediate supply available for spot selling, especially during periods of market stress. This behavior can reflect a shift away from short-term trading and toward longer-term holding, self-custody, or deployment in DeFi.

Ethereum remains vulnerable as price struggles below $3,000. Still, the persistent reserve decline suggests that supply conditions may be tightening in the background, setting the stage for a sharper reaction if demand returns.

Binance Reserves Keep Falling

The CryptoQuant analysis also points to a similar reserve drawdown on Binance, reinforcing the broader exchange supply contraction narrative. Since the beginning of 2026, Binance’s Ethereum reserves have dropped from roughly 4.168 million ETH to around 4.0 million ETH, signaling steady withdrawals even as the price remains under pressure. This matters because Binance is often the main liquidity hub for ETH spot and derivatives, so shifts in its reserve balance can reflect real changes in market positioning.

Ethereum Exchange Reserve Binance | Source: CryptoQuant

What stands out is that this decline is happening without a meaningful rebound in inflows. In other words, ETH is not rotating back onto exchanges aggressively, suggesting sellers are not rushing to increase liquid supply at current levels. That dynamic typically aligns with a market where investors prefer holding behavior over active distribution. Either moving ETH to cold storage or deploying it across DeFi.

While reserves falling does not guarantee an immediate rally, it can change the supply-demand equation over time. With fewer coins sitting on exchanges, the market becomes more reactive if demand returns suddenly, as there is less readily available ETH to absorb buy pressure.

If Ethereum manages to reclaim key resistance levels, this supply tightening could amplify upside follow-through.

Ethereum Loses $3,000 as Bears Regain Control

Ethereum is showing renewed weakness after failing to hold above the key $3,000 level, with price now hovering near $2,970 on the daily chart. After briefly stabilizing earlier this month, ETH attempted a rebound toward the $3,300–$3,400 supply zone. But momentum faded quickly as sellers stepped back in and pushed the market lower.

ETH testing critical support | Source: ETHUSDT chart on TradingView

From a technical perspective, Ethereum remains trapped below its major moving averages, reinforcing the bearish structure. The recent rejection near the descending trend of the 200-day average signals that upside attempts are still being capped by overhead resistance. Keeping bulls on the defensive. At the same time, the breakdown below $3,000 shifts market sentiment back into risk-off mode. Especially as crypto traders remain sensitive to broader macro uncertainty.

The current price action also reflects a fragile recovery attempt rather than a confirmed reversal. ETH’s latest drop places focus on the $2,850–$2,900 region as the next support area. An area where buyers previously stepped in during earlier selloffs. If this zone fails to hold, the market could revisit deeper levels from the previous correction phase.

For bulls to regain control, Ethereum must reclaim $3,000 quickly and build stronger demand above that threshold.

Ethereum Loses Structure After $3,220 Rejection — Is This Distribution Or Just The First Crack?

21 January 2026 at 18:30

Ethereum has taken a sharp turn after facing a firm rejection at the $3,220 level, with price breaking structure and slipping into a weaker posture. The speed of the drop and lack of strong buying interest raise an important question for traders: Is this merely an early warning sign within a broader uptrend, or the start of a deeper distribution phase that could pressure ETH further in the near term?

Rejection At $3,220 Signals Distribution, Not A Shakeout

Crypto analyst PEPE is Friend highlighted that Ethereum’s sharp rejection at the $3,220 level was deliberate rather than random. The drop was clean, with key structure breaking down, selling pressure accelerating, and price quickly flushing toward the $3,106 area, aligning with a classic distribution behavior rather than a simple shakeout.

Assessing the current price reaction, there are still no signs of a true reversal. The bounce has been notably weak, trading volume remains thin, and buyers have yet to show a strong commitment. Instead of signaling renewed bullish momentum, the move higher appears to be a technical pullback within a broader weakening structure.

Ethereum

The key technical zone remains well-defined. ETH is trading below the former support band between $3,170 and $3,200. As long as the price stays below this range, any upside move is likely to be viewed as a selling opportunity rather than the start of a sustained recovery. 

When this price action is viewed alongside Ethereum spot ETF data, the picture becomes clearer. While ETF flows remain positive daily, they lack strong momentum or a standout confirmation day. Capital appears to be absorbed rather than aggressively deployed, suggesting institutional demand is not yet strong enough to drive a decisive breakout. Until that changes, sellers are expected to remain in control below the $3,170–$3,200 resistance zone.

Ethereum Slips Below $3,062 As Bears Regain Short-Term Control

In an X post, Kamile Uray noted that Ethereum has closed below the $3,062 level, shifting attention toward the next major downside zone at $2,623. This level is now critical, as holding above it could allow ETH to stabilize and attempt another recovery move.

On the upside, a clean break above the pink-box resistance near $3,445 would activate bullish formations such as a cup-and-handle or an ascending triangle, opening the door for a move toward the $3,894 area.

Further strength would be confirmed if ETH manages to close above the $3,661 high, which would mark the first higher high on the daily chart relative to the previous downtrend, improving the bullish outlook. Still, $3,894 remains a key level, as it aligns with the 0.618 Fibonacci retracement of the last decline.

On the downside, a clear break below the $2,623 low would expose ETH to deeper losses, with the $2,274–$2,104 zone emerging as the next major support area. This region hosts a potential bullish “Libra” reversal setup, and Ethereum could once again attempt a bounce toward its previous all-time high if reversal confirmation appears there.

Ethereum

Ethereum Price Breaks Under $3K, Charts Flash Fresh Warnings

20 January 2026 at 22:18

Ethereum price started a fresh decline from the $3,200 resistance. ETH is now consolidating losses and is at risk of more losses below $2,880.

  • Ethereum started a sharp downside correction below $3,000.
  • The price is trading below $3,000 and the 100-hourly Simple Moving Average.
  • There is a key bearish trend line forming with resistance at $3,020 on the hourly chart of ETH/USD (data feed via Kraken).
  • The pair could start a fresh increase if it stays above the $2,880 zone.

Ethereum Price Dips Over 5%

Ethereum price failed to remain stable above $3,200 and started a fresh decline, like Bitcoin. ETH price declined below $3,150 and $3,120 to enter a bearish zone.

The bears even pushed the price below $3,000. The price finally tested $2,910 and is currently consolidating losses below the 23.6% Fib retracement level of the recent downward move from the $3,367 swing high to the $2,910 swing low. There is also a key bearish trend line forming with resistance at $3,020 on the hourly chart of ETH/USD.

Ethereum price is now trading below $3,000 and the 100-hourly Simple Moving Average. If the bulls can protect more losses below $2,880, the price could attempt another increase.

Immediate resistance is seen near the $3,020 level. The first key resistance is near the $3,080 level. The next major resistance is near the $3,120 level. A clear move above the $3,120 resistance might send the price toward the $3,150 resistance or the 50% Fib retracement level of the recent downward move from the $3,367 swing high to the $2,910 swing low.

Ethereum Price

An upside break above the $3,150 region might call for more gains in the coming days. In the stated case, Ether could rise toward the $3,220 resistance zone or even $3,300 in the near term.

Downside Continuation In ETH?

If Ethereum fails to clear the $3,020 resistance, it could start a fresh decline. Initial support on the downside is near the $2,920 level. The first major support sits near the $2,880 zone.

A clear move below the $2,880 support might push the price toward the $2,800 support. Any more losses might send the price toward the $2,750 region. The main support could be $2,650.

Technical Indicators

Hourly MACDThe MACD for ETH/USD is gaining momentum in the bearish zone.

Hourly RSIThe RSI for ETH/USD is now below the 50 zone.

Major Support Level – $2,880

Major Resistance Level – $3,020

BitMine’s Ethereum Holdings Near 3.5% Supply Milestone As ETH Falls Below $3,000

20 January 2026 at 22:00

As the Ethereum (ETH) price retests a crucial support zone, BitMine revealed it has added another $110 million worth of ETH to its treasury holdings over the past week, approaching an important milestone for the company’s investment strategy.

BitMine’s Ethereum Bet Continues

On Tuesday, BitMine, a Bitcoin and Ethereum Network Company with a focus on accumulating crypto for long-term investment, announced its holdings had reached 4.2 million ETH tokens after acquiring 35,268 ETH, worth roughly $110 million, in the past week.

As a result, the company, which is the largest Ethereum Treasury company in the world and the second-largest global treasury, has crypto and cash holdings totaling $14.5 billion at current prices.

According to the announcement, the company now owns 4,203,036 ETH at $3,211, 193 Bitcoin (BTC), a $22 million stake in Eightco Holdings as part of its “Moonshots” initiative, and unencumbered cash worth $979 million.

After the latest purchase, BitMine now holds 3.48% of ETH’s total supply, and nears its goal to control 5% of the leading altcoin’s 120.7 million supply. Notably, it has achieved nearly 70% if “Alchemy of 5%” target in just six months.

BitMine’s chairman, Thomas “Tom” Lee, stated that “Ethereum’s price ratio to Bitcoin, or ETHBTC, has been steadily climbing since mid-October. In our view, this reflects investors recognizing tokenization and other use cases being developed by Wall Street are being built on Ethereum.”

As of January 19, 2026, BitMine’s total staked ETH stands at 1,838,003, worth $5.9 billion at $3,211 per ETH, an increase of 581,920 ETH in the past week.

ETH Price At Crucial Support Zone

Despite BitMine’s constant bet on the cryptocurrency, Ethereum retraced nearly all its 2026 gains after falling below the $3,000 barrier. On Tuesday, ETH recorded a 6.8% decline in the daily timeframe, dropping from the $3,200 area to a three-week low of $2,980.

The King of altcoins has been trading between the $2,600-$3,350 area since the November pullbacks, reclaiming the upper zone of this range during the start of the year rally. Now, ETH is retesting an important multi-support area that could define the cryptocurrency’s short-term performance.

Analyst World of Charts affirmed that there are two “simple” possibilities for Ethereum. If the price loses the $3,000 area, which serves as the mid-zone of its local range and a key macro support and resistance level, then a retest of the $2,600 lows becomes likely.

On the contrary, if the altcoin holds this zone in the daily timeframe and momentum builds, it could retest the range’s upper boundary resistance again.

Amid the pullback, another pseudonym market observer also pointed out that ETH is currently retesting its 50-day Moving Average (MA), which was reclaimed at the start of the year and currently sits at the $3,089 level.

According to the post, if the 50-day MA holds, a move to the 200-day MA, located around the $3,650 area, could come next. “All eyes [are] on a close above the 50-day MA, which will point to a successful back test,” he added.

As of this writing, ETH is trading at $2,999, a 7% decline in the weekly timeframe.

Ethereum, eth, ethusdt

Binance Order Flow Suggests Ethereum Is In Correction Mode: Demand Still Missing

20 January 2026 at 17:00

Ethereum is trying to stabilize above the $3,100 level after failing to break the $3,400 resistance, as the broader crypto market struggles to recover momentum. While bulls managed to defend key support in recent sessions, price action remains fragile and highly reactive, with sellers still showing up on rallies. ETH is stuck in a tight range, and traders are watching closely to see whether this pullback turns into a deeper correction or simply a reset before the next move higher.

A report from Arab Chain highlights that Binance data is signaling a sensitive phase for Ethereum at the start of 2026. According to the analysis, ETH is trading near the $3,200 zone, but market flow conditions remain tilted to the downside.

The Accumulated Order Flow (CVD) indicator sits at approximately -3,676, suggesting that net selling pressure is still dominating short-term activity. In simple terms, more aggressive sell orders are hitting the market than buy orders, even as price attempts to hold recent levels.

This divergence between price stabilization and negative flow reflects a market that is not collapsing, but also not attracting strong demand yet. As Ethereum defends support, the next test will be whether buyers can reclaim $3,300 and challenge the $3,400 ceiling again, or if weakness drags price back toward deeper support zones.

Ethereum Holds Despite Negative Binance Order Flow

Arab Chain notes that even though Ethereum’s CVD remains negative, the relationship between price and liquidity flows is not fully broken. According to the report, the 30-day correlation between ETH price and CVD sits near 0.62, which is a relatively constructive reading. This pattern suggests that price action partially aligns with volume behavior, even though liquidity currently tilts toward selling rather than fresh buying.

In other words, Ethereum is not trading in a vacuum—flows still matter—and the market is reacting in a way that reflects real positioning.

Binance ETH CVD Momentum & Price Correlation | Source: CryptoQuant

From a broader perspective, ETH’s gradual decline to its current levels signals a correction phase following its previous upside surge. Historically, this is the type of environment where short-term investors take profits and reduce exposure, while larger players begin to rebalance portfolios and slowly rebuild positions. Instead of an immediate trend reversal, the market often transitions into sideways price action as both sides test liquidity.

The key issue is that CVD remains negative, meaning demand has not yet become strong enough to flip the short-term flow structure. However, Ethereum’s ability to hold above the $3,000 level points to underlying support that is limiting downside acceleration.

This mismatch—weak momentum in volume flows but stable price behavior—often precedes quieter consolidation periods that can later set the foundation for stronger upside once liquidity conditions improve.

EETH Bulls Fight to Reclaim $3,100

Ethereum is trying to stabilize above the $3,100 level after a sharp rejection from the $3,400 supply zone, with price now trading near $3,111. The chart shows ETH still recovering from the broader downtrend that started after the November breakdown, but the structure remains fragile as sellers continue defending every attempt to push higher.

ETH testing key MA | Source: ETHUSDT chart on TradingView

From a technical perspective, the $3,300–$3,400 region stands out as the key resistance cluster. Price has repeatedly failed in this area, and the latest rejection confirms it remains a major distribution level. At the same time, Ethereum is holding above its short-term moving average near $3,050–$3,100. Suggesting buyers are still active, defending the current range.

However, ETH remains capped below the mid-term moving averages, which are trending lower and acting as dynamic resistance. This keeps the market in a “recovery inside a downtrend” setup unless bulls can flip those levels back into support. Volume has also remained relatively muted during the rebound, signaling that the move still lacks aggressive follow-through.

Ethereum appears stuck in consolidation. With $3,000 as the critical floor and $3,400 as the breakout trigger needed to shift market sentiment.

Featured image from ChatGPT, chart from TradingView.com 

Ethereum’s Supply Dynamics Shift As ETH Staking Sees Historical Growth – Here’s The Number

20 January 2026 at 14:00

In the current market structure, the Ethereum price continues to move in a separate direction from its network’s performance and fundamentals. While ETH’s price struggles to initiate a major rally, the network is performing at a remarkable pace, breaking past prior all-time highs in most aspects of the blockchain, such as staking.

More Ethereum Getting Locked Away

Even in the ongoing crypto volatile landscape, the supply dynamics of Ethereum, the second-largest cryptocurrency asset, are undergoing a quiet but meaningful shift. Currently, ETH staking is experiencing exponential growth, leading to a tightening supply as more ETH gets locked away.

Milk Road, a market expert, stated that ETH is becoming intentionally harder to access in the midst of the strong growth in its staking ecosystem. The chart shared by Milk Road shows that ETH staking has now hit a new all-time high, with millions of the altcoin presently scheduled to be locked away.

Ethereum

While more tokens are being locked into validator contracts, an increasing percentage of Ethereum’s total supply is essentially taken out of daily circulation. The supply of ETH taken by staking has never been this high, snatching over 30% of the entire supply in circulation. 

This points to growing confidence in staking as a yield strategy in the long term and a deeper commitment to the security offered by the network. Meanwhile, the Ethereum network is now secured by approximately $120 billion worth of staked ETH.

In addition to being removed from active circulation, Milk Road highlighted that this supply is also taken off crypto exchanges. When staking rises, and supply shrinks, Mlik Road stated that this trend is a positive signal for price appreciation in the long term, reinforcing the expert’s conviction in ETH to move higher. 

A Sharp Rise In ETH’s Network Activity To New Highs

On-chain activity has experienced a similar growth, rising to historical levels. Crypto Tice reported that Ethereum network activity is at an all-time high, highlighting the blockchain’s rising function as the layer of settlement for cryptocurrency and financial operations.

The network growth is observed among new wallet addresses, of which more than 393,000 new wallets were created in a single day, reaching the highest level ever recorded for the 7-day average of daily wallet creation. Such an increase in activity is noteworthy not only for its magnitude but also for its tenacity, occurring despite the continued volatility of the market.

It is worth noting that these types of growth are subtle as they do not show up at the tops, and momentum is gradually picking up again. However, when it does show up, it is accompanied by a quiet spike in adoption beneath the surface; a clear instance of how increasing demands follow an expansion in usage.

At the time of writing, the ETH price was trading at $3,119, demonstrating a nearly 3% decline in the last 24 hours. Its trading volume is also showing bearish performance, dropping by more than 16% over the past day.

Ethereum

Ethereum Poised For $4,000 Breakout? Expert Pinpoints On-Chain Triggers For Potential Rally

20 January 2026 at 01:00

As Ethereum (ETH) kicks off the year with a recovery past the critical $3,000 threshold amid a broader cryptocurrency market rally in early 2026, it continues to struggle against a key resistance level at $3,400. Currently, the second-largest cryptocurrency is entering a consolidation phase below this significant mark.

Technical analyst Ali Martinez has suggested that should the buying momentum observed in recent weeks persist, Ethereum could soon embark on a new rally that might bring it closer to reaching all-time high levels. 

Ethereum Poised For Potential Price Breakout

In a recent update shared on social media platform X (formerly Twitter), Martinez pointed to on-chain indicators suggesting a fresh bullish sentiment among Ethereum investors. Notably, daily active addresses on the Ethereum network have surged, doubling to exceed 800,000 in just two weeks.

Martinez’s analysis further hints at a potential correlation with the rising demand for Ethereum exchange-traded funds (ETFs). Since December 29, these investment vehicles have accumulated approximately 158,545 ETH, a sum valued at around $520 million, adding to the positive outlook for the altcoin. 

This heightened on-chain activity has created substantial support levels for Ethereum’s price action looking ahead, particularly between $2,772 and $3,109 that could prevent a new drop below these key marks. 

Martinez believes that if these support levels remain intact and buying pressure continues, a breakout above the crucial $3,400 resistance could pave the way for a significant rally toward $4,000—representing an increase of approximately 24.33% from its current trading level of around $3,217.

Ethereum

What Lies Ahead For The Altcoin?

Other analysts, such as those from BitBull, share an optimistic view of ETH’s price trajectory. The analyst has identified a potential inverse head and shoulders pattern forming in the 10-day chart, which could lead to a bullish price target of $5,000. This projection implies a remarkable 55.48% increase, exceeding last year’s record highs.

However, despite these bullish forecasts, Ethereum’s price has fallen by 3% within a 24-hour period, according to CoinGecko data. The cryptocurrency has yet to demonstrate the bullish momentum necessary to meet these targets.

Another encouraging factor for investors looking for upward price movement is liquidity. Market expert Ted Pillows recently noted that, following Ethereum’s latest price drop, the maximum pain point appears to lean upward. 

Ethereum

Historically, large investors and institutions have tended to “hunt” liquidity levels, which helps to reset positioning in the market and evacuate numerous retail investors. 

With approximately $3.4 billion in short positions at risk if Ethereum successfully breaches the $3,400 mark in the days ahead, the possibility of a significant price movement looms. 

Featured image from DALL-E, chart from TradingView.com 

Ethereum Price Trapped Under $3,250, Momentum Tilts Lower

19 January 2026 at 22:18

Ethereum price started a fresh decline from the $3,300 resistance. ETH is now consolidating losses and is at risk of more losses below $3,150.

  • Ethereum started a sharp downside correction below $3,250.
  • The price is trading below $3,220 and the 100-hourly Simple Moving Average.
  • There is a short-term declining channel forming with resistance at $3,210 on the hourly chart of ETH/USD (data feed via Kraken).
  • The pair could start a fresh increase if it stays above the $3,160 zone.

Ethereum Price Struggles Below Resistance

Ethereum price failed to remain stable above $3,280 and started a fresh decline, like Bitcoin. ETH price declined below $3,250 and $3,220 to enter a bearish zone.

The bears even pushed the price below the 61.8% Fib retracement level of the recent wave from the $3,060 swing low to the $3,402 high. The price finally tested $3,160 and is currently consolidating losses. There is also a short-term declining channel forming with resistance at $3,210 on the hourly chart of ETH/USD.

Ethereum price is now trading below $3,220 and the 100-hourly Simple Moving Average. If the bulls can protect more losses below $3,160, the price could attempt another increase.

Ethereum Price

Immediate resistance is seen near the $3,220 level. The first key resistance is near the $3,260 level. The next major resistance is near the $3,280 level. A clear move above the $3,280 resistance might send the price toward the $3,320 resistance. An upside break above the $3,320 region might call for more gains in the coming days. In the stated case, Ether could rise toward the $3,400 resistance zone or even $3,450 in the near term.

Downside Continuation In ETH?

If Ethereum fails to clear the $3,220 resistance, it could start a fresh decline. Initial support on the downside is near the $3,160 level. The first major support sits near the $3,140 zone or the 76.4% Fib retracement level of the recent wave from the $3,060 swing low to the $3,402 high.

A clear move below the $3,140 support might push the price toward the $3,080 support. Any more losses might send the price toward the $3,050 region. The main support could be $3,000.

Technical Indicators

Hourly MACDThe MACD for ETH/USD is gaining momentum in the bearish zone.

Hourly RSIThe RSI for ETH/USD is now below the 50 zone.

Major Support Level – $3,160

Major Resistance Level – $3,220

Ethereum’s 4-Hour Chart Says A Big Dump Is Coming, Here’s The Target

19 January 2026 at 11:00

The Ethereum (ETH) 4-hour chart is flashing warning signs as price hovers around a critical support zone. After months of sideways trading, ETH remains trapped in a consolidation, signaling weakening momentum amid uncertain broader market conditions. According to a crypto analyst, ETH’s 4-hour chart suggests that the cryptocurrency could be heading for a major price dump if buyers fail to regain control. 

Ethereum Price Chart Signals Major Crash Ahead

A new market analysis by crypto expert Tyrex draws attention to a 4-hour chart, warning that ETH may be preparing for another price crash. Tyrex noted that Ethereum recently bottomed inside the purple rectangle on the lower timeframe, where price dipped below a key support around $3,260, briefly triggering a liquidity sweep. The move, however, was quickly reversed, indicating it was a fakeout rather than a true bearish breakdown.

Even after the rejection, the analyst revealed that Ethereum’s broader 4-hour pattern remains largely unchanged. He stated that ETH has also repeatedly returned to the same support area, raising concerns that demand may be weakening. Notably, when price keeps revisiting the same lows, it often signals growing pressure, not strength. 

On the chart, Ethereum is now consolidating just above the highlighted support zone. Momentum has slowed compared to the earlier impulsive rally, and the price is still struggling to gain upward traction. Instead of continuation, the market appears to be hesitating at a critical area.

Ethereum

 According to Tyrex, this hesitation could be a major risk. Repeatedly retesting the same lows makes the market more vulnerable, increasing the likelihood of a deeper price dump. Notably, each retest makes it easier for sellers to break through support as buyers gradually lose control. 

The analyst’s chart also outlines a potential path lower if support gives way. A drop beneath the purple zone would put Ethereum at risk of sliding toward the next downside area between $3,209 and $3,221. At the time of Tyrex’s analysis, ETH was trading around $3,312, which means a move to this range would have represented a roughly 3% decline.

However, as of writing, Ethereum has dropped to $3,200–which is already below the analyst’s initial breakdown target. This suggests that upward momentum has weakened further, and the recent price drop could signal an even larger decline, according to Tyrex’s analysis. 

Analyst Recommends A “Wait And See” Approach

While the Ethereum price navigates bearish trends, Tyrex has advised investors and targets to adopt a wait-and-see approach. He indicated that ETH’s outlook is not entirely bearish. According to him, if Ethereum can hold above $3,230, it would shift his bearish bias to a cautiously bullish one. 

Maintaining that level suggests buyers are defending the range and preventing further downside. In that scenario, ETH could stabilize and potentially climb toward $3,420, as highlighted by the green zone on the chart.

Ethereum

Ethereum Price Falls Back to $3,200, Recovery Faces Its First Real Test

18 January 2026 at 22:18

Ethereum price started a fresh decline from the $3,400 resistance. ETH is now consolidating losses and holding the key support at $3,200.

  • Ethereum started a sharp downside correction below $3,320.
  • The price is trading below $3,250 and the 100-hourly Simple Moving Average.
  • There was a break below a bullish trend line with support at $3,220 on the hourly chart of ETH/USD (data feed via Kraken).
  • The pair could start a fresh increase if it stays above the $3,180 zone.

Ethereum Price Dips To Support

Ethereum price failed to remain stable above $3,300 and started a fresh decline, like Bitcoin. ETH price declined below $3,280 and $3,250 to enter a bearish zone.

There was a break below a bullish trend line with support at $3,220 on the hourly chart of ETH/USD. The pair even declined below the 50% Fib retracement level of the recent wave from the $3,060 swing low to the $3,402 high. The price finally tested $3,180.

Ethereum price is now trading below $3,250 and the 100-hourly Simple Moving Average. If the bulls can protect more losses below $3,180 or the 61.8% Fib retracement level of the recent wave from the $3,060 swing low to the $3,402 high, the price could attempt another increase.

Ethereum Price

Immediate resistance is seen near the $3,230 level. The first key resistance is near the $3,250 level. The next major resistance is near the $3,280 level. A clear move above the $3,280 resistance might send the price toward the $3,320 resistance. An upside break above the $3,320 region might call for more gains in the coming days. In the stated case, Ether could rise toward the $3,400 resistance zone or even $3,450 in the near term.

More Losses In ETH?

If Ethereum fails to clear the $3,250 resistance, it could start a fresh decline. Initial support on the downside is near the $3,200 level. The first major support sits near the $3,180 zone.

A clear move below the $3,180 support might push the price toward the $3,120 support. Any more losses might send the price toward the $3,050 region. The main support could be $3,000.

Technical Indicators

Hourly MACDThe MACD for ETH/USD is losing momentum in the bearish zone.

Hourly RSIThe RSI for ETH/USD is now below the 50 zone.

Major Support Level – $3,180

Major Resistance Level – $3,280

Ethereum Maintains Structural Strength Despite Resistance Near $3,400

17 January 2026 at 19:00

Ethereum continues to show resilience, holding its ground above key support levels even as price faces firm resistance near the $3,400 zone. The ability to sustain strength after recent gains highlights improving market structure, suggesting that buyers remain in control. As long as ETH stays supported above its critical trend levels, the broader upside narrative remains intact despite near-term hesitation.

Daily Bull Market Support Band Holds As Key Reversal Zone

Luca, in a recent ETH update shared on X, pointed out that Ethereum’s market structure has strengthened considerably over the past several days. The price has been able to hold above the 1D Bull Market Support Band, a level that has acted as a reliable reversal zone multiple times over the last couple of months. This sustained hold suggests improving market confidence and a reduction in immediate downside risk.

Alongside this structural improvement, ETH successfully reclaimed the 0.618 Fibonacci point of interest around the $3,100 region. This level is often viewed as a critical threshold in corrective phases, and holding above it typically signals that buyers are gaining the upper hand. 

Ethereum

Despite the positive developments, Ethereum has not moved higher without hesitation. ETH’s price recently faced rejection near the 0.5 Fibonacci level around $3,400, an outcome Luca noted was largely expected. Historically, this area has acted as a significant decision point, often attracting selling pressure and temporary pullbacks before the market decides on its next direction.

Looking forward, Luca believes the overall outlook remains constructive as long as ETH continues to trade above the 1D Bull Market Support Band and the 0.618 Fibonacci level. Maintaining these supports would keep the path open for renewed upside attempts, even if short-term consolidations occur, and the analyst’s positioning remains unchanged.

ETH Above Daily 200MA, Structure Remains Constructive

According to a recent post by Daan Crypto Trades, Ethereum is still advancing gradually while respecting the Daily 200-day moving average against Bitcoin. This type of slow, methodical grind often signals strength beneath the surface, suggesting that buyers remain in control even without aggressive momentum.

The analyst explained that prolonged consolidations and steady climbs like this typically resolve with an acceleration phase. Should ETH break out with stronger upside momentum, it could serve as a trigger for renewed interest across the altcoin market, helping lift sentiment and price action.

However, the structure remains conditional. Holding the Daily 200MA, highlighted in purple, is critical to maintaining this constructive setup. In parallel, Bitcoin must stay above the $94,000 level to maintain the broader low-timeframe bullish structure. As long as these conditions are met, the path of least resistance continues to favor further upside.

Ethereum

❌
❌