❌

Normal view

There are new articles available, click to refresh the page.
Before yesterdayMain stream

Dogecoin Price Prediction: Is a DOGE Price Explosion Coming as Whales Accumulate 138M Coins Overnight

18 December 2025 at 13:10

Whales are going all in on DOGE, accumulating 138 million tokens overnight in a testament to bullish Dogecoin price predictions.

The meme coin has been in free fall over the past week, and the choice to size in and buy the dip now could suggest smart money is betting on a bottom.

Analysis from popular pseudonymous X trader Tartigrade may reveal the deceptively bullish setup they’re betting on.

$Doge/weekly#Dogecoin has formed a lower wick below the Fibonacci -0.272 level and has now moved below the support line for a second test, just before a massive surge πŸ”₯ pic.twitter.com/y4iEh60eLG

β€” Trader Tardigrade (@TATrader_Alan) December 18, 2025

The October flash-crash caused a wick to retest the $0.109 -0.272 Fib level, and that same level is now in for a retest with the breakdown of long-term support at the $0.15 0 Fib level.

This is a near-identical setup to that which preceded the 2024 bull run, but this time it’s bigger. If history repeats, Dogecoin may have yet to realise its strongest run this cycle.

Glassnode data supports the potential that the bull market may still have room to run, with a shrinking share of circulating DOGE supply now sitting in profit.

The seven-day moving average shows fewer profitable holders than at previous cycle peaks, a pattern typically seen during consolidation or corrective phases.

DOGE circulating supply in profit (7-day average). Source: Glassnode.

Dogecoin Price Analysis: Breakout

The setup noted by tartegrade could put a year-long brewing descending triangle pattern back in play, ruling out the breakdown of its lower $0.15 support as false.

DOGE USD 1-day chart, descending tringle pattern. Source: TradingView.
DOGE USD 1-day chart, descending triangle pattern. Source: TradingView.

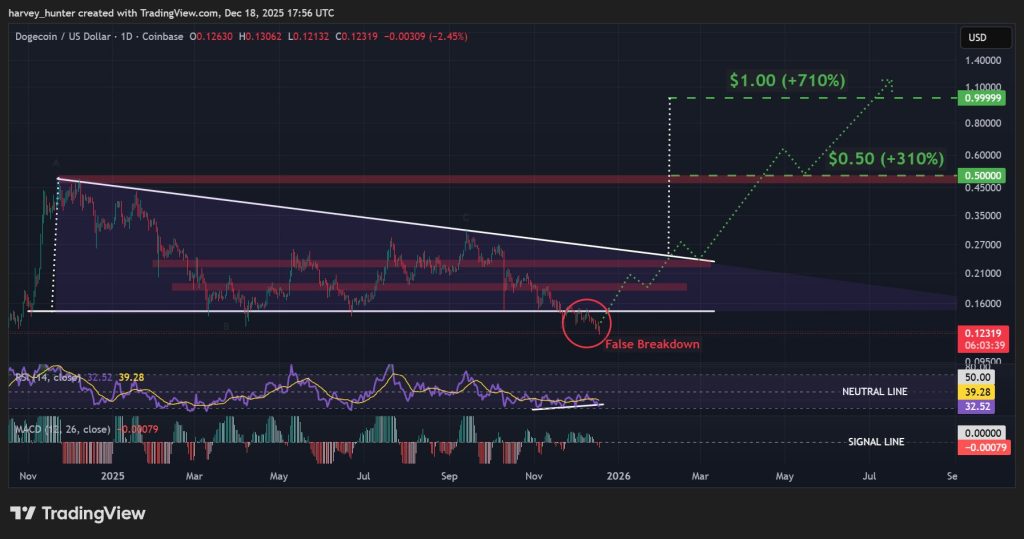
A prospect supported by momentum indicators. The RSI has continued to form a bullish divergence throughout the breakdown, a sign of weakening sell pressure not typical of a breakdown.

The MACD death cross below the signal line stands to be short-lived as sellers appear to be losing control of the prevailing trend.

The key breakout threshold sits around historical support at $0.18, with $0.22 acting as interim resistance for a sustained breakout push.

A clean triangle breakout sets up a measured move of roughly 310% to past highs around $0.50, and a fully realised target of $1 for a potoentail 710% gain.

Though such a move likely hinges on supportive market conditions, such a U.S. Fed policy shift ot quantatitative easing (QE) in 2026 to stimulate risk appetite.

Maxi Doge: The Next Bull Run Play?

Every bull run eventually delivers its own parabolic Doge-themed runner. Shiba Inu carried the torch from Dogecoin in 2021, then Floki, Bonk, Dogwifhat, and most recently, Neiro in 2024.

After $DOGE , SHIB , $PEPE , $BONK , & $FLOKI

WHO IS NEXT #100x #memecoin IN NEXT #bullrun ??? pic.twitter.com/ZT3Ztto0db

β€” BSC Gems Alert🚨 (@BSCGemsAlert) November 11, 2025

If the biggest bull run of this cycle has not been realised yet, the same could be said about the next Doge, and speculators are increasingly eyeing Maxi Doge ($MAXI) as the next moonshot.

The hype is already showing in the numbers. The $MAXI presale has raised almost $4.35 million, while early backers are earning up to 71% APY through staking rewards.

For those who missed the Doge wave before, Maxi Doge could be the next chance to catch a meme coin breakout before it takes off.

Visit the Official Maxi Doge Website Here

The post Dogecoin Price Prediction: Is a DOGE Price Explosion Coming as Whales Accumulate 138M Coins Overnight appeared first on Cryptonews.

Major Ethereum Whale Returns: Buys $119M In ETH Amid Market Drop

15 December 2025 at 15:00

Ethereum is struggling to regain momentum after failing to reclaim the $3,200 level, keeping the market in a fragile equilibrium. Despite several recovery attempts, price action suggests that bulls are now focused less on pushing higher and more on defending current demand zones. This hesitation reflects broader uncertainty across the crypto market, where traders remain cautious amid tightening liquidity and elevated macro risk.

However, beneath the surface, on-chain activity is beginning to tell a more nuanced story. According to Lookonchain, data sourced from Arkham reveals that a major market participant has re-entered aggressively. The so-called 66kETHBorrow Whale, who previously accumulated 489,696 ETH worth roughly $1.5 billion, has started buying Ethereum again as prices declined.

This behavior stands out because it occurred during weakness rather than strength, a pattern typically associated with strategic accumulation rather than short-term speculation.

Whale activity during drawdowns often signals confidence in higher prices over a longer time horizon, even when sentiment remains fragile. While Ethereum still faces technical resistance overhead, the return of large buyers suggests that demand is weak but has not disappeared.

Whale Accumulation Raises Questions Amid Ethereum Weakness

Lookonchain data provides further insight into the recent actions of the 66kETHBorrow whale, highlighting a sequence that has drawn significant attention from the market. Over the past eight hours, the whale borrowed approximately $85 million in USDT from Aave and transferred the funds to Binance.

Shortly after, he withdrew 38,576 ETH, valued at roughly $119.3 million, from the exchange. This rapid movement of capital during a market pullback has raised questions among smaller investors, many of whom are wondering whether this whale is acting on information or conviction that is not yet reflected in price.

Ethereum Whale Transactions | Source: Arkham

Such behavior is often interpreted as deliberate accumulation, particularly when ETH is withdrawn from exchanges rather than left on trading platforms. Exchange outflows generally reduce immediate sell-side liquidity, reinforcing the perception of long-term positioning. However, it is critical to acknowledge the limits of on-chain visibility. These transactions represent only the wallets that have been publicly identified and tracked.

There is no certainty that this whale’s exposure is fully transparent. He could be holding hedges, short positions, or additional long exposure through other wallets, centralized exchanges, or derivatives markets that are not visible on-chain. As a result, while the activity suggests confidence, it should not be interpreted as definitive directional confirmation.

ETH Price Struggles Below Key Moving Averages

Ethereum is currently trading near the $3,150–$3,200 zone after a modest rebound, but the broader technical structure remains fragile. On the daily chart, ETH continues to trade below its 50-day and 100-day moving averages, both of which are now acting as dynamic resistance. The recent bounce stalled near the declining 50-day MA, highlighting the lack of strong follow-through from buyers.

ETH consolidates below supply zone | Source: ETHUSDT chart on TradingView

The 200-day moving average, positioned closer to the $3,500 area, remains well above current price levels. This reinforces that Ethereum is still in a corrective phase within a larger macro uptrend. As long as price remains below this long-term trend indicator, upside attempts are likely to face selling pressure from both swing traders and systematic strategies.

Price action over the past weeks shows a series of lower highs following the rejection near $4,000 in October, confirming a short-term bearish market structure. However, ETH has so far defended the $2,800–$2,900 support region, suggesting that buyers are still active at lower levels.

For Ethereum to shift momentum decisively, bulls must reclaim and hold above the $3,300–$3,400 range. Failure to do so keeps downside risks open, with a potential retest of prior demand zones if broader market sentiment deteriorates.

Featured image from ChatGPT, chart from TradingView.com

XRP Whale Activity Spikes At The Bottom – A Classic Pre-Rally Signal

12 December 2025 at 21:00

XRP has been under clear pressure in recent sessions, sliding toward its lowest price of the year as the broader crypto market continues to absorb heavy selling. Sentiment remains fragile, and many traders have shifted into defensive positioning while awaiting clearer macro signals.

According to a new report from CryptoQuant, however, the underlying picture is more complex than the price chart suggests. Despite the short-term decline, XRP whales are becoming increasingly active, showing no hesitation in trading and accumulating even as retail participation weakens.

This divergence between whale behavior and market sentiment is noteworthy. Historically, XRP’s most significant recoveries have begun during phases of deep pessimism, when large holders quietly build exposure rather than chase rallies.

The latest data confirms this pattern: while price approaches yearly lows, whale-driven transaction volume has risen, signaling that high-value wallets are repositioning rather than exiting.

Whale Accumulation and CVD Shift Signal a Potential XRP Bottom

The CryptoQuant report highlights that the recent surge in whale activity follows a pattern often observed during market bottoming phases. Large holders rarely accumulate aggressively during strong uptrends; instead, they tend to build positions quietly during periods of weakness, when sentiment is poor, and prices are depressed.

Their willingness to buy in the current environmentβ€”while XRP trades near yearly lowsβ€”suggests strategic positioning rather than speculative momentum chasing.

This behavior is typically interpreted as a pre-rally signal. When whales accumulate into weakness, it indicates confidence that current prices offer value and that the downside may be limited. Historically, such phases have preceded meaningful upside moves in XRP, as whale accumulation often absorbs available sell pressure and stabilizes market structure.

Supporting this view, the report also points to a notable shift in the XRP Spot Taker CVD, which has turned taker-buy dominant. This means that aggressive buyers are now driving more of the executed volume, reflecting strengthening demand in real time. A taker-buy dominant CVD often emerges before sustained rallies, as it highlights increasing willingness among market participants to buy at the ask rather than wait for dips.

XRP Ledger Spot Taker CVD | Source: CryptoQuant

Together, rising whale accumulation and a bullish CVD trend paint an increasingly constructive backdrop for XRP’s medium-term outlook.

Price Analysis: Testing Yearly Lows as Structure Weakens

XRP continues to trade near its yearly lows, with the chart showing a clear deterioration in trend structure. Price remains pinned below all major moving averagesβ€”the 50-day, 100-day, and 200-dayβ€”indicating that bullish momentum has not yet returned. The persistent rejection at the 50-day moving average throughout November and December highlights the strength of overhead resistance and the absence of sustained buying pressure from the broader market.

XRP consolidates around key level | Source: XRPUSDT chart on TradingView

The $2.00 region, now acting as a key horizontal support, has been tested multiple times over the past month. Each retest shows reduced volatility, suggesting that sellers are no longer driving aggressive breakdown attempts. But demand remains too weak to generate a meaningful rebound. A decisive loss of this level could open the door toward the $1.80–$1.90 support zone. XRP previously consolidated during the early stages of the 2025 rally.

Volume also confirms the broader downtrend. Selling spikes stand out noticeably, whereas buy-side volume remains muted. This imbalance reinforces the prevailing bearish structure, even as whale accumulation begins to appear on-chain.

For XRP to shift out of this downtrend, bulls must reclaim the 50-day moving average and produce higher lows. Until then, the chart signals continued caution. Whale activity must begin translating into visible spot demand, or the risk skews to the downside.

Featured image from ChatGPT, chart from TradingView.com

❌
❌