NASA, Aerospace Corporation Study Sharpens Focus on Ammonia Emissions
6 min read
Preparations for Next Moonwalk Simulations Underway (and Underwater)
The pungent gas contributes to fine airborne particulate pollution, which endangers human health when inhaled and absorbed in the bloodstream.
A recent study led by scientists at NASA’s Jet Propulsion Laboratory in Southern California and the nonprofit Aerospace Corporation shows how high-resolution maps of ground-level ammonia plumes can be generated with airborne sensors, highlighting a way to better track the gas. A key chemical ingredient of fine particulate matter — tiny particles in the air known to be harmful when inhaled — ammonia can be released through agricultural activities such as livestock farming and geothermal power generation as well as natural geothermal processes. Because it’s not systematically monitored, many sources of the pungent gas go undetected.
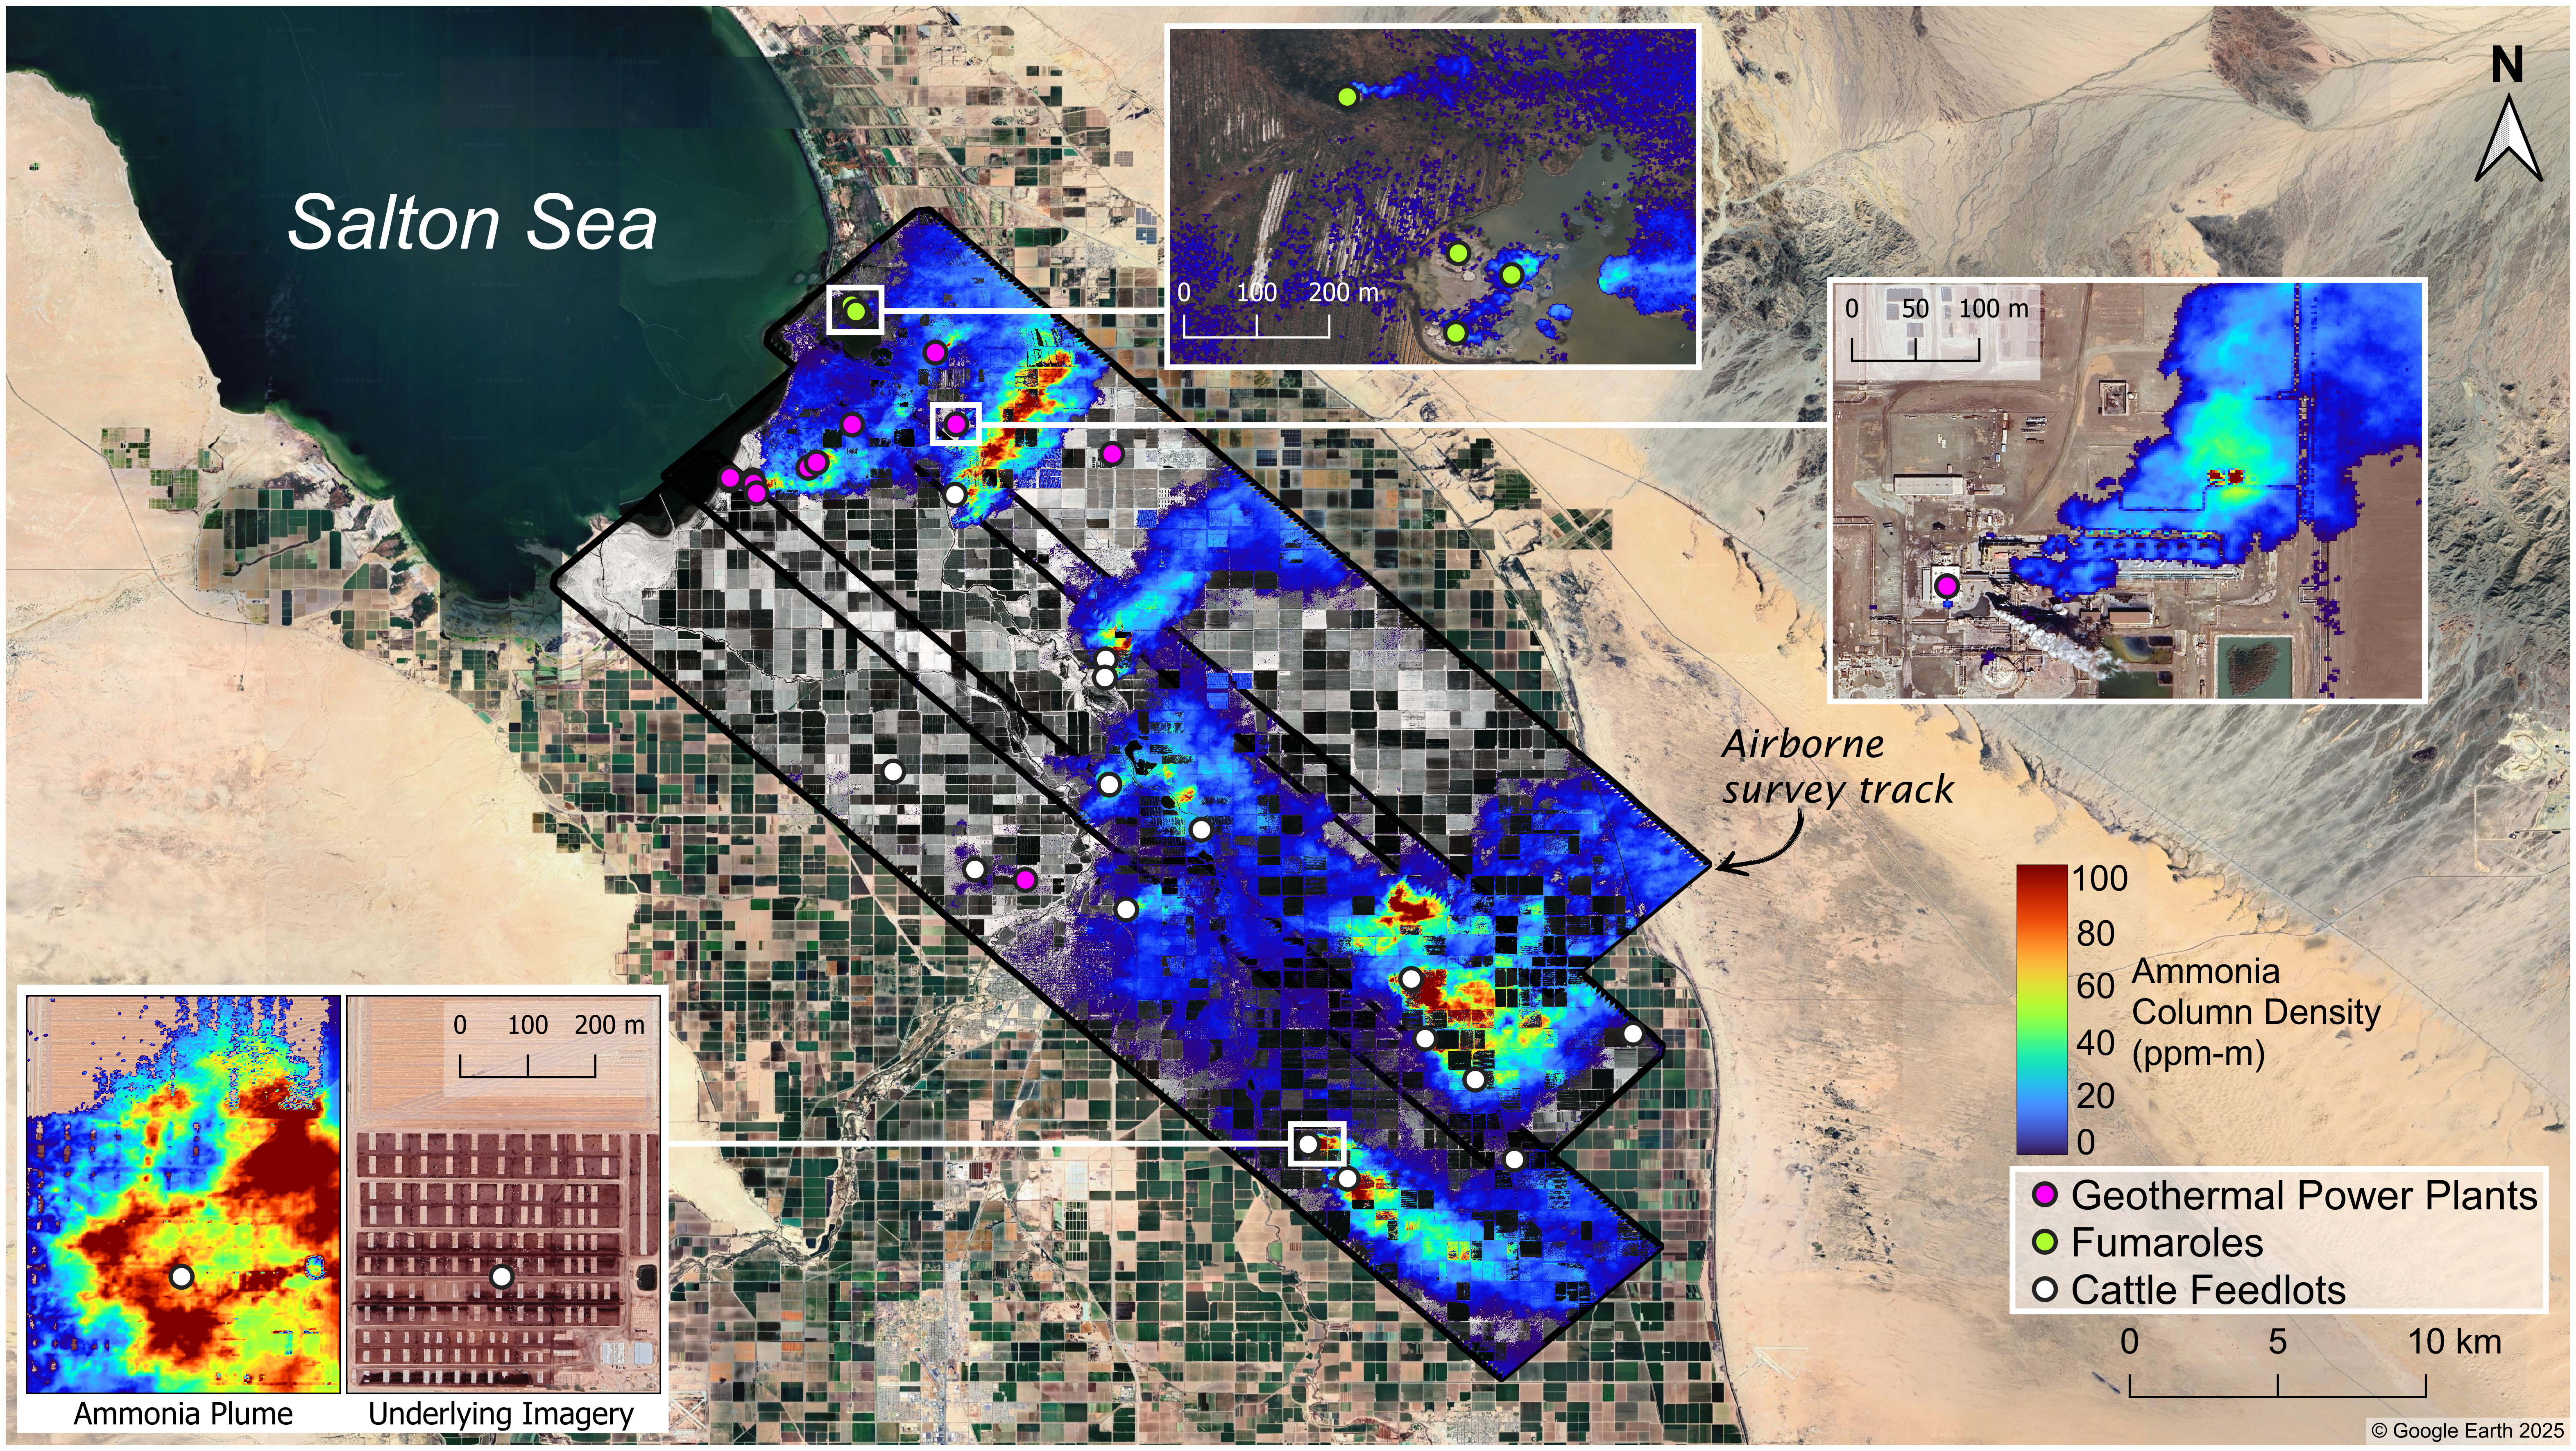
Published in Atmospheric Chemistry and Physics in October, the study focuses on a series of 2023 research flights that covered the Imperial Valley to the southeast of the Salton Sea in inland Southern California, as well as the Eastern Coachella Valley to its northwest. Prior satellite-based research has identified the Imperial Valley as a prolific source of gaseous ammonia. In the study, scientists employed an airborne sensor capable of resolving ammonia plumes with enough detail to track their origins: Aerospace Corporation’s Mako instrument is an imaging spectrometer that observes long-wave infrared light emitted by areas of Earth’s surface and atmosphere 6 feet (2 meters) across.
Using the instrument, which can detect ammonia’s chemical signature by the infrared light it absorbs, the authors found elevated levels of the gas near several sources, including agricultural fields, livestock feedlots, geothermal plants, and geothermal vents. Measurements in parts of the Imperial Valley were 2½ to eight times higher than in Coachella Valley’s Mecca community, which had ammonia concentrations closer to background levels.
Though not toxic on its own in low concentrations, ammonia is a precursor to particulate matter, also known as aerosol or particle pollution. It reacts with other gases to form solid ammonium salt particles small enough to penetrate the bloodstream from the lungs. Particles under 2.5 micrometers in diameter — also known as PM2.5 — are associated with elevated rates of asthma, lung cancer, and cardiovascular disease, among other negative health outcomes.
“Historically, more attention has focused on primary sources of PM2.5, such as auto emissions. But with significant reductions in those emissions and increasingly stringent air quality standards, there is growing interest in understanding secondary sources that form particles in the air from precursor gases,” said Sina Hasheminassab, lead author of the paper and a research scientist at JPL. “As an important precursor to PM2.5, ammonia plays a key role, but its emissions are poorly characterized and undermonitored.”
Rising ammonia
Previous satellite-based studies have shown rising levels of atmospheric ammonia, both globally and in the continental United States. That research revealed broad trends, but with spatial resolution on the order of tens of miles, the measurements were only sufficient to identify variation over areas of hundreds of square miles or more.
The chemical behavior of ammonia also poses a particular monitoring challenge: Once emitted, it only stays in the atmosphere for hours before reacting with other compounds. In contrast, carbon dioxide can remain in the air for centuries.
Planes and satellites can provide an overview of sources and the geographic distribution of emissions at a given moment. Although satellites offer wider and more recurrent coverage, airborne instruments, being closer to the source, produce higher-resolution data and can focus on specific locations at designated times.
Those proved to be the right capabilities for the recent study. Researchers flew Mako over the Imperial and Eastern Coachella valleys on the mornings and afternoons of March 28 and Sept. 25, 2023, and took concurrent measurements on the ground with both a fixed monitoring station in Mecca operated by the South Coast Air Quality Management District (AQMD) and a mobile spectrometer developed at the University of California, Riverside.
“The goal was to show that this technique was capable of delivering data with the required accuracy that aerosol scientists and potentially even air quality regulatory bodies could use to improve the air quality in those regions,” said David Tratt, a senior scientist at Aerospace Corporation and coauthor of the paper. “We ended up with maps that identify multiple sources of ammonia, and we were able to track the plumes from their sources and observe them coalescing into larger clouds.”
Distinct plumes
During the flights, the team collected data over the southeastern coast of the Salton Sea, which straddles Riverside and Imperial counties. There, Mako revealed small plumes coming from geothermal fumaroles venting superheated water and steam that react with nitrogen-bearing compounds in the soil, releasing ammonia.
Farther to the southeast, the results showed several geothermal power plants emitting ammonia, primarily from their cooling towers, as part of their normal operations.
Farther southeast still, the researchers spotted ammonia emissions, a byproduct of animal waste, from cattle farms in the Imperial Valley. During the March 28 flight, a plume from the largest facility in the study area measured up to 1.7 miles (2.8 kilometers) wide and extended up to 4.8 miles (7.7 kilometers) downwind of the source.
‘Very large puzzle’
As part of the study, AQMD’s Mecca monitoring station recorded seasonal changes in ammonia concentrations. Given the few sources in the area, the researchers surmised that winds during certain months tend to blow the gas from Imperial Valley to the Coachella Valley.
The study underscores the benefits of detailed spatial information about ammonia emissions, and it partly informed the agency’s decision in July to expand its ammonia-monitoring network and extend the life of the Mecca station.
As a precursor to PM2.5, ammonia is “one piece of a very large puzzle” that, for Coachella Valley residents, includes vehicle emissions, desert dust, and agricultural activities, said Payam Pakbin, manager of the Advanced Monitoring Technologies Unit at AQMD and a paper coauthor.
“These communities want to know the contributions of these sources to the air quality they’re experiencing,” he added. “Findings like these help our agency better prioritize which sources require the most attention and ultimately guide our focus toward those that are the highest priority for achieving emission reductions in this community.”
News Media Contacts
Andrew Wang / Andrew Good
Jet Propulsion Laboratory, Pasadena, Calif.
626-379-6874 / 626-840-4291
andrew.wang@jpl.nasa.gov / andrew.c.good@jpl.nasa.gov
2025-129
Details
Explore More
Discover Related Topics
Explore Earth Science
From its origins, NASA has studied our planet in novel ways, using a fleet of satellites and ambitious airborne and ground-based…
Earth Science at Work
NASA Earth Science helps Americans respond to challenges and societal needs — such as wildland fires, hurricanes, and water supplies…
Earth Science Data
Earth Science Missions
In order to study the Earth as a whole system and understand how it is changing, NASA develops and supports…