Normal view

There are new articles available, click to refresh the page.
Before yesterdayMain stream

Exploits and vulnerabilities in Q3 2025

3 December 2025 at 05:00

In the third quarter, attackers continued to exploit security flaws in WinRAR, while the total number of registered vulnerabilities grew again. In this report, we examine statistics on published vulnerabilities and exploits, the most common security issues impacting Windows and Linux, and the vulnerabilities being leveraged in APT attacks that lead to the launch of widespread C2 frameworks. The report utilizes anonymized Kaspersky Security Network data, which was consensually provided by our users, as well as information from open sources.

Statistics on registered vulnerabilities

This section contains statistics on registered vulnerabilities. The data is taken from cve.org.

Let us consider the number of registered CVEs by month for the last five years up to and including the third quarter of 2025.

Total published vulnerabilities by month from 2021 through 2025 (download)

As can be seen from the chart, the monthly number of vulnerabilities published in the third quarter of 2025 remains above the figures recorded in previous years. The three-month total saw over 1000 more published vulnerabilities year over year. The end of the quarter sets a rising trend in the number of registered CVEs, and we anticipate this growth to continue into the fourth quarter. Still, the overall number of published vulnerabilities is likely to drop slightly relative to the September figure by year-end

A look at the monthly distribution of vulnerabilities rated as critical upon registration (CVSS > 8.9) suggests that this metric was marginally lower in the third quarter than the 2024 figure.

Total number of critical vulnerabilities published each month from 2021 to 2025 (download)

Exploitation statistics

This section contains exploitation statistics for Q3 2025. The data draws on open sources and our telemetry.

Windows and Linux vulnerability exploitation

In Q3 2025, as before, the most common exploits targeted vulnerable Microsoft Office products.

Most Windows exploits detected by Kaspersky solutions targeted the following vulnerabilities:

  • CVE-2018-0802: a remote code execution vulnerability in the Equation Editor component
  • CVE-2017-11882: another remote code execution vulnerability, also affecting Equation Editor
  • CVE-2017-0199: a vulnerability in Microsoft Office and WordPad that allows an attacker to assume control of the system

These vulnerabilities historically have been exploited by threat actors more frequently than others, as discussed in previous reports. In the third quarter, we also observed threat actors actively exploiting Directory Traversal vulnerabilities that arise during archive unpacking in WinRAR. While the originally published exploits for these vulnerabilities are not applicable in the wild, attackers have adapted them for their needs.

  • CVE-2023-38831: a vulnerability in WinRAR that involves improper handling of objects within archive contents We discussed this vulnerability in detail in a 2024 report.
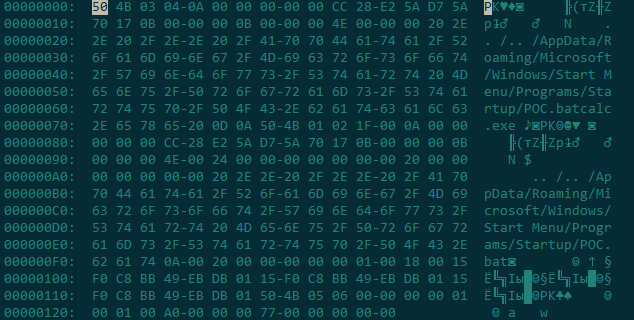
  • CVE-2025-6218 (ZDI-CAN-27198): a vulnerability that enables an attacker to specify a relative path and extract files into an arbitrary directory. A malicious actor can extract the archive into a system application or startup directory to execute malicious code. For a more detailed analysis of the vulnerability, see our Q2 2025 report.
  • CVE-2025-8088: a zero-day vulnerability similar to CVE-2025-6128, discovered during an analysis of APT attacks The attackers used NTFS Streams to circumvent controls on the directory into which files were unpacked. We will take a closer look at this vulnerability below.

It should be pointed out that vulnerabilities discovered in 2025 are rapidly catching up in popularity to those found in 2023.

All the CVEs mentioned can be exploited to gain initial access to vulnerable systems. We recommend promptly installing updates for the relevant software.

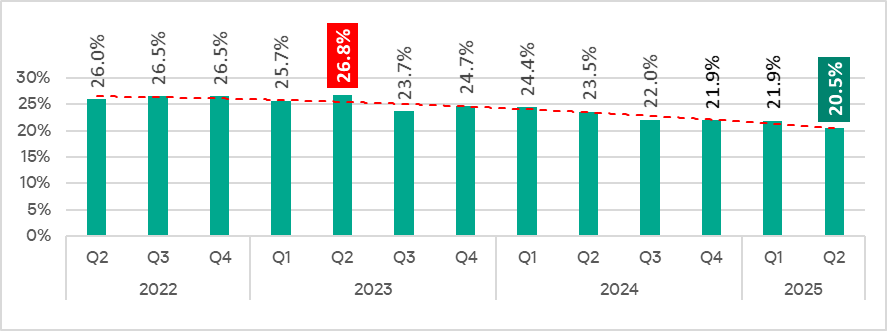
Dynamics of the number of Windows users encountering exploits, Q1 2023 — Q3 2025. The number of users who encountered exploits in Q1 2023 is taken as 100% (download)

According to our telemetry, the number of Windows users who encountered exploits increased in the third quarter compared to the previous reporting period. However, this figure is lower than that of Q3 2024.

For Linux devices, exploits for the following OS kernel vulnerabilities were detected most frequently:

  • CVE-2022-0847, also known as Dirty Pipe: a vulnerability that allows privilege escalation and enables attackers to take control of running applications
  • CVE-2019-13272: a vulnerability caused by improper handling of privilege inheritance, which can be exploited to achieve privilege escalation
  • CVE-2021-22555: a heap overflow vulnerability in the Netfilter kernel subsystem. The widespread exploitation of this vulnerability is due to its use of popular memory modification techniques: manipulating “msg_msg” primitives, which leads to a Use-After-Free security flaw.

Dynamics of the number of Linux users encountering exploits, Q1 2023 — Q3 2025. The number of users who encountered exploits in Q1 2023 is taken as 100% (download)

A look at the number of users who encountered exploits suggests that it continues to grow, and in Q3 2025, it already exceeds the Q1 2023 figure by more than six times.

It is critically important to install security patches for the Linux operating system, as it is attracting more and more attention from threat actors each year – primarily due to the growing number of user devices running Linux.

Most common published exploits

In Q3 2025, exploits targeting operating system vulnerabilities continue to predominate over those targeting other software types that we track as part of our monitoring of public research, news, and PoCs. That said, the share of browser exploits significantly increased in the third quarter, matching the share of exploits in other software not part of the operating system.

Distribution of published exploits by platform, Q1 2025 (download)

Distribution of published exploits by platform, Q2 2025 (download)

Distribution of published exploits by platform, Q3 2025 (download)

It is noteworthy that no new public exploits for Microsoft Office products appeared in Q3 2025, just as none did in Q2. However, PoCs for vulnerabilities in Microsoft SharePoint were disclosed. Since these same vulnerabilities also affect OS components, we categorized them under operating system vulnerabilities.

Vulnerability exploitation in APT attacks

We analyzed data on vulnerabilities that were exploited in APT attacks during Q3 2025. The following rankings draw on our telemetry, research, and open-source data.

TOP 10 vulnerabilities exploited in APT attacks, Q3 2025 (download)

APT attacks in Q3 2025 were dominated by zero-day vulnerabilities, which were uncovered during investigations of isolated incidents. A large wave of exploitation followed their public disclosure. Judging by the list of software containing these vulnerabilities, we are witnessing the emergence of a new go-to toolkit for gaining initial access into infrastructure and executing code both on edge devices and within operating systems. It bears mentioning that long-standing vulnerabilities, such as CVE-2017-11882, allow for the use of various data formats and exploit obfuscation to bypass detection. By contrast, most new vulnerabilities require a specific input data format, which facilitates exploit detection and enables more precise tracking of their use in protected infrastructures. Nevertheless, the risk of exploitation remains quite high, so we strongly recommend applying updates already released by vendors.

C2 frameworks

In this section, we will look at the most popular C2 frameworks used by threat actors and analyze the vulnerabilities whose exploits interacted with C2 agents in APT attacks.

The chart below shows the frequency of known C2 framework usage in attacks on users during the third quarter of 2025, according to open sources.

Top 10 C2 frameworks used by APT groups to compromise user systems in Q3 2025 (download)

Metasploit, whose share increased compared to Q2, tops the list of the most prevalent C2 frameworks from the past quarter. It is followed by Sliver and Mythic. The Empire framework also reappeared on the list after being inactive in the previous reporting period. What stands out is that Adaptix C2, although fairly new, was almost immediately embraced by attackers in real-world scenarios. Analyzed sources and samples of malicious C2 agents revealed that the following vulnerabilities were used to launch them and subsequently move within the victim’s network:

  • CVE-2020-1472, also known as ZeroLogon, allows for compromising a vulnerable operating system and executing commands as a privileged user.
  • CVE-2021-34527, also known as PrintNightmare, exploits flaws in the Windows print spooler subsystem, also enabling remote access to a vulnerable OS and high-privilege command execution.
  • CVE-2025-6218 or CVE-2025-8088 are similar Directory Traversal vulnerabilities that allow extracting files from an archive to a predefined path without the archiving utility notifying the user. The first was discovered by researchers but subsequently weaponized by attackers. The second is a zero-day vulnerability.

Interesting vulnerabilities

This section highlights the most noteworthy vulnerabilities that were publicly disclosed in Q3 2025 and have a publicly available description.

ToolShell (CVE-2025-49704 and CVE-2025-49706, CVE-2025-53770 and CVE-2025-53771): insecure deserialization and an authentication bypass

ToolShell refers to a set of vulnerabilities in Microsoft SharePoint that allow attackers to bypass authentication and gain full control over the server.

  • CVE-2025-49704 involves insecure deserialization of untrusted data, enabling attackers to execute malicious code on a vulnerable server.
  • CVE-2025-49706 allows access to the server by bypassing authentication.
  • CVE-2025-53770 is a patch bypass for CVE-2025-49704.
  • CVE-2025-53771 is a patch bypass for CVE-2025-49706.

These vulnerabilities form one of threat actors’ combinations of choice, as they allow for compromising accessible SharePoint servers with just a few requests. Importantly, they were all patched back in July, which further underscores the importance of promptly installing critical patches. A detailed description of the ToolShell vulnerabilities can be found in our blog.

CVE-2025-8088: a directory traversal vulnerability in WinRAR

CVE-2025-8088 is very similar to CVE-2025-6218, which we discussed in our previous report. In both cases, attackers use relative paths to trick WinRAR into extracting archive contents into system directories. This version of the vulnerability differs only in that the attacker exploits Alternate Data Streams (ADS) and can use environment variables in the extraction path.

CVE-2025-41244: a privilege escalation vulnerability in VMware Aria Operations and VMware Tools

Details about this vulnerability were presented by researchers who claim it was used in real-world attacks in 2024.

At the core of the vulnerability lies the fact that an attacker can substitute the command used to launch the Service Discovery component of the VMware Aria tooling or the VMware Tools utility suite. This leads to the unprivileged attacker gaining unlimited privileges on the virtual machine. The vulnerability stems from an incorrect regular expression within the get-versions.sh script in the Service Discovery component, which is responsible for identifying the service version and runs every time a new command is passed.

Conclusion and advice

The number of recorded vulnerabilities continued to rise in Q3 2025, with some being almost immediately weaponized by attackers. The trend is likely to continue in the future.

The most common exploits for Windows are primarily used for initial system access. Furthermore, it is at this stage that APT groups are actively exploiting new vulnerabilities. To hinder attackers’ access to infrastructure, organizations should regularly audit systems for vulnerabilities and apply patches in a timely manner. These measures can be simplified and automated with Kaspersky Systems Management. Kaspersky Symphony can provide comprehensive and flexible protection against cyberattacks of any complexity.

Kaspersky Security Bulletin 2025. Statistics

By: AMR
2 December 2025 at 05:07

All statistics in this report come from Kaspersky Security Network (KSN), a global cloud service that receives information from components in our security solutions voluntarily provided by Kaspersky users. Millions of Kaspersky users around the globe assist us in collecting information about malicious activity. The statistics in this report cover the period from November 2024 through October 2025. The report doesn’t cover mobile statistics, which we will share in our annual mobile malware report.

During the reporting period:

  • 48% of Windows users and 29% of macOS users encountered cyberthreats
  • 27% of all Kaspersky users encountered web threats, and 33% users were affected by on-device threats
  • The highest share of users affected by web threats was in CIS (34%), and local threats were most often detected in Africa (41%)
  • Kaspersky solutions prevented nearly 1,6 times more password stealer attacks than in the previous year
  • In APAC password stealer detections saw a 132% surge compared to the previous year
  • Kaspersky solutions detected 1,5 times more spyware attacks than in the previous year

To find more yearly statistics on cyberthreats view the full report.

IT threat evolution in Q3 2025. Mobile statistics

19 November 2025 at 05:00

IT threat evolution in Q3 2025. Mobile statistics
IT threat evolution in Q3 2025. Non-mobile statistics

The quarter at a glance

In the third quarter of 2025, we updated the methodology for calculating statistical indicators based on the Kaspersky Security Network. These changes affected all sections of the report except for the statistics on installation packages, which remained unchanged.

To illustrate the differences between the reporting periods, we have also recalculated data for the previous quarters. Consequently, these figures may significantly differ from the previously published ones. However, subsequent reports will employ this new methodology, enabling precise comparisons with the data presented in this post.

The Kaspersky Security Network (KSN) is a global network for analyzing anonymized threat information, voluntarily shared by users of Kaspersky solutions. The statistics in this report are based on KSN data unless explicitly stated otherwise.

The quarter in numbers

According to Kaspersky Security Network, in Q3 2025:

  • 47 million attacks utilizing malware, adware, or unwanted mobile software were prevented.
  • Trojans were the most widespread threat among mobile malware, encountered by 15.78% of all attacked users of Kaspersky solutions.
  • More than 197,000 malicious installation packages were discovered, including:
    • 52,723 associated with mobile banking Trojans.
    • 1564 packages identified as mobile ransomware Trojans.

Quarterly highlights

The number of malware, adware, or unwanted software attacks on mobile devices, calculated according to the updated rules, totaled 3.47 million in the third quarter. This is slightly less than the 3.51 million attacks recorded in the previous reporting period.

Attacks on users of Kaspersky mobile solutions, Q2 2024 — Q3 2025 (download)

At the start of the quarter, a user complained to us about ads appearing in every browser on their smartphone. We conducted an investigation, discovering a new version of the BADBOX backdoor, preloaded on the device. This backdoor is a multi-level loader embedded in a malicious native library, librescache.so, which was loaded by the system framework. As a result, a copy of the Trojan infiltrated every process running on the device.

Another interesting finding was Trojan-Downloader.AndroidOS.Agent.no, which was embedded in mods for messaging and other apps. It downloaded Trojan-Clicker.AndroidOS.Agent.bl onto the device. The clicker received a URL from its server where an ad was being displayed, opened it in an invisible WebView window, and used machine learning algorithms to find and click the close button. In this way, fraudsters exploited the user’s device to artificially inflate ad views.

Mobile threat statistics

In the third quarter, Kaspersky security solutions detected 197,738 samples of malicious and unwanted software for Android, which is 55,000 more than in the previous reporting period.

Detected malicious and potentially unwanted installation packages, Q3 2024 — Q3 2025 (download)

The detected installation packages were distributed by type as follows:

Detected mobile apps by type, Q2* — Q3 2025 (download)

* Changes in the statistical calculation methodology do not affect this metric. However, data for the previous quarter may differ slightly from previously published figures due to a retrospective review of certain verdicts.

The share of banking Trojans decreased somewhat, but this was due less to a reduction in their numbers and more to an increase in other malicious and unwanted packages. Nevertheless, banking Trojans, still dominated by Mamont packages, continue to hold the top spot. The rise in Trojan droppers is also linked to them: these droppers are primarily designed to deliver banking Trojans.

Share* of users attacked by the given type of malicious or potentially unwanted app out of all targeted users of Kaspersky mobile products, Q2 — Q3 2025 (download)

* The total may exceed 100% if the same users experienced multiple attack types.

Adware leads the pack in terms of the number of users attacked, with a significant margin. The most widespread types of adware are HiddenAd (56.3%) and MobiDash (27.4%). RiskTool-type unwanted apps occupy the second spot. Their growth is primarily due to the proliferation of the Revpn module, which monetizes user internet access by turning their device into a VPN exit point. The most popular Trojans predictably remain Triada (55.8%) and Fakemoney (24.6%). The percentage of users who encountered these did not undergo significant changes.

TOP 20 most frequently detected types of mobile malware

Note that the malware rankings below exclude riskware and potentially unwanted software, such as RiskTool or adware.

Verdict %* Q2 2025 %* Q3 2025 Difference in p.p. Change in ranking
Trojan.AndroidOS.Triada.ii 0.00 13.78 +13.78
Trojan.AndroidOS.Triada.fe 12.54 10.32 –2.22 –1
Trojan.AndroidOS.Triada.gn 9.49 8.56 –0.93 –1
Trojan.AndroidOS.Fakemoney.v 8.88 6.30 –2.59 –1
Backdoor.AndroidOS.Triada.z 3.75 4.53 +0.77 +1
DangerousObject.Multi.Generic. 4.39 4.52 +0.13 –1
Trojan-Banker.AndroidOS.Coper.c 3.20 2.86 –0.35 +1
Trojan.AndroidOS.Triada.if 0.00 2.82 +2.82
Trojan-Dropper.Linux.Agent.gen 3.07 2.64 –0.43 +1
Trojan-Dropper.AndroidOS.Hqwar.cq 0.37 2.52 +2.15 +60
Trojan.AndroidOS.Triada.hf 2.26 2.41 +0.14 +2
Trojan.AndroidOS.Triada.ig 0.00 2.19 +2.19
Backdoor.AndroidOS.Triada.ab 0.00 2.00 +2.00
Trojan-Banker.AndroidOS.Mamont.da 5.22 1.82 –3.40 –10
Trojan-Banker.AndroidOS.Mamont.hi 0.00 1.80 +1.80
Trojan.AndroidOS.Triada.ga 3.01 1.71 –1.29 –5
Trojan.AndroidOS.Boogr.gsh 1.60 1.68 +0.08 0
Trojan-Downloader.AndroidOS.Agent.nq 0.00 1.63 +1.63
Trojan.AndroidOS.Triada.hy 3.29 1.62 –1.67 –12
Trojan-Clicker.AndroidOS.Agent.bh 1.32 1.56 +0.24 0

* Unique users who encountered this malware as a percentage of all attacked users of Kaspersky mobile solutions.

The top positions in the list of the most widespread malware are once again occupied by modified messaging apps Triada.ii, Triada.fe, Triada.gn, and others. The pre-installed backdoor Triada.z ranked fifth, immediately following Fakemoney – fake apps that collect users’ personal data under the guise of providing payments or financial services. The dropper that landed in ninth place, Agent.gen, is an obfuscated ELF file linked to the banking Trojan Coper.c, which sits immediately after DangerousObject.Multi.Generic.

Region-specific malware

In this section, we describe malware that primarily targets users in specific countries.

Verdict Country* %**
Trojan-Dropper.AndroidOS.Hqwar.bj Turkey 97.22
Trojan-Banker.AndroidOS.Coper.c Turkey 96.35
Trojan-Dropper.AndroidOS.Agent.sm Turkey 95.10
Trojan-Banker.AndroidOS.Coper.a Turkey 95.06
Trojan-Dropper.AndroidOS.Agent.uq India 92.20
Trojan-Banker.AndroidOS.Rewardsteal.qh India 91.56
Trojan-Banker.AndroidOS.Agent.wb India 85.89
Trojan-Dropper.AndroidOS.Rewardsteal.ab India 84.14
Trojan-Dropper.AndroidOS.Banker.bd India 82.84
Backdoor.AndroidOS.Teledoor.a Iran 81.40
Trojan-Dropper.AndroidOS.Hqwar.gy Turkey 80.37
Trojan-Dropper.AndroidOS.Banker.ac India 78.55
Trojan-Ransom.AndroidOS.Rkor.ii Germany 76.90
Trojan-Dropper.AndroidOS.Banker.bg India 75.12
Trojan-Banker.AndroidOS.UdangaSteal.b Indonesia 75.00
Trojan-Dropper.AndroidOS.Banker.bc India 74.73
Backdoor.AndroidOS.Teledoor.c Iran 70.33

* The country where the malware was most active.
** Unique users who encountered this Trojan modification in the indicated country as a percentage of all Kaspersky mobile security solution users attacked by the same modification.

Banking Trojans, primarily Coper, continue to operate actively in Turkey. Indian users also attract threat actors distributing this type of software. Specifically, the banker Rewardsteal is active in the country. Teledoor backdoors, embedded in a fake Telegram client, have been deployed in Iran.
Notable is the surge in Rkor ransomware Trojan attacks in Germany. The activity was significantly lower in previous quarters. It appears the fraudsters have found a new channel for delivering malicious apps to users.

Mobile banking Trojans

In the third quarter of 2025, 52,723 installation packages for mobile banking Trojans were detected, 10,000 more than in the second quarter.

Installation packages for mobile banking Trojans detected by Kaspersky, Q3 2024 — Q3 2025 (download)

The share of the Mamont Trojan among all bankers slightly increased again, reaching 61.85%. However, in terms of the share of attacked users, Coper moved into first place, with the same modification being used in most of its attacks. Variants of Mamont ranked second and lower, as different samples were used in different attacks. Nevertheless, the total number of users attacked by the Mamont family is greater than that of users attacked by Coper.

TOP 10 mobile bankers

Verdict %* Q2 2025 %* Q3 2025 Difference in p.p. Change in ranking
Trojan-Banker.AndroidOS.Coper.c 13.42 13.48 +0.07 +1
Trojan-Banker.AndroidOS.Mamont.da 21.86 8.57 –13.28 –1
Trojan-Banker.AndroidOS.Mamont.hi 0.00 8.48 +8.48
Trojan-Banker.AndroidOS.Mamont.gy 0.00 6.90 +6.90
Trojan-Banker.AndroidOS.Mamont.hl 0.00 4.97 +4.97
Trojan-Banker.AndroidOS.Agent.ws 0.00 4.02 +4.02
Trojan-Banker.AndroidOS.Mamont.gg 0.40 3.41 +3.01 +35
Trojan-Banker.AndroidOS.Mamont.cb 3.03 3.31 +0.29 +5
Trojan-Banker.AndroidOS.Creduz.z 0.17 3.30 +3.13 +58
Trojan-Banker.AndroidOS.Mamont.fz 0.07 3.02 +2.95 +86

* Unique users who encountered this malware as a percentage of all Kaspersky mobile security solution users who encountered banking threats.

Mobile ransomware Trojans

Due to the increased activity of mobile ransomware Trojans in Germany, which we mentioned in the Region-specific malware section, we have decided to also present statistics on this type of threat. In the third quarter, the number of ransomware Trojan installation packages more than doubled, reaching 1564.

Verdict %* Q2 2025 %* Q3 2025 Difference in p.p. Change in ranking
Trojan-Ransom.AndroidOS.Rkor.ii 7.23 24.42 +17.19 +10
Trojan-Ransom.AndroidOS.Rkor.pac 0.27 16.72 +16.45 +68
Trojan-Ransom.AndroidOS.Congur.aa 30.89 16.46 –14.44 –1
Trojan-Ransom.AndroidOS.Svpeng.ac 30.98 16.39 –14.59 –3
Trojan-Ransom.AndroidOS.Rkor.it 0.00 10.09 +10.09
Trojan-Ransom.AndroidOS.Congur.cw 15.71 9.69 –6.03 –3
Trojan-Ransom.AndroidOS.Congur.ap 15.36 9.16 –6.20 –3
Trojan-Ransom.AndroidOS.Small.cj 14.91 8.49 –6.42 –3
Trojan-Ransom.AndroidOS.Svpeng.snt 13.04 8.10 –4.94 –2
Trojan-Ransom.AndroidOS.Svpeng.ah 13.13 7.63 –5.49 –4

* Unique users who encountered the malware as a percentage of all Kaspersky mobile security solution users attacked by ransomware Trojans.

IT threat evolution in Q3 2025. Non-mobile statistics

By: AMR
19 November 2025 at 05:00

IT threat evolution in Q3 2025. Mobile statistics
IT threat evolution in Q3 2025. Non-mobile statistics

Quarterly figures

In Q3 2025:

  • Kaspersky solutions blocked more than 389 million attacks that originated with various online resources.
  • Web Anti-Virus responded to 52 million unique links.
  • File Anti-Virus blocked more than 21 million malicious and potentially unwanted objects.
  • 2,200 new ransomware variants were detected.
  • Nearly 85,000 users experienced ransomware attacks.
  • 15% of all ransomware victims whose data was published on threat actors’ data leak sites (DLSs) were victims of Qilin.
  • More than 254,000 users were targeted by miners.

Ransomware

Quarterly trends and highlights

Law enforcement success

The UK’s National Crime Agency (NCA) arrested the first suspect in connection with a ransomware attack that caused disruptions at numerous European airports in September 2025. Details of the arrest have not been published as the investigation remains ongoing. According to security researcher Kevin Beaumont, the attack employed the HardBit ransomware, which he described as primitive and lacking its own data leak site.

The U.S. Department of Justice filed charges against the administrator of the LockerGoga, MegaCortex and Nefilim ransomware gangs. His attacks caused millions of dollars in damage, putting him on wanted lists for both the FBI and the European Union.

U.S. authorities seized over $2.8 million in cryptocurrency, $70,000 in cash, and a luxury vehicle from a suspect allegedly involved in distributing the Zeppelin ransomware. The criminal scheme involved data theft, file encryption, and extortion, with numerous organizations worldwide falling victim.

A coordinated international operation conducted by the FBI, Homeland Security Investigations (HSI), the U.S. Internal Revenue Service (IRS), and law enforcement agencies from several other countries successfully dismantled the infrastructure of the BlackSuit ransomware. The operation resulted in the seizure of four servers, nine domains, and $1.09 million in cryptocurrency. The objective of the operation was to destabilize the malware ecosystem and protect critical U.S. infrastructure.

Vulnerabilities and attacks

SSL VPN attacks on SonicWall

Since late July, researchers have recorded a rise in attacks by the Akira threat actor targeting SonicWall firewalls supporting SSL VPN. SonicWall has linked these incidents to the already-patched vulnerability CVE-2024-40766, which allows unauthorized users to gain access to system resources. Attackers exploited the vulnerability to steal credentials, subsequently using them to access devices, even those that had been patched. Furthermore, the attackers were able to bypass multi-factor authentication enabled on the devices. SonicWall urges customers to reset all passwords and update their SonicOS firmware.

Scattered Spider uses social engineering to breach VMware ESXi

The Scattered Spider (UNC3944) group is attacking VMware virtual environments. The attackers contact IT support posing as company employees and request to reset their Active Directory password. Once access to vCenter is obtained, the threat actors enable SSH on the ESXi servers, extract the NTDS.dit database, and, in the final phase of the attack, deploy ransomware to encrypt all virtual machines.

Exploitation of a Microsoft SharePoint vulnerability

In late July, researchers uncovered attacks on SharePoint servers that exploited the ToolShell vulnerability chain. In the course of investigating this campaign, which affected over 140 organizations globally, researchers discovered the 4L4MD4R ransomware based on Mauri870 code. The malware is written in Go and packed using the UPX compressor. It demands a ransom of 0.005 BTC.

The application of AI in ransomware development

A UK-based threat actor used Claude to create and launch a ransomware-as-a-service (RaaS) platform. The AI was responsible for writing the code, which included advanced features such as anti-EDR techniques, encryption using ChaCha20 and RSA algorithms, shadow copy deletion, and network file encryption.

Anthropic noted that the attacker was almost entirely dependent on Claude, as they lacked the necessary technical knowledge to provide technical support to their own clients. The threat actor sold the completed malware kits on the dark web for $400–$1,200.

Researchers also discovered a new ransomware strain, dubbed PromptLock, that utilizes an LLM directly during attacks. The malware is written in Go. It uses hardcoded prompts to dynamically generate Lua scripts for data theft and encryption across Windows, macOS and Linux systems. For encryption, it employs the SPECK-128 algorithm, which is rarely used by ransomware groups.

Subsequently, scientists from the NYU Tandon School of Engineering traced back the likely origins of PromptLock to their own educational project, Ransomware 3.0, which they detailed in a prior publication.

The most prolific groups

This section highlights the most prolific ransomware gangs by number of victims added to each group’s DLS. As in the previous quarter, Qilin leads by this metric. Its share grew by 1.89 percentage points (p.p.) to reach 14.96%. The Clop ransomware showed reduced activity, while the share of Akira (10.02%) slightly increased. The INC Ransom group, active since 2023, rose to third place with 8.15%.

Number of each group’s victims according to its DLS as a percentage of all groups’ victims published on all the DLSs under review during the reporting period (download)

Number of new variants

In the third quarter, Kaspersky solutions detected four new families and 2,259 new ransomware modifications, nearly one-third more than in Q2 2025 and slightly more than in Q3 2024.

Number of new ransomware modifications, Q3 2024 — Q3 2025 (download)

Number of users attacked by ransomware Trojans

During the reporting period, our solutions protected 84,903 unique users from ransomware. Ransomware activity was highest in July, while August proved to be the quietest month.

Number of unique users attacked by ransomware Trojans, Q3 2025 (download)

Attack geography

TOP 10 countries attacked by ransomware Trojans

In the third quarter, Israel had the highest share (1.42%) of attacked users. Most of the ransomware in that country was detected in August via behavioral analysis.

Country/territory* %**
1 Israel 1.42
2 Libya 0.64
3 Rwanda 0.59
4 South Korea 0.58
5 China 0.51
6 Pakistan 0.47
7 Bangladesh 0.45
8 Iraq 0.44
9 Tajikistan 0.39
10 Ethiopia 0.36

* Excluded are countries and territories with relatively few (under 50,000) Kaspersky users.
** Unique users whose computers were attacked by ransomware Trojans as a percentage of all unique users of Kaspersky products in the country/territory.

TOP 10 most common families of ransomware Trojans

Name Verdict %*
1 (generic verdict) Trojan-Ransom.Win32.Gen 26.82
2 (generic verdict) Trojan-Ransom.Win32.Crypren 8.79
3 (generic verdict) Trojan-Ransom.Win32.Encoder 8.08
4 WannaCry Trojan-Ransom.Win32.Wanna 7.08
5 (generic verdict) Trojan-Ransom.Win32.Agent 4.40
6 LockBit Trojan-Ransom.Win32.Lockbit 3.06
7 (generic verdict) Trojan-Ransom.Win32.Crypmod 2.84
8 (generic verdict) Trojan-Ransom.Win32.Phny 2.58
9 PolyRansom/VirLock Trojan-Ransom.Win32.PolyRansom / Virus.Win32.PolyRansom 2.54
10 (generic verdict) Trojan-Ransom.MSIL.Agent 2.05

* Unique Kaspersky users attacked by the specific ransomware Trojan family as a percentage of all unique users attacked by this type of threat.

Miners

Number of new variants

In Q3 2025, Kaspersky solutions detected 2,863 new modifications of miners.

Number of new miner modifications, Q3 2025 (download)

Number of users attacked by miners

During the third quarter, we detected attacks using miner programs on the computers of 254,414 unique Kaspersky users worldwide.

Number of unique users attacked by miners, Q3 2025 (download)

Attack geography

TOP 10 countries and territories attacked by miners

Country/territory* %**
1 Senegal 3.52
2 Mali 1.50
3 Afghanistan 1.17
4 Algeria 0.95
5 Kazakhstan 0.93
6 Tanzania 0.92
7 Dominican Republic 0.86
8 Ethiopia 0.77
9 Portugal 0.75
10 Belarus 0.75

* Excluded are countries and territories with relatively few (under 50,000) Kaspersky users.
** Unique users whose computers were attacked by miners as a percentage of all unique users of Kaspersky products in the country/territory.

Attacks on macOS

In April, researchers at Iru (formerly Kandji) reported the discovery of a new spyware family, PasivRobber. We observed the development of this family throughout the third quarter. Its new modifications introduced additional executable modules that were absent in previous versions. Furthermore, the attackers began employing obfuscation techniques in an attempt to hinder sample detection.

In July, we reported on a cryptostealer distributed through fake extensions for the Cursor AI development environment, which is based on Visual Studio Code. At that time, the malicious JavaScript (JS) script downloaded a payload in the form of the ScreenConnect remote access utility. This utility was then used to download cryptocurrency-stealing VBS scripts onto the victim’s device. Later, researcher Michael Bocanegra reported on new fake VS Code extensions that also executed malicious JS code. This time, the code downloaded a malicious macOS payload: a Rust-based loader. This loader then delivered a backdoor to the victim’s device, presumably also aimed at cryptocurrency theft. The backdoor supported the loading of additional modules to collect data about the victim’s machine. The Rust downloader was analyzed in detail by researchers at Iru.

In September, researchers at Jamf reported the discovery of a previously unknown version of the modular backdoor ChillyHell, first described in 2023. Notably, the Trojan’s executable files were signed with a valid developer certificate at the time of discovery.

The new sample had been available on Dropbox since 2021. In addition to its backdoor functionality, it also contains a module responsible for bruteforcing passwords of existing system users.

By the end of the third quarter, researchers at Microsoft reported new versions of the XCSSET spyware, which targets developers and spreads through infected Xcode projects. These new versions incorporated additional modules for data theft and system persistence.

TOP 20 threats to macOS

Unique users* who encountered this malware as a percentage of all attacked users of Kaspersky security solutions for macOS (download)

* Data for the previous quarter may differ slightly from previously published data due to some verdicts being retrospectively revised.

The PasivRobber spyware continues to increase its activity, with its modifications occupying the top spots in the list of the most widespread macOS malware varieties. Other highly active threats include Amos Trojans, which steal passwords and cryptocurrency wallet data, and various adware. The Backdoor.OSX.Agent.l family, which took thirteenth place, represents a variation on the well-known open-source malware, Mettle.

Geography of threats to macOS

TOP 10 countries and territories by share of attacked users

Country/territory %* Q2 2025 %* Q3 2025
Mainland China 2.50 1.70
Italy 0.74 0.85
France 1.08 0.83
Spain 0.86 0.81
Brazil 0.70 0.68
The Netherlands 0.41 0.68
Mexico 0.76 0.65
Hong Kong 0.84 0.62
United Kingdom 0.71 0.58
India 0.76 0.56

IoT threat statistics

This section presents statistics on attacks targeting Kaspersky IoT honeypots. The geographic data on attack sources is based on the IP addresses of attacking devices.

In Q3 2025, there was a slight increase in the share of devices attacking Kaspersky honeypots via the SSH protocol.

Distribution of attacked services by number of unique IP addresses of attacking devices (download)

Conversely, the share of attacks using the SSH protocol slightly decreased.

Distribution of attackers’ sessions in Kaspersky honeypots (download)

TOP 10 threats delivered to IoT devices

Share of each threat delivered to an infected device as a result of a successful attack, out of the total number of threats delivered (download)

In the third quarter, the shares of the NyaDrop and Mirai.b botnets significantly decreased in the overall volume of IoT threats. Conversely, the activity of several other members of the Mirai family, as well as the Gafgyt botnet, increased. As is typical, various Mirai variants occupy the majority of the list of the most widespread malware strains.

Attacks on IoT honeypots

Germany and the United States continue to lead in the distribution of attacks via the SSH protocol. The share of attacks originating from Panama and Iran also saw a slight increase.

Country/territory Q2 2025 Q3 2025
Germany 24.58% 13.72%
United States 10.81% 13.57%
Panama 1.05% 7.81%
Iran 1.50% 7.04%
Seychelles 6.54% 6.69%
South Africa 2.28% 5.50%
The Netherlands 3.53% 3.94%
Vietnam 3.00% 3.52%
India 2.89% 3.47%
Russian Federation 8.45% 3.29%

The largest number of attacks via the Telnet protocol were carried out from China, as is typically the case. Devices located in India reduced their activity, whereas the share of attacks from Indonesia increased.

Country/territory Q2 2025 Q3 2025
China 47.02% 57.10%
Indonesia 5.54% 9.48%
India 28.08% 8.66%
Russian Federation 4.85% 7.44%
Pakistan 3.58% 6.66%
Nigeria 1.66% 3.25%
Vietnam 0.55% 1.32%
Seychelles 0.58% 0.93%
Ukraine 0.51% 0.73%
Sweden 0.39% 0.72%

Attacks via web resources

The statistics in this section are based on detection verdicts by Web Anti-Virus, which protects users when suspicious objects are downloaded from malicious or infected web pages. These malicious pages are purposefully created by cybercriminals. Websites that host user-generated content, such as message boards, as well as compromised legitimate sites, can become infected.

TOP 10 countries that served as sources of web-based attacks

This section gives the geographical distribution of sources of online attacks (such as web pages redirecting to exploits, sites hosting exploits and other malware, and botnet C2 centers) blocked by Kaspersky products. One or more web-based attacks could originate from each unique host.

To determine the geographic source of web attacks, we matched the domain name with the real IP address where the domain is hosted, then identified the geographic location of that IP address (GeoIP).

In the third quarter of 2025, Kaspersky solutions blocked 389,755,481 attacks from internet resources worldwide. Web Anti-Virus was triggered by 51,886,619 unique URLs.

Web-based attacks by country, Q3 2025 (download)

Countries and territories where users faced the greatest risk of online infection

To assess the risk of malware infection via the internet for users’ computers in different countries and territories, we calculated the share of Kaspersky users in each location on whose computers Web Anti-Virus was triggered during the reporting period. The resulting data provides an indication of the aggressiveness of the environment in which computers operate in different countries and territories.

This ranked list includes only attacks by malicious objects classified as Malware. Our calculations leave out Web Anti-Virus detections of potentially dangerous or unwanted programs, such as RiskTool or adware.

Country/territory* %**
1 Panama 11.24
2 Bangladesh 8.40
3 Tajikistan 7.96
4 Venezuela 7.83
5 Serbia 7.74
6 Sri Lanka 7.57
7 North Macedonia 7.39
8 Nepal 7.23
9 Albania 7.04
10 Qatar 6.91
11 Malawi 6.90
12 Algeria 6.74
13 Egypt 6.73
14 Bosnia and Herzegovina 6.59
15 Tunisia 6.54
16 Belgium 6.51
17 Kuwait 6.49
18 Turkey 6.41
19 Belarus 6.40
20 Bulgaria 6.36

* Excluded are countries and territories with relatively few (under 10,000) Kaspersky users.
** Unique users targeted by web-based Malware attacks as a percentage of all unique users of Kaspersky products in the country/territory.
On average, over the course of the quarter, 4.88% of devices globally were subjected to at least one web-based Malware attack.

Local threats

Statistics on local infections of user computers are an important indicator. They include objects that penetrated the target computer by infecting files or removable media, or initially made their way onto the computer in non-open form. Examples of the latter are programs in complex installers and encrypted files.

Data in this section is based on analyzing statistics produced by anti-virus scans of files on the hard drive at the moment they were created or accessed, and the results of scanning removable storage media: flash drives, camera memory cards, phones, and external drives. The statistics are based on detection verdicts from the on-access scan (OAS) and on-demand scan (ODS) modules of File Anti-Virus.

In the third quarter of 2025, our File Anti-Virus recorded 21,356,075 malicious and potentially unwanted objects.

Countries and territories where users faced the highest risk of local infection

For each country and territory, we calculated the percentage of Kaspersky users on whose computers File Anti-Virus was triggered during the reporting period. This statistic reflects the level of personal computer infection in different countries and territories around the world.

Note that this ranked list includes only attacks by malicious objects classified as Malware. Our calculations leave out File Anti-Virus detections of potentially dangerous or unwanted programs, such as RiskTool or adware.

Country/territory* %**
1 Turkmenistan 45.69
2 Yemen 33.19
3 Afghanistan 32.56
4 Tajikistan 31.06
5 Cuba 30.13
6 Uzbekistan 29.08
7 Syria 25.61
8 Bangladesh 24.69
9 China 22.77
10 Vietnam 22.63
11 Cameroon 22.53
12 Belarus 21.98
13 Tanzania 21.80
14 Niger 21.70
15 Mali 21.29
16 Iraq 20.77
17 Nicaragua 20.75
18 Algeria 20.51
19 Congo 20.50
20 Venezuela 20.48

* Excluded are countries and territories with relatively few (under 10,000) Kaspersky users.
** Unique users on whose computers local Malware threats were blocked, as a percentage of all unique users of Kaspersky products in the country/territory.

On average worldwide, local Malware threats were detected at least once on 12.36% of computers during the third quarter.

Threat landscape for industrial automation systems in Q2 2025

19 September 2025 at 06:00

Statistics across all threats

In Q2 2025, the percentage of ICS computers on which malicious objects were blocked decreased by 1.4 pp from the previous quarter to 20.5%.

Percentage of ICS computers on which malicious objects were blocked, Q2 2022–Q2 2025

Percentage of ICS computers on which malicious objects were blocked, Q2 2022–Q2 2025

Compared to Q2 2024, the rate decreased by 3.0 pp.

Regionally, the percentage of ICS computers on which malicious objects were blocked ranged from 11.2% in Northern Europe to 27.8% in Africa.

Regions ranked by percentage of ICS computers on which malicious objects were blocked

Regions ranked by percentage of ICS computers on which malicious objects were blocked

In most of the regions surveyed in this report, the figures decreased from the previous quarter. They increased only in Australia and New Zealand, as well as Northern Europe.

Changes in percentage of ICS computers on which malicious objects were blocked, Q2 2025

Changes in percentage of ICS computers on which malicious objects were blocked, Q2 2025

Selected industries

The biometrics sector led the ranking of the industries and OT infrastructures surveyed in this report in terms of the percentage of ICS computers on which malicious objects were blocked.

Ranking of industries and OT infrastructures by percentage of ICS computers on which malicious objects were blocked

Ranking of industries and OT infrastructures by percentage of ICS computers on which malicious objects were blocked

In Q2 2025, the percentage of ICS computers on which malicious objects were blocked decreased across all industries.

Percentage of ICS computers on which malicious objects were blocked in selected industries

Percentage of ICS computers on which malicious objects were blocked in selected industries

Diversity of detected malicious objects

In Q2 2025, Kaspersky security solutions blocked malware from 10,408 different malware families from various categories on industrial automation systems.

Percentage of ICS computers on which the activity of malicious objects from various categories was blocked

Percentage of ICS computers on which the activity of malicious objects from various categories was blocked

The only increases were in the percentages of ICS computers on which denylisted internet resources (1.2 times more than in the previous quarter) and malicious documents (1.1 times more) were blocked.

Main threat sources

Depending on the threat detection and blocking scenario, it is not always possible to reliably identify the source. The circumstantial evidence for a specific source can be the blocked threat’s type (category).

The internet (visiting malicious or compromised internet resources; malicious content distributed via messengers; cloud data storage and processing services and CDNs), email clients (phishing emails), and removable storage devices remain the primary sources of threats to computers in an organization’s technology infrastructure.

In Q2 2025, the percentage of ICS computers on which threats from email clients were blocked continued to increase. The main categories of threats from email clients blocked on ICS computers are malicious documents, spyware, malicious scripts and phishing pages. The indicator increased in all regions except Russia. By contrast, the global average for other threat sources decreased. Moreover, the rates reached their lowest levels since Q2 2022.

Percentage of ICS computers on which malicious objects from various sources were blocked

Percentage of ICS computers on which malicious objects from various sources were blocked

The same computer can be attacked by several categories of malware from the same source during a quarter. That computer is counted when calculating the percentage of attacked computers for each threat category, but is only counted once for the threat source (we count unique attacked computers). In addition, it is not always possible to accurately determine the initial infection attempt. Therefore, the total percentage of ICS computers on which various categories of threats from a certain source were blocked exceeds the percentage of threats from the source itself.

The rates for all threat sources varied across the monitored regions.

  • The percentage of ICS computers on which threats from the internet were blocked ranged from 6.35% in East Asia to 11.88% in Africa
  • The percentage of ICS computers on which threats from email clients were blocked ranged from 0.80% in Russia to 7.23% in Southern Europe
  • The percentage of ICS computers on which threats from removable media were blocked ranged from 0.04% in Australia and New Zealand to 1.77% in Africa
  • The percentage of ICS computers on which threats from network folders were blocked ranged from 0.01% in Northern Europe to 0.25% in East Asia

Threat categories

A typical attack blocked within an OT network is a multi-stage process, where each subsequent step by the attackers is aimed at increasing privileges and gaining access to other systems by exploiting the security problems of industrial enterprises, including technological infrastructures.

It is worth noting that during the attack, intruders often repeat the same steps (TTPs), especially when they use malicious scripts and established communication channels with the management and control infrastructure (C2) to move laterally within the network and advance the attack.

Malicious objects used for initial infection

In Q2 2025, the percentage of ICS computers on which denylisted internet resources were blocked increased to 5.91%.

Percentage of ICS computers on which denylisted internet resources were blocked, Q2 2022–Q2 2025

Percentage of ICS computers on which denylisted internet resources were blocked, Q2 2022–Q2 2025

The percentage of ICS computers on which denylisted internet resources were blocked ranged from 3.28% in East Asia to 6.98% in Africa. Russia and Eastern Europe were also among the top three regions for this indicator. It increased in all regions and this growth is associated with the addition of direct links to malicious code hosted on popular public websites and file-sharing services.

The percentage of ICS computers on which malicious documents were blocked has grown for two consecutive quarters. The rate reached 1.97% (up 0.12 pp) and returned to the level seen in Q3 2024. The percentage increased in all regions except Latin America.
The percentage of ICS computers on which malicious scripts and phishing pages were blocked decreased to 6.49% (down 0.67 pp).

Next-stage malware

Malicious objects used to initially infect computers deliver next-stage malware (spyware, ransomware, and miners) to victims’ computers. As a rule, the higher the percentage of ICS computers on which the initial infection malware is blocked, the higher the percentage for next-stage malware.

In Q2 2025, the percentage of ICS computers on which malicious objects from all categories were blocked decreased. The rates are:

  • Spyware: 3.84% (down 0.36 pp);
  • Ransomware: 0.14% (down 0.02 pp);
  • Miners in the form of executable files for Windows: 0.63% (down 0.15 pp);
  • Web miners: 0.30% (down 0.23 pp), its lowest level since Q2 2022.

Self-propagating malware

Self-propagating malware (worms and viruses) is a category unto itself. Worms and virus-infected files were originally used for initial infection, but as botnet functionality evolved, they took on next-stage characteristics.

To spread across ICS networks, viruses and worms rely on removable media, network folders, infected files including backups, and network attacks on outdated software such as Radmin2.

In Q2 2025, the percentage of ICS computers on which worms and viruses were blocked decreased to 1.22% (down 0.09 pp) and 1.29% (down 0.24 pp). Both are the lowest values since Q2 2022.

AutoCAD malware

This category of malware can spread in a variety of ways, so it does not belong to a specific group.

In Q2 2025, the percentage of ICS computers on which AutoCAD malware was blocked continued to decrease to 0.29% (down 0.05 pp) and reached its lowest level since Q2 2022.

For more information on industrial threats see the full version of the report.

IT threat evolution in Q2 2025. Mobile statistics

5 September 2025 at 05:00

IT threat evolution in Q2 2025. Mobile statistics
IT threat evolution in Q2 2025. Non-mobile statistics

The mobile section of our quarterly cyberthreat report includes statistics on malware, adware, and potentially unwanted software for Android, as well as descriptions of the most notable threats for Android and iOS discovered during the reporting period. The statistics in this report are based on detection alerts from Kaspersky products, collected from users who consented to provide anonymized data to Kaspersky Security Network.

Quarterly figures

According to Kaspersky Security Network, in Q2 2025:

  • Our solutions blocked 10.71 million malware, adware, and unwanted mobile software attacks.
  • Trojans, the most common mobile threat, affected 31.69% of Kaspersky users who encountered mobile threats during the reporting period.
  • Just under 143,000 malicious installation packages were detected, of which:
    • 42,220 were mobile banking Trojans;
    • 695 packages were mobile ransomware Trojans.

Quarterly highlights

Mobile attacks involving malware, adware, and unwanted software dropped to 10.71 million.

Attacks on users of Kaspersky mobile solutions, Q4 2023 — Q2 2025 (download)

The trend is mainly due to a decrease in the activity of RiskTool.AndroidOS.SpyLoan. These are applications typically associated with microlenders and containing a potentially dangerous framework for monitoring borrowers and collecting their data, such as contacts lists. Curiously, such applications have been found pre-installed on some devices.

In Q2, we found a new malicious app for Android and iOS that was stealing images from the gallery. We were able to determine that this campaign was linked to the previously discovered SparkCat, so we dubbed it SparkKitty.

Fake app store page distributing SparkKitty

Fake app store page distributing SparkKitty

Like its “big brother”, the new malware most likely targets recovery codes for crypto wallets saved as screenshots.

Trojan-DDoS.AndroidOS.Agent.a was this past quarter’s unusual discovery. Malicious actors embedded an SDK for conducting dynamically configurable DDoS attacks into apps designed for viewing adult content. The Trojan allows for sending specific data to addresses designated by the attacker at a set frequency. Building a DDoS botnet from mobile devices with adult apps installed may seem like a questionable venture in terms of attack efficiency and power – but apparently, some cybercriminals have found a use for this approach.

In Q2, we also encountered Trojan-Spy.AndroidOS.OtpSteal.a, a fake VPN client that hijacks user accounts. Instead of the advertised features, it uses the Notification Listener service to intercept OTP codes from various messaging apps and social networks, and sends them to the attackers’ Telegram chat via a bot.

Mobile threat statistics

The number of Android malware and potentially unwanted app samples decreased from Q1, reaching a total of 142,762 installation packages.

Detected malware and potentially unwanted app installation packages, Q2 2024 — Q2 2025 (download)

The distribution of detected installation packages by type in Q2 was as follows:

Detected mobile malware by type, Q1 — Q2 2025 (download)

* Data for the previous quarter may differ slightly from previously published data due to some verdicts being retrospectively revised.

Banking Trojans remained in first place, with their share increasing relative to Q1. The Mamont family continues to dominate this category. In contrast, spy Trojans dropped to fifth place as the surge in the number of APK files for the SMS-stealing Trojan-Spy.AndroidOS.Agent.akg subsided. The number of Agent.amw spyware files, which masquerade as casino apps, also decreased.

RiskTool-type unwanted apps and adware ranked second and third, respectively, while Trojans – with most files belonging to the Triada family – occupied the fourth place.

Share* of users attacked by the given type of malicious or potentially unwanted apps out of all targeted users of Kaspersky mobile products, Q1 — Q2 2025 (download)

* The total may exceed 100% if the same users experienced multiple attack types.

The distribution of attacked users remained close to that of the previous quarter. The increase in the share of backdoors is linked to the discovery of Backdoor.Triada.z, which came pre-installed on devices. As for adware, the proportion of users affected by the HiddenAd family has grown.

TOP 20 most frequently detected types of mobile malware

Note that the malware rankings below exclude riskware or potentially unwanted software, such as RiskTool or adware.

Verdict %* Q1 2025 %* Q2 2025 Difference (p.p.) Change in rank
Trojan.AndroidOS.Fakemoney.v 26.41 14.57 -11.84 0
Trojan-Banker.AndroidOS.Mamont.da 11.21 12.42 +1.20 +2
Backdoor.AndroidOS.Triada.z 4.71 10.29 +5.58 +3
Trojan.AndroidOS.Triada.fe 3.48 7.16 +3.69 +4
Trojan-Banker.AndroidOS.Mamont.ev 0.00 6.97 +6.97
Trojan.AndroidOS.Triada.gn 2.68 6.54 +3.86 +3
Trojan-Banker.AndroidOS.Mamont.db 16.00 5.50 -10.50 -4
Trojan-Banker.AndroidOS.Mamont.ek 1.83 5.09 +3.26 +7
DangerousObject.Multi.Generic. 19.30 4.21 -15.09 -7
Trojan-Banker.AndroidOS.Mamont.eb 1.59 2.58 +0.99 +7
Trojan.AndroidOS.Triada.hf 3.81 2.41 -1.40 -4
Trojan-Downloader.AndroidOS.Dwphon.a 2.19 2.24 +0.05 0
Trojan-Banker.AndroidOS.Mamont.ef 2.44 2.20 -0.24 -2
Trojan-Banker.AndroidOS.Mamont.es 0.05 2.13 +2.08
Trojan-Banker.AndroidOS.Mamont.dn 1.46 2.13 +0.67 +5
Trojan-Downloader.AndroidOS.Agent.mm 1.45 1.56 +0.11 +6
Trojan-Banker.AndroidOS.Agent.rj 1.86 1.45 -0.42 -3
Trojan-Banker.AndroidOS.Mamont.ey 0.00 1.42 +1.42
Trojan-Banker.AndroidOS.Mamont.bc 7.61 1.39 -6.23 -14
Trojan.AndroidOS.Boogr.gsh 1.41 1.36 -0.06 +3

* Unique users who encountered this malware as a percentage of all attacked users of Kaspersky mobile solutions.

The activity of Fakemoney scam apps noticeably decreased in Q2, but they still held the top position. Almost all the other entries on the list are variants of the popular banking Trojan Mamont, pre-installed Trojans like Triada and Dwphon, and modified messaging apps with the Triada Trojan built in (Triada.fe, Triada.gn, Triada.ga, and Triada.gs).

Region-specific malware

This section describes malware types that mostly affected specific countries.

Verdict Country* %**
Trojan-Banker.AndroidOS.Coper.c Türkiye 98.65
Trojan-Banker.AndroidOS.Coper.a Türkiye 97.78
Trojan-Dropper.AndroidOS.Rewardsteal.h India 95.62
Trojan-Banker.AndroidOS.Rewardsteal.lv India 95.48
Trojan-Dropper.AndroidOS.Agent.sm Türkiye 94.52
Trojan.AndroidOS.Fakeapp.hy Uzbekistan 86.51
Trojan.AndroidOS.Piom.bkzj Uzbekistan 85.83
Trojan-Dropper.AndroidOS.Pylcasa.c Brazil 83.06

* The country where the malware was most active.
** Unique users who encountered this Trojan variant in the indicated country as a percentage of all Kaspersky mobile security solution users attacked by the same variant.

In addition to the typical banking Trojans for this category – Coper, which targets users in Türkiye, and Rewatrdsteal, active in India – the list also includes the fake job search apps Fakeapp.hy and Piom.bkzj, which specifically target Uzbekistan. Both families collect the user’s personal data. Meanwhile, new droppers named “Pylcasa” operated in Brazil. They infiltrate Google Play by masquerading as simple apps, such as calculators, but once launched, they open a URL provided by malicious actors – similar to Trojans of the Fakemoney family. These URLs may lead to illegal casino websites or phishing pages.

Mobile banking Trojans

The number of banking Trojans detected in Q2 2025 was slightly lower than in Q1 but still significantly exceeded the figures for 2024. Kaspersky solutions detected a total of 42,220 installation packages of this type.

Number of installation packages for mobile banking Trojans detected by Kaspersky, Q2 2024 — Q2 2025 (download)

The bulk of mobile banking Trojan installation packages still consists of various modifications of Mamont, which account for 57.7%. In terms of the share of affected users, Mamont also outpaced all its competitors, occupying nearly all the top spots on the list of the most widespread banking Trojans.

TOP 10 mobile bankers

Verdict %* Q1 2025 %* Q2 2025 Difference (p.p.) Change in rank
Trojan-Banker.AndroidOS.Mamont.da 26.68 30.28 +3.59 +1
Trojan-Banker.AndroidOS.Mamont.ev 0.00 17.00 +17.00
Trojan-Banker.AndroidOS.Mamont.db 38.07 13.41 -24.66 -2
Trojan-Banker.AndroidOS.Mamont.ek 4.37 12.42 +8.05 +2
Trojan-Banker.AndroidOS.Mamont.eb 3.80 6.29 +2.50 +2
Trojan-Banker.AndroidOS.Mamont.ef 5.80 5.36 -0.45 -2
Trojan-Banker.AndroidOS.Mamont.es 0.12 5.20 +5.07 +23
Trojan-Banker.AndroidOS.Mamont.dn 3.48 5.20 +1.72 +1
Trojan-Banker.AndroidOS.Agent.rj 4.43 3.53 -0.90 -4
Trojan-Banker.AndroidOS.Mamont.ey 0.00 3.47 +3.47 9

Conclusion

In Q2 2025, the number of attacks involving malware, adware, and unwanted software decreased compared to Q1. At the same time, Trojans and banking Trojans remained the most common threats, particularly the highly active Mamont family. Additionally, the quarter was marked by the discovery of the second spyware Trojan of 2025 to infiltrate the App Store, along with a fake VPN client stealing OTP codes and a DDoS bot concealed within porn-viewing apps.

IT threat evolution in Q2 2025. Non-mobile statistics

By: AMR
5 September 2025 at 05:00

IT threat evolution in Q2 2025. Non-mobile statistics
IT threat evolution in Q2 2025. Mobile statistics

The statistics in this report are based on detection verdicts returned by Kaspersky products unless otherwise stated. The information was provided by Kaspersky users who consented to sharing statistical data.

The quarter in numbers

In Q2 2025:

  • Kaspersky solutions blocked more than 471 million attacks originating from various online resources.
  • Web Anti-Virus detected 77 million unique links.
  • File Anti-Virus blocked nearly 23 million malicious and potentially unwanted objects.
  • There were 1,702 new ransomware modifications discovered.
  • Just under 86,000 users were targeted by ransomware attacks.
  • Of all ransomware victims whose data was published on threat actors’ data leak sites (DLS), 12% were victims of Qilin.
  • Almost 280,000 users were targeted by miners.

Ransomware

Quarterly trends and highlights

Law enforcement success

The alleged malicious actor behind the Black Kingdom ransomware attacks was indicted in the U.S. The Yemeni national is accused of infecting about 1,500 computers in the U.S. and other countries through vulnerabilities in Microsoft Exchange. He also stands accused of demanding a ransom of $10,000 in bitcoin, which is the amount victims saw in the ransom note. He is also alleged to be the developer of the Black Kingdom ransomware.

A Ukrainian national was extradited to the U.S. in the Nefilim case. He was arrested in Spain in June 2024 on charges of distributing ransomware and extorting victims. According to the investigation, he had been part of the Nefilim Ransomware-as-a-Service (RaaS) operation since 2021, targeting high-revenue organizations. Nefilim uses the classic double extortion scheme: cybercriminals steal the victim’s data, encrypt it, then threaten to publish it online.

Also arrested was a member of the Ryuk gang, charged with organizing initial access to victims’ networks. The accused was apprehended in Kyiv in April 2025 at the request of the FBI and extradited to the U.S. in June.

A man suspected of being involved in attacks by the DoppelPaymer gang was arrested. In a joint operation by law enforcement in the Netherlands and Moldova, the 45-year-old was arrested in May. He is accused of carrying out attacks against Dutch organizations in 2021. Authorities seized around €84,800 and several devices.

A 39-year-old Iranian national pleaded guilty to participating in RobbinHood ransomware attacks. Among the targets of the attacks, which took place from 2019 to 2024, were U.S. local government agencies, healthcare providers, and non-profit organizations.

Vulnerabilities and attacks

Mass exploitation of a vulnerability in SAP NetWeaver

In May, it was revealed that several ransomware gangs, including BianLian and RansomExx, had been exploiting CVE-2025-31324 in SAP NetWeaver software. Successful exploitation of this vulnerability allows attackers to upload malicious files without authentication, which can lead to a complete system compromise.

Attacks via the SimpleHelp remote administration tool

The DragonForce group compromised an MSP provider, attacking its clients with the help of the SimpleHelp remote administration tool. According to researchers, the attackers exploited a set of vulnerabilities (CVE-2024-57727, CVE-2024-57728, CVE-2024-57726) in the software to launch the DragonForce ransomware on victims’ hosts.

Qilin exploits vulnerabilities in Fortinet

In June, news broke that the Qilin gang (also known as Agenda) was actively exploiting critical vulnerabilities in Fortinet devices to infiltrate corporate networks. The attackers allegedly exploited the vulnerabilities CVE-2024-21762 and CVE-2024-55591 in FortiGate software, which allowed them to bypass authentication and execute malicious code remotely. After gaining access, the cybercriminals encrypted data on systems within the corporate network and demanded a ransom.

Exploitation of a Windows CLFS vulnerability

April saw the detection of attacks that leveraged CVE-2025-29824, a zero-day vulnerability in the Windows Common Log File System (CLFS) driver, a core component of the Windows OS. This vulnerability allows an attacker to elevate privileges on a compromised system. Researchers have linked these incidents to the RansomExx and Play gangs. The attackers targeted companies in North and South America, Europe, and the Middle East.

The most prolific groups

This section highlights the most prolific ransomware gangs by number of victims added to each group’s DLS during the reporting period. In the second quarter, Qilin (12.07%) proved to be the most prolific group. RansomHub, the leader of 2024 and the first quarter of 2025, seems to have gone dormant since April. Clop (10.83%) and Akira (8.53%) swapped places compared to the previous reporting period.

Number of each group’s victims according to its DLS as a percentage of all groups’ victims published on all the DLSs under review during the reporting period (download)

Number of new variants

In the second quarter, Kaspersky solutions detected three new families and 1,702 new ransomware variants. This is significantly fewer than in the previous reporting period. The decrease is linked to the renewed decline in the count of the Trojan-Ransom.Win32.Gen verdicts, following a spike last quarter.

Number of new ransomware modifications, Q2 2024 — Q2 2025 (download)

Number of users attacked by ransomware Trojans

Our solutions protected a total of 85,702 unique users from ransomware during the second quarter.

Number of unique users attacked by ransomware Trojans, Q2 2025 (download)

Geography of attacked users

TOP 10 countries and territories attacked by ransomware Trojans

Country/territory* %**
1 Libya 0.66
2 China 0.58
3 Rwanda 0.57
4 South Korea 0.51
5 Tajikistan 0.49
6 Bangladesh 0.45
7 Iraq 0.45
8 Pakistan 0.38
9 Brazil 0.38
10 Tanzania 0.35

* Excluded are countries and territories with relatively few (under 50,000) Kaspersky users.
** Unique users whose computers were attacked by ransomware Trojans as a percentage of all unique users of Kaspersky products in the country/territory.

TOP 10 most common families of ransomware Trojans

Name Verdict %*
1 (generic verdict) Trojan-Ransom.Win32.Gen 23.33
2 WannaCry Trojan-Ransom.Win32.Wanna 7.80
3 (generic verdict) Trojan-Ransom.Win32.Encoder 6.25
4 (generic verdict) Trojan-Ransom.Win32.Crypren 6.24
5 (generic verdict) Trojan-Ransom.Win32.Agent 3.75
6 Cryakl/CryLock Trojan-Ransom.Win32.Cryakl 3.34
7 PolyRansom/VirLock Virus.Win32.PolyRansom / Trojan-Ransom.Win32.PolyRansom 3.03
8 (generic verdict) Trojan-Ransom.Win32.Crypmod 2.81
9 (generic verdict) Trojan-Ransom.Win32.Phny 2.78
10 (generic verdict) Trojan-Ransom.MSIL.Agent 2.41

* Unique Kaspersky users attacked by the specific ransomware Trojan family as a percentage of all unique users attacked by this type of threat.

Miners

Number of new variants

In the second quarter of 2025, Kaspersky solutions detected 2,245 new modifications of miners.

Number of new miner modifications, Q2 2025 (download)

Number of users attacked by miners

During the second quarter, we detected attacks using miner programs on the computers of 279,630 unique Kaspersky users worldwide.

Number of unique users attacked by miners, Q2 2025 (download)

Geography of attacked users

TOP 10 countries and territories attacked by miners

Country/territory* %**
1 Senegal 3.49
2 Panama 1.31
3 Kazakhstan 1.11
4 Ethiopia 1.02
5 Belarus 1.01
6 Mali 0.96
7 Tajikistan 0.88
8 Tanzania 0.80
9 Moldova 0.80
10 Dominican Republic 0.80

* Excluded are countries and territories with relatively few (under 50,000) Kaspersky users.
** Unique users whose computers were attacked by miners as a percentage of all unique users of Kaspersky products in the country/territory.

Attacks on macOS

Among the threats to macOS, one of the biggest discoveries of the second quarter was the PasivRobber family. This spyware consists of a huge number of modules designed to steal data from QQ, WeChat, and other messaging apps and applications that are popular mainly among Chinese users. Its distinctive feature is that the spyware modules get embedded into the target process when the device goes into sleep mode.

Closer to the middle of the quarter, several reports (1, 2, 3) emerged about attackers stepping up their activity, posing as victims’ trusted contacts on Telegram and convincing them to join a Zoom call. During or before the call, the user was persuaded to run a seemingly Zoom-related utility, but which was actually malware. The infection chain led to the download of a backdoor written in the Nim language and bash scripts that stole data from browsers.

TOP 20 threats to macOS

* Unique users who encountered this malware as a percentage of all attacked users of Kaspersky security solutions for macOS (download)

* Data for the previous quarter may differ slightly from previously published data due to some verdicts being retrospectively revised.

A new piece of spyware named PasivRobber, discovered in the second quarter, immediately became the most widespread threat, attacking more users than the fake cleaners and adware typically seen on macOS. Also among the most common threats were the password- and crypto wallet-stealing Trojan Amos and the general detection Trojan.OSX.Agent.gen, which we described in our previous report.

Geography of threats to macOS

TOP 10 countries and territories by share of attacked users

Country/territory %* Q1 2025 %* Q2 2025
Mainland China 0.73% 2.50%
France 1.52% 1.08%
Hong Kong 1.21% 0.84%
India 0.84% 0.76%
Mexico 0.85% 0.76%
Brazil 0.66% 0.70%
Germany 0.96% 0.69%
Singapore 0.32% 0.63%
Russian Federation 0.50% 0.41%
South Korea 0.10% 0.32%

* Unique users who encountered threats to macOS as a percentage of all unique Kaspersky users in the country/territory.

IoT threat statistics

This section presents statistics on attacks targeting Kaspersky IoT honeypots. The geographic data on attack sources is based on the IP addresses of attacking devices.

In the second quarter of 2025, there was another increase in both the share of attacks using the Telnet protocol and the share of devices connecting to Kaspersky honeypots via this protocol.

Distribution of attacked services by number of unique IP addresses of attacking devices (download)

Distribution of attackers’ sessions in Kaspersky honeypots (download)

TOP 10 threats delivered to IoT devices

Share of each threat delivered to an infected device as a result of a successful attack, out of the total number of threats delivered (download)

In the second quarter, the share of the NyaDrop botnet among threats delivered to our honeypots grew significantly to 30.27%. Conversely, the number of Mirai variants on the list of most common malware decreased, as did the share of most of them. Additionally, after a spike in the first quarter, the share of BitCoinMiner miners dropped to 1.57%.

During the reporting period, the list of most common IoT threats expanded with new families. The activity of the Agent.nx backdoor (4.48%), controlled via P2P through the BitTorrent DHT distributed hash table, grew markedly. Another newcomer to the list, Prometei, is a Linux version of a Windows botnet that was first discovered in December 2020.

Attacks on IoT honeypots

Geographically speaking, the percentage of SSH attacks originating from Germany and the U.S. increased sharply.

Country/territory Q1 2025 Q2 2025
Germany 1.60% 24.58%
United States 5.52% 10.81%
Russian Federation 9.16% 8.45%
Australia 2.75% 8.01%
Seychelles 1.32% 6.54%
Bulgaria 1.25% 3.66%
The Netherlands 0.63% 3.53%
Vietnam 2.27% 3.00%
Romania 1.34% 2.92%
India 19.16% 2.89%

The share of Telnet attacks originating from China and India remained high, with more than half of all attacks on Kaspersky honeypots coming from these two countries combined.

Country/territory Q1 2025 Q2 2025
China 39.82% 47.02%
India 30.07% 28.08%
Indonesia 2.25% 5.54%
Russian Federation 5.14% 4.85%
Pakistan 3.99% 3.58%
Brazil 12.03% 2.35%
Nigeria 3.01% 1.66%
Germany 0.09% 1.47%
United States 0.68% 0.75%
Argentina 0.01% 0.70%

Attacks via web resources

The statistics in this section are based on detection verdicts by Web Anti-Virus, which protects users when suspicious objects are downloaded from malicious or infected web pages. Cybercriminals create malicious pages with a goal in mind. Websites that host user-generated content, such as message boards, as well as compromised legitimate sites, can become infected.

Countries that served as sources of web-based attacks: TOP 10

This section gives the geographical distribution of sources of online attacks blocked by Kaspersky products: web pages that redirect to exploits; sites that host exploits and other malware; botnet C2 centers, and the like. Any unique host could be the source of one or more web-based attacks.

To determine the geographic source of web attacks, we matched the domain name with the real IP address where the domain is hosted, then identified the geographic location of that IP address (GeoIP).

In the second quarter of 2025, Kaspersky solutions blocked 471,066,028 attacks from internet resources worldwide. Web Anti-Virus responded to 77,371,384 unique URLs.

Web-based attacks by country, Q2 2025 (download)

Countries and territories where users faced the greatest risk of online infection

To assess the risk of malware infection via the internet for users’ computers in different countries and territories, we calculated the share of Kaspersky users in each location who experienced a Web Anti-Virus alert during the reporting period. The resulting data provides an indication of the aggressiveness of the environment in which computers operate in different countries and territories.

This ranked list includes only attacks by malicious objects classified as Malware. Our calculations leave out Web Anti-Virus detections of potentially dangerous or unwanted programs, such as RiskTool or adware.

Country/territory* %**
1 Bangladesh 10.85
2 Tajikistan 10.70
3 Belarus 8.96
4 Nepal 8.45
5 Algeria 8.21
6 Moldova 8.16
7 Turkey 8.08
8 Qatar 8.07
9 Albania 8.03
10 Hungary 7.96
11 Tunisia 7.95
12 Portugal 7.93
13 Greece 7.90
14 Serbia 7.84
15 Bulgaria 7.79
16 Sri Lanka 7.72
17 Morocco 7.70
18 Georgia 7.68
19 Peru 7.63
20 North Macedonia 7.58

* Excluded are countries and territories with relatively few (under 10,000) Kaspersky users.
** Unique users targeted by Malware attacks as a percentage of all unique users of Kaspersky products in the country.

On average during the quarter, 6.36% of internet users’ computers worldwide were subjected to at least one Malware web-based attack.

Local threats

Statistics on local infections of user computers are an important indicator. They include objects that penetrated the target computer by infecting files or removable media, or initially made their way onto the computer in non-open form. Examples of the latter are programs in complex installers and encrypted files.

Data in this section is based on analyzing statistics produced by anti-virus scans of files on the hard drive at the moment they were created or accessed, and the results of scanning removable storage media. The statistics are based on detection verdicts from the On-Access Scan (OAS) and On-Demand Scan (ODS) modules of File Anti-Virus. This includes malware found directly on user computers or on connected removable media: flash drives, camera memory cards, phones, and external hard drives.

In the second quarter of 2025, our File Anti-Virus recorded 23,260,596 malicious and potentially unwanted objects.

Countries and territories where users faced the highest risk of local infection

For each country and territory, we calculated the percentage of Kaspersky users whose devices experienced a File Anti-Virus triggering at least once during the reporting period. This statistic reflects the level of personal computer infection in different countries and territories around the world.

Note that this ranked list includes only attacks by malicious objects classified as Malware. Our calculations leave out File Anti-Virus detections of potentially dangerous or unwanted programs, such as RiskTool or adware.

Country/territory* %**
1 Turkmenistan 45.26
2 Afghanistan 34.95
3 Tajikistan 34.43
4 Yemen 31.95
5 Cuba 30.85
6 Uzbekistan 28.53
7 Syria 26.63
8 Vietnam 24.75
9 South Sudan 24.56
10 Algeria 24.21
11 Bangladesh 23.79
12 Belarus 23.67
13 Gabon 23.37
14 Niger 23.35
15 Cameroon 23.10
16 Tanzania 22.77
17 China 22.74
18 Iraq 22.47
19 Burundi 22.30
20 Congo 21.84

* Excluded are countries and territories with relatively few (under 10,000) Kaspersky users.
** Unique users on whose computers Malware local threats were blocked, as a percentage of all unique users of Kaspersky products in the country/territory.

Overall, 12.94% of user computers globally faced at least one Malware local threat during the second quarter.
The figure for Russia was 14.27%.

Exploits and vulnerabilities in Q2 2025

27 August 2025 at 06:00

Vulnerability registrations in Q2 2025 proved to be quite dynamic. Vulnerabilities that were published impact the security of nearly every computer subsystem: UEFI, drivers, operating systems, browsers, as well as user and web applications. Based on our analysis, threat actors continue to leverage vulnerabilities in real-world attacks as a means of gaining access to user systems, just like in previous periods.

This report also describes known vulnerabilities used with popular C2 frameworks during the first half of 2025.

Statistics on registered vulnerabilities

This section contains statistics on assigned CVE IDs. The data is taken from cve.org.

Let’s look at the number of CVEs registered each month over the last five years.

Total vulnerabilities published each month from 2021 to 2025 (download)

This chart shows the total volume of vulnerabilities that go through the publication process. The number of registered vulnerabilities is clearly growing year-on-year, both as a total and for each individual month. For example, around 2,600 vulnerabilities were registered as of the beginning of 2024, whereas in January 2025, the figure exceeded 4,000. This upward trend was observed every month except May 2025. However, it’s worth noting that the registry may include vulnerabilities with identifiers from previous years; for instance, a vulnerability labeled CVE-2024-N might be published in 2025.

We also examined the number of vulnerabilities assigned a “Critical” severity level (CVSS > 8.9) during the same period.

Total number of critical vulnerabilities published each month from 2021 to 2025 (download)

The data for the first two quarters of 2025 shows a significant increase when compared to previous years. Unfortunately, it’s impossible to definitively state that the total number of registered critical vulnerabilities is growing, as some security issues aren’t assigned a CVSS score. However, we’re seeing that critical vulnerabilities are increasingly receiving detailed descriptions and publications – something that should benefit the overall state of software security.

Exploitation statistics

This section presents statistics on vulnerability exploitation for Q2 2025. The data draws on open sources and our telemetry.

Windows and Linux vulnerability exploitation

In Q2 2025, as before, the most common exploits targeted vulnerable Microsoft Office products that contained unpatched security flaws.

Kaspersky solutions detected the most exploits on the Windows platform for the following vulnerabilities:

  • CVE-2018-0802: a remote code execution vulnerability in the Equation Editor component
  • CVE-2017-11882: another remote code execution vulnerability, also affecting Equation Editor
  • CVE-2017-0199: a vulnerability in Microsoft Office and WordPad allowing an attacker to gain control over the system

These vulnerabilities are traditionally exploited by threat actors more often than others, as we’ve detailed in previous reports. These are followed by equally popular issues in WinRAR and exploits for stealing NetNTLM credentials in the Windows operating system:

  • CVE-2023-38831: a vulnerability in WinRAR involving improper handling of files within archive contents
  • CVE-2025-24071: a Windows File Explorer vulnerability that allows for the retrieval of NetNTLM credentials when opening specific file types (.library-ms)
  • CVE-2024-35250: a vulnerability in the ks.sys driver that allows arbitrary code execution

Dynamics of the number of Windows users encountering exploits, Q1 2024 — Q2 2025. The number of users who encountered exploits in Q1 2024 is taken as 100% (download)

All of the vulnerabilities listed above can be used for both initial access to vulnerable systems and privilege escalation. We recommend promptly installing updates for the relevant software.

For the Linux operating system, exploits for the following vulnerabilities were detected most frequently:

  • CVE-2022-0847, also known as Dirty Pipe: a widespread vulnerability that allows privilege escalation and enables attackers to take control of running applications
  • CVE-2019-13272: a vulnerability caused by improper handling of privilege inheritance, which can be exploited to achieve privilege escalation
  • CVE-2021-22555: a heap overflow vulnerability in the Netfilter kernel subsystem. The widespread exploitation of this vulnerability is due to the fact that it employs popular memory modification techniques: manipulating msg_msg primitives, which leads to a Use-After-Free security flaw.

Dynamics of the number of Linux users encountering exploits, Q1 2024 — Q2 2025. The number of users who encountered exploits in Q1 2024 is taken as 100% (download)

It’s critically important to install security patches for the Linux operating system, as it’s attracting more and more attention from threat actors each year – primarily due to the growing number of user devices running Linux.

Most common published exploits

In Q2 2025, we observed that the distribution of published exploits by software type continued the trends from last year. Exploits targeting operating system vulnerabilities continue to predominate over those targeting other software types that we track as part of our monitoring of public research, news, and PoCs.

Distribution of published exploits by platform, Q1 2025 (download)

Distribution of published exploits by platform, Q2 2025 (download)

In Q2, no public information about new exploits for Microsoft Office systems appeared.

Vulnerability exploitation in APT attacks

We analyzed data on vulnerabilities that were exploited in APT attacks during Q2 2025. The following rankings are informed by our telemetry, research, and open-source data.

TOP 10 vulnerabilities exploited in APT attacks, Q2 2025 (download)

The Q2 TOP 10 list primarily draws from the large number of incidents described in public sources. It includes both new security issues exploited in zero-day attacks and vulnerabilities that have been known for quite some time. The most frequently exploited vulnerable software includes remote access and document editing tools, as well as logging subsystems. Interestingly, low-code/no-code development tools were at the top of the list, and a vulnerability in a framework for creating AI-powered applications appeared in the TOP 10. This suggests that the evolution of software development technology is attracting the attention of attackers who exploit vulnerabilities in new and increasingly popular tools. It’s also noteworthy that the web vulnerabilities were found not in AI-generated code but in the code that supported the AI framework itself.

Judging by the vulnerabilities identified, the attackers’ primary goals were to gain system access and escalate privileges.

C2 frameworks

In this section, we’ll look at the most popular C2 frameworks used by threat actors and analyze the vulnerabilities whose exploits interacted with C2 agents in APT attacks.

The chart below shows the frequency of known C2 framework usage in attacks on users during the first half of 2025, according to open sources.

TOP 13 C2 frameworks used by APT groups to compromise user systems in Q1–Q2 2025 (download)

The four most frequently used frameworks – Sliver, Metasploit, Havoc, and Brute Ratel C4 – can work with exploits “out of the box” because their agents provide a variety of post-compromise capabilities. These capabilities include reconnaissance, command execution, and maintaining C2 communication. It should be noted that the default implementation of Metasploit has built-in support for exploits that attackers use for initial access. The other three frameworks, in their standard configurations, only support privilege escalation and persistence exploits in a compromised system and require additional customization tailored to the attackers’ objectives. The remaining tools don’t work with exploits directly and were modified for specific exploits in real-world attacks. We can therefore conclude that attackers are increasingly customizing their C2 agents to automate malicious activities and hinder detection.

After reviewing open sources and analyzing malicious C2 agent samples that contained exploits, we found that the following vulnerabilities were used in APT attacks involving the C2 frameworks mentioned above:

  • CVE-2025-31324: a vulnerability in SAP NetWeaver Visual Composer Metadata Uploader that allows for remote code execution and has a CVSS score of 10.0
  • CVE-2024-1709: a vulnerability in ConnectWise ScreenConnect 23.9.7 that can lead to authentication bypass, also with a CVSS score of 10.0
  • CVE-2024-31839: a cross-site scripting vulnerability in the CHAOS v5.0.1 remote administration tool, leading to privilege escalation
  • CVE-2024-30850: an arbitrary code execution vulnerability in CHAOS v5.0.1 that allows for authentication bypass
  • CVE-2025-33053: a vulnerability caused by improper handling of working directory parameters for LNK files in Windows, leading to remote code execution

Interestingly, most of the data about attacks on systems is lost by the time an investigation begins. However, the list of exploited vulnerabilities reveals various approaches to the vulnerability–C2 combination, offering insight into the attack’s progression and helping identify the initial access vector. By analyzing the exploited vulnerabilities, incident investigations can determine that, in some cases, attacks unfold immediately upon exploit execution, while in others, attackers first obtain credentials or system access and only then deploy command and control.

Interesting vulnerabilities

This section covers the most noteworthy vulnerabilities published in Q2 2025.

CVE-2025-32433: vulnerability in the SSH server, part of the Erlang/OTP framework

This remote code execution vulnerability can be considered quite straightforward. The attacker needs to send a command execution request, and the server will run it without performing any checks – even if the user is unauthenticated. The vulnerability occurs during the processing of messages transmitted via the SSH protocol when using packages for Erlang/OTP.

CVE-2025-6218: directory traversal vulnerability in WinRAR

This vulnerability is similar to the well-known CVE-2023-38831: both target WinRAR and can be exploited through user interaction with the GUI. Vulnerabilities involving archives aren’t new and are typically exploited in web applications, which often use archives as the primary format for data transfer. These archives are processed by web application libraries that may lack checks for extraction limits. Typical scenarios for exploiting such vulnerabilities include replacing standard operating system configurations and setting additional values to launch existing applications. This can lead to the execution of malicious commands, either with a delay or upon the next OS boot or application startup.

To exploit such vulnerabilities, attackers need to determine the location of the directory to modify, as each system has a unique file layout. Additionally, the process is complicated by the need to select the correct characters when specifying the extraction path. By using specific combinations of special characters, archive extraction outside of the working directory can bypass security mechanisms, which is the essence of CVE-2025-6218. A PoC for this vulnerability appeared rather quickly.

Hex dump of the PoC file for CVE-2025-6218

Hex dump of the PoC file for CVE-2025-6218

As seen in the file dump, the archive extraction path is altered not due to its complex structure, but by using a relative path without specifying a drive letter. As we mentioned above, a custom file organization on the system makes such an exploit unstable. This means attackers will have to use more sophisticated social engineering methods to attack a user.

CVE-2025-3052: insecure data access vulnerability in NVRAM, allowing bypass of UEFI signature checks

UEFI vulnerabilities almost always aim to disable the Secure Boot protocol, which is designed to protect the operating system’s boot process from rootkits and bootkits. CVE-2025-3052 is no exception.

Researchers were able to find a set of vulnerable UEFI applications in which a function located at offset 0xf7a0 uses the contents of a global non-volatile random-access memory (NVRAM) variable without validation. The vulnerable function incorrectly processes and can modify the data specified in the variable. This allows an attacker to overwrite Secure Boot settings and load any modules into the system – even those that are unsigned and haven’t been validated.

CVE-2025-49113: insecure deserialization vulnerability in Roundcube Webmail

This vulnerability highlights a classic software problem: the insecure handling of serialized objects. It can only be exploited after successful authentication, and the exploit is possible during an active user session. To carry out the attack, a malicious actor must first obtain a legitimate account and then use it to access the vulnerable code, which lies in the lack of validation for the _from parameter.

Post-authentication exploitation is quite simple: a serialized PHP object in text format is placed in the vulnerable parameter for the attack. It’s worth noting that an object injected in this way is easy to restore for subsequent analysis. For instance, in a PoC published online, the payload creates a file named “pwned” in /tmp.

Example of a payload published online

Example of a payload published online

According to the researcher who discovered the vulnerability, the defective code had been used in the project for 10 years.

CVE-2025-1533: stack overflow vulnerability in the AsIO3.sys driver

This vulnerability was exploitable due to an error in the design of kernel pool parameters. When implementing access rights checks for the AsIO3.sys driver, developers incorrectly calculated the amount of memory needed to store the path to the file requesting access to the driver. If a path longer than 256 characters is created, the system will crash with a “blue screen of death” (BSOD). However, in modern versions of NTFS, the path length limit is not 256 but 32,767 characters. This vulnerability demonstrates the importance of a thorough study of documentation: it not only helps to clearly understand how a particular Windows subsystem operates but also impacts development efficiency.

Conclusion and advice

The number of vulnerabilities continues to grow in 2025. In Q2, we observed a positive trend in the registration of new CVE IDs. To protect systems, it’s critical to regularly prioritize the patching of known vulnerabilities and use software capable of mitigating post-exploitation damage. Furthermore, one way to address the consequences of exploitation is to find and neutralize C2 framework agents that attackers may use on a compromised system.

To secure infrastructure, it’s necessary to continuously monitor its state, particularly by ensuring thorough perimeter monitoring.

Special attention should be paid to endpoint protection. A reliable solution for detecting and blocking malware will ensure the security of corporate devices.

Beyond basic protection, corporate infrastructures need to implement a flexible and effective system that allows for the rapid installation of security patches, as well as the configuration and automation of patch management. It’s also important to constantly track active threats and proactively implement measures to strengthen security, including mitigating risks associated with vulnerabilities. Our Kaspersky Next product line helps to detect and analyze vulnerabilities in the infrastructure in a timely manner for companies of all sizes. Moreover, these modern comprehensive solutions also combine the collection and analysis of security event data from all sources, incident response scenarios, an up-to-date database of cyberattacks, and training programs to improve the level of employees’ cybersecurity awareness.

AI and collaboration tools: how cyberattackers are targeting SMBs in 2025

By: Kaspersky
25 June 2025 at 06:00

Cyberattackers often view small and medium-sized businesses (SMBs) as easier targets, assuming their security measures are less robust than those of larger enterprises. In fact, attacks through contractors, also known as trusted relationship attacks, remain one of the top three methods used to breach corporate networks. With SMBs generally being less protected than large enterprises, this makes them especially attractive to both opportunistic cybercriminals and sophisticated threat actors.

At the same time, AI-driven attacks are becoming increasingly common, making phishing and malware campaigns easier to prepare and quickly adapt, thus increasing their scale. Meanwhile, cybersecurity regulations are tightening, adding more compliance pressure on SMBs.

Improving your security posture has never been more critical. Kaspersky highlights key attack vectors every SMB should be aware of to stay protected.

How malware and potentially unwanted applications (PUAs) are disguised as popular services

Kaspersky analysts have used data from the Kaspersky Security Network (KSN) to explore how frequently malicious and unwanted files and programs are disguised as legitimate applications commonly used by SMBs. The KSN is a system for processing anonymized cyberthreat-related data shared voluntarily by opted-in Kaspersky users. For this research, only data received from the users of Kaspersky solutions for SMBs were analyzed. The research focused on the following applications:

  • ChatGPT
  • Cisco AnyConnect
  • Google Drive
  • Google Meet
  • DeepSeek
  • Microsoft Excel
  • Microsoft Outlook
  • Microsoft PowerPoint
  • Microsoft Teams
  • Microsoft Word
  • Salesforce
  • Zoom

Between January and April 2025 alone, nearly 8,500 SMB users encountered cyberattacks in which malware or PUAs were disguised as these popular tools.

Among the detected threats, the highest number (1652) of unique malicious and potentially unwanted files mimicked Zoom, the widely used video conferencing platform. This accounted for nearly 41% of all unique files detected, a 14-percentage point increase compared to 2024. Microsoft Office applications remained frequent targets for impersonation: Outlook and PowerPoint each accounted for 16%, Excel for nearly 12%, while Word and Teams made up 9% and 5%, respectively.

Share of unique files with names mimicking the nine most popular legitimate applications in 2024 and 2025 (download)

A comparison of the threat landscape in 2024 and 2025 reveals a clear shift: with the growing popularity of AI services, cyberattackers are increasingly disguising malware as various AI tools. According to our analysis, the number of unique malicious files mimicking ChatGPT grew by 115%, reaching 177 in the first four months of 2025. This contributed to a three-percentage-point increase in the tool’s share among the most mimicked applications. DeepSeek, a large language model launched only in 2025, has immediately appeared on the list of impersonated tools.

Another cybercriminal tactic to watch for in 2025 is the growing use of collaboration platform brands to trick users into downloading or launching malware and PUAs. As mentioned above, the share of threats disguised as Zoom increased by 14 percentage points, reaching 1652 unique files, while Microsoft Teams and Google Drive saw increases of over three and one percentage points, respectively, with 206 and 132 cases. This pattern likely reflects the normalization of remote work and geographically distributed teams, which has made these platforms integral to business operations across industries.

Attackers are clearly leveraging the popularity and credibility of these services to increase the success rate of their campaigns.

Malicious file names mimicking popular services 2024 2025 2025 vs 2024
Zoom 26.24% 40.86% 14.62 p.p.
Microsoft Teams 1.84% 5.10% 3.25 p.p.
ChatGPT 1.47% 4.38% 2.9 p.p.
DeepSeek 0 2.05%
Google Drive 2.11% 3.26% 1.15 p.p.

The total number of unique malicious and unwanted files imitating legitimate applications slightly declined year-over-year, from 5,587 in 2024 to 4,043 in 2025.

Main types of threats affecting the SMB Sector, 2025 (download)

The top threats targeting SMBs in 2025 included downloaders, Trojans, and adware.

Leading the list are downloaders, potentially unwanted applications designed to install additional content from the internet, often without clearly informing the user of what’s being downloaded. While not inherently malicious, these tools are frequently exploited by attackers to deliver harmful payloads to victims’ devices.

Trojans ranked next. These are malicious programs that carry out unauthorized actions such as deleting, blocking, modifying, or copying data, or disrupting the normal operation of computers and networks. Trojans are among the most prevalent forms of malware, and cyberattackers continue to use them in a wide range of malicious campaigns.

Adware also made the top three list. These programs are designed to display advertisements on infected computers or substitute a promotional website for the default search engine in a browser. Adware often comes bundled with freeware or shareware, effectively serving as the price for using the free software. In some cases, Trojans silently download and install adware onto the victim’s machine.

Among other common types of threats were DangerousObject, Trojan-Dropper, Backdoor, Trojan-Downloader, HackTool, Trojan-PSW, and PSW-Tool. For instance, we recently identified a campaign involving a Trojan-Downloader called “TookPS“, which was distributed through fake websites imitating legitimate remote access and 3D modeling software.

How scammers and phishers trick victims into giving up accounts and money

We continue to observe a wide range of phishing campaigns and scams targeting SMBs. Attackers aim to steal login credentials for various services, from delivery platforms to banking systems, or manipulate victims into sending them money.

To do this, cyberattackers use a variety of lures, often imitating landing pages from brands commonly used by SMBs. One example is a phishing attempt targeting Google business accounts. The bait lures victims with the promise of promoting their company on X. It requires them to first log in to a dedicated platform using their Google account with credentials that will end up in cyberattackers’ hands.

Another fake landing page impersonated a bank that offered business loans: a “Global Trust Bank”. Since legitimate organizations with that name exist in multiple countries, this phishing attempt may have seemed believable. The attackers tried to lure users with favorable business loan terms – but only after victims submitted their online banking credentials, giving the criminals access to their accounts.

We also saw a range of phishing emails targeting SMBs. In one recent case detected by our systems, the attacker sent a fake notification allegedly from DocuSign, an electronic document-signing service.

SMBs can even find themselves targeted by classic Nigerian scams. In one recent example, the sender claimed to represent a wealthy client from Turkey who wanted to move $33 million abroad to allegedly avoid sanctions, and invited the recipient to handle the funds. In Nigerian scams, fraudsters typically cajole money. They may later request a relatively small payment to a manager or lawyer compared to the amount originally promised.

Beyond these threats, SMBs are bombarded daily with hundreds of spam emails. Some promise attractive deals on email marketing or loans; others offer services like reputation management, content creation, or lead generation. In general, these offers are crafted to reflect the typical needs of small businesses. Not surprisingly, AI has also made its way into the spam folder – with offers to automate various business processes.

We have also seen spammers offering dubious deals like purchasing a database of over 400,000 businesses for $100, supposedly to be used for selling the company’s B2B products, or manipulating reviews on a review platform.

Security tips

SMBs can reduce risks and ensure business continuity by investing in comprehensive cybersecurity solutions and increasing employee awareness. It is essential to implement robust measures such as spam filters, email authentication protocols, and strict verification procedures for financial transactions and the handling of sensitive information.

Another key step toward cyber resilience is promoting awareness about the importance of comprehensive security procedures and ensuring they are regularly updated. Regular security training sessions, strong password practices, and multi-factor authentication can significantly reduce the risk of phishing and fraud.

It is also worth noting that searching for software through search engines is an insecure practice, and should be prohibited in the organization. If you need to implement new tools or replace existing ones, make sure they are downloaded from official sources and installed on a centralized basis by your IT team.

Cybersecurity Action Plan for SMBs

  1. Define access rules for corporate resources such as email accounts, shared folders, and online documents. Monitor and limit the number of individuals with access to critical company data. Keep access lists up to date and revoke access promptly when employees leave the company. Use cloud access security brokers to monitor and control employee activities within cloud services and enforce security policies.
  2. Regularly back up important data to ensure the preservation of corporate information in case of emergencies or cyberincidents.
  3. Establish clear guidelines for using external services and resources. Create well-defined procedures for coordinating specific tasks, such as implementing new software, with the IT department and other responsible managers. Develop short, easy-to-understand cybersecurity guidelines for employees, with a special focus on account and password management, email protection, and safe web browsing. A well-rounded training program will equip employees with the knowledge they need and the ability to apply it in practice.
  4. Implement specialized cybersecurity solutions that provide visibility and control over cloud services, such as Kaspersky Next.

Eye-opening data privacy trends and statistics (2023 and beyond)

By: slandau
24 January 2023 at 20:24

EXECUTIVE SUMMARY:

Data is one of the most important and valuable assets for businesses. It functions as a guiding light, helping leaders see around corners, make transformative strategy decisions, stay uber competitive, and deliver better tangible business outcomes. In some cases, data is as elevated and celebrated as revenue, customer service excellence, and profitability.

However, data is uniquely vulnerable to an unintended effect of the rapid shift to digitization and the cloud; the data breach epidemic. Since the start of the coronavirus pandemic, a dizzying number of organizations have been experiencing a disturbing number of data breaches.

In 2022, a total of 4,100 publicly disclosed data breaches led to the exposure of approximately 22 billion records.  In response, Check Point Field CISO, Deryck Mitchelson says, “For me, it feels as though we are growing numb to all of this…What we’re forgetting is that on the back of these breaches, it’s your data, it’s my data that is being compromised.”

When it comes to contending with the complexity of data ecosystems and data protection, most organizations are under-prepared. As a result, we’re seeing that consumers are willing to vote with their digital footprints. The story is in the statistics, below.

Global data privacy trends and statistics (2023)

  1. 45% of websites use some type cookie tracking set-up.
  2. Data collection can yield as much as a 4% increase in revenue, which can translate to billion of dollars for some of the largest multi-national companies.
  3. 81% of survey respondents say that the way an organization treats personal data is “indicative of how it views and respects its customers.”
  4. 84% of customers are more loyal to brands that have strong security controls.
  5. 76% of consumers would not make purchases from a company that they did not trust with their data.
  6. 37% of consumers say they have already switched companies or providers to better protect their privacy – up from 34% two years ago.
  7. 58% of organizations don’t acknowledge data breach disclosures. According to a Comparitech study, 23% of organizations responded to data breach disclosures within a day, 12% of organizations responded within two days, and two percent within three days. Five percent took 17 days to respond. More than half (58%) never sent a response at all.
  8. 62% of Americans don’t believe it’s possible to experience a normal day of life without companies collecting data about them.
  9. The average data breach in the U.S. costs 4.2 million, according to an IBM report.
  10. A hacker strikes every 39 seconds.
  11. In a PwC survey, 87% of business leaders stated that they believed their consumers trust their company.
  12. In contrast, just 30% of consumers in the same PwC survey stated that they have a high level of trust in companies.

Data breach trends and statistics: Insights

Earn consumer trust by avoiding data breaches. Second-only to industry conditions, levels of consumer trust are the next biggest determinant of an organization’s market performance.

According to one study, roughly three weeks after a given company breach was made public, company share prices dropped by 3.5 percent (on average). A year after a breach, affected companies under-performed the NASDAQ by 8.6 percent. After three years, companies continued to under-perform the market by more than 15 percent.

Data breach trends and statistics: Consumer perspective

For consumers, digital data collection, sharing, analysis and privacy are difficult to understand. Thirty-five years ago, there weren’t smartphones or laptops emitting location data. Cameras weren’t built into nearly every technological device. Everyday devices couldn’t easily be misused or misrepresented to consumers in relation to unwanted tracking, data collection and subsequent possible identity theft.

To respect data is to respect your end-consumers and your business growth potential.

In conclusion

Data privacy and security can be incredibly technical and complex. But in failing to protect your data and your reputation in the eyes of consumers, you might experience a nightmare.

Be a #dataprivacyweek advocate

Data Privacy Week is January 22 – 28th. Share these #dataprivacyweek tweets with your network.


#dataprivacyweek is a call to action. After all, 84% of customers are more loyal to brands that have strong security controls. Improve your #datasecurity.
Click To Tweet


Did you know? The average data breach in the U.S. costs 4.2 million. Protect your data; protect your resources. #dataprivacyweek
Click To Tweet


Learn more about how to champion data privacy within your organization. See 10 data privacy tips to protect your organization this year. Also check out this executive-level insights article.

Lastly, don’t miss registration for the most important cyber security event of 2023; CPX 360. Register here.

The post Eye-opening data privacy trends and statistics (2023 and beyond) appeared first on CyberTalk.

❌
❌