AI-powered cyberattacks are rising fast, and AI firewalls offer predictive, adaptive defense—but their cost, complexity and ROI must be carefully justified as organizations weigh upgrades.
Alan reflects on a turbulent year in DevSecOps, highlighting the rise of AI-driven security, the maturing of hybrid work culture, the growing influence of platform engineering, and the incredible strength of the DevSecOps community — while calling out the talent crunch, tool sprawl and security theater the industry must still overcome.
DLL hijacking is a common technique in which attackers replace a library called by a legitimate process with a malicious one. It is used by both creators of mass-impact malware, like stealers and banking Trojans, and by APT and cybercrime groups behind targeted attacks. In recent years, the number of DLL hijacking attacks has grown significantly.
Trend in the number of DLL hijacking attacks. 2023 data is taken as 100% (download)
We have observed this technique and its variations, like DLL sideloading, in targeted attacks on organizations in Russia, Africa, South Korea, and other countries and regions. Lumma, one of 2025’s most active stealers, uses this method for distribution. Threat actors trying to profit from popular applications, such as DeepSeek, also resort to DLL hijacking.
Detecting a DLL substitution attack is not easy because the library executes within the trusted address space of a legitimate process. So, to a security solution, this activity may look like a trusted process. Directing excessive attention to trusted processes can compromise overall system performance, so you have to strike a delicate balance between a sufficient level of security and sufficient convenience.
Detecting DLL hijacking with a machine-learning model
Artificial intelligence can help where simple detection algorithms fall short. Kaspersky has been using machine learning for 20 years to identify malicious activity at various stages. The AI expertise center researches the capabilities of different models in threat detection, then trains and implements them. Our colleagues at the threat intelligence center approached us with a question of whether machine learning could be used to detect DLL hijacking, and more importantly, whether it would help improve detection accuracy.
Preparation
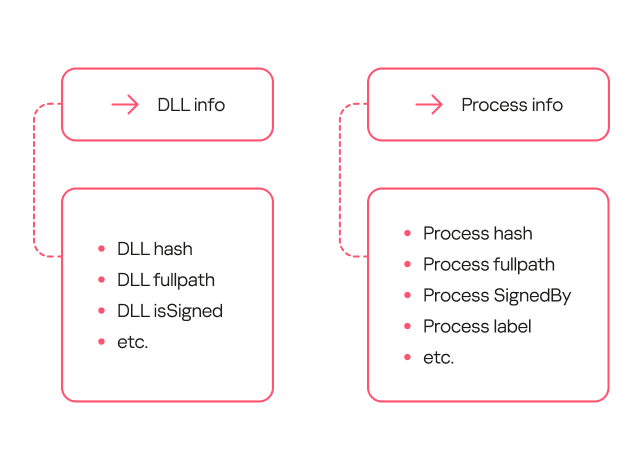
To determine if we could train a model to distinguish between malicious and legitimate library loads, we first needed to define a set of features highly indicative of DLL hijacking. We identified the following key features:
Wrong library location. Many standard libraries reside in standard directories, while a malicious DLL is often found in an unusual location, such as the same folder as the executable that calls it.
Wrong executable location. Attackers often save executables in non-standard paths, like temporary directories or user folders, instead of %Program Files%.
Renamed executable. To avoid detection, attackers frequently save legitimate applications under arbitrary names.
Library size has changed, and it is no longer signed.
Modified library structure.
Training sample and labeling
For the training sample, we used dynamic library load data provided by our internal automatic processing systems, which handle millions of files every day, and anonymized telemetry, such as that voluntarily provided by Kaspersky users through Kaspersky Security Network.
The training sample was labeled in three iterations. Initially, we could not automatically pull event labeling from our analysts that indicated whether an event was a DLL hijacking attack. So, we used data from our databases containing only file reputation, and labeled the rest of the data manually. We labeled as DLL hijacking those library-call events where the process was definitively legitimate but the DLL was definitively malicious. However, this labeling was not enough because some processes, like “svchost”, are designed mainly to load various libraries. As a result, the model we trained on this data had a high rate of false positives and was not practical for real-world use.
In the next iteration, we additionally filtered malicious libraries by family, keeping only those which were known to exhibit DLL-hijacking behavior. The model trained on this refined data showed significantly better accuracy and essentially confirmed our hypothesis that we could use machine learning to detect this type of attacks.
At this stage, our training dataset had tens of millions of objects. This included about 20 million clean files and around 50,000 definitively malicious ones.
Status
Total
Unique files
Unknown
~ 18M
~ 6M
Malicious
~ 50K
~ 1,000
Clean
~ 20M
~ 250K
We then trained subsequent models on the results of their predecessors, which had been verified and further labeled by analysts. This process significantly increased the efficiency of our training.
Loading DLLs: what does normal look like?
So, we had a labeled sample with a large number of library loading events from various processes. How can we describe a “clean” library? Using a process name + library name combination does not account for renamed processes. Besides, a legitimate user, not just an attacker, can rename a process. If we used the process hash instead of the name, we would solve the renaming problem, but then every version of the same library would be treated as a separate library. We ultimately settled on using a library name + process signature combination. While this approach considers all identically named libraries from a single vendor as one, it generally produces a more or less realistic picture.
To describe safe library loading events, we used a set of counters that included information about the processes (the frequency of a specific process name for a file with a given hash, the frequency of a specific file path for a file with that hash, and so on), information about the libraries (the frequency of a specific path for that library, the percentage of legitimate launches, and so on), and event properties (that is, whether the library is in the same directory as the file that calls it).
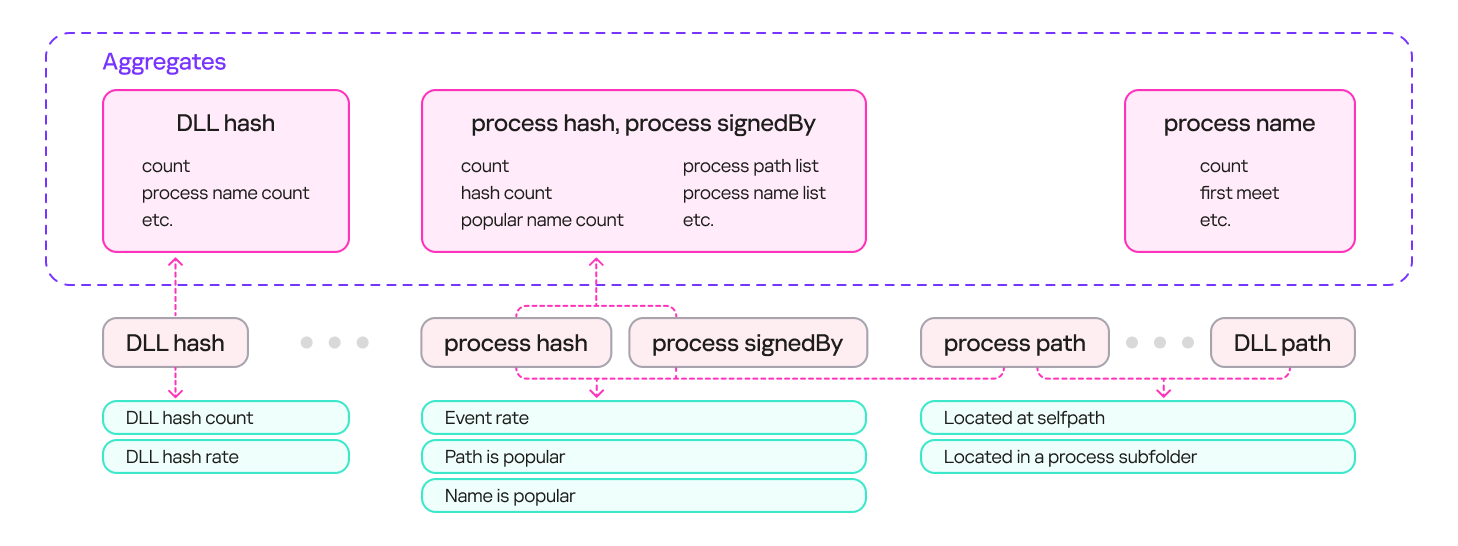
The result was a system with multiple aggregates (sets of counters and keys) that could describe an input event. These aggregates can contain a single key (e.g., a DLL’s hash sum) or multiple keys (e.g., a process’s hash sum + process signature). Based on these aggregates, we can derive a set of features that describe the library loading event. The diagram below provides examples of how these features are derived:
Feature extraction from aggregates
Loading DLLs: how to describe hijacking
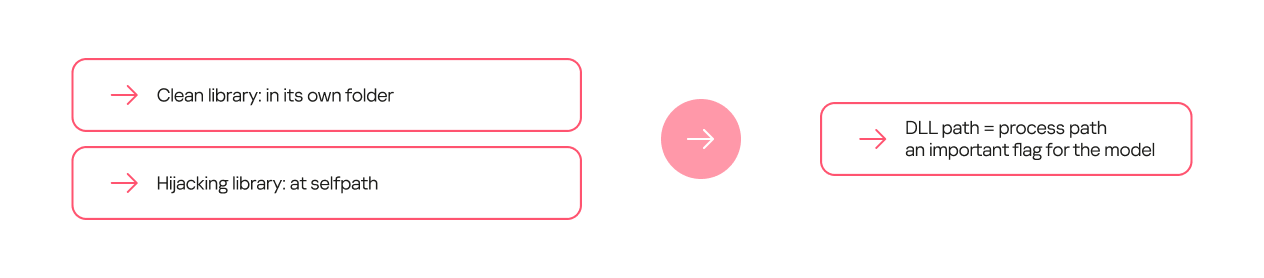
Certain feature combinations (dependencies) strongly indicate DLL hijacking. These can be simple dependencies. For some processes, the clean library they call always resides in a separate folder, while the malicious one is most often placed in the process folder.
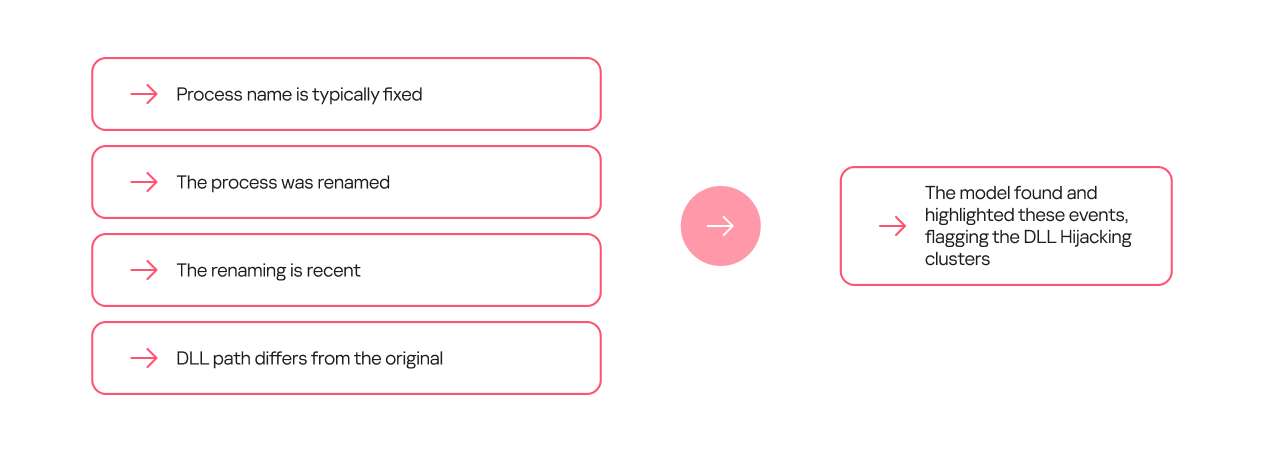
Other dependencies can be more complex and require several conditions to be met. For example, a process renaming itself does not, on its own, indicate DLL hijacking. However, if the new name appears in the data stream for the first time, and the library is located on a non-standard path, it is highly likely to be malicious.
Model evolution
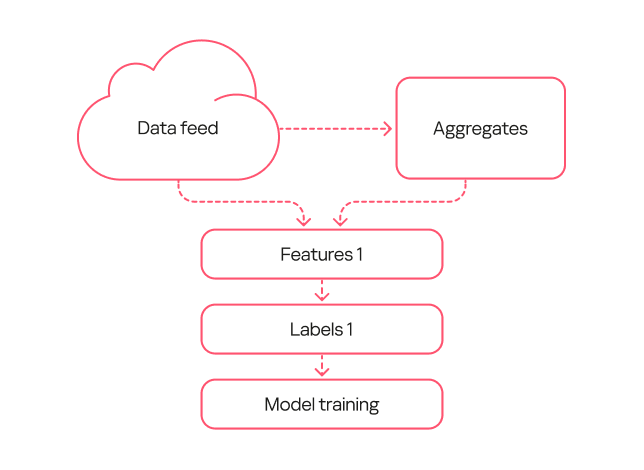
Within this project, we trained several generations of models. The primary goal of the first generation was to show that machine learning could at all be applied to detecting DLL hijacking. When training this model, we used the broadest possible interpretation of the term.
The model’s workflow was as simple as possible:
We took a data stream and extracted a frequency description for selected sets of keys.
We took the same data stream from a different time period and obtained a set of features.
We used type 1 labeling, where events in which a legitimate process loaded a malicious library from a specified set of families were marked as DLL hijacking.
We trained the model on the resulting data.
First-generation model diagram
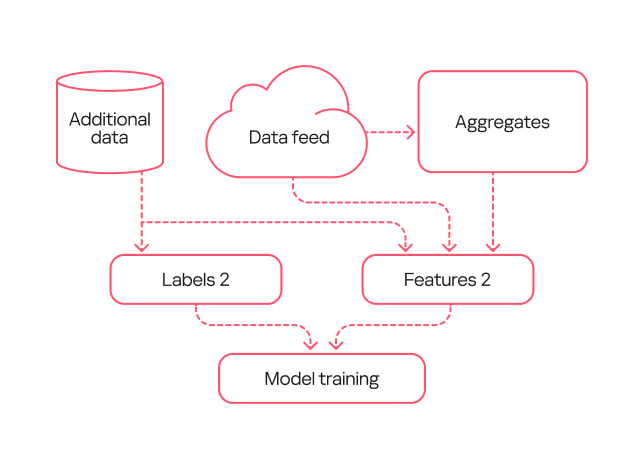
The second-generation model was trained on data that had been processed by the first-generation model and verified by analysts (labeling type 2). Consequently, the labeling was more precise than during the training of the first model. Additionally, we added more features to describe the library structure and slightly complicated the workflow for describing library loads.
Second-generation model diagram
Based on the results from this second-generation model, we were able to identify several common types of false positives. For example, the training sample included potentially unwanted applications. These can, in certain contexts, exhibit behavior similar to DLL hijacking, but they are not malicious and rarely belong to this attack type.
We fixed these errors in the third-generation model. First, with the help of analysts, we flagged the potentially unwanted applications in the training sample so the model would not detect them. Second, in this new version, we used an expanded labeling that included useful detections from both the first and second generations. Additionally, we expanded the feature description through one-hot encoding — a technique for converting categorical features into a binary format — for certain fields. Also, since the volume of events processed by the model increased over time, this version added normalization of all features based on the data flow size.
Third-generation model diagram
Comparison of the models
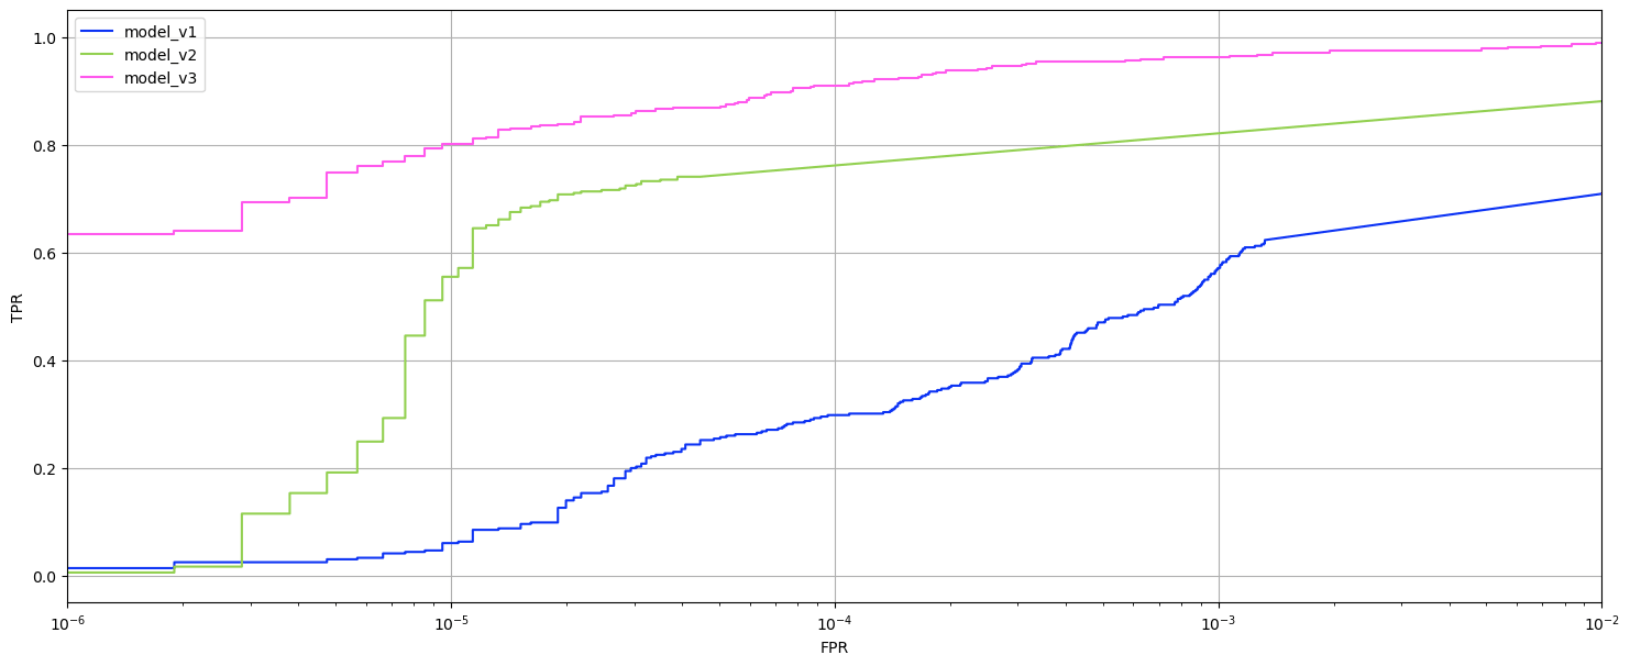
To evaluate the evolution of our models, we applied them to a test data set none of them had worked with before. The graph below shows the ratio of true positive to false positive verdicts for each model.
Trends in true positives and false positives from the first-, second-, and third-generation models
As the models evolved, the percentage of true positives grew. While the first-generation model achieved a relatively good result (0.6 or higher) only with a very high false positive rate (10⁻³ or more), the second-generation model reached this at 10⁻⁵. The third-generation model, at the same low false positive rate, produced 0.8 true positives, which is considered a good result.
Evaluating the models on the data stream at a fixed score shows that the absolute number of new events labeled as DLL Hijacking increased from one generation to the next. That said, evaluating the models by their false verdict rate also helps track progress: the first model has a fairly high error rate, while the second and third generations have significantly lower ones.
False positives rate among model outputs, July 2024 – August 2025 (download)
Practical application of the models
All three model generations are used in our internal systems to detect likely cases of DLL hijacking within telemetry data streams. We receive 6.5 million security events daily, linked to 800,000 unique files. Aggregates are built from this sample at a specified interval, enriched, and then fed into the models. The output data is then ranked by model and by the probability of DLL hijacking assigned to the event, and then sent to our analysts. For instance, if the third-generation model flags an event as DLL hijacking with high confidence, it should be investigated first, whereas a less definitive verdict from the first-generation model can be checked last.
Simultaneously, the models are tested on a separate data stream they have not seen before. This is done to assess their effectiveness over time, as a model’s detection performance can degrade. The graph below shows that the percentage of correct detections varies slightly over time, but on average, the models detect 70–80% of DLL hijacking cases.
DLL hijacking detection trends for all three models, October 2024 – September 2025 (download)
Additionally, we recently deployed a DLL hijacking detection model into the Kaspersky SIEM, but first we tested the model in the Kaspersky MDR service. During the pilot phase, the model helped to detect and prevent a number of DLL hijacking incidents in our clients’ systems. We have written a separate article about how the machine learning model for detecting targeted attacks involving DLL hijacking works in Kaspersky SIEM and the incidents it has identified.
Conclusion
Based on the training and application of the three generations of models, the experiment to detect DLL hijacking using machine learning was a success. We were able to develop a model that distinguishes events resembling DLL hijacking from other events, and refined it to a state suitable for practical use, not only in our internal systems but also in commercial products. Currently, the models operate in the cloud, scanning hundreds of thousands of unique files per month and detecting thousands of files used in DLL hijacking attacks each month. They regularly identify previously unknown variations of these attacks. The results from the models are sent to analysts who verify them and create new detection rules based on their findings.
Our colleagues from the AI expertise center recently developed a machine-learning model that detects DLL-hijacking attacks. We then integrated this model into the Kaspersky Unified Monitoring and Analysis Platform SIEM system. In a separate article, our colleagues shared how the model had been created and what success they had achieved in lab environments. Here, we focus on how it operates within Kaspersky SIEM, the preparation steps taken before its release, and some real-world incidents it has already helped us uncover.
How the model works in Kaspersky SIEM
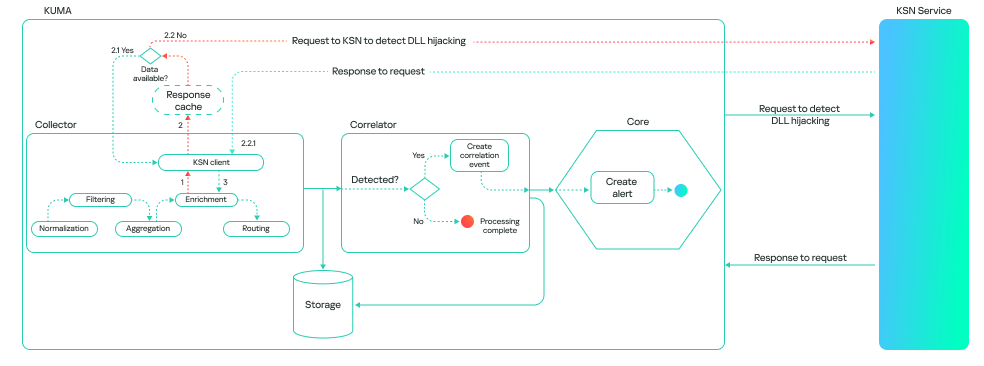
The model’s operation generally boils down to a step-by-step check of all DLL libraries loaded by processes in the system, followed by validation in the Kaspersky Security Network (KSN) cloud. This approach allows local attributes (path, process name, and file hashes) to be combined with a global knowledge base and behavioral indicators, which significantly improves detection quality and reduces the probability of false positives.
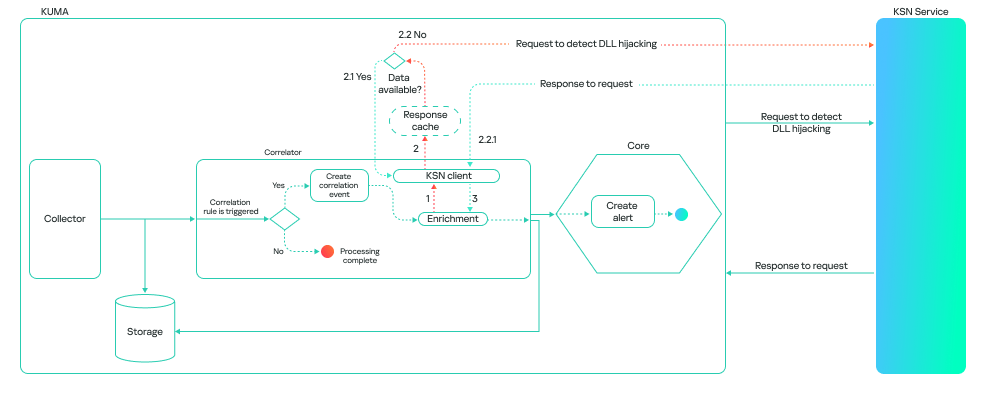
The model can run in one of two modes: on a correlator or on a collector. A correlator is a SIEM component that performs event analysis and correlation based on predefined rules or algorithms. If detection is configured on a correlator, the model checks events that have already triggered a rule. This reduces the volume of KSN queries and the model’s response time.
This is how it looks:
A collector is a software or hardware component of a SIEM platform that collects and normalizes events from various sources, and then delivers these events to the platform’s core. If detection is configured on a collector, the model processes all events associated with various processes loading libraries, provided these events meet the following conditions:
The path to the process file is known.
The path to the library is known.
The hashes of the file and the library are available.
This method consumes more resources, and the model’s response takes longer than it does on a correlator. However, it can be useful for retrospective threat hunting because it allows you to check all events logged by Kaspersky SIEM. The model’s workflow on a collector looks like this:
It is important to note that the model is not limited to a binary “malicious/non-malicious” assessment; it ranks its responses by confidence level. This allows it to be used as a flexible tool in SOC practice. Examples of possible verdicts:
0: data is being processed.
1: maliciousness not confirmed. This means the model currently does not consider the library malicious.
2: suspicious library.
3: maliciousness confirmed.
A Kaspersky SIEM rule for detecting DLL hijacking would look like this:
N.KL_AI_DLLHijackingCheckResult > 1
Embedding the model into the Kaspersky SIEM correlator automates the process of finding DLL-hijacking attacks, making it possible to detect them at scale without having to manually analyze hundreds or thousands of loaded libraries. Furthermore, when combined with correlation rules and telemetry sources, the model can be used not just as a standalone module but as part of a comprehensive defense against infrastructure attacks.
Incidents detected during the pilot testing of the model in the MDR service
Before being released, the model (as part of the Kaspersky SIEM platform) was tested in the MDR service, where it was trained to identify attacks on large datasets supplied by our telemetry. This step was necessary to ensure that detection works not only in lab settings but also in real client infrastructures.
During the pilot testing, we verified the model’s resilience to false positives and its ability to correctly classify behavior even in non-typical DLL-loading scenarios. As a result, several real-world incidents were successfully detected where attackers used one type of DLL hijacking — the DLL Sideloading technique — to gain persistence and execute their code in the system.
Let us take a closer look at the three most interesting of these.
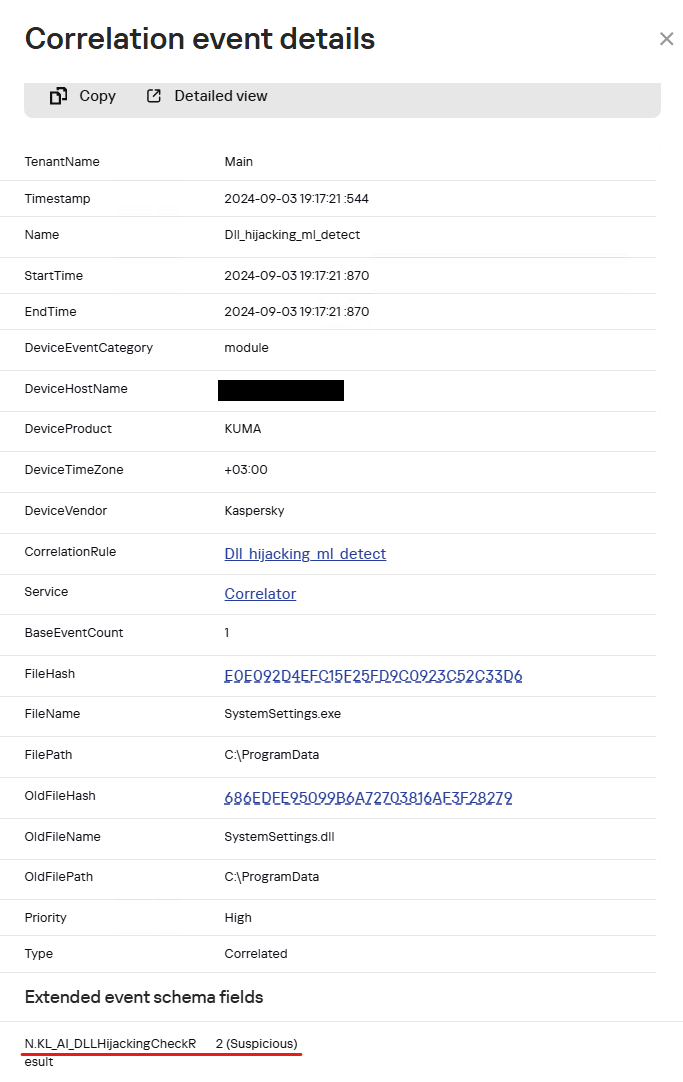
Incident 1. ToddyCat trying to launch Cobalt Strike disguised as a system library
In one incident, the attackers successfully leveraged the vulnerability CVE-2021-27076 to exploit a SharePoint service that used IIS as a web server. They ran the following command:
After the exploitation, the IIS process created files that were later used to run malicious code via the DLL sideloading technique (T1574.001 Hijack Execution Flow: DLL):
SystemSettings.dll is the name of a library associated with the Windows Settings application (SystemSettings.exe). The original library contains code and data that the Settings application uses to manage and configure various system parameters. However, the library created by the attackers has malicious functionality and is only pretending to be a system library.
Later, to establish persistence in the system and launch a DLL sideloading attack, a scheduled task was created, disguised as a Microsoft Edge browser update. It launches a SystemSettings.exe file, which is located in the same directory as the malicious library:
When the SystemSettings.exe process is launched, it loads the malicious DLL. As this happened, the process and library data were sent to our model for analysis and detection of a potential attack.
Example of a SystemSettings.dll load event with a DLL Hijacking module verdict in Kaspersky SIEM
The resulting data helped our analysts highlight a suspicious DLL and analyze it in detail. The library was found to be a Cobalt Strike implant. After loading it, the SystemSettings.exe process attempted to connect to the attackers’ command-and-control server.
DNS query: connect-microsoft[.]com
DNS query type: AAAA
DNS response: ::ffff:8.219.1[.]155;
8.219.1[.]155:8443
After establishing a connection, the attackers began host reconnaissance to gather various data to develop their attack.
C:\ProgramData\SystemSettings.exe
whoami /priv
hostname
reg query HKLM\SOFTWARE\Microsoft\Cryptography /v MachineGuid
powershell -c $psversiontable
dotnet --version
systeminfo
reg query "HKEY_LOCAL_MACHINE\SOFTWARE\VMware, Inc.\VMware Drivers"
cmdkey /list
REG query "HKLM\SYSTEM\CurrentControlSet\Control\Terminal Server\WinStations\RDP-Tcp" /v PortNumber
reg query "HKEY_CURRENT_USER\Software\Microsoft\Terminal Server Client\Servers
netsh wlan show profiles
netsh wlan show interfaces
set
net localgroup administrators
net user
net user administrator
ipconfig /all
net config workstation
net view
arp -a
route print
netstat -ano
tasklist
schtasks /query /fo LIST /v
net start
net share
net use
netsh firewall show config
netsh firewall show state
net view /domain
net time /domain
net group "domain admins" /domain
net localgroup administrators /domain
net group "domain controllers" /domain
net accounts /domain
nltest / domain_trusts
reg query HKEY_LOCAL_MACHINE\SOFTWARE\Microsoft\Windows\CurrentVersion\Run
reg query HKEY_CURRENT_USER\Software\Microsoft\Windows\CurrentVersion\RunOnce
reg query HKEY_LOCAL_MACHINE\Software\Microsoft\Windows\CurrentVersion\Policies\Explorer\Run
reg query HKEY_LOCAL_MACHINE\Software\Wow6432Node\Microsoft\Windows\CurrentVersion\Run
reg query HKEY_CURRENT_USER\Software\Wow6432Node\Microsoft\Windows\CurrentVersion\RunOnce
Based on the attackers’ TTPs, such as loading Cobalt Strike as a DLL, using the DLL sideloading technique (1, 2), and exploiting SharePoint, we can say with a high degree of confidence that the ToddyCat APT group was behind the attack. Thanks to the prompt response of our model, we were able to respond in time and block this activity, preventing the attackers from causing damage to the organization.
Incident 2. Infostealer masquerading as a policy manager
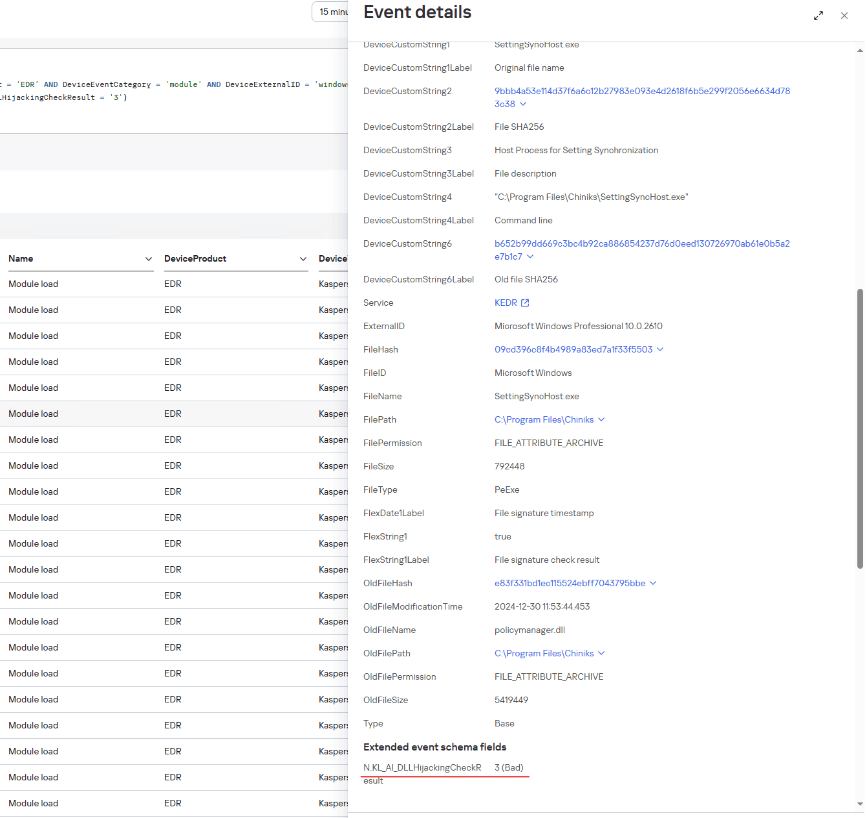
Another example was discovered by the model after a client was connected to MDR monitoring: a legitimate system file located in an application folder attempted to load a suspicious library that was stored next to it.
The SettingSyncHost.exe file is a system host process for synchronizing settings between one user’s different devices. Its 32-bit and 64-bit versions are usually located in C:\Windows\System32\ and C:\Windows\SysWOW64\, respectively. In this incident, the file location differed from the normal one.
Example of a policymanager.dll load event with a DLL Hijacking module verdict in Kaspersky SIEM
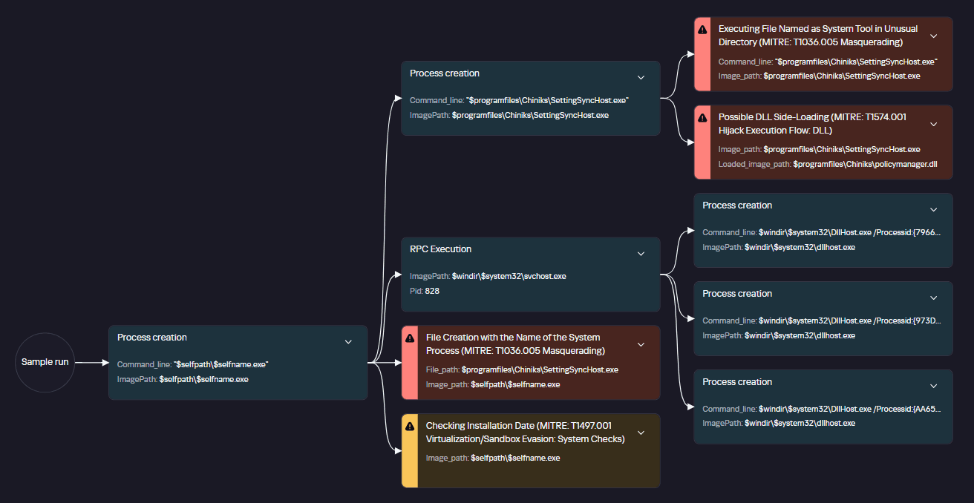
Analysis of the library file loaded by this process showed that it was malware designed to steal information from browsers.
Graph of policymanager.dll activity in a sandbox
The file directly accesses browser files that contain user data.
C:\Users\<user>\AppData\Local\Google\Chrome\User Data\Local State
The library file is on the list of files used for DLL hijacking, as published in the HijackLibs project. The project contains a list of common processes and libraries employed in DLL-hijacking attacks, which can be used to detect these attacks.
Incident 3. Malicious loader posing as a security solution
Another incident discovered by our model occurred when a user connected a removable USB drive:
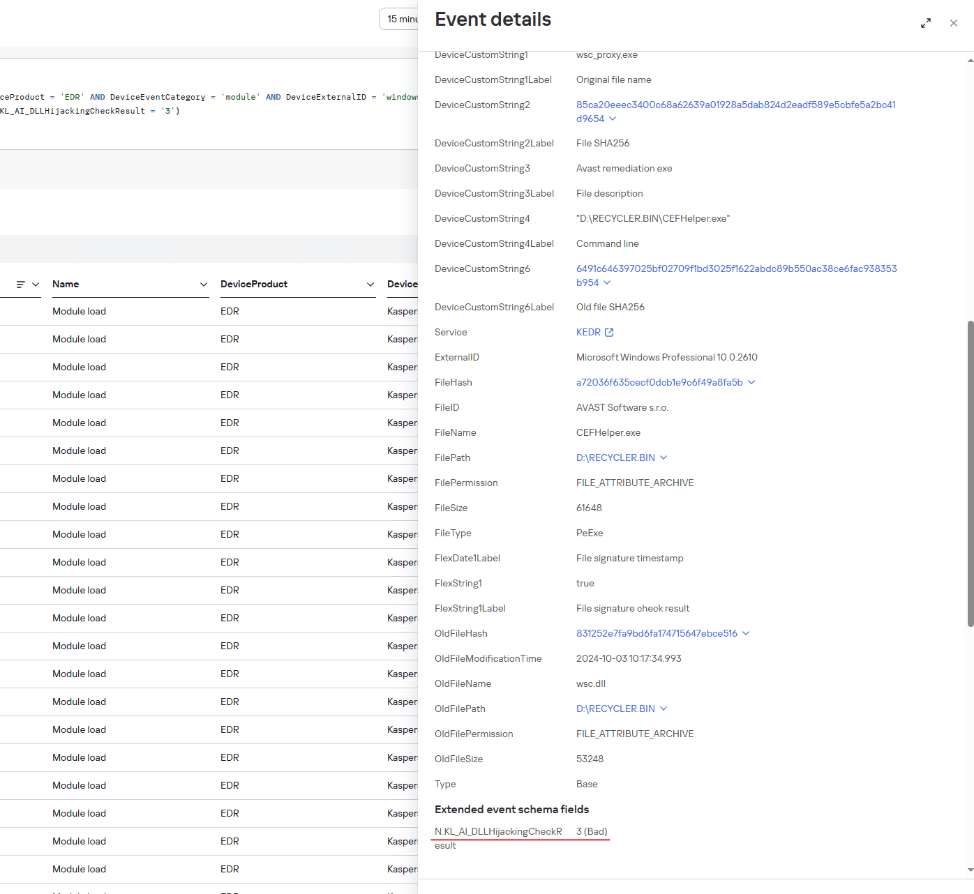
Example of a Kaspersky SIEM event where a wsc.dll library was loaded from a USB drive, with a DLL Hijacking module verdict
The connected drive’s directory contained hidden folders with an identically named shortcut for each of them. The shortcuts had icons typically used for folders. Since file extensions were not shown by default on the drive, the user might have mistaken the shortcut for a folder and launched it. In turn, the shortcut opened the corresponding hidden folder and ran an executable file using the following command:
CEFHelper.exe is a legitimate Avast Antivirus executable that, through DLL sideloading, loaded the wsc.dll library, which is a malicious loader.
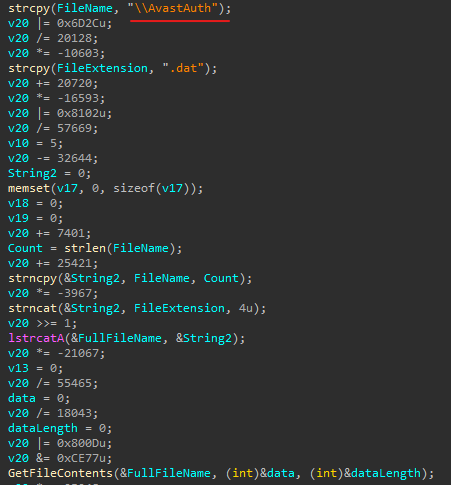
Code snippet from the malicious file
The loader opens a file named AvastAuth.dat, which contains an encrypted backdoor. The library reads the data from the file into memory, decrypts it, and executes it. After this, the backdoor attempts to connect to a remote command-and-control server.
The library file, which contains the malicious loader, is on the list of known libraries used for DLL sideloading, as presented on the HijackLibs project website.
Conclusion
Integrating the model into the product provided the means of early and accurate detection of DLL-hijacking attempts which previously might have gone unnoticed. Even during the pilot testing, the model proved its effectiveness by identifying several incidents using this technique. Going forward, its accuracy will only increase as data accumulates and algorithms are updated in KSN, making this mechanism a reliable element of proactive protection for corporate systems.
IoC
Legitimate files used for DLL hijacking E0E092D4EFC15F25FD9C0923C52C33D6 loads SystemSettings.dll
09CD396C8F4B4989A83ED7A1F33F5503 loads policymanager.dll
A72036F635CECF0DCB1E9C6F49A8FA5B loads wsc.dll
When it comes to digital forensics, AmCache plays a vital role in identifying malicious activities in Windows systems. This artifact allows the identification of the execution of both benign and malicious software on a machine. It is managed by the operating system, and at the time of writing this article, there is no known way to modify or remove AmCache data. Thus, in an incident response scenario, it could be the key to identifying lost artifacts (e.g., ransomware that auto-deletes itself), allowing analysts to search for patterns left by the attacker, such as file names and paths. Furthermore, AmCache stores the SHA-1 hashes of executed files, which allows DFIR professionals to search public threat intelligence feeds — such as OpenTIP and VirusTotal — and generate rules for blocking this same file on other systems across the network.
This article presents a comprehensive analysis of the AmCache artifact, allowing readers to better understand its inner workings. In addition, we present a new tool named “AmCache-EvilHunter“, which can be used by any professional to easily parse the Amcache.hve file and extract IOCs. The tool is also able to query the aforementioned intelligence feeds to check for malicious file detections, this level of built-in automation reduces manual effort and speeds up threat detection, which is of significant value for analysts and responders.
The importance of evidence of execution
Evidence of execution is fundamentally important in digital forensics and incident response, since it helps investigators reconstruct how the system was used during an intrusion. Artifacts such as Prefetch, ShimCache, and UserAssist offer clues about what was executed. AmCache is also a robust artifact for evidencing execution, preserving metadata that indicates a file’s presence and execution, even if the file has been deleted or modified. An advantage of AmCache over other Windows artifacts is that unlike them, it stores the file hash, which is immensely useful for analysts, as it can be used to hunt malicious files across the network, increasing the likelihood of fully identifying, containing, and eradicating the threat.
Introduction to AmCache
Application Activity Cache (AmCache) was first introduced in Windows 7 and fully leveraged in Windows 8 and beyond. Its purpose is to replace the older RecentFileCache.bcf in newer systems. Unlike its predecessor, AmCache includes valuable forensic information about program execution, executed binaries and loaded drivers.
This artifact is stored as a registry hive file named Amcache.hve in the directory C:\Windows\AppCompat\Programs. The metadata stored in this file includes file paths, publisher data, compilation timestamps, file sizes, and SHA-1 hashes.
It is important to highlight that the AmCache format does not depend on the operating system version, but rather on the version of the libraries (DLLs) responsible for filling the cache. In this way, even Windows systems with different patch levels could have small differences in the structure of the AmCache files. The known libraries used for filling this cache are stored under %WinDir%\System32 with the following names:
aecache.dll
aeevts.dll
aeinv.dll
aelupsvc.dll
aepdu.dll
aepic.dll
It is worth noting that this artifact has its peculiarities and limitations. The AmCache computes the SHA-1 hash over only the first 31,457,280 bytes (≈31 MB) of each executable, so comparing its stored hash online can fail for files exceeding this size. Furthermore, Amcache.hve is not a true execution log: it records files in directories scanned by the Microsoft Compatibility Appraiser, executables and drivers copied during program execution, and GUI applications that required compatibility shimming. Only the last category reliably indicates actual execution. Items in the first two groups simply confirm file presence on the system, with no data on whether or when they ran.
In the same directory, we can find additional LOG files used to ensure Amcache.hve consistency and recovery operations:
C:\Windows\AppCompat\Programs\Amcache.hve.*LOG1
C:\Windows\AppCompat\Programs\Amcache.hve.*LOG2
The Amcache.hve file can be collected from a system for forensic analysis using tools like Aralez, Velociraptor, or Kape.
Amcache.hve structure
The Amcache.hve file is a Windows Registry hive in REGF format; it contains multiple subkeys that store distinct classes of data. A simple Python parser can be implemented to iterate through Amcache.hve and present its keys:
#!/usr/bin/env python3

import sys
from Registry.Registry import Registry

hive = Registry(str(sys.argv[1]))
root = hive.open("Root")

for rec in root.subkeys():
    print(rec.name())
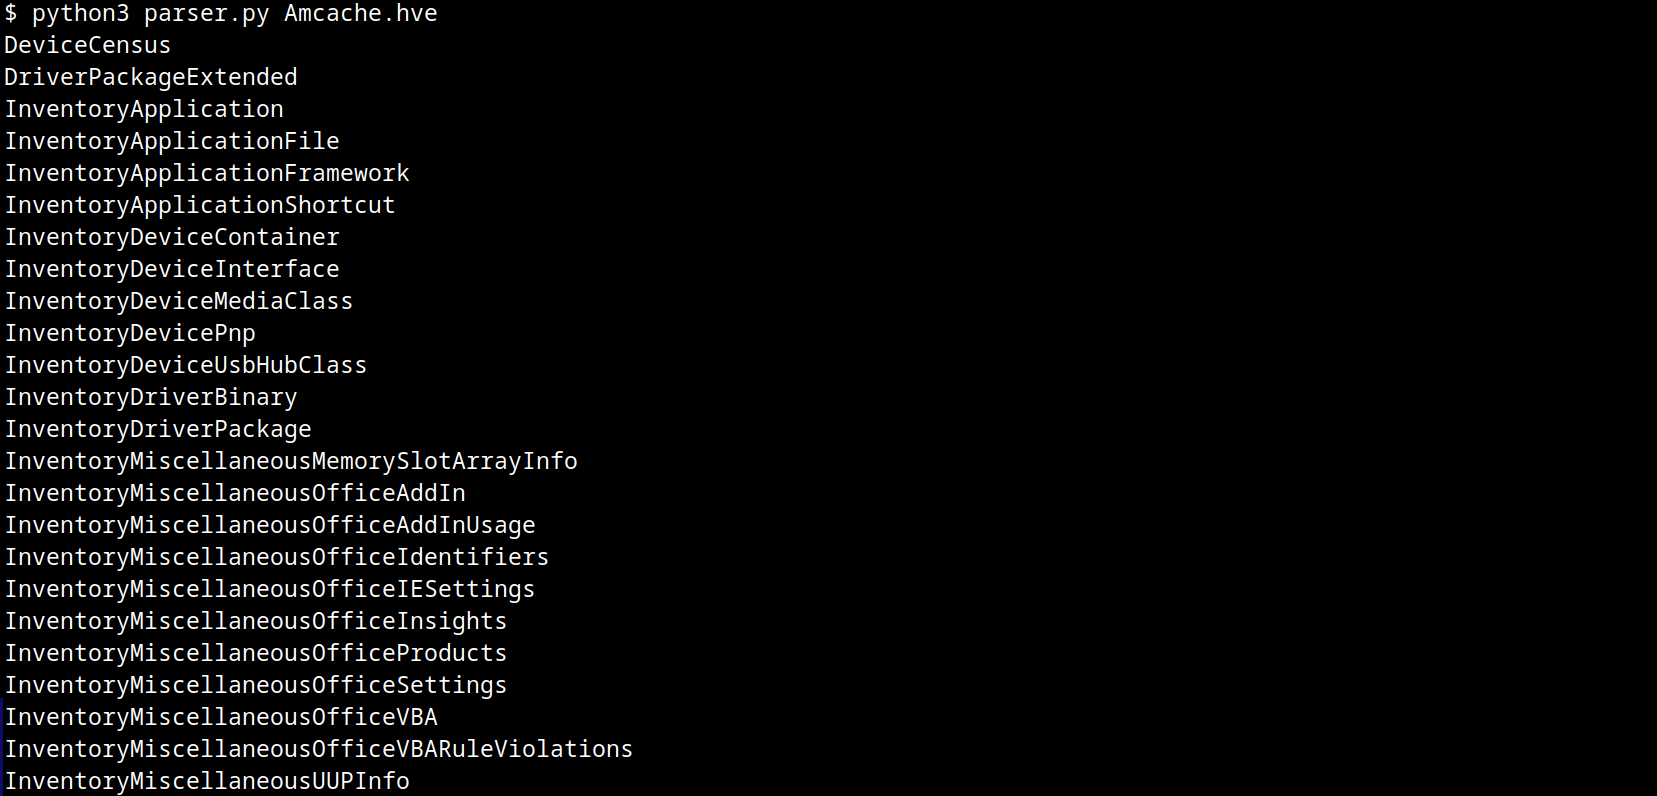
The result of this parser when executed is:
AmCache keys
From a DFIR perspective, the keys that are of the most interest to us are InventoryApplicationFile, InventoryApplication, InventoryDriverBinary, and InventoryApplicationShortcut, which are described in detail in the following subsections.
InventoryApplicationFile
The InventoryApplicationFile key is essential for tracking every executable discovered on the system. Under this key, each executable is represented by its own uniquely named subkey, which stores the following main metadata:
ProgramId: a unique hash generated from the binary name, version, publisher, and language, with some zeroes appended to the beginning of the hash
FileID: the SHA-1 hash of the file, with four zeroes appended to the beginning of the hash
LowerCaseLongPath: the full lowercase path to the executable
Name: the file base name without the path information
OriginalFileName: the original filename as specified in the PE header’s version resource, indicating the name assigned by the developer at build time
Publisher: often used to verify if the source of the binary is legitimate. For malware, this subkey is usually empty
Version: the specific build or release version of the executable
BinaryType: indicates whether the executable is a 32-bit or 64-bit binary
ProductName: the ProductName field from the version resource, describing the broader software product or suite to which the executable belongs
LinkDate: the compilation timestamp extracted from the PE header
Size: the file size in bytes
IsOsComponent: a boolean flag that specifies whether the executable is a built-in OS component or a third-party application/library
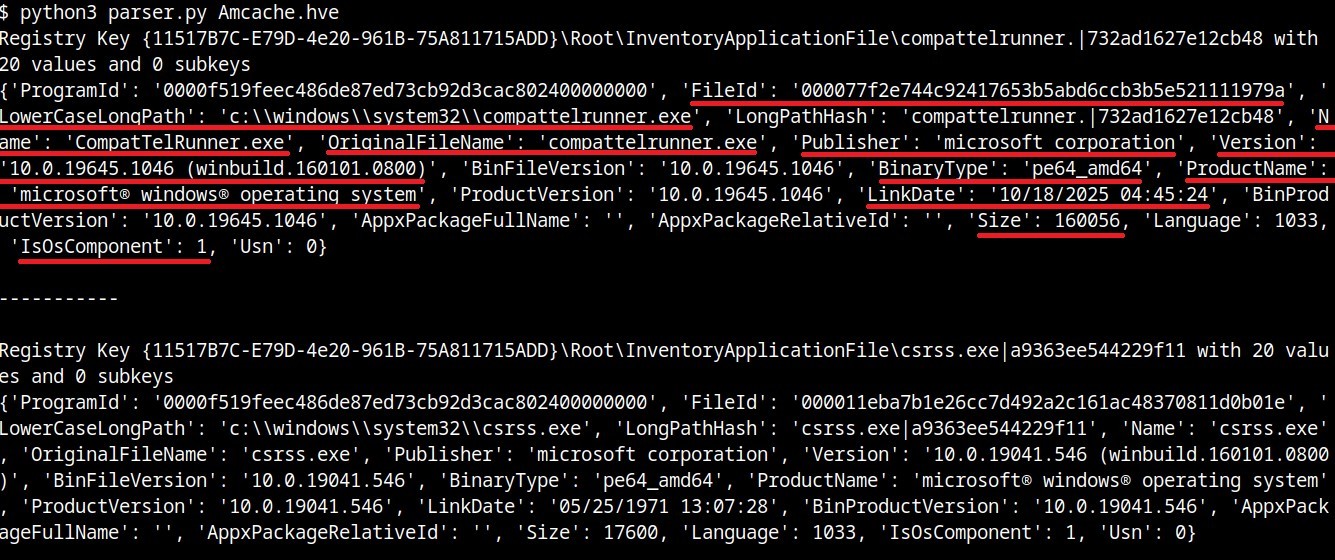
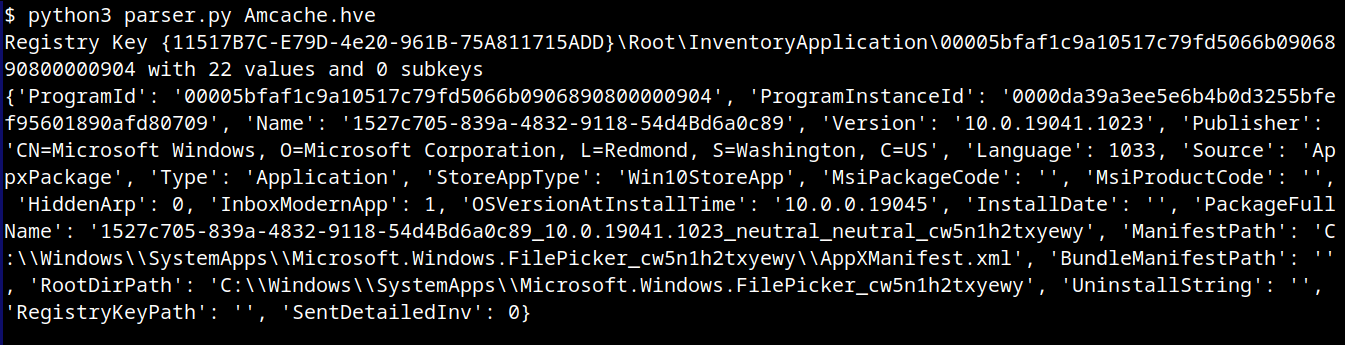
With some tweaks to our original Python parser, we can read the information stored within this key:
#!/usr/bin/env python3

import sys
from Registry.Registry import Registry

hive = Registry(sys.argv[1])
root = hive.open("Root")

subs = {k.name(): k for k in root.subkeys()}
parent = subs.get("InventoryApplicationFile")

for rec in parent.subkeys():
   vals = {v.name(): v.value() for v in rec.values()}
   print("{}\n{}\n\n-----------\n".format(rec, vals))
InventoryApplicationFile subkeys
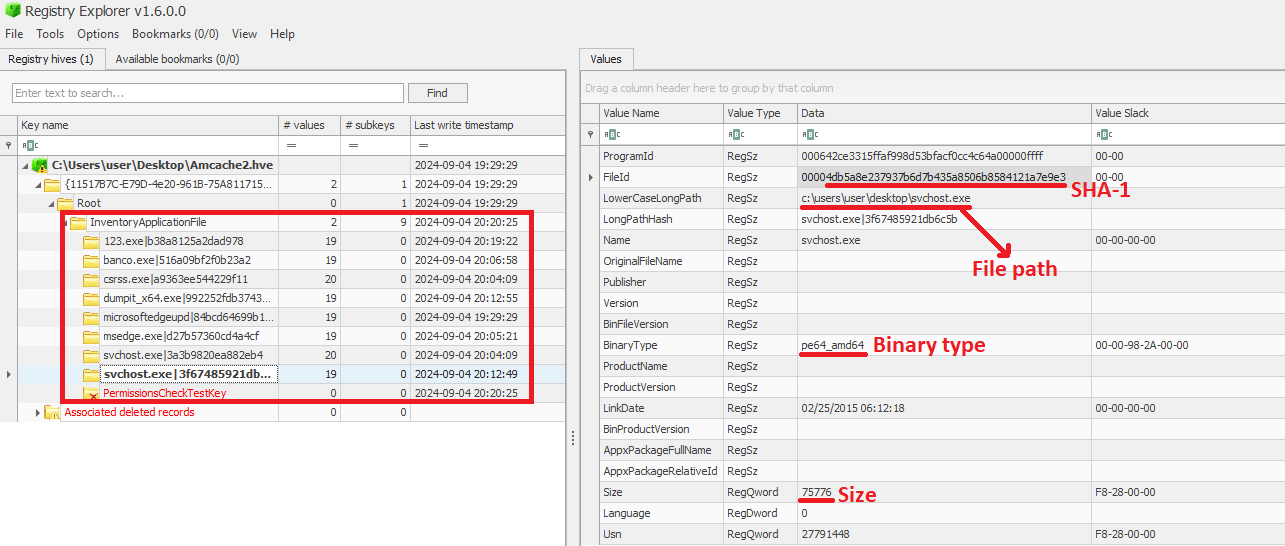
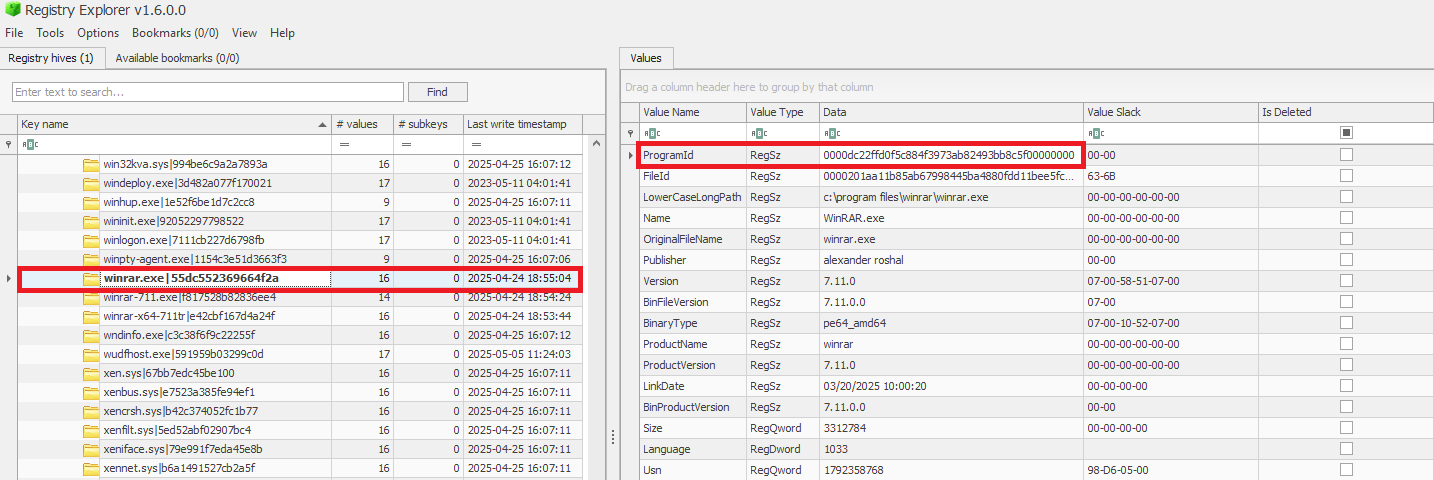
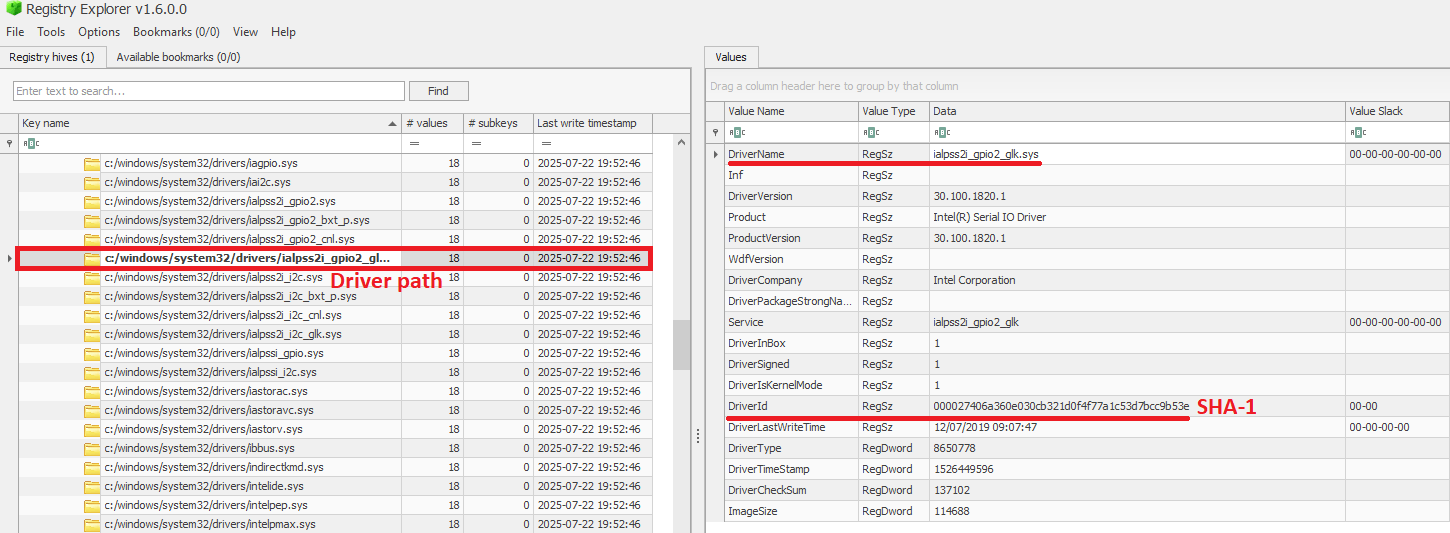
We can also use tools like Registry Explorer to see the same data in a graphical way:
InventoryApplicationFile inspected through Registry Explorer
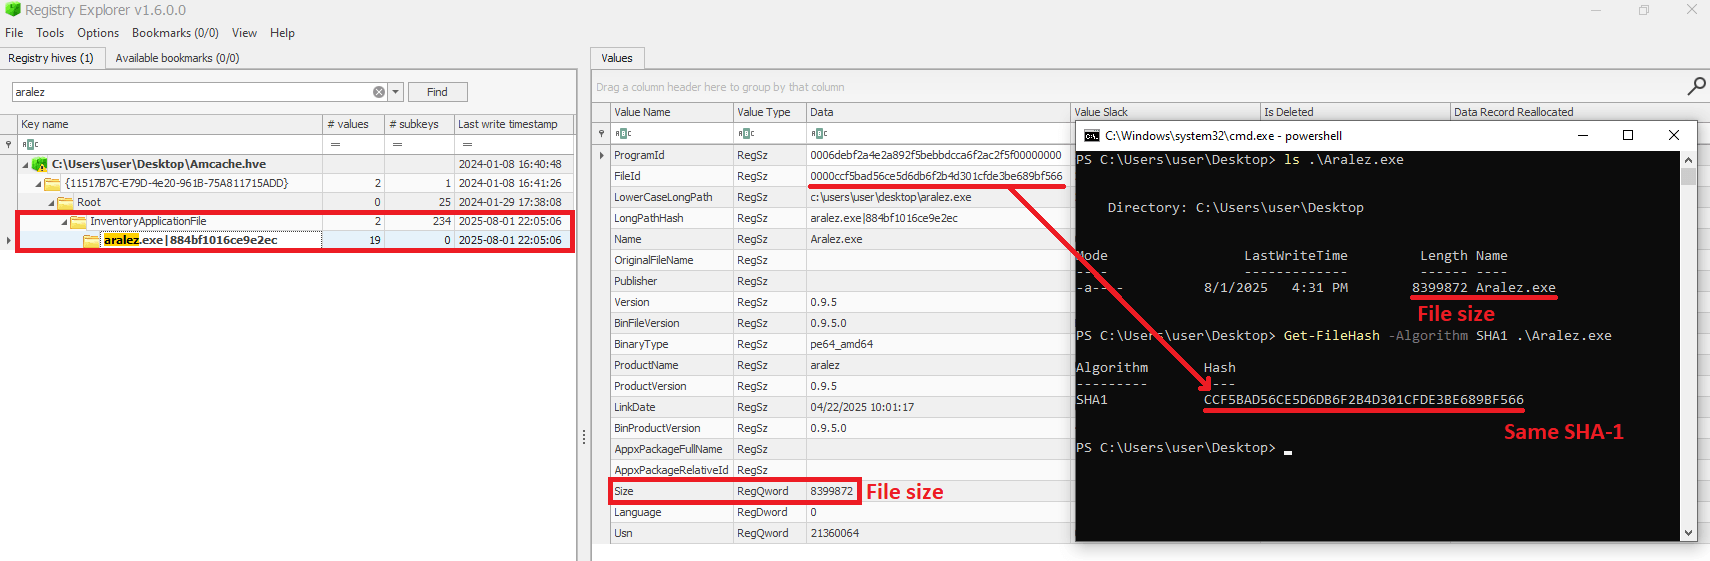
As mentioned before, AmCache computes the SHA-1 hash over only the first 31,457,280 bytes (≈31 MB). To prove this, we did a small experiment, during which we got a binary smaller than 31 MB (Aralez) and one larger than this value (a custom version of Velociraptor). For the first case, the SHA-1 hash of the entire binary was stored in AmCache.
First AmCache SHA-1 storage scenario
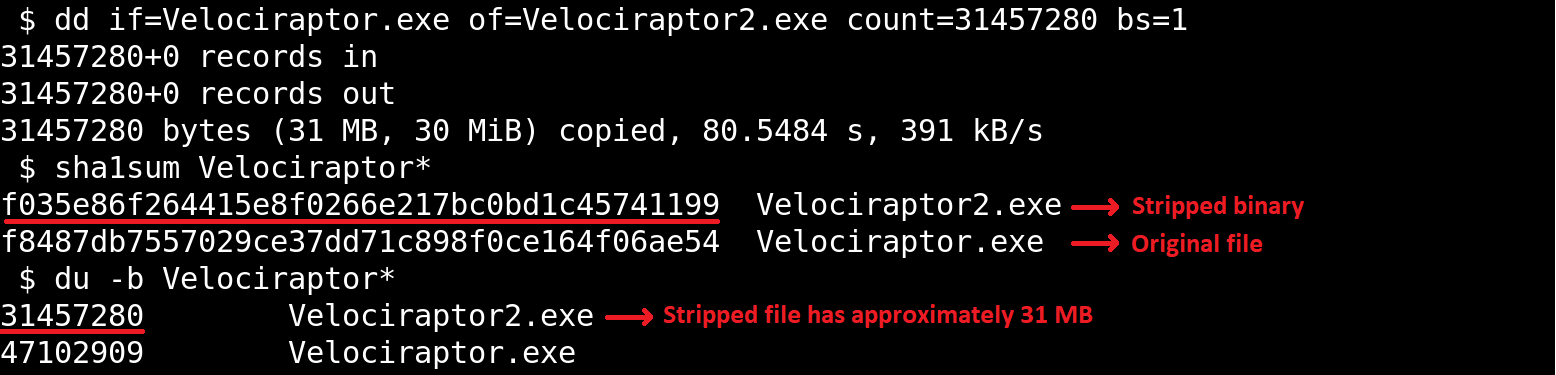
For the second scenario, we used the dd utility to extract the first 31 MB of the Velociraptor binary:
Stripped binary
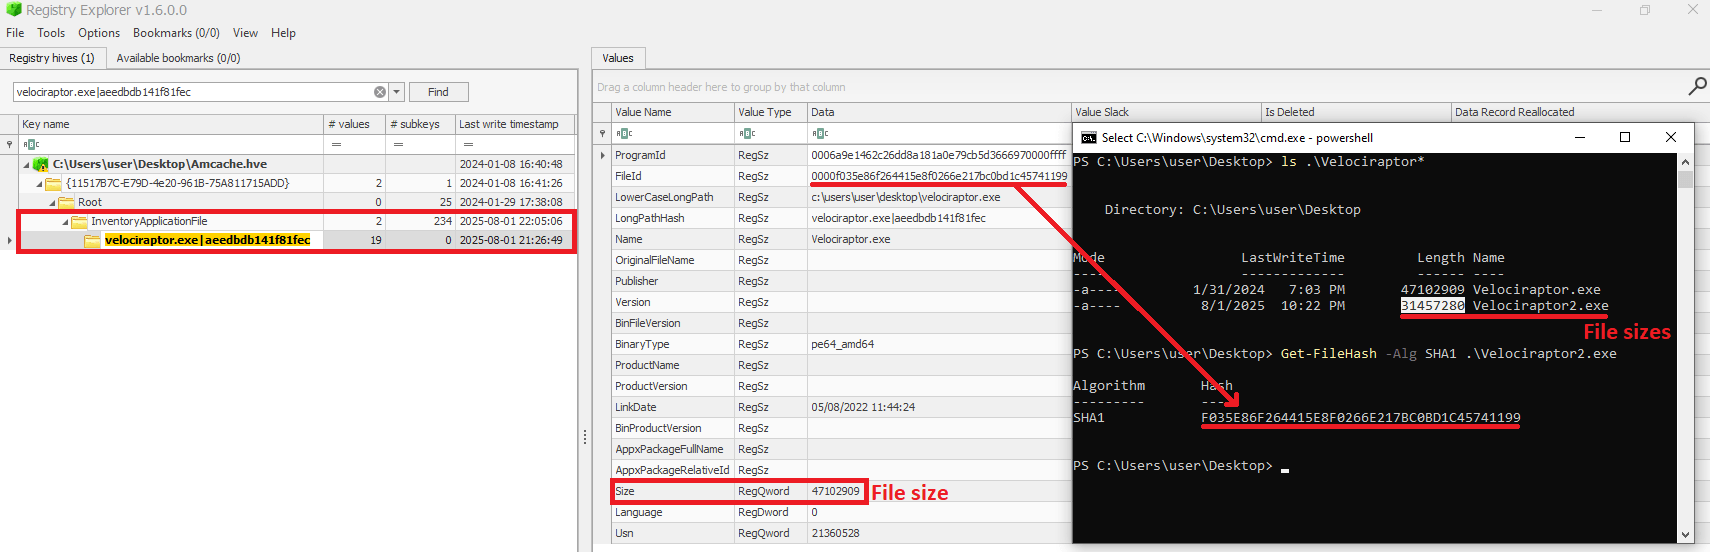
When checking the Velociraptor entry on AmCache, we found that it indeed stored the SHA-1 hash calculated only for the first 31,457,280 bytes of the binary. Interestingly enough, the Size value represented the actual size of the original file. Thus, relying only on the file hash stored on AmCache for querying threat intelligence portals may be not enough when dealing with large files. So, we need to check if the file size in the record is bigger than 31,457,280 bytes before searching threat intelligence portals.
Second AmCache SHA-1 storage scenario
Additionally, attackers may take advantage of this characteristic to purposely generate large malicious binaries. In this way, even if investigators find that a malware was executed/present on a Windows system, the actual SHA-1 hash of the binary will still be unknown, making it difficult to track it across the network and gathering it from public databases like VirusTotal.
InventoryApplicationFile – use case example: finding a deleted tool that was used
Let’s suppose you are searching for a possible insider threat. The user denies having run any suspicious programs, and any suspicious software was securely erased from disk. But in the InventoryApplicationFile, you find a record of winscp.exe being present in the user’s Downloads folder. Even though the file is gone, this tells you the tool was on the machine and it was likely used to transfer files before being deleted. In our incident response practice, we have seen similar cases, where this key proved useful.
InventoryApplication
The InventoryApplication key records details about applications that were previously installed on the system. Unlike InventoryApplicationFile, which logs every executable encountered, InventoryApplication focuses on those with installation records. Each entry is named by its unique ProgramId, allowing straightforward linkage back to the corresponding InventoryApplicationFile key. Additionally, InventoryApplication has the following subkeys of interest:
InstallDate: a date‑time string indicating when the OS first recorded or recognized the application
MsiInstallDate: present only if installed via Windows Installer (MSI); shows the exact time the MSI package was applied, sourced directly from the MSI metadata
UninstallString: the exact command line used to remove the application
Language: numeric locale identifier set by the developer (LCID)
Publisher: the name of the software publisher or vendor
ManifestPath: the file path to the installation manifest used by UWP or AppX/MSIX apps
With a simple change to our parser, we can check the data contained in this key:
When a ProgramId appears both here and under InventoryApplicationFile, it confirms that the executable is not merely present or executed, but was formally installed. This distinction helps us separate ad-hoc copies or transient executions from installed software. The following figure shows the ProgramId of the WinRAR software under InventoryApplicationFile.
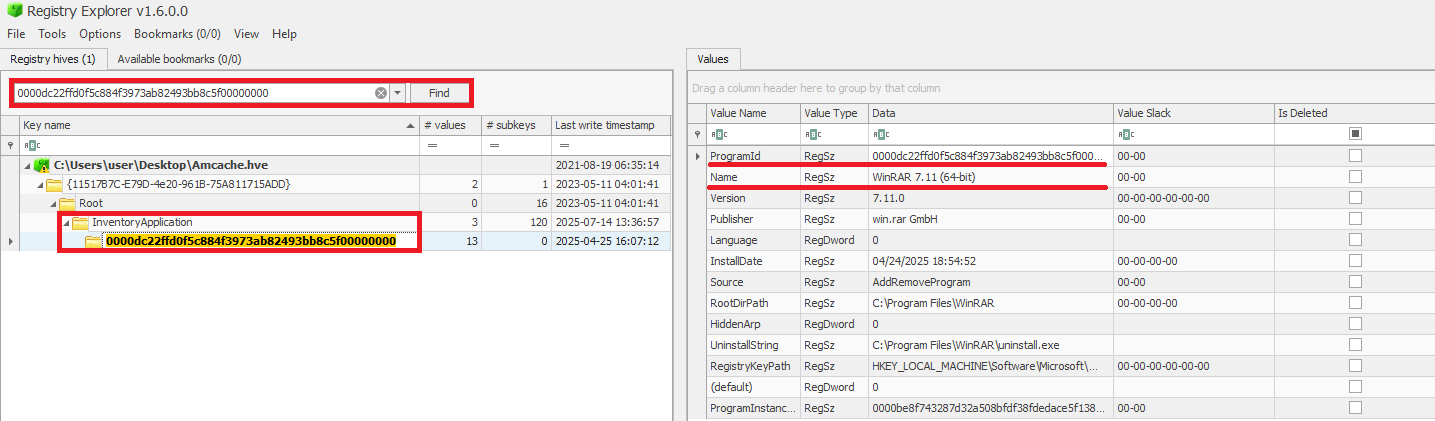
When searching for the ProgramId, we find an exact match under InventoryApplication. This confirms that WinRAR was indeed installed on the system.
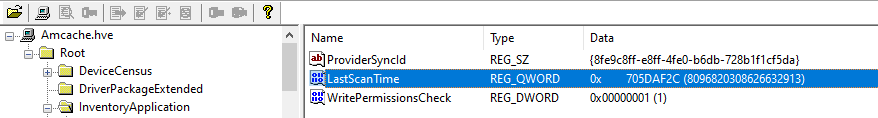
Another interesting detail about InventoryApplication is that it contains a subkey named LastScanTime, which is stored separately from ProgramIds and holds a value representing the last time the Microsoft Compatibility Appraiser ran. This is a scheduled task that launches the compattelrunner.exe binary, and the information in this key should only be updated when that task executes. As a result, software installed since the last run of the Appraiser may not appear here. The LastScanTime value is stored in Windows FileTime format.
InventoryApplication LastScanTime information
InventoryApplication – use case example: spotting remote access software
Suppose that during an incident response engagement, you find an entry for AnyDesk in the InventoryApplication key (although the application is not installed anymore). This means that the attacker likely used it for remote access and then removed it to cover their tracks. Even if wiped from disk, this key proves it was present. We have seen this scenario in real-world cases more than once.
InventoryDriverBinary
The InventoryDriverBinary key records every kernel-mode driver that the system has loaded, providing the essential metadata needed to spot suspicious or malicious drivers. Under this key, each driver is captured in its own uniquely named subkey and includes:
FileID: the SHA-1 hash of the driver binary, with four zeroes appended to the beginning of the hash
LowerCaseLongPath: the full lowercase file path to the driver on disk
DigitalSignature: the code-signing certificate details. A valid, trusted signature helps confirm the driver’s authenticity
LastModified: the file’s last modification timestamp from the filesystem metadata, revealing when the driver binary was most recently altered on disk
Because Windows drivers run at the highest privilege level, they are frequently exploited by malware. For example, a previous study conducted by Kaspersky shows that attackers are exploiting vulnerable drivers for killing EDR processes. When dealing with a cybersecurity incident, investigators correlate each driver’s cryptographic hash, file path, signature status, and modification timestamp. That can help in verifying if the binary matches a known, signed version, detecting any tampering by spotting unexpected modification dates, and flagging unsigned or anomalously named drivers for deeper analysis. Projects like LOLDrivers help identify vulnerable drivers in use by attackers in the wild.
InventoryDriverBinary inspection
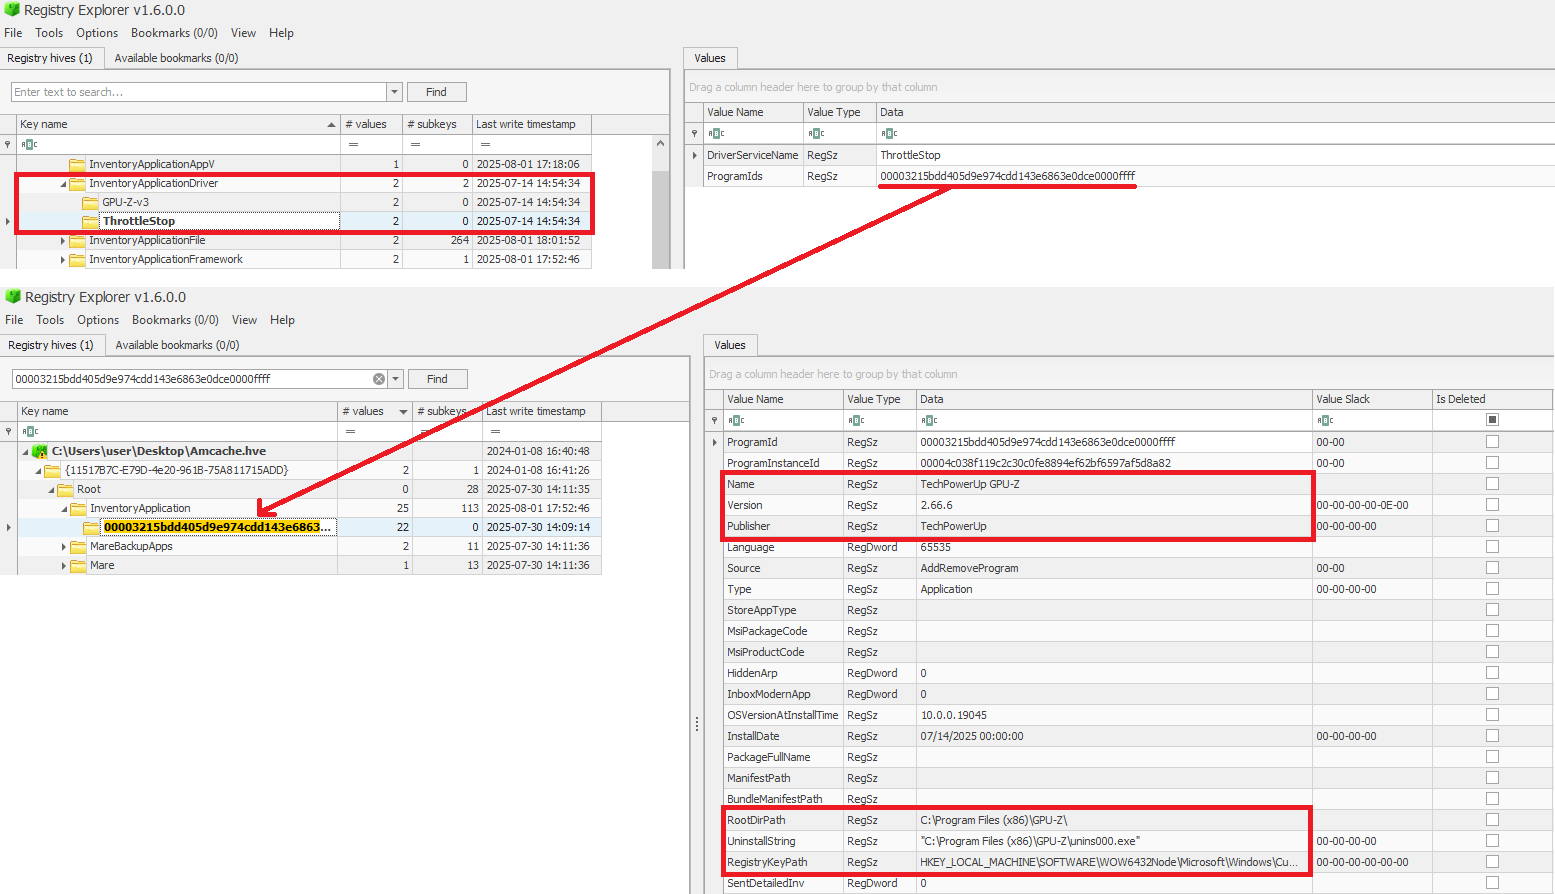
In addition to the InventoryDriverBinary, AmCache also provides the InventoryApplicationDriver key, which keeps track of all drivers that have been installed by specific applications. It includes two entries:
DriverServiceName, which identifies the name of the service linked to the installed driver; and
ProgramIds, which lists the program identifiers (corresponding to the key names under InventoryApplication) that were responsible for installing the driver.
As shown in the figure below, the ProgramIds key can be used to track the associated program that uses this driver:
Checking program information by ProgramIds
InventoryDriverBinary – use case example: catching a bad driver
If the system was compromised through the abuse of a known vulnerable or malicious driver, you can use the InventoryDriverBinary registry key to confirm its presence. Even if the driver has been removed or hidden, remnants in this key can reveal that it was once loaded, which helps identify kernel-level compromises and supporting timeline reconstruction during the investigation. This is exactly how the AV Killer malware was discovered.
InventoryApplicationShortcut
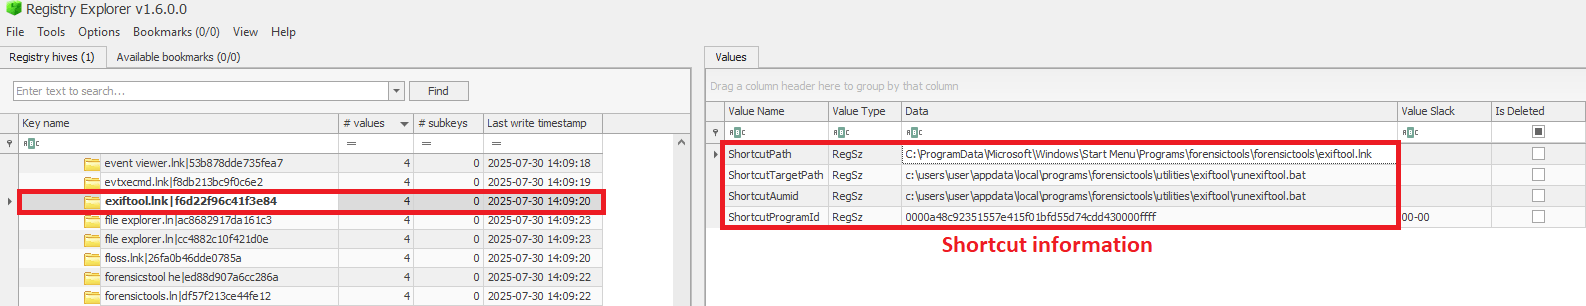
This key contains entries for .lnk (shortcut) files that were present in folders like each user’s Start Menu or Desktop. Within each shortcut key, the ShortcutPath provides the absolute path to the LNK file at the moment of discovery. The ShortcutTargetPath shows where the shortcut pointed. We can also search for the ProgramId entry within the InventoryApplication key using the ShortcutProgramId (similar to what we did for drivers).
InventoryApplicationShortcut key
InventoryApplicationShortcut – use case example: confirming use of a removed app
You find that a suspicious program was deleted from the computer, but the user claims they never ran it. The InventoryApplicationShortcut key shows a shortcut to that program was on their desktop and was accessed recently. With supplementary evidence, such as that from Prefetch analysis, you can confirm the execution of the software.
AmCache key comparison
The table below summarizes the information presented in the previous subsections, highlighting the main information about each AmCache key.
Key
Contains
Indicates execution?
InventoryApplicationFile
Metadata for all executables seen on the system.
Possibly (presence = likely executed)
InventoryApplication
Metadata about formally installed software.
No (indicates installation, not necessarily execution)
InventoryDriverBinary
Metadata about loaded kernel-mode drivers.
Yes (driver was loaded into memory)
InventoryApplicationShortcut
Information about .lnk files.
Possibly (combine with other data for confirmation)
AmCache-EvilHunter
Undoubtedly Amcache.hve is a very important forensic artifact. However, we could not find any tool that effectively parses its contents while providing threat intelligence for the analyst. With this in mind, we developed AmCache-EvilHunter a command-line tool to parse and analyze Windows Amcache.hve registry hives, identify evidence of execution, suspicious executables, and integrate Kaspersky OpenTIP and VirusTotal lookups for enhanced threat intelligence.
AmCache-EvilHunter is capable of processing the Amcache.hve file and filter records by date range (with the options --start and --end). It is also possible to search records using keywords (--search), which is useful for searching for known naming conventions adopted by attackers. The results can be saved in CSV (--csv) or JSON (--json) formats.
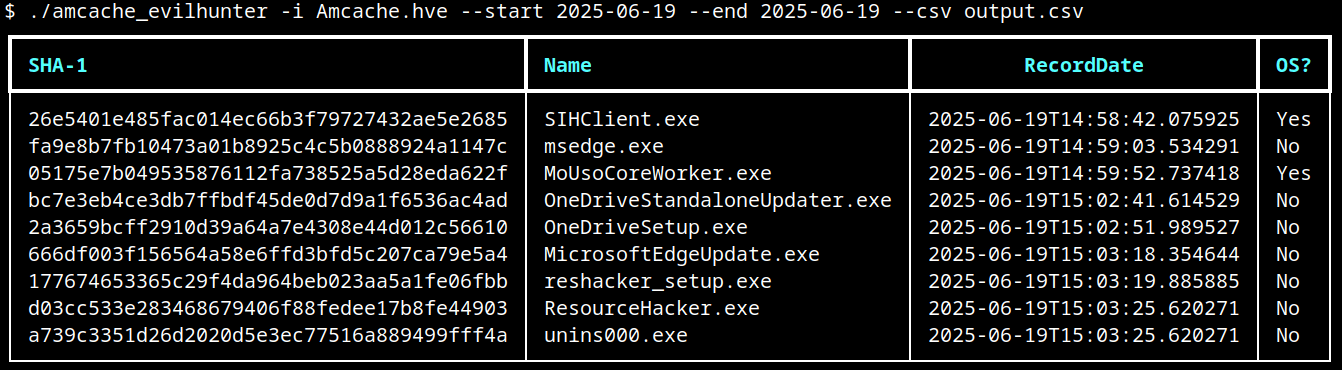
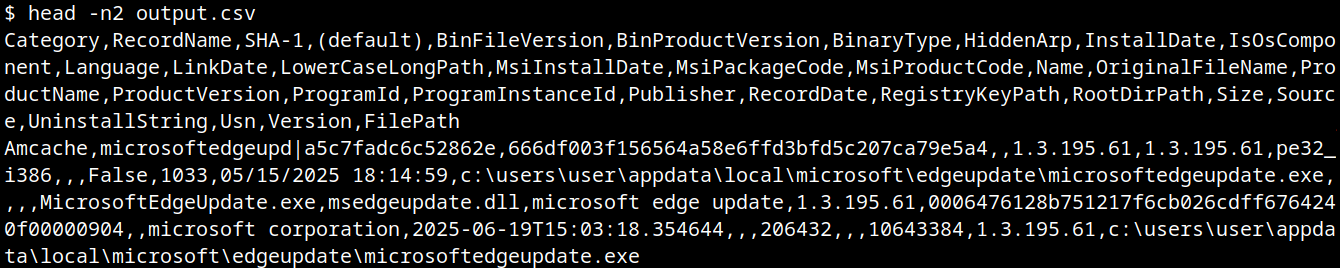
The image below shows an example of execution of AmCache-EvilHunter with these basic options, by using the following command:
The output contains all applications that were present on the machine on June 19, 2025. The last column contains information whether the file is an operating system component, or not.
Basic usage of AmCache-EvilHunter
CSV result
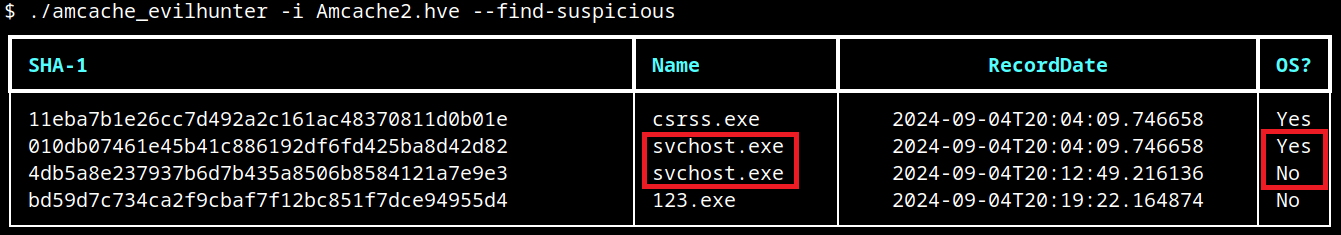
Analysts are often faced with a large volume of executables and artifacts. To narrow down the scope and reduce noise, the tool is able to search for known suspicious binaries with the --find-suspicious option. The patterns used by the tool include common malware names, Windows processes containing small typos (e.g., scvhost.exe), legitimate executables usually found in use during incidents, one-letter/one-digit file names (such as 1.exe, a.exe), or random hex strings. The figure below shows the results obtained by using this option; as highlighted, one svchost.exe file is part of the operating system and the other is not, making it a good candidate for collection and analysis if not deleted.
Suspicious files identification
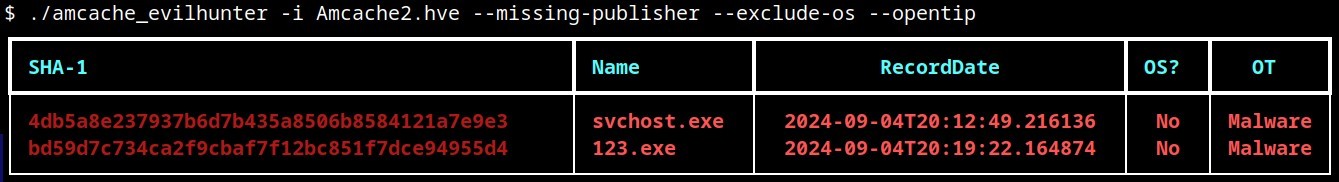
Malicious files usually do not include any publisher information and are definitely not part of the default operating system. For this reason, AmCache-EvilHunter also ships with the --missing-publisher and --exclude-os options. These parameters allow for easy filtering of suspicious binaries and also allow fast threat intelligence gathering, which is crucial during an incident.
Another important feature that distinguishes our tool from other proposed approaches is that AmCache-EvilHunter can query Kaspersky OpenTIP (--opentip ) and VirusTotal (--vt) for hashes it identifies. In this way, analysts can rapidly gain insights into samples to decide whether they are going to proceed with a full analysis of the artifact or not.
Threat intel lookup
Binaries of the tool are available on our GitHub page for both Linux and Windows systems.
Conclusion
Amcache.hve is a cornerstone of Windows forensics, capturing rich metadata, such as full paths, SHA-1 hashes, compilation timestamps, publisher and version details, for every executable that appears on a system. While it does not serve as a definitive execution log, its strength lies in documenting file presence and paths, making it invaluable for spotting anomalous binaries, verifying trustworthiness via hash lookups against threat‐intelligence feeds, and correlating LinkDate values with known attack campaigns.
To extract its full investigative potential, analysts should merge AmCache data with other artifacts (e.g., Prefetch, ShimCache, and Windows event logs) to confirm actual execution and build accurate timelines. Comparing InventoryApplicationFile entries against InventoryApplication reveals whether a file was merely dropped or formally installed, and identifying unexpected driver records can expose stealthy rootkits and persistence mechanisms. Leveraging parsers like AmCache-EvilHunter and cross-referencing against VirusTotal or proprietary threat databases allows IOC generation and robust incident response, making AmCache analysis a fundamental DFIR skill.
Today, we continue our exploration of digital forensics with a hands-on case study. So far, we have laid the groundwork for understanding forensic principles, but now it’s time to put theory into practice. Today we will analyze a malicious USB drive, a common vector for delivering payloads, and walk through how forensic analysts dissect its components to uncover potential threats.
USB drives remain a popular attack vector because they exploit human curiosity and trust. Often, the most challenging stage of the cyber kill chain is delivering the payload to the target. Many users are cautious about downloading unknown files from the internet, but physical media like USB drives can bypass that hesitation. Who wouldn’t be happy with a free USB? As illustrated in Mr. Robot, an attacker may drop USB drives in a public place, hoping someone curious will pick them up and plug them in. Once connected, the payload can execute automatically or rely on the victim opening a document. While this is a simple strategy, curiosity remains a powerful motivator, which hackers exploit consistently.
Forensic investigation of such incidents is important. When a USB drive is plugged into a system, changes may happen immediately, sometimes leaving traces that are difficult to detect or revert. Understanding the exact mechanics of these changes helps us reconstruct events, assess damage, and develop mitigation strategies. Today, we’ll see how an autorun-enabled USB and a malicious PDF can compromise a system, and how analysts dissect such threats.
Analyzing USB Files
Our investigation begins by extracting the files from the USB drive. While there are multiple methods for acquiring data from a device in digital forensics, this case uses a straightforward approach for demonstration purposes.
After extraction, we identify two key files: a PDF document and an autorun configuration file. Let’s learn something about each.
Autorun
The autorun file represents a legacy technique, often used as a fallback mechanism for older systems. Windows versions prior to Windows 7 frequently executed instructions embedded in autorun files automatically. In this case, the file defines which document to open and even sets an icon to make the file appear legitimate.
On modern Windows systems, autorun functionality is disabled by default, but the attacker likely counted on human curiosity to ensure the document would still be opened. Although outdated, this method remains effective in environments where older systems persist, which are common in government and corporate networks with strict financial or operational constraints. Even today, autorun files can serve as a backup plan to increase the likelihood of infection.
PDF Analysis
Next, we analyze the PDF. Before opening the file, it is important to verify that it is indeed a PDF and not a disguised executable. Magic bytes, which are unique identifiers at the beginning of a file, help us confirm its type. Although these bytes can be manipulated, altering them may break the functionality of the file. This technique is often seen in webshell uploads, where attackers attempt to bypass file type filters.
To inspect the magic bytes:
bash$ > xxd README.pdf | head
In this case, the file is a valid PDF. Opening it appears benign initially, allowing us to read its contents without immediate suspicion. However, a forensic investigation cannot stop at surface-level observation. We will proceed with checking the MD5 hash of it against malware databases:
bash$ > md5sum README.pdf
VirusTotal and similar services confirm the file contains malware. At this stage, a non-specialist might consider the investigation complete, but forensic analysts need a deeper understanding of the file’s behavior once executed.
Dynamic Behavior Analysis
Forensic laboratories provide tools to safely observe malware behavior. Platforms like AnyRun allow analysts to simulate the malware execution and capture detailed reports, including screenshots, spawned processes, and network activity.
Key observations in this case include multiple instances of msiexec.exe. While this could indicate an Adobe Acrobat update or repair routine, we need to analyze this more thoroughly. Malicious PDFs often exploit vulnerabilities in Acrobat to execute additional code.
Next we go to AnyRun and get the behavior graph. We can see child processes such as rdrcef.exe spawned immediately upon opening.
Hybrid Analysis reveals that the PDF contains an embedded JavaScript stream utilizing this.exportDataObject(...). This function allows the document to silently extract and save embedded files. The file also defines a /Launch action referencing Windows command execution and system paths, including cmd /C and environment variables such as %HOMEDRIVE%%HOMEPATH%.
The script attempts to navigate into multiple user directories in both English and Spanish, such as Desktop, My Documents, Documents, Escritorio, Mis Documentos, before executing the payload README.pdf. Such malware could be designed to operate across North and South American systems. At this stage the malware acts as a dropper duplicating itself.
Summary
In our case study we demonstrated how effective USB drives can be to deliver malware. Despite modern mitigations such as disabled autorun functionality, human behavior, especially curiosity and greed remain a key vulnerability. Attackers adapt by combining old strategies with new mechanisms such as embedded JavaScript and environment-specific paths. Dynamic behavior analysis, supported by platforms like AnyRun, allows us to visualize these threats in action and understand their system-level impact.
To stay safe, be careful with unknown USB drives and view unfamiliar PDF files in a browser or in the cloud with JavaScript blocked in settings. Dynamic behavior analysis from platforms like AnyRun, VirusTotal and Hybrid Analysis helps us to visualize these threats in action and understand their system-level impact.
If you need forensic assistance, we offer professional services to help investigate and mitigate incidents. Additionally, we provide classes on digital forensics for those looking to expand their skills and understanding in this field.
The Sentinels League is the official, week-by-week standings for the Threat Hunting World Championship – the first-of-its-kind tournament where the world’s top defenders go head-to-head across four surfaces: AI, Cloud, SIEM, and Endpoint. Thousands of blue teamers from more than 100 countries are tackling real-world attack scenarios to earn points, climb the tables, and secure their path to Las Vegas.
Bookmark this blog post to check your position, track the movement each week, and jump into the next qualifier if you’re not on the board yet.
More Than a Game | How the Sentinels League Work
Qualifiers run throughout the month of September across the four league tracks with players who finish in the top 50 in each league advancing to the Regional Finals on October 22 for the Americas, Europe, and Asia Pacific & Japan. From there, regional champions progress to the Grand Final at OneCon in Las Vegas from November 4 to 6, where the World Champion is crowned.
This is more than a game. It’s a global showdown that blends entertainment, education, and elite competition. Defenders everywhere will up-level their skills and battle for:
$100,000 in prizes
A championship trophy
The prestige of being crowned World Champion
Charitable donations made in partnership with the S Foundation on behalf of each finalist
Only one player will take home the title, but everyone gains the experience of battling in real-world scenarios that sharpen the skills cyber defenders use daily.
A Global Leaderboard in Action | Follow the League Tables Live
These games are grounded in real incidents and operational trade-offs. Players earn points for flags captured and accuracy under time limits. This means pace and precision both matter. The tables below display each player’s alias, alongside points, and the prize they would receive should they finish in that same position.
Qualifying Stages
Compete online from anywhere, or in-person at select events this month. Earn Threat Hunting Hero badges, prizes, and points that advance you up the league tables. Throughout September, players may enter once per qualifier and compete across all four tracks.
AI Qualifier Games: Take on scenarios featuring AI attackers and AI-powered threat hunting tools.
Cloud Qualifier Games: Track and neutralize threats across cloud-based attack surfaces.
SIEM Qualifier Games: Assert your dominance in real-time SIEM hunting and remediation challenges.
Endpoint Qualifier Games: Hunt down and remediate endpoint vulnerabilities in scenarios pulled straight from real-world incidents.
Regional Finals | October 22
The top 200 players from each region (Americas, Europe, Asia Pacific & Japan) will face off live in an action-packed online event. Only three regional champions will advance.
Grand Final | November 4–6 | OneCon, Las Vegas
Three finalists will earn an all-expenses-paid trip to OneCon 2025 in Las Vegas to compete live on stage for the World Championship title, the trophy, and the $100K prize pool.
This championship is proud to unite thousands of cybersecurity defenders in a showcase of skill, innovation, and strategy. We invite you to share this blog for live updates, engage with us on social media, help grow the buzz across our community, and watch as the stage for threat hunting glory gets bigger. Also, it’s not too late to make a run at Regionals. Enter the next qualifier and save your spot in the Sentinels League today!
Participation is open worldwide. Prize eligibility is subject to Terms & Conditions and some countries are not eligible to receive monetary rewards. See the full rules for details.
As members of the Global Emergency Response Team (GERT), we work with forensic artifacts on a daily basis to conduct investigations, and one of the most valuable artifacts is UserAssist. It contains useful execution information that helps us determine and track adversarial activities, and reveal malware samples. However, UserAssist has not been extensively examined, leaving knowledge gaps regarding its data interpretation, logging conditions and triggers, among other things. This article provides an in-depth analysis of the UserAssist artifact, clarifying any ambiguity in its data representation. We’ll discuss the creation and updating of artifact workflow, the UEME_CTLSESSION value structure and its role in logging the UserAssist data. We’ll also introduce the UserAssist data structure that was previously unknown.
UserAssist artifact recap
In the forensics community, UserAssist is a well-known Windows artifact used to register the execution of GUI programs. This artifact stores various data about every GUI application that’s run on a machine:
Program name: full program path.
Run count: number of times the program was executed.
Focus count: number of times the program was set in focus, either by switching to it from other applications, or by otherwise making it active in the foreground.
Focus time: total time the program was in focus.
Last execution time: date and time of the last program execution.
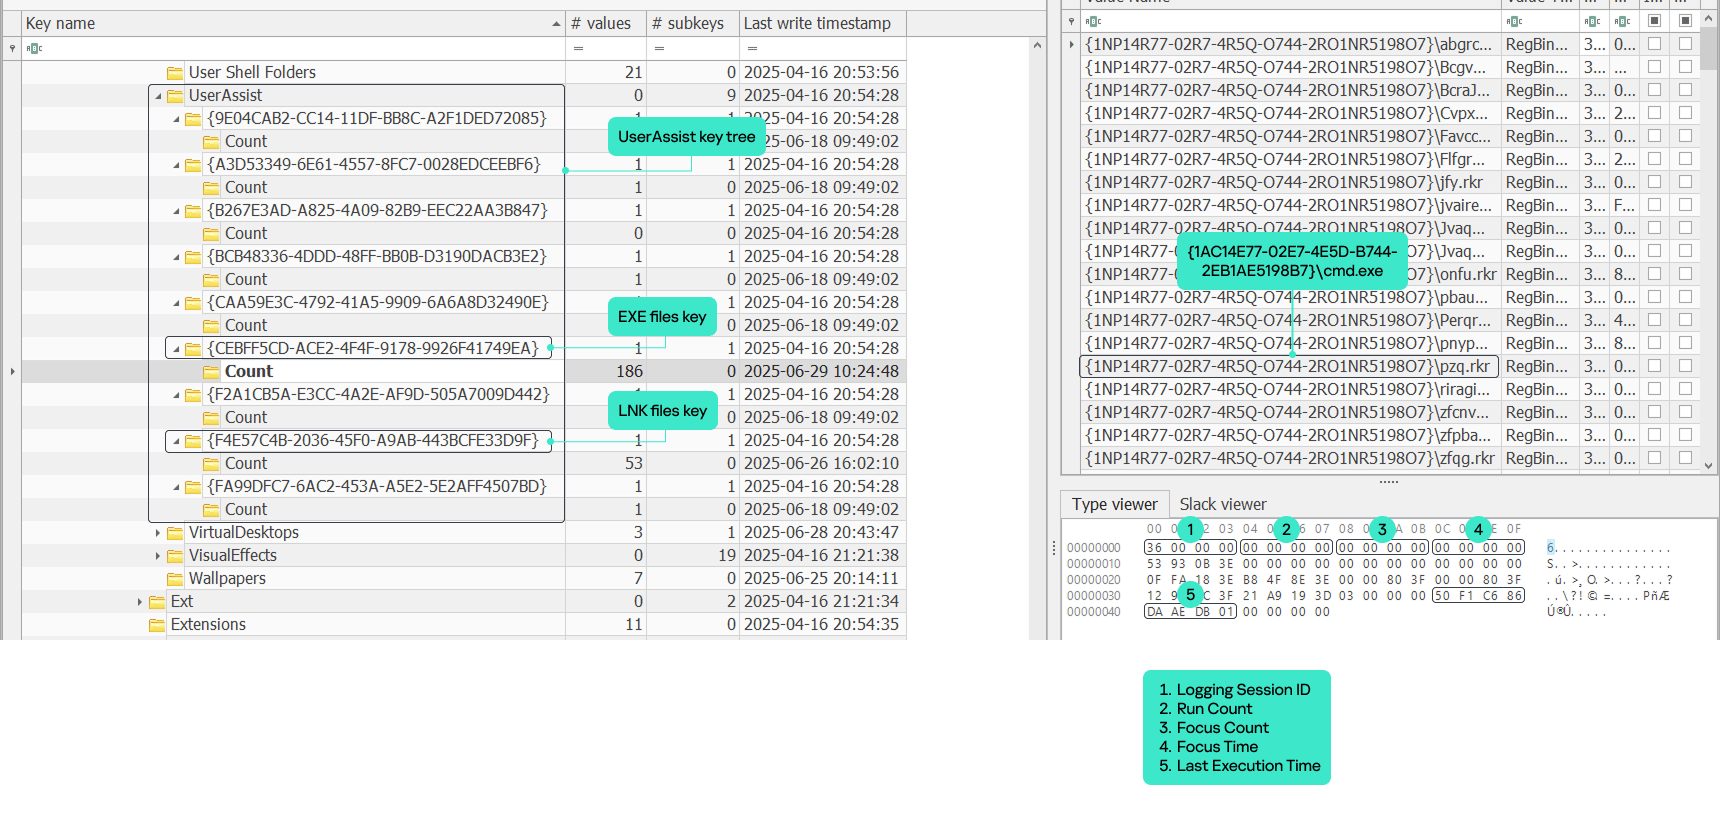
The UserAssist artifact is a registry key under each NTUSER.DAT hive located at Software\Microsoft\Windows\CurrentVersion\Explorer\UserAssist\. The key consists of subkeys named with GUIDs. The two most important GUID subkeys are:
Each subkey has its own subkey named “Count”. It contains values that represent the executed programs. The value names are the program paths encrypted using the ROT-13 cipher.
The values contain structured binary data that includes the run count, focus count, focus time and last execution time of the respective application. This structure is well-known and represents the CUACount object. The bytes between focus time and last execution time have never been described or analyzed publicly, but we managed to determine what they are and will explain this later in the article. The last four bytes are unknown and contained a zero in all the datasets we analyzed.
UserAssist artifact
Data inconsistency
Over the course of many investigations, the UserAssist data was found to be inconsistent. Some values included all of the parameters described above, while others, for instance, included only run count and last execution time. Overall, we observed five combinations of UserAssist data inconsistency.
Cases
Run Count
Focus Count
Focus Time
Last Execution Time
1
✓
✓
✓
✓
2
✓
✕
✕
✓
3
✕
✓
✓
✕
4
✓
✕
✓
✓
5
✕
✕
✓
✕
Workflow analysis
Deep dive into Shell32 functions
To understand the reasons behind the inconsistency, we must examine the component responsible for registering and updating the UserAssist data. Our analysis revealed that the component in question is shell32.dll, more specifically, a function called FireEvent that belongs to the CUserAssist class.
virtual long CUserAssist::FireEvent(struct _GUID const *, enum tagUAEVENT, unsigned short const *, unsigned long)
The FireEvent arguments are as follows:
Argument 1: GUID that is a subkey of the UserAssist registry key containing the registered data. This argument most often takes the value {CEBFF5CD-ACE2-4F4F-9178-9926F41749EA} because executed programs are mostly EXE files.
Argument 2: integer enumeration value that defines which counters and data should be updated.
Value 0: updates the run count and last execution time
Value 1: updates the focus count
Value 2: updates the focus time
Value 3: unknown
Value 4: unknown (we assume it is used to delete the entry).
Argument 3: full executable path that has been executed, focused on, or closed.
Argument 4: focus time spent on the executable in milliseconds. This argument only contains a value if argument 2 has a value of 2; otherwise, it equals zero.
Furthermore, the FireEvent function relies heavily on two other shell32.dll functions: s_Read and s_Write. These functions are responsible for reading and writing the binary value data of UserAssist from and to the registry whenever a particular application is updated:
static long CUADBLog::s_Read(void *, unsigned long, struct NRWINFO *)
static long CUADBLog::s_Write(void *, unsigned long, struct NRWINFO *)
The s_Read function reads the binary value of the UserAssist data from the registry to memory, whereas s_Write writes the binary value of the UserAssist data to the registry from the memory. Both functions have the same arguments, which are as follows:
Argument 1: pointer to the memory buffer (the CUACount struct) that receives or contains the UserAssist binary data.
Argument 2: size of the UserAssist binary data in bytes to be read from or written to registry.
Argument 3: undocumented structure containing two pointers.
The CUADBLog instance pointer at the 0x0 offset
Full executable path in plain text that the associated UserAssist binary data needs to be read from or written to the registry.
When a program is executed for the first time and there is no respective entry for it in the UserAssist records, the s_Read function reads the UEME_CTLCUACount:ctor value, which serves as a template for the UserAssist binary data structure (CUACount). We’ll describe this value later in the article.
It should be noted that the s_Read and s_Write functions are also responsible for encrypting the value names with the ROT-13 cipher.
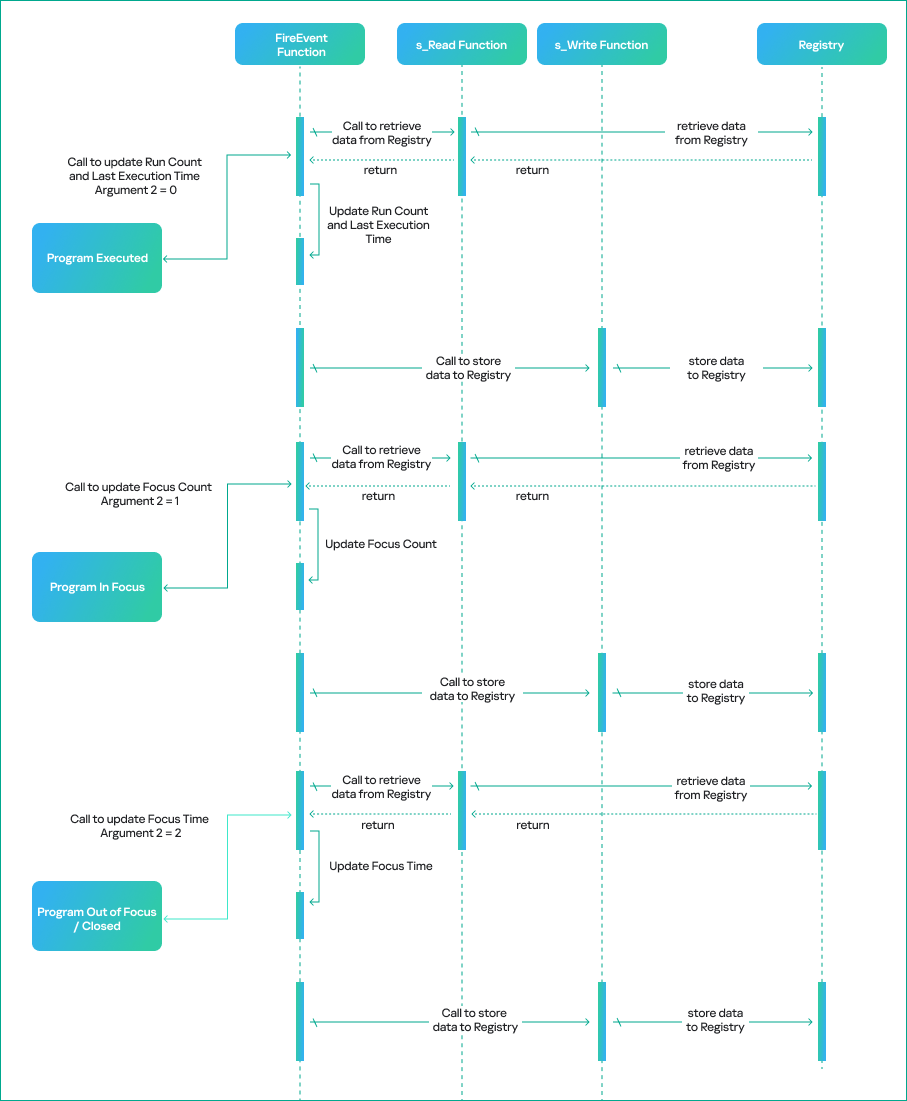
UserAssist data update workflow
Any interaction with a program that displays a GUI is a triggering event that results in a call to the CUserAssist::FireEvent function. There are four types of triggering events:
Program executed.
Program set in focus.
Program set out of focus.
Program closed.
The triggering event determines the execution workflow of the CUserAssist::FireEvent function. The workflow is based on the enumeration value that is passed as the second argument to FireEvent and defines which counters and data should be updated in the UserAssist binary data.
The CUserAssist::FireEvent function calls the CUADBLog::s_Read function to read the binary data from registry to memory. The CUserAssist::FireEvent function then updates the respective counters and data before calling CUADBLog::s_Write to store the data back to the registry.
The diagram below illustrates the workflow of the UserAssist data update process depending on the interaction with a program.
UserAssist data update workflow
The functions that call the FireEvent function vary depending on the specific triggering event caused by interaction with a program. The table below shows the call stack for each triggering event, along with the modules of the functions.
Triggering event
Module
Call Stack Functions
Details
Program executed (double click)
SHELL32
CUserAssist::FireEvent
This call chain updates the run count and last execution time. It is only triggered when the executable is double-clicked, whether it is a CLI or GUI in File Explorer.
Windows.storage
UAFireEvent
Windows.storage
NotifyUserAssistOfLaunch
Windows.storage
CInvokeCreateProcessVerb::
_OnCreatedProcess
Program in focus
SHELL32
CUserAssist::FireEvent
This call chain updates the focus count and only applies to GUI executables.
This call chain updates the focus time and applies to GUI and CLI executables. However, CLI executables are only updated if the program was executed via a double click or if conhost was spawned as a child process.
As previously mentioned, we observed five combinations of UserAssist data. Our thorough analysis shows that these inconsistencies arise from interactions with a program and various functions that call the FireEvent function. Now, let’s examine the triggering events that cause these inconsistencies in more detail.
1. All data
The first combination is all four parameters registered in the UserAssist record: run count, focus count, focus time, and last execution time. In this scenario, the program usually follows the normal execution flow, has a GUI and is executed by double-clicking in Windows Explorer.
When the program is executed, the FireEvent function is called to update the run count and last execution time.
When it is set in focus, the FireEvent function is called to update the focus count.
When it is set out of focus or closed, the FireEvent function is called to update focus time.
2. Run count and last execution time
The second combination occurs when the record only contains run count and last execution time. In this scenario, the program is run by double-clicking in Windows Explorer, but the GUI that appears belongs to another program. Examples of this scenario include launching an application with an LNK shortcut or using an installer that runs a different GUI program, which switches the focus to the other program file.
During our test, a copy of calc.exe was executed in Windows Explorer using the double-click method. However, the GUI program that popped up was the UWP app for the calculator Microsoft.WindowsCalculator_8wekyb3d8bbwe!App.
There is a record of the calc.exe desktop copy in UserAssist, but it contains only the run count and last execution time. However, both focus count and focus time are recorded under the UWP calculator Microsoft.WindowsCalculator_8wekyb3d8bbwe!App UserAssist entry.
3. Focus count and focus time
The third combination is a record that only includes focus count and focus time. In this scenario, the program has a GUI, but is executed by means other than a double click in Windows Explorer, for example, via a command line interface.
During our test, a copy of Process Explorer from the Sysinternals Suite was executed through cmd and recorded in UserAssist with focus count and focus time only.
4. Run count, last execution time and focus time
The fourth combination is when the record contains run count, last execution time and focus time. This scenario only applies to CLI programs that are run by double-clicking and then immediately closed. The double-click execution leads to the run count and last execution time being registered. Next, the program close event will call the FireEvent function to update the focus time, which is triggered by the lambda function (5b4995a8d0f55408566e10b459ba2cbe).
During our test, a copy of whoami.exe was executed by a double click, which opened a console GUI for a split second before closing.
5. Focus time
The fifth combination is a record with only focus time registered. This scenario only applies to CLI programs executed by means other than a double click, which opens a console GUI for a split second before it is immediately closed.
During our test, a copy of whoami.exe was executed using PsExec instead of cmd. PsExec executed whoami as its own child process, resulting in whoami spawning a conhost.exe process. This condition must be met for the CLI program to be registered in UserAssist in this scenario.
We summed up all five combinations with their respective interpretations in the table below.
Inconsistency combination
Interpretation
Triggering events
All Data
GUI program executed by double
click and closed normally.
· Program Executed
· Program In Focus
· Program Out of Focus
· Program Closed
Run Count and Last Execution Time
GUI program executed by double
click but focus switched to another
program.
· Program Executed
Focus Count and Focus Time
GUI program executed by other means.
· Program In Focus
· Program Out of Focus
· Program Closed
Run Count, Last Execution Time and Focus Time
CLI program executed by double
click and then closed.
· Program Executed
· Program Closed
Focus Time
CLI program executed by other
means than double click, spawned
conhost process and then closed.
· Program Closed
CUASession and UEME_CTLSESSION
Now that we have addressed the inconsistency of the UserAssist artifact, the second part of this research will explain another aspect of UserAssist: the CUASession class and the UEME_CTLSESSION value.
The UserAssist database contains value names for every executed program, but there is an unknown value: UEME_CTLSESSION. Unlike the binary data that is recorded for every program, this value contains larger binary data: 1612 bytes, whereas the regular size of values for executed programs is 72 bytes.
CUASession is a class within shell32.dll that is responsible for maintaining statistics of the entire UserAssist logging session for all programs. These statistics include total run count, total focus count, total focus time and the three top program entries, known as NMax entries, which we will describe below. The UEME_CTLSESSION value contains the properties of the CUASession object. Below are some functions of the CUASession class:
In the context of CUASession and UEME_CTLSESSION, we will refer to run count as launches, focus count as switches, and focus time as user time when discussing the parameters of all executed programs in a logging session as opposed to the data of a single program.
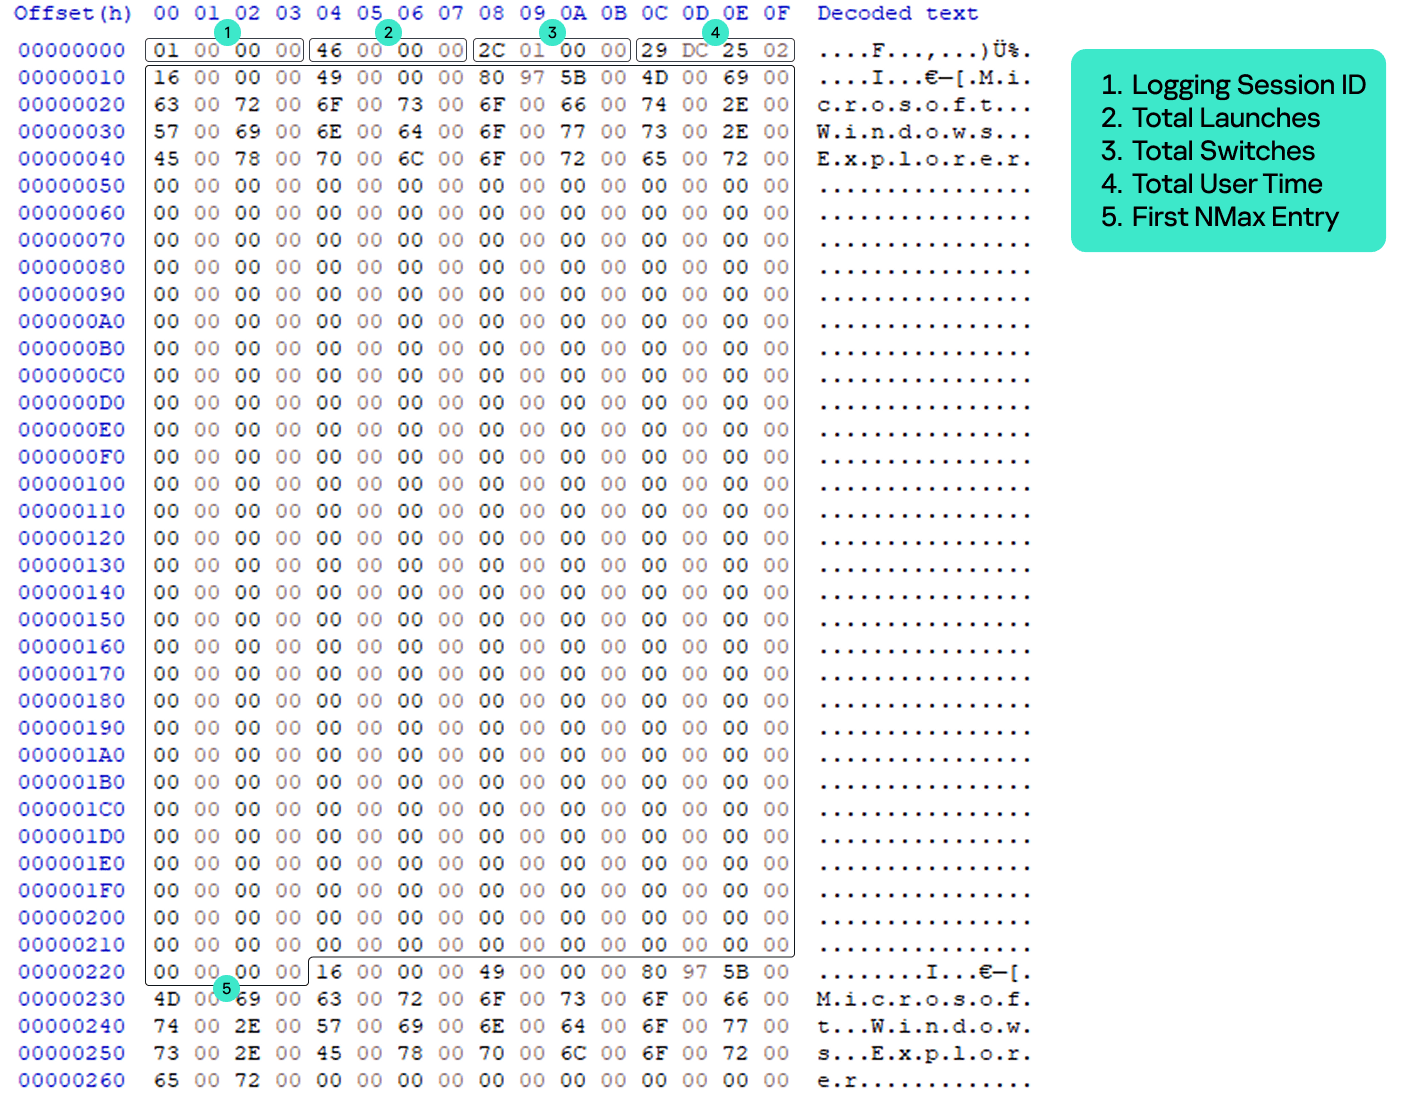
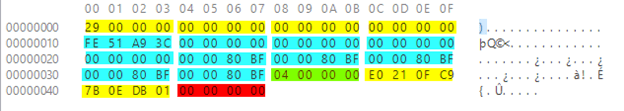
The UEME_CTLSESSION value has the following specific data structure:
0x0 offset: general total statistics (16 bytes)
0x0: logging session ID (4 bytes)
0x4: total launches (4 bytes)
0x8: total switches (4 bytes)
0xC: total user time in milliseconds (4 bytes)
0x10 offset: three NMax entries (1596 bytes)
0x10: first NMax entry (532 bytes)
0x224: second NMax entry (532 bytes)
0x438: third NMax entry (532 bytes)
UEME_CTLSESSION structure
Every time the FireEvent function is called to update program data, CUASession updates its own properties and saves them to UEME_CTLSESSION.
When FireEvent is called to update the program’s run count, CUASession increments Total Launches in UEME_CTLSESSION.
When FireEvent is called to update the program’s focus count, CUASession increments Total Switches.
When FireEvent is called to update the program’s focus time, CUASession updates Total User Time.
NMax entries
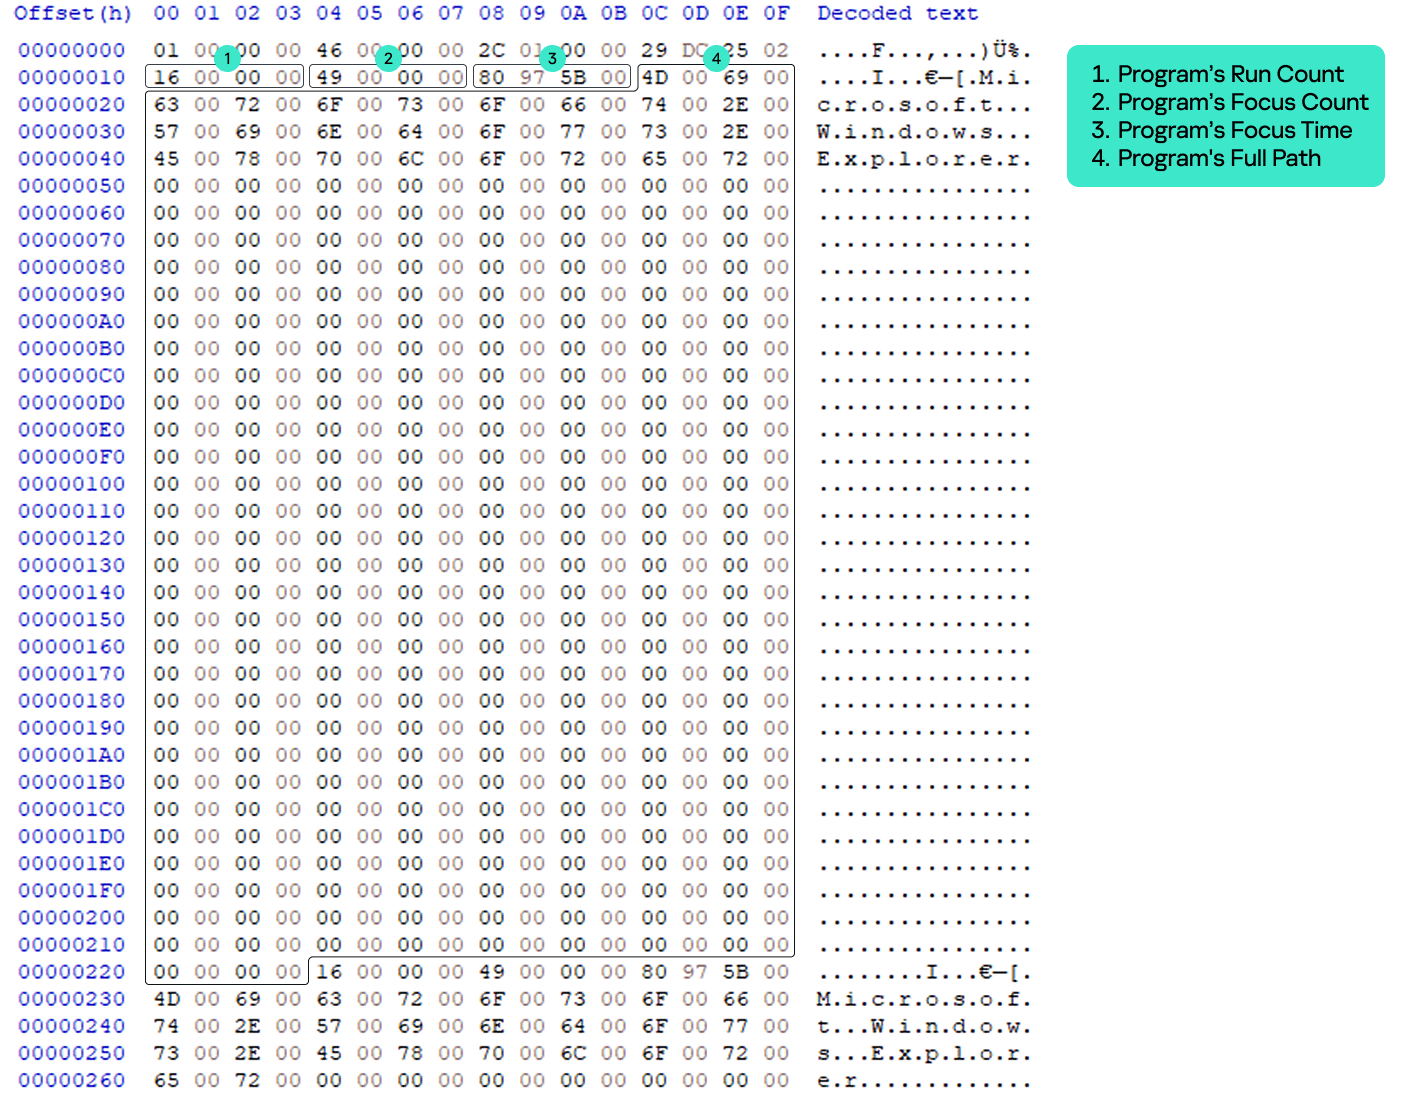
The NMax entry is a portion of the UserAssist data for the specific program that contains the program’s run count, focus count, focus time, and full path. NMax entries are part of the UEME_CTLSESSION value. Each NMax entry has the following data structure:
0x0 offset: program’s run count (4 bytes)
0x4 offset: program’s focus count (4 bytes)
0x8 offset: program’s focus time in milliseconds (4 bytes)
0xc offset: program’s name/full path in Unicode (520 bytes, the maximum Windows path length multiplied by two)
NMax entry structure
The NMax entries track the programs that are executed, switched, and used most frequently. Whenever the FireEvent function is called to update a program, the CUADBLog::_CheckUpdateNMax function is called to check and update the NMax entries accordingly.
The first NMax entry stores the data of the most frequently executed program based on run count. If two programs (the program whose data was previously saved in the NMax entry and the program that triggered the FireEvent for update) have an equal run count, the entry is updated based on the higher calculated value between the two programs, which is called the N value. The N value equation is as follows:
N value = Program’s Run Count*(Total User Time/Total Launches) + Program’s Focus Time + Program’s Focus Count*(Total User Time/Total Switches)
The second NMax entry stores the data of the program with the most switches, based on its focus count. If two programs have an equal focus count, the entry is updated based on the highest calculated N value.
The third NMax entry stores the data of the program that has been used the most, based on the highest N value.
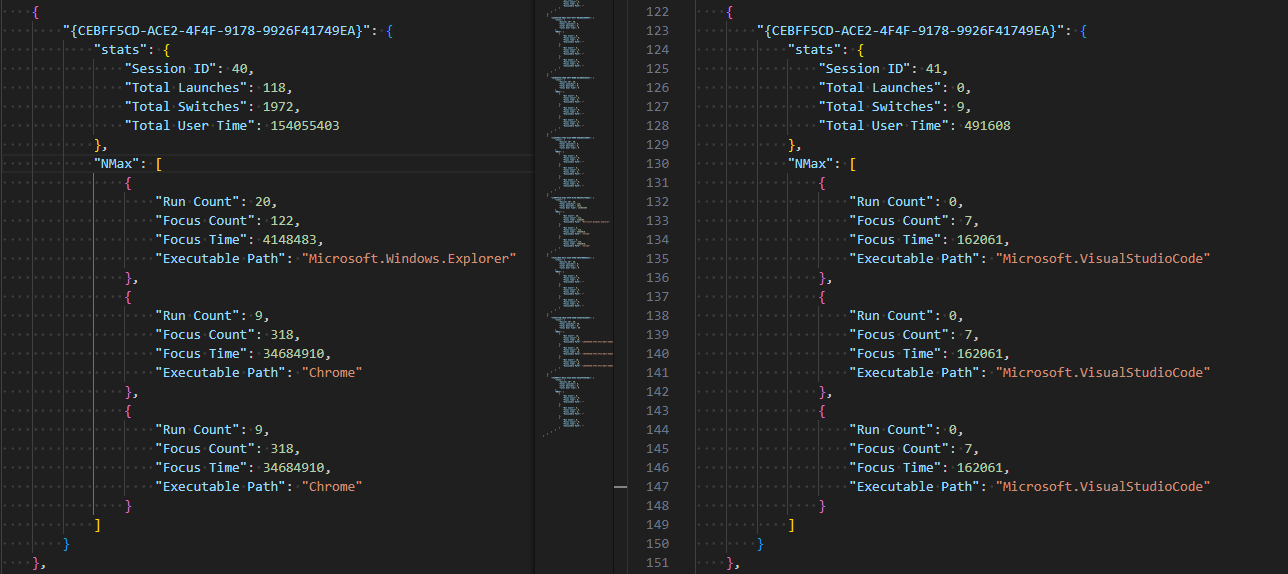
The parsed UEME_CTLSESSION structure with NMax entries is shown below.
UEME_CTLSESSION will persist even after logging off or restarting. However, when it reaches the threshold of two days in its total user time, i.e., when the total focus time of all executed programs of the current user equals two days, the logging session is terminated and almost all UserAssist data, including the UEME_CTLSESSION value, is reset.
The UEME_CTLSESSION value is reset with almost all its data, including total launches, total switches, total user time, and NMax entries. However, the session ID is incremented and a new logging session begins.
UEME_CTLSESSION comparison before and after reset
The newly incremented session ID is copied to offset 0x0 of each program’s UserAssist data. Besides UEME_CTLSESSION, other UserAssist data for each program is also reset including run count, focus count, focus time, and the last four bytes, which are still unknown and always contain zero. The only parameter that is not reset is the last execution time. However, all this data is saved in the form of a usage percentage before resetting.
Usage percentage and counters
We analyzed the UserAssist data of various programs to determine the unknown bytes between the focus time and last execution time sections. We found that they represent a list of a program’s usage percentage relative to the most used program at that session, as well as the rewrite counter (the index of the usage percentage last written to the list) for the last 10 sessions. Given our findings, we can now revise the structure of the program’s UserAssist binary data and fully describe all of its components.
UserAssist revised structure
0x0: logging session ID (4 bytes).
0x4: run count (4 bytes).
0x8: focus count (4 bytes).
0xc: focus time (4 bytes).
0x10: element in usage percentage list [0] (4 bytes).
0x14: element in usage percentage list [1] (4 bytes).
0x18: element in usage percentage list [2] (4 bytes).
0x1c: element in usage percentage list [3] (4 bytes).
0x20: element in usage percentage list [4] (4 bytes).
0x24: element in usage percentage list [5] (4 bytes).
0x28: element in usage percentage list [6] (4 bytes).
0x2c: element in usage percentage list [7] (4 bytes).
0x30: element in usage percentage list [8] (4 bytes).
0x34: element in usage percentage list [9] (4 bytes).
0x38: index of last element written in the usage percentage list (4 bytes).
0x3c: last execution time (Windows FILETIME structure) (8 bytes).
0x44: unknown value (4 bytes).
The values from 0x10 to 0x37 are the usage percentage values that are called r0 values and calculated based on the following equation.
r0 value [Index] = N Value of the Program / N Value of the Most Used Program in the session (NMax entry 3)
If the program is run for the first time within an ongoing logging session, its r0 values equal -1, which is not a calculated value, but a placeholder.
The offset 0x38 is the index of the last element written to the list, and is incremented whenever UEME_CTLSESSION is reset. The index is bounded between zero and nine because the list only contains the r0 values of the last 10 sessions.
The last four bytes equal zero, but their purpose remains unknown. We have not observed them being used other than being reset after the session expires.
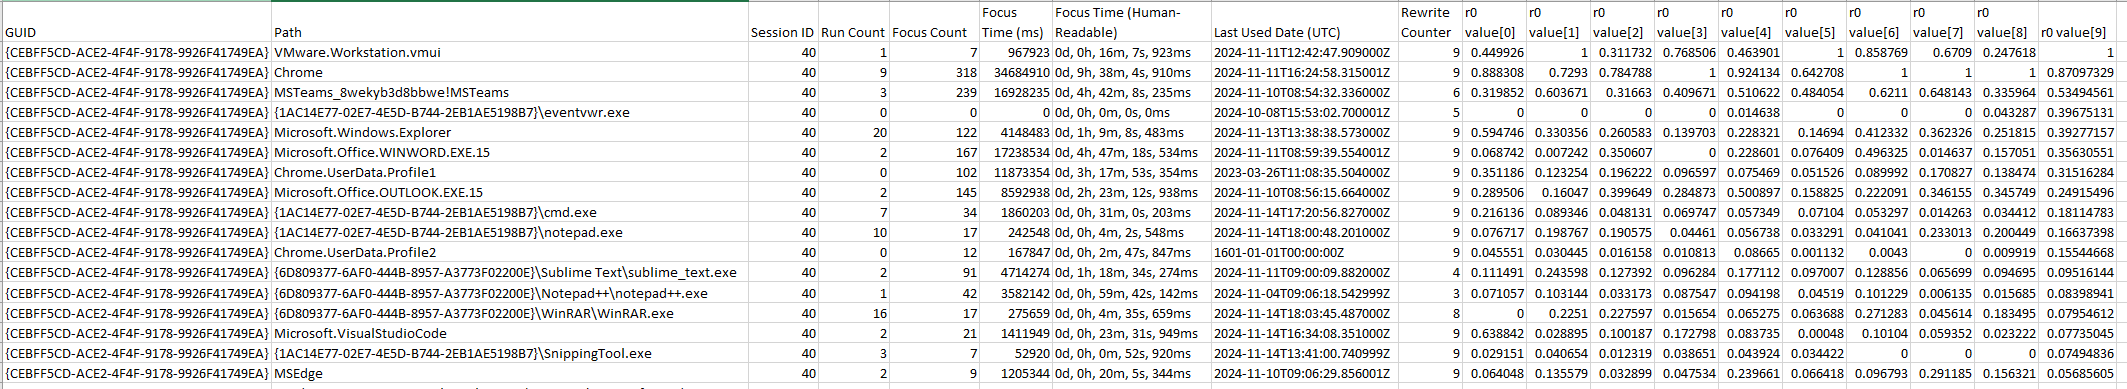
The table below shows a sample of the UserAssist data broken down by component after parsing.
UserAssist revised data structure parsed
Forensic value
The r0 values are a goldmine of valuable information about a specific user’s application and program usage. These values provide useful information for incident investigations, such as the following:
Programs with many 1 values in the r0 values list are the programs most frequently used by the user.
Programs with many 0 values in the r0 values list are the programs that are least used or abandoned by the user, which could be useful for threat hunting and lead to the discovery of malware or legitimate software used by adversaries.
Programs with many -1 values in the r0 values list are relatively new programs with data that has not been reset within two days of the user interactive session.
UserAssist data template
As mentioned above, when the program is first executed and doesn’t yet have its own UserAssist record (CUACount object), a new entry is created with the UEME_CTLCUACount:ctor value. This value serves as a template for the program’s UserAssist binary data with the following values:
Logging session ID = -1 (0xffffffff). However, this value is copied to the UserAssist entry from the current UEME_CTLSESSION session.
Run count = 0.
Focus count = 0.
Focus time = 0.
Usage percentage list [0-9] = -1 (0xbf800000) because these values are float numbers.
Usage percentage index (counter) = -1 (0xffffffff).
Last execution time = 0.
Last four bytes = 0.
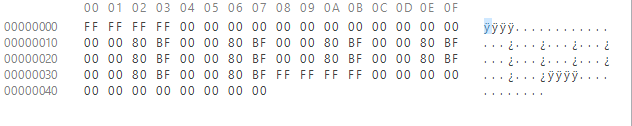
UEME_CTLCUACount:ctor data
New parser
Based on the findings of this research, we created a new parser built on an open source parser. Our new tool parses and saves all UEME_CTLSESSION values as a JSON file. It also parses UserAssist data with the newly discovered r0 value structure and saves it as a CSV file.
Conclusion
We closely examined the UserAssist artifact and how its data is structured. Our thorough analysis helped identify data inconsistencies. The FireEvent function in shell32.dll is primarily responsible for updating the UserAssist data. Various interactions with programs trigger calls to the FireEvent function and they are the main reason for the inconsistencies in the UserAssist data.
We also studied the UEME_CTLSESSION value. It is mainly responsible for coordinating the UserAssist logging session that expires once the accumulated focus time of all programs reaches two days. Further investigation of UEME_CTLSESSION revealed the purpose of previously undocumented UserAssist binary data values, which turned out to be the usage percentage list of programs and the value rewrite counter.
The UserAssist artifact is a valuable tool for incident response activities, and our research can help make the most of the data it contains.
Do you ever wonder if your cryptocurrency platform cashes in ransomware payments? Maybe not, but it might be worth investigating. Bitcoin-associated ransomware continues to plague companies, government agencies and individuals with no signs of letting up. And if your platform gets sanctioned, you may instantly lose access to all your funds.
What exchanges or platforms do criminals use to cash out or launder ransomware payments? And what implications does this have for people who use exchanges legitimately?
Blacklisted Exchanges and Mixers
Between 2014 and 2017, the BTC-e crypto exchange allegedly cashed out nearly 95% of all ransomware payments worldwide. Feds asserted that BTC-e ringleader Alexander Vinnik also played a role in the theft of about 800,000 bitcoin (about $400 million at the time) from the Japanese Mt. Gox exchange. Eventually, the U.S. government indicted Vinnik, who was sentenced to five years in jail. BTC-e eventually shut down, along with all its accounts. Meanwhile, many legitimate BTC-e customer account holders remained stuck in limbo.
Then came SUEX, the OTC cryptocurrency broker reportedly receiving $160 million from ransomware and other scammers. In 2021, the U.S. Treasury’s Office of Foreign Assets Control (OFAC) placed the Russia-based broker on the Specially Designated Nationals and Blocked Persons (SDN) List. Americans are prohibited from doing business with any company on the SDN list.
More recently, the virtual currency mixer Tornado Cash was sanctioned. According to the U.S. Treasury, the mixer “has been used to launder more than $7 billion worth of virtual currency since its creation in 2019.” A State Department spokesman said the mixer had provided “material support” to the Lazarus Group — an organization believed to work on behalf of the North Korean government. As of August 2022, the platform was also on the SDN List.
Given these incidents, how can you tell if a crypto platform is being used for nefarious purposes? What signs indicate that criminals could use your exchange, too?
Putting Things In Perspective
The reality is that malicious actors can use any financial entity for fraudulent purposes. In 2021, the illicit share of all cryptocurrency transaction volume reached an all-time low of 0.15%. Meanwhile, the UN estimates the amount of fiat money laundered globally in one year is 2 to 5% of the global GDP, or $800 billion to $2 trillion.
It’s not unheard of for criminals to use multinational banks to launder money. But if you invest in crypto and your platform gets sanctioned overnight, you might not be able to recover your coins the next day.
How Crypto Platforms Deter and Detect Illicit Activity
Three key policies can help crypto businesses to deter money laundering and ransomware payouts. When evaluating the platform you use, ask if they implement:
Know Your Customer (KYC). This means requiring customer verification when establishing a business relationship when a customer carries out a transaction and if required by law. Verification can include collecting customer data such as their name, address and date of birth.
Travel Rule. According to the Financial Action Task Force’s “Travel Rule,” crypto platforms must collect and share data on parties in transactions. The data collection threshold (transaction size) differs between countries.
Transaction monitoring. This includes a system for ongoing transaction monitoring to detect signs of money laundering. For example, exchanges can analyze wallet addresses and transaction hashes.
Some red flags crypto businesses look out for that might indicate money laundering include:
Transactions of unusual size, location or pattern. For example, a sudden, large transaction between two parties with no prior connection.
Sending cryptocurrency to darknet marketplaces, mixing services, questionable gambling sites, fraudulent exchanges and platforms with lax anti-money laundering (AML) standards. Blockchain analysis can detect the use of mixing services.
Structuring several transactions, all just below reporting thresholds. This is how criminals break down large payouts into smaller sums.
Cryptocurrency Business Regulation
Given the ongoing cryptocurrency scams, many are calling for regulatory action. A recent DIFC Fintech conference outlined the current cryptocurrency regulatory scenario. Some of the highlights include:
Approximately 95% of regulators have a team working on crypto regulations now.
The crypto industry is lobbying for clear regulatory action. Regulations can have a positive effect on cryptocurrency business development.
KYC and AML policies have been applied to U.S. cryptocurrency exchanges for years. Still, this can’t prevent actors from pivoting to exchanges in other less regulated countries that enable illicit transactions. For now, the only way to combat this is to continually monitor for platforms involved in illegal activity.
In November 2021, less than two months after the SUEX sanctions, the Treasury Department followed up with sanctions on Chatex, another Russian platform, as well as three of Chatex’s suppliers. Then, in April 2022, the Treasury Department added a third exchange operating in Russia, Garantex, to the SDN List.
Looking Ahead
So far, the efforts to fight cryptocurrency crime are all a step in the right direction. Still, no in-depth analysis has measured the overall impact of these actions on levels of crypto crime.
Sanctions and policing efforts have also been accompanied by a call to develop a U.S. central bank digital currency (CBDC). However, a CBDC collides with privacy and sovereignty issues that largely gave rise to cryptocurrencies in the first place.
Undoubtedly, no simple solutions exist for cryptocurrency-related crimes. But easy answers never existed with paper money either.
Neil Wyler started his job amid an ongoing cyberattack. As a threat hunter, he helped his client discover that millions of records had been stolen over four months. Even though his client used sophisticated tools, its threat-hunting technology did not detect the attack because the transactions looked normal. But with Wyler’s expertise, he was able to realize that data was leaving the environment as well as entering the system. His efforts saved the company from suffering even more damage and disruption.
Wyler shows that threat hunters can help prevent a cybersecurity catastrophe. But what is a threat hunter, and how can they improve an organization’s security posture?
What is Threat Hunting?
While enterprise security systems are a key part of cybersecurity, threat hunters provide organizations extra protection. A threat hunter reviews all the security data and systems to look for abnormalities and potential malware issues. Threat hunting complements automated security tools and is best used in conjunction with that technology. By combining the strengths of both human expertise and artificial intelligence (AI) tools, companies can find cyber threats faster and reduce damage.
Responsibilities of a Threat Hunter
Threat hunters search, log, monitor and neutralize threats to find issues before they become serious problems. In some companies, threat hunters design the threat-hunting program, which starts by building the hypothesis the program is looking to answer, such as searching for malware with specific criteria. Threat hunting typically involves looking for malware threats incorporated into commercial technology but not yet known.
Threat hunters use three approaches: structured, unstructured and situational.
During structured tests, the threat hunter leverages indicators of attack (IoAs) and the tactics, techniques and procedures (TTPs) of an attacker. Unstructured hunts occur when a trigger indicates a compromise, and the hunter looks at patterns before and after the detection. Situational hunts commence when a risk assessment is warranted, such as knowing attacks are happening at similar companies.
What makes threat hunting different from other cybersecurity tasks is that they don’t just use security information and event management (SIEM), endpoint detection and response (EDR) and other typical processes. Instead, threat hunters search through security data to look for patterns that indicate malware or attackers. Once they discover a cyber criminal’s potential entry method, they work to patch the issue to prevent future incidents.
Pursuing a Career as a Threat Hunter
Threat hunting is often one of the responsibilities of a cybersecurity analyst. However, some managed service professionals (MSPs) hire threat hunters whose primary responsibility is threat hunting for clients. Cybersecurity firms also hire threat hunters to provide the service to their clients. Additionally, threat hunters can work freelance for companies that need threat-hunting expertise but don’t want to hire an MSP.
Companies often look for certifications or bachelor’s degrees when hiring for analyst and threat-hunting positions. Candidates can also go into threat hunting with digital badges or certifications. However, cybersecurity analysts can learn threat-hunting skills on the job and then move into a threat-hunting role.
Threat hunters need strong technical skills and expertise with cybersecurity tools. However, the most important skills are problem-solving and analysis because the role requires manually reviewing data. Threat hunters must also have a strong interest in cybersecurity and a willingness to continually stay updated on cyber criminals’ latest TTPs. Additionally, threat hunters need good written skills to communicate findings to IT leaders. Because threat hunters often work on a team with other cybersecurity professionals, they also need the ability to collaborate and verbally communicate with others.
As cybersecurity risks and threats continue to increase, threat hunting is apt to become an even more crucial facet of cybersecurity. Organizations need the human touch to catch sophisticated threats, even using sophisticated tools. Cybersecurity professionals specializing in threat hunting or adding it to their skill set will likely have solid employment opportunities.
IBM X-Force researchers have discovered a new campaign targeting organizations with fake business emails that deliver NetWire remote-access Trojan (RAT) variants.
The RAT is hidden inside an IMG file, which is a file extension used by disk imaging software. Since many attachments can be automatically blocked by email security controls, spammers often carefully choose the type of file extensions they use in malspam messages, and shuffle the types of files they conceal malware in. X-Force’s analysis shows that emails delivered by the NetWire RAT in this campaign are being sent from a small number of unique senders supposedly located in Germany.
The NetWire RAT is a malicious tool that emerged in the wild in 2012. This multi-platform malware has since undergone various upgrade cycles and was detected in different types of attacks that range from cybercrime endeavors by Nigerian scammers to advanced persistent threat (APT) attacks. The NetWire RAT is a commercial offering that can be easily purchased on Dark Web markets, which means that it can be used by just about any threat actor.
This isn’t the first time NetWire is being delivered in fake business communications. In a previous campaign launched in September 2019, its operators sent booby-trapped fake PDF files to potential victims, indicating it was a commercial invoice. The actual file was an executable that installed the NetWire RAT as soon as the file was clicked.
Extracting a RAT
In one of the samples we looked into, an IMG file named “Sales_Quotation_SQUO00001760.img.” was a way for the attackers to archive the malware until the file was clicked open. Once opened, it extracted an executable: the NetWire RAT.
Immediately after this initial execution, the malware established persistence via a scheduled task, a common tactic to many malware developers. Scheduled tasks enable the malware to keep checking that it’s active or relaunch itself in a recurring fashion.
Additionally, registry keys are created to store the command-and-control (C&C) server’s IP address and save data used by the malware to operate on the infected device. Communication with the C&C server is performed over TCP port 3012.
What’s the NetWire RAT Up To?
Since this malware can be used by any group with any motivation, attribution is rather futile. What we did want to figure out was what the NetWire RAT campaign we detected was after this time.
Looking at some unencrypted strings found in memory, we identified a series of strings written in a foreign language, which appears to be Indonesian. Below is a screenshot from Google Translate showing a rough translation of the various identified strings. Many of these terms either relate to a login prompt, payment options, donations or the term “afterlife savings”:
Figure 1: Translated malware strings from recent NetWire RAT campaign
This term may relate to permanent life insurance for retirement purposes offered in some parts of the world.
From the overall look of it, this campaign is financially motivated and most likely being carried out by local fraudsters looking to rob account owners in various ways. Although we have not seen the complete post-infection flow, it may be followed up by a 419-type scam, or might also include social engineering or phishing pages to lure the victim to enter their banking credentials and enable the attackers to take over their accounts.
Recent campaigns in the wild show that the NetWire RAT is not the only malware being delivered via disk imaging file extensions. This was somewhat of a trend in late 2019, likely because the same spamming operators were distributing RATs for different threat actors.
Commercial Malware Abounds
Oftentimes, as security professionals, we hear about the larger and more impactful data breaches, ransomware attacks, and destructive campaigns, which are often carried out by sophisticated cybercrime gangs. But while most financially motivated cybercrime is the work of larger, organized crime groups, smaller factions are still very much in business, and they too target businesses to compromise bank accounts and steal money by using commercially available malware year-round.
Indicators of compromise (IoCs) and other information on how to protect networks from the NetWire RAT can be found on IBM X-Force Exchange.