❌

Reading view

There are new articles available, click to refresh the page.

Bitcoin Volatility Squeeze Signals Directional Move Ahead – What To Expect

Bitcoin is once again entering a critical phase as volatility contracts, and BTC price continues to coil within a tightening range. This volatility squeeze reflects a market in temporary balance, where neither buyers nor sellers have full control, but pressure continues to build under the surface. With macro catalysts and derivatives positioning near the key technical levels, the current compression suggests that BTC may be approaching a decisive expansion.

Bitcoin is being held in place, but is about to break. In an X post, an analyst known as NoLimit revealed data showing why BTC feels stuck between $85,000 and $95,000. While everything else is moving up, the magnetic pull that is holding BTC back will expire in 4 days. BTC is currently trapped inside a massive options web, and the chart shows the concentration around January 30 is nearly double that of any other date.

Why Low Volatility Often Precedes Big Moves

Currently, the market makers are sitting in a Long Gamma position in this range, which will completely change how the price behaves. When BTC price rises, dealers are forced to sell to stay hedged, and when it dips, they’re forced to buy to stay hedged. This setup reveals why every pump is immediately rejected and why every dump is bought up instantly, not weak buyers, but forced dealer activity.

Related Reading: Bitcoin Price Mirroring Key Patterns From 2021 – Is History About To Repeat?

The data has also shown a massive gamma unwind on January 30. As BTC approaches that expiration, the magnetic force holding the price in this range will start to fade. Once those options expire, the hedges and the mechanical selling pressure that have been suppressing BTC rallies would disappear. Thus, the market would move from a pinned to a released market. When that much gamma leaves the system at once, the move is usually fast and aggressive.

Bitcoin

NoLimit noted that he will share an update in 4 days of the expiration of the magnetic pull holding BTC back. The analyst emphasized that he has been an analyst for over 10 years, and called every major market top and bottom publicly, including the $126,000 BTC all-time high. When the next move is set up, he ensures to post it publicly for everyone to see.

How Bitcoin Price Holds Structure Despite Sell Pressure

Bitcoin is bullish on Cumulative Volume Delta (CVD) divergences, and the price is starting to build up, which could be an early sign of absorption by a larger entity. A full-time trader known as CEDOZXBT has pointed out that the market structure in CVD and price action is the key setup.Β 

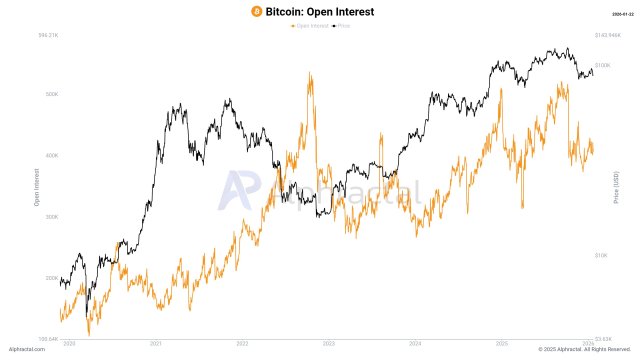
At the same time, open interest (OI) has continued to rise, showing that shorts are entering the market at the point of order. This is an early stage for full validation, but if this structure continues to build up, it could be interesting and great for a long setup.

Bitcoin

Bitcoin Large Holders Lead the Way As BTC Accumulation Picks Up, Is A Rebound Brewing?

Over the weekend, volatility observed across the broader cryptocurrency market intensified, causing the price of Bitcoin to fall back to the $86,000 mark once again. Even with the bearish price action in the past few days, buying activity continues to pick up pace in the market, especially among large BTC holders.

Bitcoin’s Largest Wallets Show Conviction

Bitcoin’s price may have been struggling with heightened volatility as a result of the broader market bearish market action, but bullish sentiment remains present among investors. In the weakening condition, large BTC whales or deep-pocket investors’ sentiment turns positive and are steadily reentering the market.

Data from Santiment, a popular market intelligence and on-chain data platform, suggests that these major investors are building positions at an encouraging and steady pace, even though the broader momentum is demonstrating weakening conditions. In the past, long-term whale accumulation has typically happened in uncertain times when prices don’t accurately reflect underlying confidence.

Santiment noted that the buying activity is spotted among wallet addresses holding over 1,000 BTC. After months of consistent buying, the group has now collectively acquired about 104,340 BTC, which represents a more than 1.5% rise.Β 

Bitcoin

As a result of the recent purchase, the investors’ overall holdings are currently sitting at 7.17 million BTC, marking their largest level since September 15, 2025. These wealthy investors are subtly consuming available supplies rather than distributing into recent market swings, indicating confidence in Bitcoin’s medium- to long-term potential.Β 

While buying pressure is growing among large Bitcoin holders, the number of whale transactions has also experienced a massive upswing. Santiment added that the amount of +$1 million daily transfers has exploded, reaching a 2-month high level.

A Continued Drop In BTC Open Interest

A continued drop in Bitcoin’s Open Interest is coinciding with the ongoing drop in price. Darkfost, a market expert and CryptoQuant author, highlighted that open interest is steadily declining, which does not support the emergence of a new trend as seen on the weekly change basis.

Since November, the metric has remained broadly negative, suggesting that the drop has continued for several weeks. Although there was a brief improvement earlier this month, it was followed by a price reaction.Β 

Overall, when open interest rises, Darkfost stated that it mostly signals trend continuation to even a trend reversal, triggered by an influx of long positions. Furthermore, this is confirmed with funding rates, but this is what happens in most cases.

On Sunday, as BTC displays a steady correction, deleveraging also increased. While this is bearish in the short term, these phases simultaneously aid in cleaning the market of excessive leverage. Thus, it is critical to remember that futures are still the primary source of volume, making keeping an eye on developments there an essential move.

Bitcoin

Years Later, Bitcoin Open Interest In BTC Still Fails To Break Past Previous Peaks

Bitcoin’s price is fluctuating below the $90,000 mark as volatility increases across the entire cryptocurrency market. During the bearish price action, attention is now being shifted to the cautious signal from the Bitcoin Open Interest in BTC terms, which has remained below past all-time high in years.

Open Interest Tells A Different Story When Measured In BTC

Amid the ongoing volatile action of the crypto market, the derivatives market for Bitcoin is providing a more subdued message. This message is unfolding on the Bitcoin Open Interest (OI) in BTC terms as outlined in a recent research by Joao Wedson, a market expert and founder of the Alphractal analytics platform.

In the report shared on the X platform, the market expert highlighted that the open interest measured in BTC terms has failed to reach new all-time highs since 2022. The BTC-based perspective shows a more restricted usage of leverage over cycles, whereas dollar-denominated measures frequently climb in tandem with price.

Bitcoin

On Thursday, the metric experienced a bounce, but Wedson stated that the upward move was mainly in USD-dominated open interest. This pattern suggests that traders are becoming more cautious in the market by allocating capital more carefully as opposed to putting it all into risky positions.

According to the expert, the trend simply suggests that speculation is present in the market and it’s currently expanding. However, the chart shows that the broader market is still far from any form of extreme or irrational euphoria.Β 

Not Enough Profit To Trigger A Bullish Recovery

BTC’s inability to produce another major rally is linked to the level of investors in profit. Darkfost stated that there are still not enough investors in profit to hope for a sustainable bullish recovery. Thus, it is crucial to understand that latent profits are not harmful to a market; it is quite the opposite.

When investors are most in profit, the situation is much more comfortable, which motivates them to hold. However, this only holds up to a certain point. Also, when the supply in profit surpasses 95% or even 100%, latest profits begin to impact the market and may trigger essential corrective phases.

The ongoing correction remained moderate with a drawdown to around 31%, but it was able to sharply reduce the percentage of supply in profit, suggesting very late entry by many investors. Currently, over 71% of BTC is in profit after dropping as low as 64%, a very concerning level that has typically been observed only when Bitcoin was entering a bear market.Β 

However, in Darkfost’s view, the market must reclaim above 75% supply in profit to regain a more stable structure. As long as it stays above this level, the supply in profit has historically been associated with positive periods, as shown in the chart.Β 

With the recent price rebound, the supply in profit saw a brief climb back to 75% before getting rejected. Meanwhile, many BTC investors possibly used this opportunity to exit at break-even or to cut their losses.

Bitcoin

Bitcoin Charts Bullish Path Toward ATH, But Needs To Clear This Major Supply Cluster

The crypto market was left in awe as the price of Bitcoin experienced a sudden surge, bringing the flagship asset dangerously close to the $100,000 mark. With the recent bounce, hopes for a retest of the current all-time high and beyond have reemerged. However, a crucial supply cluster continues to stand in the way.

A Fresh All-Time High Beckons For Bitcoin

Bitcoin’s price is gaining sharp upward traction as it retests the $98,000 price mark on Wednesday, a level last seen in November 2025. On-chain data shows that the crypto king is once again edging toward uncharted territory, with market structure pointing to a clear path toward a new all-time high.

However, there is a significant barrier between present levels and price discovery: a dense supply cluster created by investors who have previously made purchases in the same range. This range was highlighted by Glassnode, a leading on-chain data platform, after examining the BTC Long-Term Holder Cost Basis Distribution Heatmap.

Data from the key metric shows a dense cost-basis cluster between the $93,000 and $109,000 price range, which is forming a substantial overhead supply zone. The supply zone serves as a technical and psychological barrier where a large number of holders may be waiting to take profits or quit at breakeven, resulting in concentrated resistance.

Bitcoin

At this level, any sustained push higher must first absorb this supply, with a decisive breakout above the range. If Bitcoin is able to absorb this overhead supply and push through it decisively, momentum could pick up pace quickly. Glassnode noted that this crucial range is usually expected to reopen the path toward a new all-time high for Bitcoin over the longer term.

According to Glassnode in another post, BTC has ushered in the new year with constructive momentum, printing two higher highs and extending its value toward the $98,000 price level. However, the platform stated that the leg up currently runs directly into a historically supply zone.

BTC Market Is Displaying Deleveraging Signals

Looking at Bitcoin’s current action from an on-chain perspective, the flagship asset is starting to show signs of deleveraging. This deleveraging indicates that excess speculation is being removed from the market after a period of high leverage and aggressive positioning.

Coin Bureau’s report shared on X points to a sharp decline in BTC Open Interest (OI) from $15 billion in October to $10 billion today, as leveraged traders get flushed out. The drop represents an over 30% decrease within the period.Β 

Interestingly, these deleveraging phases have often preceded major market bottoms, making this a critical moment for BTC. Nonetheless, should BTC continue to fall, more leverage is expected to still get wiped out.

At the time of writing, the Bitcoin price was trading at $96,247, demonstrating a 1.29% increase in the last 24 hours. Data from CoinMarketCap shows that trading volume is down despite the bullish price action, dropping by more than 3% in the past day.

Bitcoin

❌