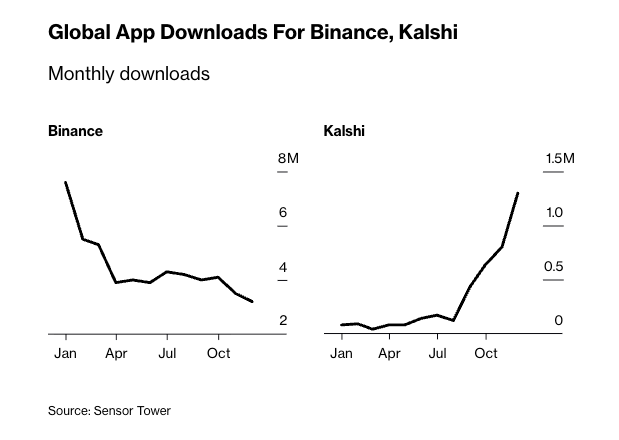
Crypto traders are abandoning token speculation in favour of prediction markets following a brutal $150 billion altcoin crash, with platforms like Polymarket seeing app installs surge from 30,000 to over 400,000 between January and December 2025, according to Bloomberg.
Source: Bloomberg
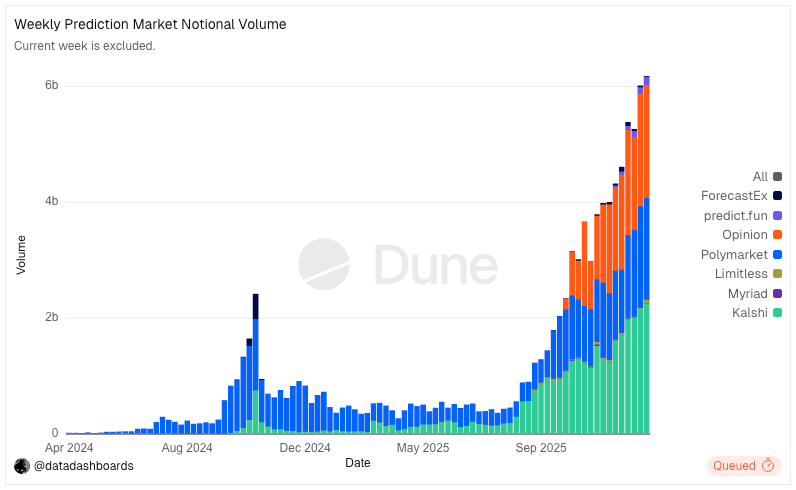
Weekly trading volume across prediction platforms, including Polymarket and Kalshi, exploded from $500 million in June to nearly $6 billion in January, data from Dune shows, while crypto exchange downloads collapsed by more than half during the same period.
The shift reflects deep fatigue across the token economy after Bitcoin plunged nearly 30% from its October peak and more than 11 million coins effectively died last year, marking the largest extinction event in crypto history, according to CoinGecko.
Former memecoin traders are leading the exodus toward prediction markets that offer binary odds on real-world events rather than multi-year token roadmaps.
Nikshep Saravanan, who abandoned his digital creator startup to build HumanPlane, a prediction market research platform, said the shift made sense after losing traction without funding.
“Here I can do a lot more with no capital,” the 27-year-old Canadian explained. “There’s so much more interest here.“
Tre Upshaw followed a similar path after losing money on memecoins like SafeMoon, now running Polysights, an analytics dashboard for prediction markets.
“I realized that’s just hyper gambling,” he said. “I got burned so many times on memecoins.”
Yet losses remain widespread across prediction markets too, with 70% of trading addresses showing realized losses, while fewer than 0.04% of Polymarket addresses captured over 70% of total realized profits totalling $3.7 billion.
70% of Polymarket traders lost money while the top 0.04% captured over $3.7 billion in profits, revealing extreme concentration in prediction markets.#Polymarket#Tradershttps://t.co/E5CeFnJIwR
The infrastructure supporting these markets remains fundamentally crypto-powered despite traders fleeing token speculation.
On Polymarket, every key part of trades except order-matching happens on-chain, revealing blockchain technology’s most durable use case yet as belief-driven speculation cools.
Crypto contracts have become the second-busiest trading category on Polymarket, up from fourth place a year ago, with notional crypto volume increasing nearly tenfold across major platforms, according to Dune data.
Exchanges Rush Into Prediction Markets
Major crypto platforms are aggressively expanding into event contracts as user demand shifts.
Coinbase added prediction markets in December through Kalshi routing, with Clear Street analyst Owen Lau projecting the exchange could generate $700 million in prediction market revenue for 2025, while Robinhood’s annual run rate already approaches $300 million.
Gemini and Crypto.com have also launched their own prediction market efforts, with Crypto.com white-labeling services for Trump Media.
“As we add more instruments, they tend to complement each other,” said Max Branzburg, Coinbase’s head of consumer and business products, noting the firm has “seen tons of excitement” from users wanting a single venue to trade everything.
A Mizuho survey cited by Bloomberg found that Coinbase and Robinhood users were 9 times more likely to use prediction platforms than the general population.
Polymarket is back in the U.S. after CFTC approval. Clear Street analyst says prediction markets could become an engagement tool for platforms like Coinbase. #Polymarket#Coinbasehttps://t.co/h9EX7a4YFn
The platform also recently rolled out real estate bets that allow crypto traders to now speculate on housing prices
The company raised $205 million across two funding rounds and secured a $2 billion investment from Intercontinental Exchange at a valuation of nearly $9 billion.
Last month, Kalshi also closed a $1 billion round at an $11 billion valuation and secured CNN as its official prediction markets partner.
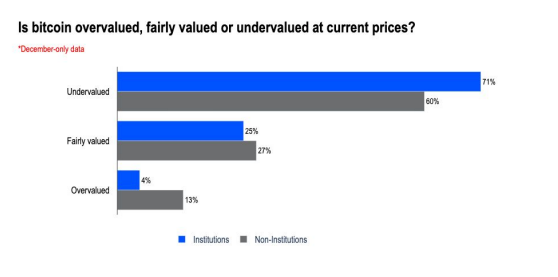
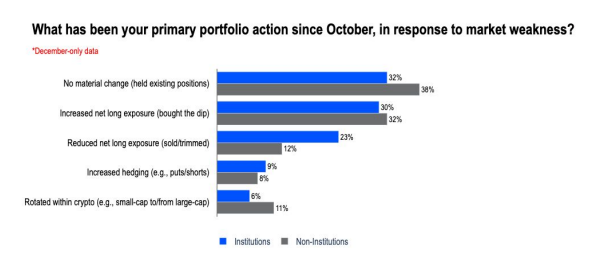
Despite near-term outflows, 70% of institutions view Bitcoin as undervalued in a recent Coinbase Institutional and Glassnode survey, and 62% maintain or increase crypto positions since October’s crash.
“Crypto markets are entering 2026 in a healthier state, with excess leverage having been flushed from the system,” said David Duong, Coinbase Global Head of Research.
Bitcoin traders are once again anchoring to FX, after intervention rumors around USD/JPY revived a familiar tug-of-war: short-term shock risk from a strengthening yen versus the longer-horizon bid that typically follows a softer dollar and easier global liquidity.
The spark over the weekend was a viral X thread (2.9 million views) from Bull Theory (@BullTheoryio), which framed reported “rate checks” by the Federal Reserve Bank of New York as a prelude to coordinated action. “The New York Fed has already done rate checks, which is the exact step taken before real currency intervention,” the account wrote. “That means the US is preparing to sell dollars and buy yen. This is rare. And historically, when this happens, global markets surge.”
Bitcoin In The Crosshairs
Bull Theory pointed to the macro backdrop in Japan, years of yen weakness, Japanese bond yields at multi-decade highs, and a still-hawkish Bank of Japan, as the pressure cooker forcing officials toward more aggressive signaling. In the thread’s telling, the key variable is coordination: Japan acting alone “does not work,” while joint US-Japan action “does,” citing 1998 and the Plaza Accord era as historical reference points.
A Bloomberg report cited by the account described the yen’s sharp jump on speculation that Japanese authorities could be preparing intervention to arrest the currency’s slide, after traders reported the New York Fed had conducted rate checks with major banks. The story said the yen rallied as much as roughly 1.6% to around 155.90 per dollar, marking its strongest level since December in that session.
THE FED IS PREPARING TO SELL U.S. DOLLARS AND BUY JAPANESE YEN FOR THE FIRST TIME THIS CENTURY.
The New York Fed has already done rate checks, which is the exact step taken before real currency intervention. That means the U.S. is preparing to sell dollars and buy yen.
The fight in the replies was less about whether markets moved and more about what a “rate check” actually signals.
Daniel Kostecki (@Dan_Kostecki) dismissed the viral framing outright, arguing the mechanism is often misread. “The Japanese asked the NY Fed to act as their agent in the American market,” Kostecki wrote. “NY Fed employees then started calling banks in New York to perform the ‘rate check’—strictly at the Japanese’s request. If officials from Tokyo had called New York banks, traders might have ignored it as a ‘local Japanese problem.’ But when the Fed calls, banks treat it as a signal that a joint intervention (USA + Japan) might be coming.”
That distinction matters for crypto because the thread’s “bull case” leans heavily on the idea that selling dollars to buy yen mechanically weakens the dollar and expands liquidity, conditions many macro-focused crypto traders associate with risk-asset upside.
Ted (@TedPillows) echoed the liquidity-first interpretation while flagging the path dependency. “The Fed is preparing for a possible yen intervention,” he wrote, before laying out the causal chain: dollars sold, yen bought, dollar weaker, liquidity higher, risk assets helped, then warning that “a strengthening yen could first cause a similar crash like in August 2024.” After that, he added, markets could stabilize and rally.
Michael A. Gayed (@leadlagreport), Portfolio Manager of The Free Markets ETF, offered a different rationale for why Washington would care, suggesting the Fed is acting to prevent a scenario where Japan would need to sell US Treasuries to raise dollars to intervene—“It’s not that Japan will panic. It’s the Fed that will panic,” he wrote.
Bull Theory’s most concrete crypto claim was that the setup contains both a near-term trap and a medium-term tailwind. The account argued there are “hundreds of billions of dollars tied into the yen carry trade,” meaning abrupt yen strength can force deleveraging in the very assets, stocks and crypto, funded with cheap yen borrowing.
As an example, the account pointed to August 2024, claiming a small BoJ rate hike pushed the yen higher and “Bitcoin crashed from $64K to $49K in six days,” with crypto losing “$600B in value.” Bull Theory framed that episode as the template for the “catch” in 2026: yen strength can be toxic in the first act, even if sustained dollar weakness ultimately improves the liquidity backdrop for Bitcoin.
LondonCryptoClub (@LDNCryptoClub) leaned into that lagged-liquidity framing, arguing that a weaker dollar tends to filter into risk assets with a delay, while also introducing an additional US liquidity variable. “Continued and accelerated breakdown of the dollar will be good for Bitcoin and broad risk over the next few months,” the account wrote, adding that the dollar “tends to act with a 3 months lag” outside of “knee jerk reactions.” It also warned that a potential US government shutdown and subsequent Treasury General Account rebuild could offset some of the positive liquidity impulse.
Bitcoin is again near another critical on-chain inflection point as a key profitability indicator goes back to the levels that last occurred during one of the most painful downtrends in the history of the market.
CryptoQuant analyst Adler AM data shows that the Net Realized Profit and Loss of Bitcoin has dropped by approximately 97% after it achieved its recent high and is now approaching the levels of near-zero territory.
The situation is similar to those observed in June 2022 before BTC plummeted from about 30,000 to almost 16,000.
Net Realized P/L has dropped by 97% and returned to zero. The last time this happened was in June 2022 – right before the drop from $30K to $16K. Whales are still in profit (a 25-80% buffer), so there is no panic yet. But the market is being supported not by buyers – but by the… pic.twitter.com/ooQsnaGTCA
Net Realized P/L tracks the balance between realized profits and losses on the Bitcoin network based on on-chain cost basis. Positive readings signal dominant profit-taking, while negative values reflect loss-driven selling.
Readings near zero suggest trades are occurring close to cost basis, indicating profit exhaustion and a balance between buyers and sellers.
Bitcoin Selling Pressure Fades, but Buyers Stay on the Sidelines
The analyst pointed out that the current setup resembles the period just before Bitcoin’s main capitulation leg in 2022. In late 2024 and early 2025, Net Realized P/L surged above $1.5 billion, reflecting an overheated profit-taking phase.
By January 26, 2026, that figure had collapsed to roughly $60 million, effectively flattening at the zero line. In 2022, a similar return to zero did not mark a bottom.
Instead, the metric continued lower into deeply negative territory, falling to around minus $350 million as the price slid another 50%.
Adler noted that the present zero reading should not be interpreted as a bullish reversal signal. Instead, it represents a pause where selling pressure from profit-takers has largely dried up, but fresh demand has not stepped in.
On-chain data suggests the market is currently being supported more by the absence of sellers than by strong buying interest, a fragile equilibrium that has historically broken lower during risk-off environments.
Despite the warning signals, large Bitcoin holders remain in profit, as realized price data segmented by balance size shows that all major whale cohorts are still comfortably above their average acquisition costs.
Holders with balances between 100 and 1,000 BTC have the highest realized price, near $69,900, giving them an estimated profit buffer of about 25% at current prices.
Other large cohorts, including wallets holding 10–100 BTC and those with more than 10,000 BTC, have average entry prices closer to $48,000 and $51,000, translating to unrealized gains of 70% to 80%.
This helps explain the lack of panic selling, even as price has pulled back sharply from recent highs.
Bitcoin Slips Below $88K as Volatility Picks Up
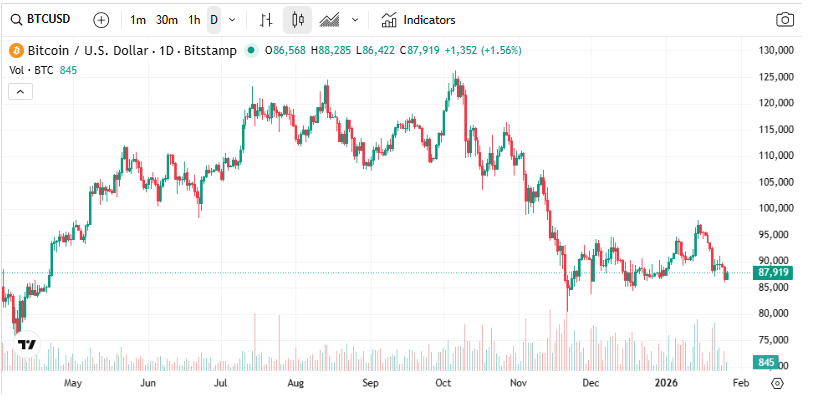
At the time of writing, Bitcoin was priced at approximately $87,756, having fallen by approximately 1.1% in the last 24 hours and 5.7% in the last week.
Trading volume, however, surged more than 160% day over day to $53.1 billion, pointing to heightened activity as traders reposition amid volatility.
Macro pressure has contributed to the discomfort because U.S. President Donald Trump threatened to impose 100% tariffs on any Canadian products in case Ottawa strengthens trade relations with China, and the rumors of a potential American government shutdown resurfaced.
The move triggered more than $320 million in liquidations of leveraged long positions in a matter of hours.
Digital asset investment products saw sharp outflows last week, with investors pulling $1.73B — the largest weekly decline since mid-November 2025, according to CoinShares.#BTC#ETPshttps://t.co/2ni4w83evG
Gold shone brightly today, racing to a new high while crypto took the back seat, and the gap between the two assets opened wide.
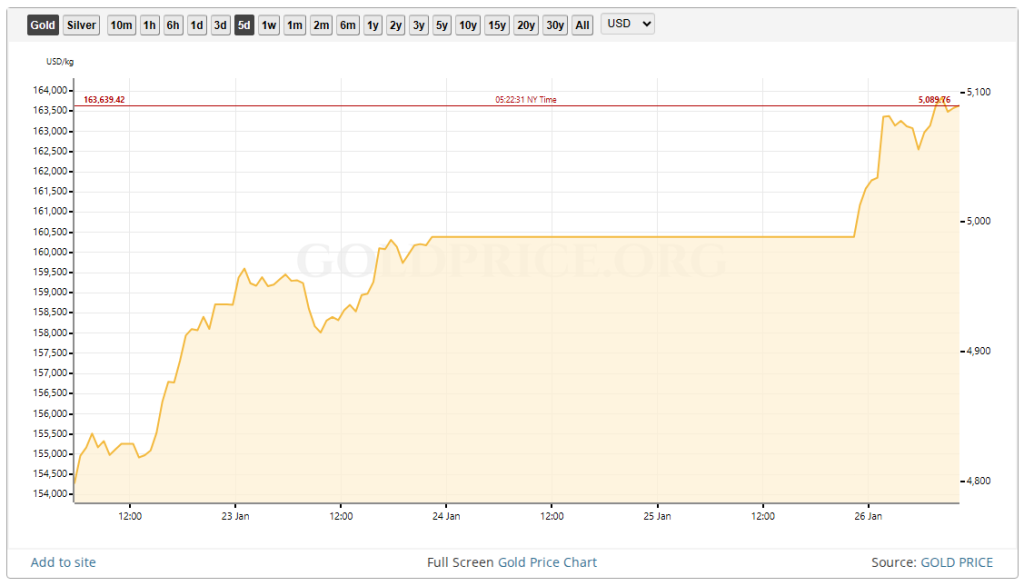
On Monday, the precious metal moved past the $5,000 mark, registering a price point market sentinels had not witnessed before. Bitcoin, by contrast, failed to keep pace and traded well below its recent highs.
Gold Hits Record Levels
Safe-haven demand pushed gold sharply higher. Prices were up above $5k an ounce and inked roughly $5,110 at the peak. Silver, for its part, did not go unnoticed, jumping to fresh peaks near $107/ounce.
Traders pointed to simmering geopolitical friction and talk of tougher trade moves led by US President Donald Trump as fuel for the rally.
A weaker greenback made metals more attractive to customers overseas, and central bank buying provided steady backing. Liquidity in some corners were thin as investors rushed to shift cash into things that feel stable when risk elevates.
Bitcoin Falls Behind
Market numbers show Bitcoin hovering in the mid-$80,000s range, retreating from peaks seen late last year. Reports note the alpha crypto is roughly 30% below the highest level it hit reached in October 2025, leaving some holders quite jittery.
Volatility was another factor. Where bullion is being sought for safety, Bitcoin is viewed more as a growth or speculative play, and that difference in investor application becomes clear when markets tighten. Some funds slashed their crypto exposure, signaling a short reroute away from high-risk gambits.
Why Investors Are Shifting
Analysts and traders described a simple choice: shelter or swing for gains. When headlines push worry, money flows into assets that are widely trusted across markets and governments.
Metals fit that ticket. Based on market chatter, fears of a US government funding clash and fresh tariff announcements stacked pressure on stocks and added a sense of urgency to safe-haven acquisition.
Options and futures trading hinted at a more cautious perpective, with volatility indexes rising and bond yields behaving in ways that made the yellow metal look more appealing by comparison.
What Traders Are Watching
Market watchers said eyes will be glued on a few key metrics: The dollar’s path, moves by major central banks, and any sign that US politics escalates could keep metals elevated.
For Bitcoin, network activity, large wallet flows, and regulatory headlines will likely set the tone. Some traders expect swings both ways. Others caution that when risk appetite is back, crypto may bounce hard, but that outcome is not a sure thing and will be dependent on a string of policy and macro moves.
Featured image from Unsplash, chart from TradingView
Over the weekend, volatility observed across the broader cryptocurrency market intensified, causing the price of Bitcoin to fall back to the $86,000 mark once again. Even with the bearish price action in the past few days, buying activity continues to pick up pace in the market, especially among large BTC holders.
Bitcoin’s Largest Wallets Show Conviction
Bitcoin’s price may have been struggling with heightened volatility as a result of the broader market bearish market action, but bullish sentiment remains present among investors. In the weakening condition, large BTC whales or deep-pocket investors’ sentiment turns positive and are steadily reentering the market.
Data from Santiment, a popular market intelligence and on-chain data platform, suggests that these major investors are building positions at an encouraging and steady pace, even though the broader momentum is demonstrating weakening conditions. In the past, long-term whale accumulation has typically happened in uncertain times when prices don’t accurately reflect underlying confidence.
Santiment noted that the buying activity is spotted among wallet addresses holding over 1,000 BTC. After months of consistent buying, the group has now collectively acquired about 104,340 BTC, which represents a more than 1.5% rise.
As a result of the recent purchase, the investors’ overall holdings are currently sitting at 7.17 million BTC, marking their largest level since September 15, 2025. These wealthy investors are subtly consuming available supplies rather than distributing into recent market swings, indicating confidence in Bitcoin’s medium- to long-term potential.
While buying pressure is growing among large Bitcoin holders, the number of whale transactions has also experienced a massive upswing. Santiment added that the amount of +$1 million daily transfers has exploded, reaching a 2-month high level.
A Continued Drop In BTC Open Interest
A continued drop in Bitcoin’s Open Interest is coinciding with the ongoing drop in price. Darkfost, a market expert and CryptoQuant author, highlighted that open interest is steadily declining, which does not support the emergence of a new trend as seen on the weekly change basis.
Since November, the metric has remained broadly negative, suggesting that the drop has continued for several weeks. Although there was a brief improvement earlier this month, it was followed by a price reaction.
Overall, when open interest rises, Darkfost stated that it mostly signals trend continuation to even a trend reversal, triggered by an influx of long positions. Furthermore, this is confirmed with funding rates, but this is what happens in most cases.
On Sunday, as BTC displays a steady correction, deleveraging also increased. While this is bearish in the short term, these phases simultaneously aid in cleaning the market of excessive leverage. Thus, it is critical to remember that futures are still the primary source of volume, making keeping an eye on developments there an essential move.
Bitcoin is trading near $87,700, down about 1% on the day, yet Robert Kiyosaki remains unmoved by short-term price swings. The Rich Dad Poor Dad author says he continues buying Bitcoin and Ethereum regardless of volatility, arguing that price matters less than the direction of the global financial system.
In a recent post, Kiyosaki pointed to two forces shaping his strategy: the rising US national debt, now above $38.4 trillion, and the steady erosion of the dollar’s purchasing power. From his perspective, daily price movements are a distraction.
As debt expands and deficits deepen, scarce assets gain relevance. As he put it bluntly, he does not worry about market fluctuations because “the national debt keeps going up and the purchasing power of the US dollar keeps going down.”
Q: Do I care when the price of gold silver or Bitcoin go up or down?
A: No. I do not care.
Q: Why Not?
A: Because I know the national debt of the US keeps going up and the purchasing power of the US dollar keeps going down.
That logic explains why Kiyosaki groups Bitcoin with gold and silver, often referring to BTC as “digital gold.” While he has long favored physical metals, he now sees Bitcoin and Ethereum as modern extensions of the same hedge against monetary dilution. His long-term outlook remains bold, with Bitcoin potentially reaching $1 million over the coming years or decade.
Institutional Credibility Weakens as Investors Seek Bitcoin Hedges
Kiyosaki’s stance reflects deep skepticism toward traditional financial authorities. He has repeatedly criticized institutions such as the Federal Reserve and the US Treasury, arguing that policy decisions have fueled debt growth rather than long-term stability.
This view aligns with a broader investor shift. As inflation pressures, rising interest costs, and geopolitical uncertainty persist, capital has increasingly moved toward assets outside the traditional financial system. Bitcoin’s fixed supply of 21 million coins, with more than 19.98 million already in circulation, continues to attract investors who see scarcity as protection rather than speculation.
Bitcoin Price Prediction: $87K Base Forms as Trendlines Hint at a Springboard Move
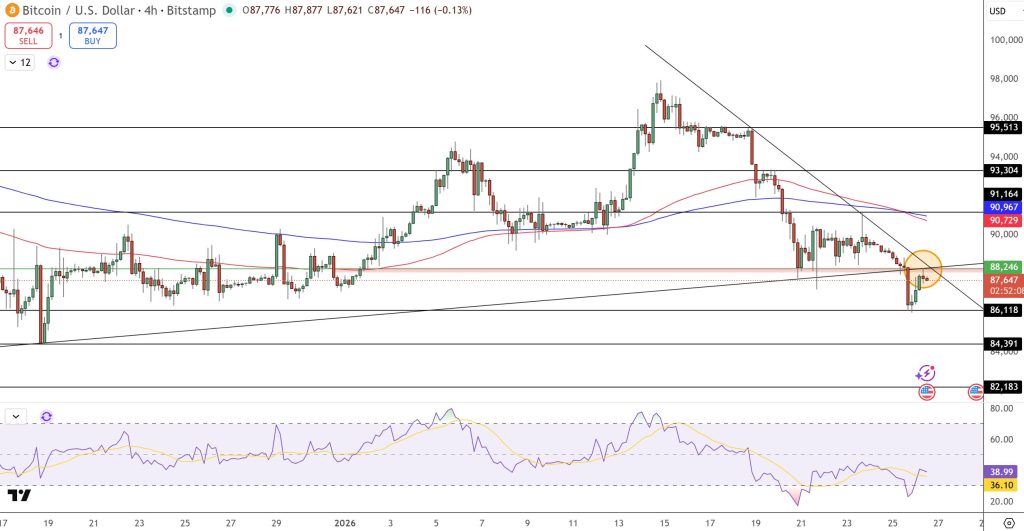
While the long-term narrative remains intact, Bitcoin’s short-term chart sits at a critical junction. After pulling back from the $95,500–$96,000 zone, BTC is consolidating between $86,000 and $88,000, an area where multiple technical levels converge.
On the 4-hour chart, price is pressing against the lower boundary of a descending wedge while still respecting a rising long-term support line that has guided the broader uptrend since late 2025. Recent candles near $86,100 show long lower wicks, suggesting dip-buying rather than forced liquidation.
BTC/USD Price Chart – Source: Tradingview
Momentum remains soft, with RSI hovering near 39–40, but it has begun to turn higher. A sustained hold above $88,000 would open a path toward $90,700 and $93,300, with a potential retest of $95,500. A break below $86,000 would delay that recovery and expose $84,300, without undermining the broader structure.
Taken together, Kiyosaki’s long-term conviction and Bitcoin’s developing technical base suggest the market is pausing, not peaking. For investors focused beyond short-term noise, this consolidation may be the kind of quiet reset that precedes the next expansion phase.
Bitcoin Hyper: The Next Evolution of BTC on Solana?
Bitcoin Hyper ($HYPER) is bringing a new phase to the BTC ecosystem. While BTC remains the gold standard for security, Bitcoin Hyper adds what it always lacked: Solana-level speed. The result: lightning-fast, low-cost smart contracts, decentralized apps, and even meme coin creation, all secured by Bitcoin.
Audited by Consult, the project emphasizes trust and scalability as adoption builds. And momentum is already strong. The presale has surpassed $31 million, with tokens priced at just $0.013635 before the next increase.
As Bitcoin activity climbs and demand for efficient BTC-based apps rises, Bitcoin Hyper stands out as the bridge uniting two of crypto’s biggest ecosystems. If Bitcoin built the foundation, Bitcoin Hyper could make it fast, flexible, and fun again.
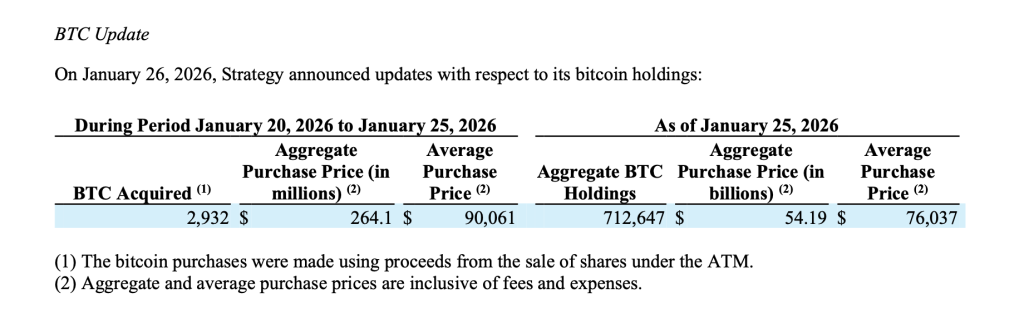
Michael Saylor’s Strategy has expanded its Bitcoin treasury again, acquiring an additional 2,932 BTC for approximately $264.1 million during the period from Jan. 20 to Jan. 25.
Strategy has acquired 2,932 BTC for ~$264.1 million at ~$90,061 per bitcoin. As of 1/25/2026, we hodl 712,647 $BTC acquired for ~$54.19 billion at ~$76,037 per bitcoin. $MSTR$STRChttps://t.co/RooLfEvniX
The company disclosed that the purchases were made at an average price of $90,061 per Bitcoin, inclusive of fees and expenses.
The update reinforces Strategy’s position as the largest corporate holder of Bitcoin globally, continuing its multi-year accumulation strategy that has become central to its balance sheet approach.
Total Bitcoin Holdings Reach 712,647 BTC
Following the latest acquisition, Strategy reported that it now holds a total of 712,647 BTC as of Jan. 25.
The company said its aggregate Bitcoin purchases total roughly $54.19 billion, with an average acquisition price of $76,037 per Bitcoin. The figures show the scale of Strategy’s long-term bet on Bitcoin as a treasury reserve asset, accumulated across multiple market cycles.
Strategy’s growing holdings show its belief that Bitcoin represents a superior store of value over time, particularly amid concerns around currency debasement and global macro uncertainty.
Purchases Funded Through Share Sales Under ATM Program
Strategy disclosed that the recent Bitcoin purchases were funded through proceeds generated from the sale of shares under its at-the-market offering program.
During the Jan. 20–25 period, the company sold approximately 1.57 million shares of its Class A common stock, generating net proceeds of about $257 million. Strategy also issued roughly 70,201 shares of its variable rate preferred stock, raising an additional $7 million.
In total, the company generated about $264 million in net proceeds, which were then deployed toward Bitcoin accumulation.
The disclosure also shows that Strategy retains major remaining capacity for future issuances, including billions of dollars available across multiple stock and preferred equity programs.
Corporate Bitcoin Accumulation Continues Into 2026
Strategy’s continued purchases come as institutional adoption of Bitcoin remains a major theme entering 2026, with more companies exploring crypto as a long-term balance sheet asset.
The firm has consistently framed Bitcoin as a scarce, inflation-resistant reserve that can outperform cash and traditional holdings over extended time horizons. While the strategy remains controversial due to Bitcoin’s volatility, Strategy has maintained its commitment to accumulation even during periods of market weakness.
With over 712,000 BTC now on its balance sheet, Strategy’s exposure to Bitcoin price movements is unmatched among public companies, making it a key bellwether for corporate crypto adoption.
As the company continues leveraging equity issuance to fund purchases, investors will closely watch how its aggressive treasury strategy evolves alongside broader market conditions in 2026.
Crypto analyst Darkfost has highlighted reasons why the XRP price could soon witness a bullish reversal and potentially reach new local highs. This comes amid bearish sentiment in the market, which on-chain analytics platform Santiment said could set the stage for a reversal in the altcoin’s price.
Why The XRP Price Could Soon See A Bullish Reversal
In a CryptoQuant blog post, Darkfost stated that negative funding rates signal a potential XRP price reversal. The analyst noted that the altcoin is currently trading around 47% below its all-time high (ATH) set in July last year. Furthermore, the altcoin is said to have naturally entered a phase of distribution and correction after a gain of over 600% since November 2024.
Darkfost assured that this type of movement is healthy after such a strong rally for the price. He further remarked that what stands out is the timing of the bearish consensus, as it did not form at the top but rather during a drawdown of more than 50%. Now, there are predominantly short positions on XRP, with funding rates on Binance mostly negative since December, indicating that leveraged short positions have the upper hand.
The analyst noted that historically, the market tends to move against a late consensus. As such, while the accumulation of shorts creates short-term selling pressure, it also builds latent buying pressure. Darkfost said that if the XRP price starts to rise, these short positions could be liquidated, fueling the upward move.
He revealed that a similar pattern has occurred for the token price since 2024. The first was between August and September 2024, and the second was during the April 2025 correction, when funding rates turned negative for a period before a bullish rebound occurred. The analyst stated that this price rebound was due to a shift in investor sentiment and funding rates returning to positive territory.
A Rally Starter For XRP
In an X post, Santiment stated that XRP traders are showing major FUD, which they claimed is usually a rally starter for the XRP price. The on-chain analytics platform revealed that the altcoin has fallen into ‘Extreme Fear’ territory, with small retail traders becoming pessimistic about the token after a 19% decline from its recent high on January 5th.
Santiment noted that historically, this level of bearish commentary has led to price rallies. This is based on the belief that prices move in the opposite direction to retail’s expectations more often than not. The altcoin has dropped again following the recent decline in the broader crypto market, led by Bitcoin. BTC fell below $87,000 yesterday on the back of U.S. political tensions, government shutdown risk, and ahead of this week’s FOMC meeting.
At the time of writing, the XRP price is trading at around $1.88, down in the last 24 hours, according to data from CoinMarketCap.
Bitcoin proxy Strategy announced Monday that it acquired an additional 2,932 bitcoin for approximately $264 million between Jan. 20 and Jan. 25, according to a filing with the U.S. Securities and Exchange Commission.
The purchases were executed at an average price of $90,061 per coin, lifting the company’s total bitcoin holdings to 712,647 BTC.
At current market prices, Strategy’s bitcoin treasury is valued at roughly $62.5 billion, reinforcing its position as the world’s largest publicly traded corporate holder of the asset.
The company’s aggregate purchase price for its holdings stands at approximately $54.2 billion, including fees and expenses, translating to an average acquisition price of $76,037 per bitcoin.
The latest purchases were funded through proceeds generated under Strategy’s at-the-market (ATM) offering program. According to the filing, the firm sold 1,569,770 shares of its Class A common stock, MSTR, for approximately $257 million in net proceeds during the five-day period.
It also sold 70,201 shares of its perpetual preferred stock, STRC, raising an additional $7 million, bringing total ATM proceeds to roughly $264 million.
As of Jan. 25, Strategy said it still has substantial capacity remaining across its ATM programs, including approximately $8.17 billion available for future issuance under its common stock offering. The company also maintains multiple preferred stock programs, including STRK, STRF, STRC and STRD, which collectively represent tens of billions of dollars in potential future capital raises.
With more than 712,000 BTC now on its balance sheet, Strategy controls roughly 3.4% of bitcoin’s fixed 21 million supply.
At current prices, the company is sitting on an estimated $8.3 billion in unrealized gains.
Strategy’s MSCI inclusion
Earlier this month, Strategy was relieved of some selling pressure when MSCI concluded its review of digital asset treasury companies and decided not to exclude them from its major global equity indexes.
The index provider said bitcoin-heavy firms will remain eligible under existing rules while it conducts further research on how to distinguish operating companies from investment-like entities.
The decision eased months of market anxiety after MSCI had proposed reclassifying companies with more than 50% of assets in digital assets as fund-like and therefore ineligible for inclusion.
Companies like Strategy, along with industry groups, pushed back strongly, warning that exclusions could trigger billions of dollars in forced passive selling.
At the time of writing, Bitcoin is trading near $89,000.
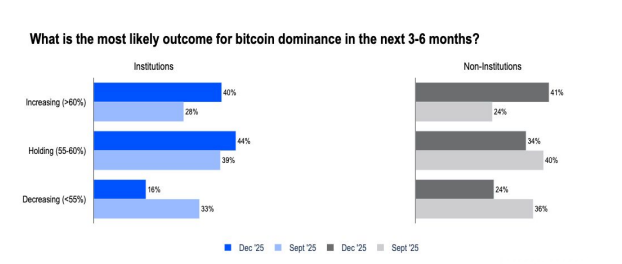
Most institutional investors remain bullish on Bitcoin despite brutal fourth-quarter volatility that erased nearly a third of the asset’s value from recent peaks.
A new Coinbase Institutional and Glassnode survey found 70% of institutions view BTC as undervalued, even after the token dropped from above $125,000 in early October 2025 to trade around $90,000 by year-end, while 60% of non-institutional investors share that conviction.
Source: Coinbase Institutional
The findings come from a quarterly poll of 148 global investors, split between 75 institutions and 73 non-institutions, conducted between December 10, 2025, and January 12, 2026.
Despite the October liquidation event that shook altcoin markets and compressed leverage across derivatives platforms, most respondents held or added to crypto positions rather than retreating.
Around 62% of institutions and 70% of non-institutions either maintained existing allocations or increased net long exposure since October.
Source: Coinbase Institutional
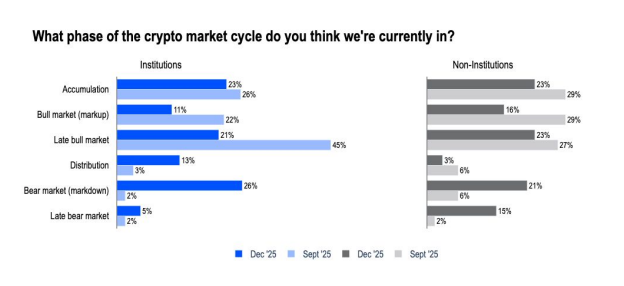
Bearish Sentiment Rises, But Doesn’t Dominate Positioning
Perceptions of the market cycle shifted noticeably during the quarter.
Around 26% of institutions and 21% of non-institutions now believe crypto has entered the bear-market markdown phase, up sharply from just 2% and 7%, respectively, in the prior survey.
Source: Coinbase Institutional
That shift exposes the weight of October’s deleveraging event, which saw the Altcoin Season Index plummet and mid-cap tokens struggle to recover their third-quarter gains despite the launch of several spot altcoin ETFs in the US.
Still, the uptick in bearish views did not translate into widespread selling. Most investors stuck with their positions, and sentiment toward Bitcoin specifically remained constructive.
“We have a constructive view for 1Q26,” Coinbase Global Head of Research David Duong wrote in the report. “We believe that crypto markets are entering 2026 in a healthier state, with excess leverage having been flushed from the system in Q4.“
Bitcoin dominance held relatively steady through the turbulence, rising only marginally from 58% to 59% over the quarter, a sign that institutional capital continued to favor the largest digital asset even as smaller tokens faced sustained selling pressure.
Source: Coinbase Institutional
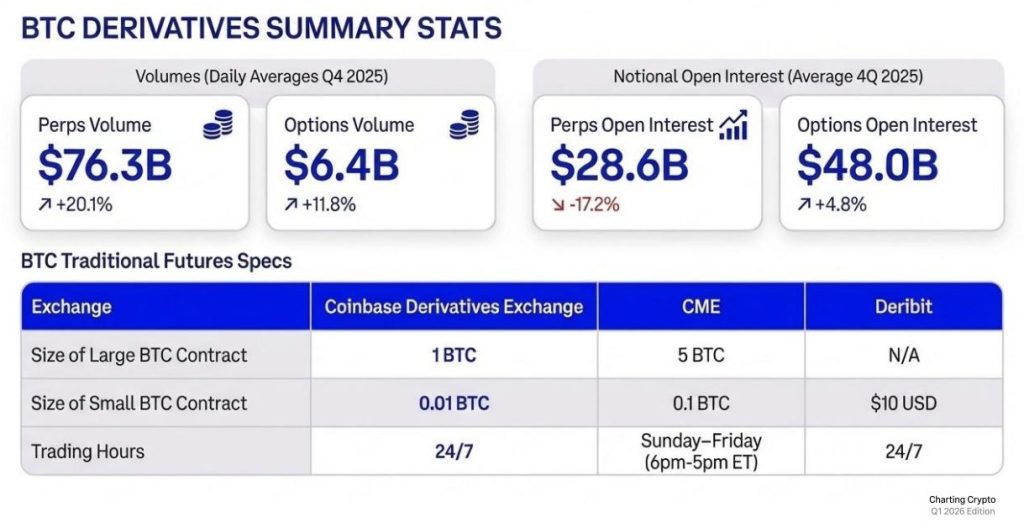
Open interest in BTC options overtook perpetual futures as market participants sought downside protection, with the 25-day put-call skew staying positive across 30-day, 90-day, and 180-day expiries.
Source: Coinbase Institutional
Coinbase Survey Points to Macro Support and Policy Progress
Several factors underpinned the optimistic outlook. Inflation held steady at 2.7% in December’s Consumer Price Index reading, and the Atlanta Fed’s GDPNow model projected robust 5.3% real GDP growth for the fourth quarter as of January 14.
While the future direction of monetary policy remained uncertain, Duong said the firm still expects the Federal Reserve to deliver two rate cuts totaling 50 basis points currently priced into Fed funds futures, “which should provide a tailwind for risk assets broadly and crypto specifically.“
Questions about comprehensive crypto market structure legislation persist, but confidence in eventual regulatory clarity stayed firm.
“We’re confident that we will eventually see a set of rules that allows the industry to reach its full potential,” the report stated, noting that major policy progress in the US, particularly around the proposed CLARITY Act, could boost investor sentiment further.
Beyond the survey, separate data shows institutional engagement deepening across channels.
Similarly, a separate Coinbase survey found that younger US investors now allocate 25% of their portfolios to non-traditional assets, compared with 8% among older cohorts.
Risks Remain, But Long-Term Trajectory Holds
The Coinbase report acknowledged headwinds. While the economy appears solid, the jobs market cooled in 2025, with the US adding just 584,000 positions, down from 2 million in 2024, partly due to increased AI adoption.
Geopolitical tensions have flared in several regions, and any escalation that disrupts energy markets could dampen investor appetite.
“A meaningful uptick in inflation, a spike in energy prices, or a significant flare up of geopolitical tensions could warrant a more cautious approach to risk assets,” the report warned.
Still, onchain metrics improved after October’s shakeout. Bitcoin supply moved within three months, surged 37% in the fourth quarter, while coins unmoved for over a year fell 2%, indicating short-term distribution that likely cleared weaker hands.
Source: Coinbase Institutional
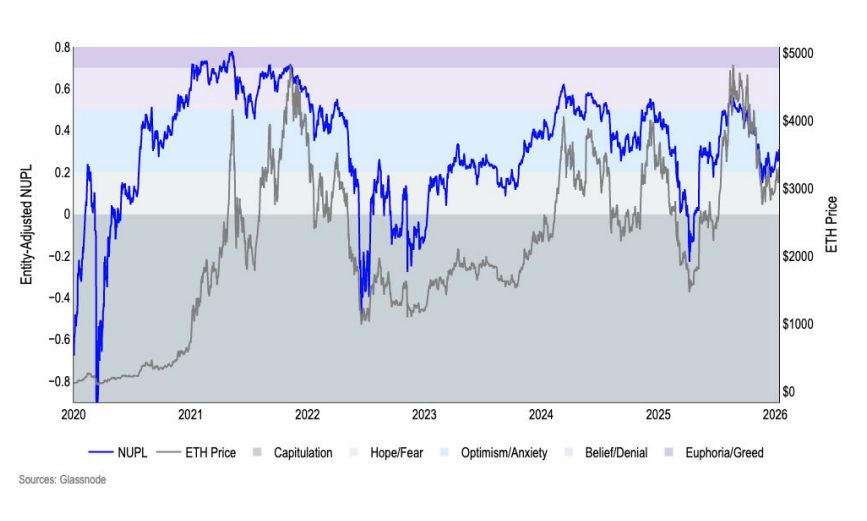
Ethereum’s Net Unrealized Profit/Loss ratio swung sharply through 2025, hitting capitulation in the first quarter, then rising to optimism in the third quarter, and settling back into fear territory by year-end.
The crypto market is down today again. The cryptocurrency market capitalisation decreased by 0.8% over the past 24 hours, now standing at $3.05 trillion. At the time of writing, 93 of the top 100 coins recorded price drops. The total crypto trading volume stands at $139 billion.
TLDR:
Crypto market cap is down 0.8% on Monday morning (UTC);
93 of the top 100 coins and all top 10 coins are down;
BTC decreased by 0.7% to $87,860 and ETH fell by 1.5% to $2,89;
ETH will more likely revisit $2,000 than move above $4,000;
Heightened geopolitical tensions and ongoing conflicts drive volatility across markets;
Macroeconomic developments have influenced risk assets broadly;
Macro uncertainty triggered over $550 million in crypto liquidations;
Larger Bitcoin’s response to recent uncertainty may emerge later;
The UK FCA moved into the final stage of consultations on crypto regulation;
Japan may approve its first set of spot crypto ETFs as early as 2028;
US spot BTC and ETH ETFs saw $103.57 million and $41.74 million in outflows, respectively;
Crypto market sentiment continued falling within the fear zone.
Crypto Winners & Losers
We started the new week very much in the red. As of Monday morning (UTC), all top 10 coins per market capitalisation have posted price drops over the past 24 hours.
Bitcoin (BTC) fell by 0.7%, currently trading at $87,860. This is the smallest drop on the list,
Bitcoin (BTC)
24h7d30d1yAll time
Ethereum (ETH) decreased by 1.5%, changing hands at $2,892.
The highest fall among the top 10 is Solana (SOL)’s 3.3% to the price of $122.
It’s followed by Dogecoin (DOGE)’s drop of 1.6%, now trading at $0.1213.
At the same time, Tron (TRX)fell the least: 0.4% to $0.2953.
Moreover, of the top 100 coins per market cap, 93 have seen their price drop today.
MYX Finance (MYX) fell the most. It’s down 14%, now trading at $5.86.
Monero (XMR) follows, with a decrease of 5.4%, currently standing at $466.
Of the green coins, River (RIVER)stands at the top, having jumped by 43% to the price of $84.7.
The next on the list is Algorand (ALGO), which saw an increase of 2.3% to $0.1189.
QCP analysis notes that crypto assets traded in a narrow range over the weekend before coming under pressure in early Asian hours, triggering over $550 million in leveraged long liquidations. BTC briefly tested $86K before finding support, while Ethereum fell to the $2,785 area.…
Meanwhile, the UK’s Financial Conduct Authority (FCA) moved into the final stage of consultations on a set of proposed crypto regulations. The FCA said it is seeking feedback on 10 proposed rules, describing this as the “final step” in the consultation process.
“These proposals continue our progress towards an open, sustainable and competitive crypto market that people can trust,” the regulator said.
BREAKING: The UK Just Moved to Fully Integrate Crypto Firms Into the FCA Rulebook pic.twitter.com/mGBJ61hLLB
Gadi Chait, Investment Manager at Xapo Bank, commented that recent weakness in Bitcoin follows a brief recovery last week, “set against a backdrop of macroeconomic developments that have influenced risk assets broadly.”
A convergence of factors drives volatility across markets. These include heightened geopolitical tensions and ongoing conflicts. Renewed focus on US strategic positioning toward Greenland and Donald Trump’s address at Davos “added to an already unsettled global environment.”
Regulatory uncertainty, especially in the US, and macroeconomic pressures add to this. “Central bank policy divergence, including expectations around further tightening by the Bank of Japan and the continued reduction of liquidity by the US Federal Reserve, continues to shape market behaviour.”
Chait says that, “amid this uncertainty, traditional commodities have rallied, while Bitcoin has underperformed. The reasons for this divergence are not yet clear, though such sequencing across asset classes is not without precedent.”
“It remains possible that Bitcoin’s response emerges later, particularly as volatility subsides. For long-term participants, however, short- to medium-term price fluctuations remain a familiar feature rather than a signal of impaired fundamentals,” Chait concluded.
Moreover, Petr Kozyakov, Co-Founder and CEO at Mercuryo, argued that as a speculative asset, BTC has come under sustained selling pressure, and altcoins have followed suit.
“While the fortunes of the digital asset space will always be viewed through a lens fixated on token prices, the bigger picture is one of continued stablecoin adoption and the steady development of payment infrastructure,” he says.
He continues: “The evolution of the digital token space is being driven by merger and acquisition activity, alongside the inherent efficiencies of blockchain-based technology and its ability to operate around the clock, at speed and at lower cost.”
“This reality is increasingly unavoidable for financial institutions still reliant on technology that dates back to the 1960s. Away from daily price movements, a quiet revolution is most definitely afoot,” Kozyakov concluded.
Levels & Events to Watch Next
At the time of writing on Monday morning, BTC was changing hands at $87,860. While the coin begun the day at the intraday high of $88,800, it relatively swiftly dropped to the low of $86,126. It has recovered somewhat since.
Over the past seven days, BTC decreased by 5.1%, trading in the $86,319–$93,252 range. It’s now 30% away from its all-time high of $126,080.
Failing to hold the current level risks additional pullbacks towards the $85,000 level, followed by $84,300 and $83,800.
Bitcoin Price Chart. Source: TradingView
At the same time, Ethereum was trading at $2,892. Earlier in the day, it traded at the intraday high level of $2,941. However, it then plunged to the intraday low of $2,787. It managed to shift course and move higher following this drop.
In a week, ETH fell 9.2%, moving between $2,801 and $3,222. Moreover, it decreased 41% from its ATH of $4,946.
Currently, the price risks a fall toward $2,670 and $2,520 in the near term.
Ethereum (ETH)
24h7d30d1yAll time
Additionally, according to Bloomberg Intelligence Senior Commodity Strategist Mike McGlone, it is more likely that ETH will revisit the $2,000 level than push upwards and above $4,000.
ETH has been stuck in the $2,000–$4,000 range since 2023. However, it is leaning toward the lower end of this range.
Ether appears to be heading toward the lower end of its $2,000-$4,000 range since 2023. I see greater risks of it staying below $2,000 than above $4,000, especially when stock market volatility rebounds. pic.twitter.com/1IAMV10Jwe
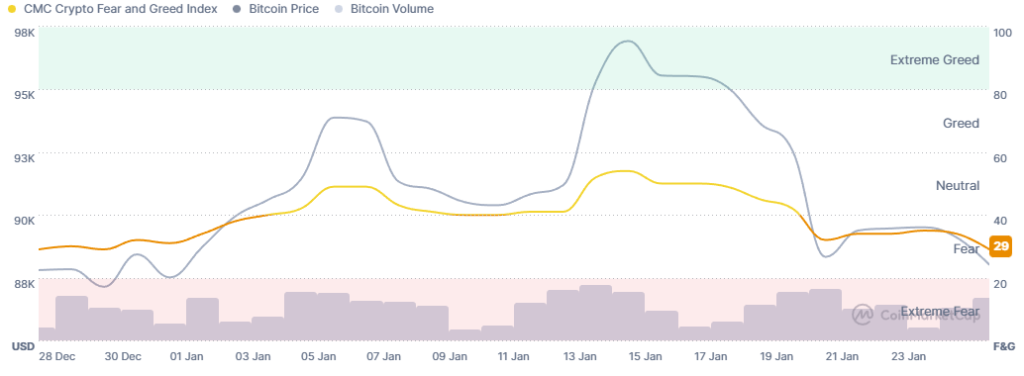
Meanwhile, the crypto market sentiment exited the neutral zone a week ago, and it has continued falling lower within the fear zone since.
The crypto fear and greed index decreased further over the weekend, currently standing at 29, compared to 34 seen over the weekend.
Unsurprisingly, given the market conditions, the sentiment reflects the overall worry and caution. It is now possible that the metric will drop further.
Source: CoinMarketCap
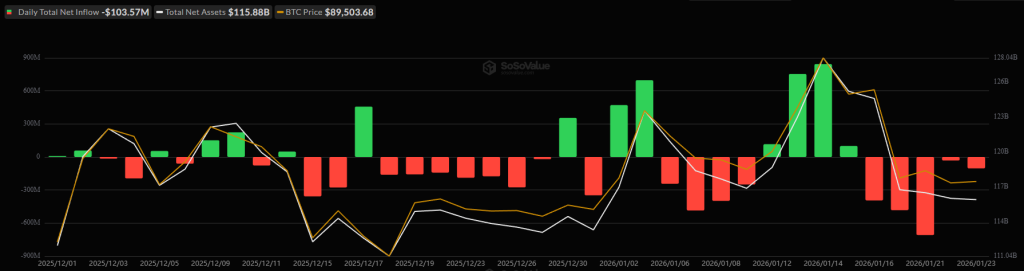
ETFs Continue The Red Streak
The US BTC spot exchange-traded funds (ETFs) posted another day of outflows on Friday, totalling $103.57 million. This is the fifth consecutive day of negative flows.
The total net inflow has pulled back yet again and now stands at $56.49 billion.
Of the twelve ETFs, two recorded outflows, and none saw inflows. BlackRock let go of $101.62 million, and Fidelity followed with $1.95 million in outflows.
Source: SoSoValue
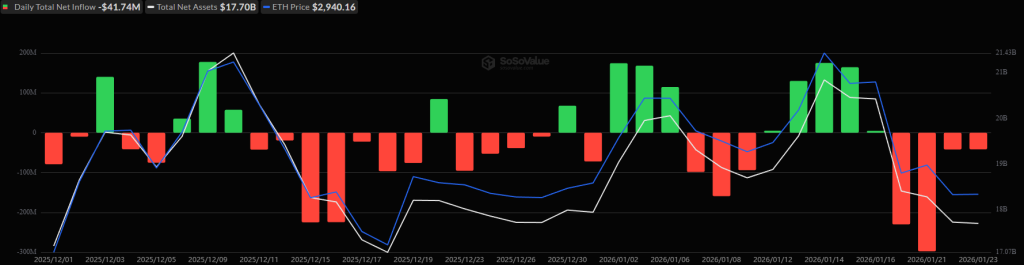
Moreover, the US ETH ETFs posted outflows as well on 22 January, with $41.74 million – a similar level as the day earlier. With this fourth consecutive red day, the total net inflow now stands at $12.3 billion.
Of the nine funds, two ETH ETFs posted outflows, and two saw inflows. BlackRock recorded $44.49 million in outflows, followed by Grayscale’s $10.8 million.
At the same time, Grayscale Mini Trust took in 9.16 million, followed by Fidelity’s $4.4 million in inflows.
The crypto market has seen yet another drop over the past day. Meanwhile, the US stock market closed the week with a mixed picture. That said, it also posted a second consecutive red week. By the closing time on Friday, 23 January, the S&P 500 was up 0.033%, the Nasdaq-100 increased by 0.34%, and the Dow Jones Industrial Average fell by 0.58%. Due to high volatility, investors are shifting their money into safe-haven assets, particularly gold.
Is this drop sustainable?
For now, the drops may continue in the near- to mid-term, pushed by macroeconomic developments. Occasional smaller and brief jumps are expected, intersecting the current trend.
January 2026 has delivered a blunt message to investors: the playbook has changed. Gold is trading above $5,000 an ounce for the first time. Bitcoin is stuck below $88,000 and cannot hold the $90,000 level it briefly reclaimed. This gap is not just a weird market moment. It looks like a reset in how capital behaves when geopolitics heats up, and policy direction gets messy.
The numbers underline the shift. Gold rose 64% in 2025 and is already up more than 17% in the first weeks of 2026. Bitcoin, meanwhile, sits roughly 11% below its December 2024 all-time high near $108,000. Over one weekend in late January, total crypto market cap dropped by about $56 billion to roughly $2.92 trillion. This is not random noise. It reflects two different investor instincts playing out in real time.
The Safe-Haven Rush: Why Gold Owns the Narrative Right Now
Gold’s run is not coming from one single driver. It is coming from several forces stacking on top of each other.
Central banks, especially in emerging markets, have been buying gold at a pace that looks more like crisis-era behavior than normal reserve management. ETF inflows have reinforced that demand. Retail and institutions are doing the same thing for the same reason: they want a hedge against currency risk, policy mistakes, and the kind of uncertainty that makes investors second-guess everything.
The geopolitical backdrop is not helping. Trade tensions have moved from headlines into concrete threats and real negotiation pressure. President Donald Trump’s administration has floated 100% tariffs on Canadian goods tied to China-related trade developments, plus potential 200% levies on French wines and champagne. That kind of language changes behavior fast because markets do not wait for policy to become law. They price the risk now.
Currency markets are reflecting the same mood. The Japanese yen strengthened to 153.89 per dollar, its strongest level since November 2025, as traders speculated about possible coordination between U.S. and Japanese authorities. Japan’s top currency diplomat kept timing vague, which tends to make uncertainty worse, not better. The euro pushed to a four-month high near $1.1898 as traders cut dollar exposure ahead of the Fed’s next signals and the possibility of new leadership chatter.
These moves matter because they signal something deeper than FX positioning. They suggest investors are questioning stability and coordination at the top of the global monetary system. When people get nervous about reserve currencies, they often reach for gold. Gold does not pay yield. It does not grow cash flow. It holds value because it still functions as a trust asset when confidence in other systems starts to wobble.
History helps frame the moment. In 2008, gold climbed from roughly $800 to about $1,900 by 2011 as central banks flooded the system with stimulus. In 2020, gold hit new highs above $2,000 during peak pandemic fear. This rally is bigger in both percentage terms and absolute levels, which suggests the market is pricing something more structural than a single shock.
Bitcoin’s Reality Check: Why “Digital Gold” Is Not Acting Like Gold
Bitcoin has spent years carrying the “digital gold” label. This month has exposed how fragile that comparison can be when stress hits.
Gold is absorbing defensive flows. Bitcoin is absorbing selling from people who bought higher and now want out. That difference matters because it changes how rallies behave. When gold rallies in a risk-off environment, it often pulls in more buyers. When Bitcoin rallies in the same environment, it often runs into sellers looking to exit.
Technically, Bitcoin has been trapped in a structure that has not offered easy upside. Price action has struggled around $87,619 after losing $90,000 during weekend trading. Support sits around $84,698 with resistance near $89,241. If support fails, downside pressure toward $84,000 becomes the obvious target. If resistance holds, $90,000 stays a psychological ceiling rather than a launchpad.
More important than the chart is the behavior underneath it. CryptoQuant data shows Bitcoin holders selling at a loss for the first time since October 2023. That is a shift in tone. In strong bull phases, holders usually ride volatility because they expect higher prices ahead. When people start locking in losses, they are not thinking in bull-market terms. They are managing pain and uncertainty.
Glassnode analysis adds another problem: a heavy supply overhang above $100,000. Many holders are sitting in positions bought between current levels and six figures. When price approaches their entry zones, they sell to break even or limit damage. That creates a supply wall that is hard to clear without fresh demand and strong momentum.
This is not how Bitcoin behaved in 2020 to 2021. Back then, conviction and institutional narratives pushed price from $10,000 to $69,000 in about a year. Today’s structure feels more like rotation and digestion than acceleration. Futures volumes are compressed. Leverage is subdued. Traders are not leaning into upside the way they do when they truly believe the move is imminent.
Prediction markets reflect the change in psychology. Polymarket odds have shown more confidence in gold holding above $5,500 through mid-year than Bitcoin setting new highs over the same window. That is the opposite of the mood in late 2024 when crypto optimism ran hot after Bitcoin crossed $100,000.
The deeper takeaway is uncomfortable for some investors: Bitcoin is not acting like a safe haven right now. It is acting like a high-volatility asset that depends on liquidity, confidence, and risk appetite. That does not kill the long-term thesis, but it changes how investors should frame it in the short term.
Altcoins Under Stress: What Happens When Speculation Hits a Wall
Bitcoin’s weakness looks mild compared to what is happening in altcoins.
Kaia (KAIA) is a clean example. It fell nearly 20% in 24 hours to around $0.0762 after breaking support near $0.0797 and briefly dipping below $0.0721. It held above its 50-day EMA, which offers some technical comfort, but the drop shows how fast liquidity disappears when sentiment cracks.
Altcoins are built for leverage to mood. In bull phases, capital moves from Bitcoin into Ethereum, then into larger alts, then into smaller speculative tokens as investors chase bigger multiples. In corrections, the flow reverses and the weakest assets get hit first. That creates a brutal reality: altcoins can look unstoppable on the way up and untradeable on the way down.
Ethereum has not offered much shelter either. Ether traded near $2,867 in late January, down 2.6% while Bitcoin fell 1.3%. That underperformance signals that investors are not rotating into higher-beta crypto exposure. Thin spot volume and muted derivatives activity support the same conclusion.
The question now is whether this is a pause before another risk cycle or a deeper structural shift. Several factors argue for caution. U.S. regulation is moving, but it still has open questions around token classification and how securities law will apply. Japan may approve crypto ETFs by 2028, with firms like Nomura and SBI expected to launch products on the Tokyo Stock Exchange, but a two-year timeline does not help the next few months.
There is also a credibility problem. Reports of a U.S.-linked crypto theft scandal involving alleged misuse of access to seizure wallets have rattled confidence. ZachXBT has traced funds linked to thefts spanning 2024 and 2025. Incidents like this do not just hurt sentiment for a week. They raise uncomfortable questions about custody, oversight, and the real-world weak points in the ecosystem.
What Institutions Are Actually Doing Right Now
Retail narratives dominate crypto chatter, but institutional behavior usually tells the cleaner story.
Central banks are voting with their balance sheets, and they are choosing gold. Many of them are not willing, or not able, to justify holding an asset that can drop 15% in a week. Their gold buying creates a steady baseline bid that crypto does not have.
Hedge funds and family offices have also turned cautious. Leverage in crypto derivatives remains compressed compared to peak cycles. Open interest in Bitcoin futures exists, but it has not expanded in the way you would expect if large players were building a new bullish stance.
Corporate treasury adoption has not restarted in a meaningful way. During 2020 to 2021, it was easier to sell boards on Bitcoin exposure because liquidity was abundant and narratives were clean. Today, when gold is up 17% year-to-date and Bitcoin is chopping sideways, that boardroom pitch becomes harder.
Pension funds and sovereign wealth funds remain mostly on the sidelines. They move slowly and demand strong regulatory certainty. The U.S. may get there, but it is not there yet.
Right now, institutional money looks like it is waiting, not charging in. That is the simplest read, and it matters because those investors have the best access to research, infrastructure, and policy visibility.
The Fed Variable: Why This Week Can Move Everything
The late-January Federal Reserve meeting matters more than people want to admit. Not because the market expects a surprise rate hike or cut, but because guidance sets tone and liquidity expectations.
If the Fed signals confidence that inflation is easing and hints at future cuts, risk assets usually respond well. Lower rates reduce the opportunity cost of holding gold, and they tend to weaken the dollar, which supports commodity pricing. Crypto would benefit too, mostly through improved liquidity and renewed risk appetite.
If the Fed stays hawkish and emphasizes inflation risk, the market hears “higher for longer.” That hurts speculation. It also pressures gold through higher real yields, though safe-haven demand can sometimes overpower yield dynamics when fear becomes the bigger driver.
Politics adds another layer. Trump has criticized Jerome Powell publicly, and any credible talk of leadership changes introduces a market question about central bank independence. If markets interpret leadership shifts as more accommodative and more political, both gold and Bitcoin could rally on the same narrative: long-term trust risk in fiat management.
FX moves leading into the meeting show the tension. Traders have been trimming dollar exposure. That positioning can unwind quickly after Fed messaging, which would ripple into correlated assets.
Geography Is Not Background Noise in 2026
Regional differences are starting to matter more.
Asia has been mixed. China’s Shanghai index rose slightly while Japanese equities fell on yen strength. That split reflects different policy priorities and economic conditions across the region.
Japan’s currency strength is a headwind for exporters, but the medium-term ETF discussion positions Japan as a potential regulated gateway for crypto exposure, even if the timeline stretches to 2028. Europe has its own stress points, including trade friction with the U.S. The euro’s strength helps imports but hurts export competitiveness. The ECB has moved more dovishly than the Fed, which further changes cross-border capital flows.
The U.S. still dominates crypto market structure, liquidity, and innovation, even with regulatory uncertainty. Any real legislative breakthrough will matter globally because U.S. clarity tends to set the tone for institutions everywhere.
Emerging markets sit at the center of the gold move. They feel currency risk hardest and often have the strongest incentive to seek alternatives. But in practice, gold is still simpler and more accessible than crypto for most investors in those regions, which helps explain why gold is absorbing flows first.
Portfolio Positioning: What Discipline Looks Like in Uncertain Markets
This environment punishes overconfidence.
Gold’s role is straightforward. It is doing what it has historically done in messy periods. A 5% to 10% allocation to physical gold or gold-backed ETFs can make sense for many investors with multi-year horizons. It should protect the portfolio without taking over the entire strategy.
Crypto needs a different label. It is closer to a venture-style exposure to technology adoption than a pure safe haven. That means sizing should be conservative. A 1% to 3% allocation can keep investors engaged in long-term upside without turning short-term volatility into a lifestyle risk.
This is also a moment where patience often beats activity. Large shifts based on short-term moves tend to destroy value. Rebalancing rules matter more than predictions. If gold has grown far beyond its target weight, trimming back to plan can be smarter than chasing the next headline.
Dollar-cost averaging can work for crypto investors who believe in long-term adoption but do not trust the next six weeks. Small, scheduled buys remove emotion and reduce timing risk.
Leverage is the trap. Borrowing to amplify crypto exposure remains one of the fastest ways to blow up in a market like this. Volatility compression often precedes violent expansion. Liquidations do not care about your thesis.
Scenarios for the Next Six Months
Several paths remain plausible through mid-2026.
One scenario is the most boring and arguably the most consistent with current structure: gold keeps rising on safe-haven demand while crypto chops sideways. Gold could press toward $5,500 as tensions and central bank buying persist. Bitcoin could range between $80,000 and $95,000, supported by long-term holders but capped by overhead supply and cautious institutions.
A second scenario requires alignment: easing geopolitical tension plus Fed rate cuts. That would likely rotate capital out of gold and back into risk, lifting crypto meaningfully. Bitcoin could reclaim $100,000 if market structure improves and leverage returns, while gold could pull back but remain elevated above $4,500.
A third scenario is the darker one: economic conditions deteriorate materially. Gold could push toward $6,000 while crypto faces forced liquidations and deeper downside, with Bitcoin potentially testing $70,000 or lower.
A fourth scenario depends on policy competence: a clear U.S. regulatory breakthrough that unlocks institutional capital at scale. It is possible, but the near-term probability remains lower than crypto bulls want.
The most realistic outcome may look like a mix: partial easing in some geopolitical zones, new flashpoints elsewhere, gradual Fed shifts, and crypto alternating between relief rallies and pullbacks without clean direction.
Risk Management Rules That Still Matter
When correlations move and narratives break, basics protect capital.
Position sizing is the first filter. Overallocating to a single theme is the most common failure. Crypto should be sized so that total loss would not change your life. Gold should be sized so it protects the portfolio without trapping you in defensive posture if equities rebound.
Diversification only works when it is real. Ten cryptocurrencies do not diversify if they all move with Bitcoin. Two forms of gold exposure can also behave differently: physical gold, gold ETFs, and miners each carry distinct risks.
Liquidity matters more than people admit. Assets that trade cleanly in calm markets can become thin in stress. Holding enough cash or liquid reserves to avoid forced selling remains a timeless rule.
Discipline is the edge. Volatility is designed to trigger bad decisions. Rules around rebalancing and allocation prevent emotional reactions. Writing down your principles during calm periods and following them during stress is not just advice. It is a practical survival tool.
Taxes also become more important as volatility increases. Crypto gains and losses can be managed strategically through loss harvesting, holding periods, and timing. Gold can have special tax treatment in some jurisdictions. Investors should not wing it.
What Past Divergences Tell Us
This is not the first time asset relationships have shifted.
In 2013’s taper tantrum, gold fell while risk assets also struggled. Safe-haven flow went into dollars, not gold. That episode shows safe haven behavior changes depending on what investors fear.
In 2018, Bitcoin collapsed while gold stayed rangebound, because macro fear was muted. That period shows gold does not automatically benefit from crypto weakness.
In 2020, both rallied after the initial crash because stimulus and inflation fears dominated. That environment is not today’s environment. Today looks more like geopolitical stress plus constrained liquidity, which tends to favor gold over speculative assets.
The lesson is simple: correlations are not laws. They are temporary relationships shaped by the dominant fear in the room.
The Ethereum Problem: Why Number Two Looks Stuck
Ethereum’s underperformance is not just a chart issue. It points to a broader question about smart contract platforms and real adoption.
DeFi activity is down from peak levels. NFT volumes have collapsed. Layer-2 scaling has reduced fees, which is good for users, but it has also fragmented liquidity and attention across multiple networks. That can weaken Ethereum’s network effects, even if the technology continues to improve.
Solana and other platforms have gained share, but they have also struggled during broad risk-off conditions. So this is not just an Ethereum-specific problem. It is a demand problem across crypto applications.
The bigger concern for Ethereum bulls is the application gap. Ethereum has proven it can work. What it has not proven is that it can deliver mainstream use cases that compete with web2 experiences at scale. Many on-chain apps still feel like tools for crypto-native users rather than products built for the public.
Without clear demand drivers, ETH valuation stays tied to speculative appetite. In a market where investors are reducing risk, that is not a great setup.
Regulation: The One Catalyst That Can Reprice Everything
Even with weak price action, regulation remains the biggest potential reset.
U.S. legislative progress is focusing on custody rules, stablecoin frameworks, and exchange registration. Real clarity on token classification would be the unlock. It would reduce existential risk for projects, give institutions rules they can follow, and lower the odds of surprise enforcement events that shake markets.
International coordination is improving too. FATF standards have pushed most major jurisdictions toward common baselines for exchanges and wallet providers. The EU’s MiCA rules bring structure across a large economic bloc. Some elements are heavy, but clear rules often matter more than perfect rules.
Japan’s ETF discussion suggests growing acceptance of crypto as an investment asset class, even if the pace is slow. China remains restrictive on trading, but it continues to pursue blockchain applications and central bank digital currency research.
Regulation will not fix market structure overnight, but it can change who is allowed to participate. That is how market regimes shift.
The CBDC Wildcard
Central bank digital currencies sit in a strange place. They validate the concept of digital money while competing with private crypto rails.
CBDCs are permissioned and controlled. They do not offer the decentralization or supply constraints that define Bitcoin. They can also enable deeper state-level visibility into transactions, which raises privacy concerns.
Still, their development signals something important: central banks agree that the future of money is digital. The question is whether CBDCs simply replicate existing payment rails, or whether they introduce programmable money that could replace some stablecoin and DeFi use cases.
If CBDCs expand surveillance and control, some users may move toward crypto as an opt-out alternative. If CBDCs remain limited and functional, they may coexist without materially disrupting crypto adoption.
The timeline remains unclear. Technical scaling, interoperability, and political pushback will shape how fast democracies move. Authoritarian systems may move quicker, but that experience may not translate cleanly to the U.S. or Europe.
Conclusion: Dealing With Markets That Do Not Follow Narratives
Early 2026 is forcing investors to separate slogans from reality.
Gold is behaving like gold. It is absorbing defensive flows during uncertainty. Bitcoin is behaving like a high-volatility asset that depends on liquidity and confidence. That does not destroy the long-term crypto thesis, but it does change how investors should frame it right now.
Investors should position for the market they have, not the market they want. Gold deserves a role as insurance. Crypto deserves a smaller, deliberate role as a high-upside, high-risk exposure to long-term adoption. Diversification, disciplined sizing, and patience remain the cleanest strategy in a regime where trends are not cooperating.
The next months will reveal whether crypto consolidates before a new growth phase or whether this marks a deeper shift in how capital treats digital assets during stress. Investors who stay disciplined and realistic will be fine either way. Investors who overextend on conviction or trade emotionally will likely learn the same lesson markets teach every cycle.
Markets humble confidence. This divergence is a reminder that assets do not owe anyone the behavior that narratives promised. The investors who accept that and manage risk accordingly will be in the best position for whatever 2026 delivers.
Frequently Asked Questions
1. Why is gold outperforming Bitcoin in early 2026?
Gold is benefiting from geopolitical tension, central bank buying, and currency uncertainty. Bitcoin is behaving like a risk asset, not a safe haven, and is facing selling pressure from recent buyers.
2. Is Bitcoin still considered “digital gold”?
In theory, yes. In practice, not right now. Bitcoin is trading more like a speculative asset that depends on liquidity and risk appetite rather than a defensive store of value.
3. Why did gold cross $5,000 per ounce?
Central banks accelerated gold purchases, investors sought safety amid trade and policy uncertainty, and currency volatility increased demand for non-fiat stores of value.
4. Why are altcoins falling more than Bitcoin?
Altcoins carry higher risk and lower liquidity. When markets turn risk-off, capital exits speculative tokens first, leading to sharper and faster declines.
5. Is Ethereum underperforming Bitcoin in 2026?
Yes. Ethereum has lagged Bitcoin due to weaker demand for DeFi and NFTs, fragmented liquidity from layer-2 solutions, and lack of strong new mainstream applications.
6. What role is the Federal Reserve playing in these markets?
Fed guidance affects liquidity, dollar strength, and risk appetite. Uncertainty around rates and potential leadership changes has increased volatility across gold, crypto, and currencies.
7. Are institutions buying crypto right now?
Most large institutions are cautious. Central banks are buying gold, while hedge funds, pensions, and corporates are largely waiting for clearer regulation and better risk-reward setups.
8. Is now a good time to invest in Bitcoin?
That depends on time horizon and risk tolerance. Short-term conditions favor caution, while long-term investors may prefer small, disciplined allocations using dollar-cost averaging.
9. How much gold or crypto should a portfolio hold in 2026?
Many investors consider 5–10% in gold for protection and 1–3% in crypto for upside exposure, sized according to personal risk tolerance and financial goals.
10. What could change the outlook for crypto in 2026?
Clear U.S. regulation, Fed rate cuts, easing geopolitical tensions, or renewed institutional adoption could improve sentiment. Until then, crypto is likely to remain volatile and range-bound.
Metaplanet stock slid 7% on a $679m non‑cash BTC impairment, highlighting its leveraged Bitcoin exposure even as it doubles down on a 100,000 BTC treasury goal. Metaplanet’s high‑beta Bitcoin bet just delivered a brutal jolt to shareholders, wiping roughly 7%…
Bitcoin extended losses as US shutdown odds climbed toward 80% on prediction markets, with analysts citing political risk while gold and silver hit record highs. Bitcoin (BTC) declined amid rising political uncertainty in the United States as concerns mounted over…
70% of Polymarket traders lost money while the top 0.04% captured over $3.7 billion in profits, revealing extreme concentration in prediction markets.#Polymarket #Tradershttps://t.co/E5CeFnJIwR
Polymarket is back in the U.S. after CFTC approval. Clear Street analyst says prediction markets could become an engagement tool for platforms like Coinbase. #Polymarket #Coinbasehttps://t.co/h9EX7a4YFn


 THE FED IS PREPARING TO SELL U.S. DOLLARS AND BUY JAPANESE YEN FOR THE FIRST TIME THIS CENTURY.
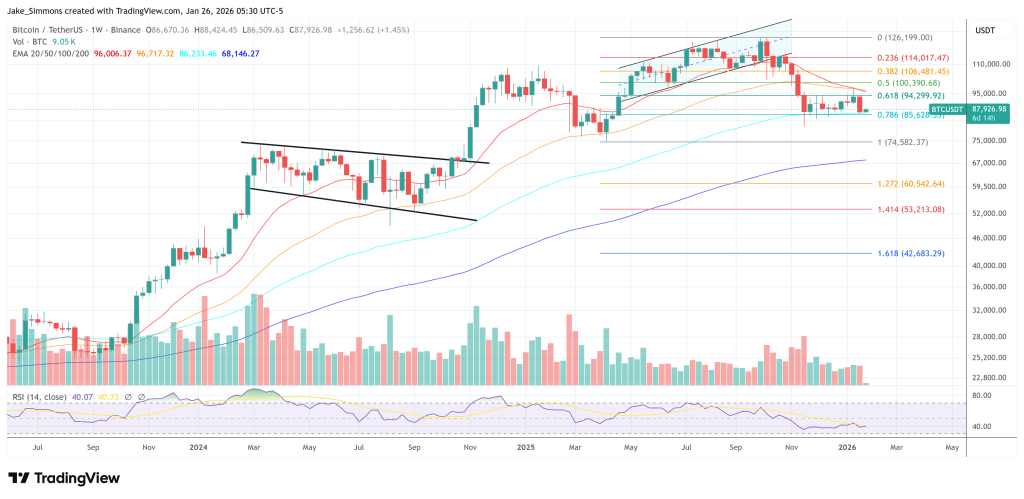


 Adler Jr (@AxelAdlerJr)
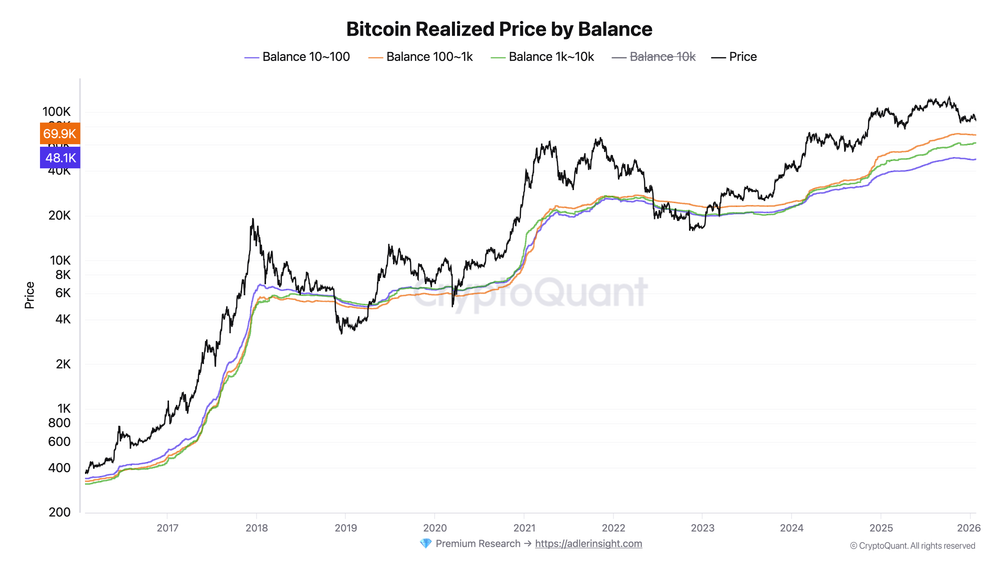
 Digital asset investment products saw sharp outflows last week, with investors pulling $1.73B — the largest weekly decline since mid-November 2025, according to CoinShares.


 Sells $257 Million in Stock to Buy 2,932 Bitcoin 17")
 Crypto allocations by financial advisors hit 32% in 2025, up from 22% a year earlier, as Bitcoin reached new highs and US rules moved closer to the mainstream, a
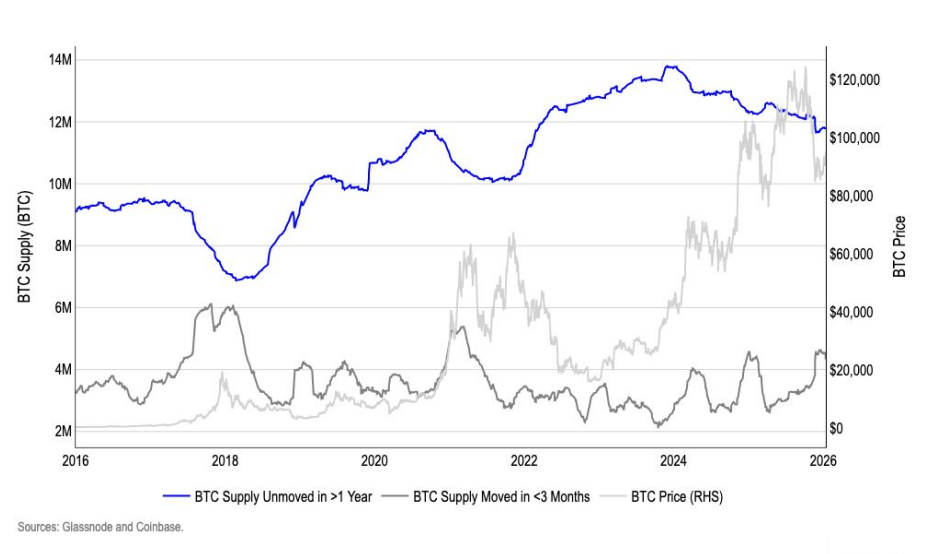

 BREAKING: The UK Just Moved to Fully Integrate Crypto Firms Into the FCA Rulebook
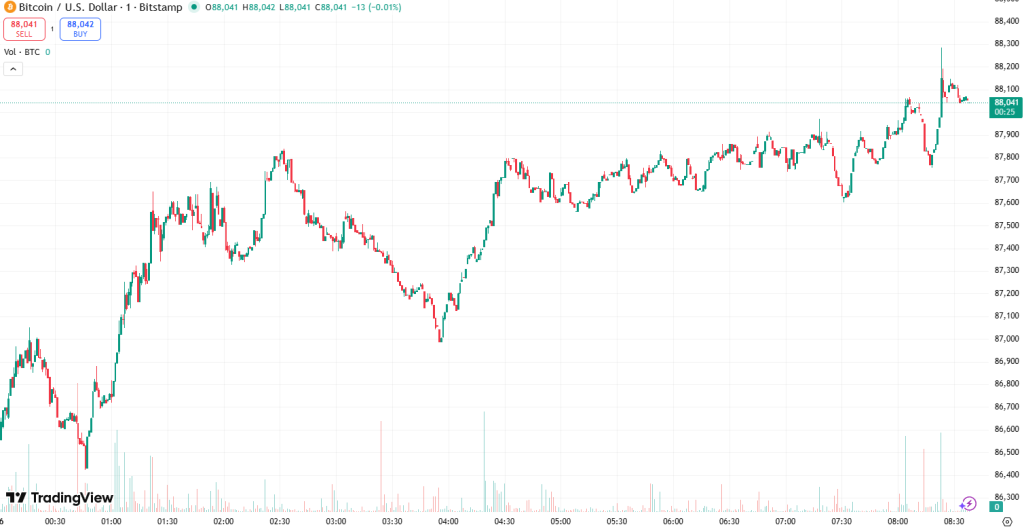

 Japan’s Nomura Holdings and SBI Holdings are developing the first crypto ETF products, awaiting approval for listing on the Tokyo Stock Exchange.