Reading view

There are new articles available, click to refresh the page.

XRP’s 173-Day Theory: What Happens If This Historical Trend Plays Out Again

A crypto analyst has identified a recurring chart pattern centered on a 173-day cycle that previously preceded a major price expansion for XRP. Based on this pattern, the expert suggests that XRP may be approaching a similar price rally if the trend plays out as expected. 

XRP Historical Pattern Signals Powerful Upside Move

A crypto analyst who goes by ‘Bird’ on X has drawn attention to a recurring pattern on XRP’s daily chart. His analysis compares XRP’s current price formation with the pattern that preceded the 2025 breakout, highlighting a nearly identical time cycle and chart structure. 

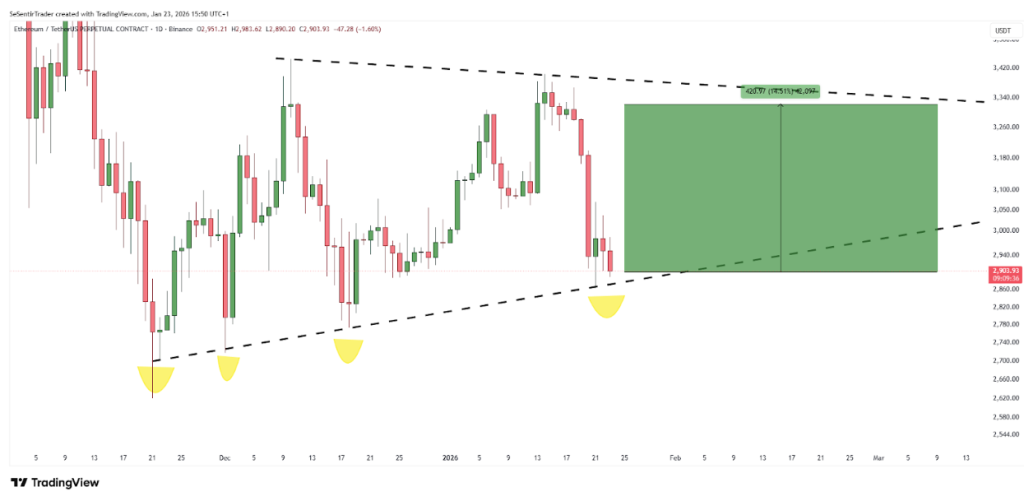
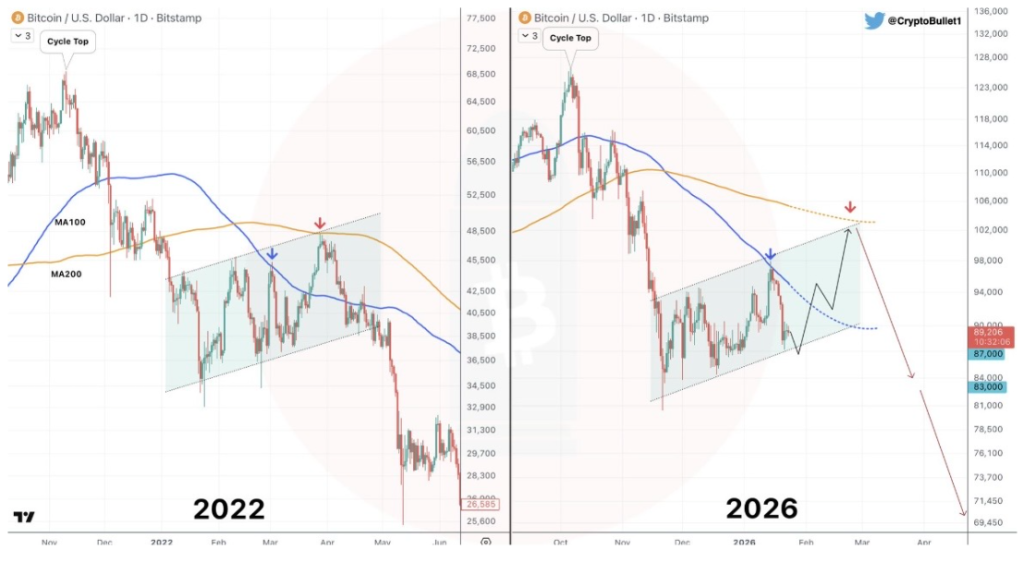
On the left side of the chart, Bird noted that it took about 173 days for XRP to break after reaching its first major top in 2025. This period is clearly marked by vertical blue lines on the chart and shows price moving within a descending wedge pattern. Notably, each price rally was lower than the previous one, while support levels remained relatively stable. Trading volume during that phase also hovered around $1.8 billion, suggesting that the breakout developed under steady market participation rather than thin liquidity.  

XRP

On the right side of the chart, which shows XRP’s price action in the current market cycle, Bird points to a similar pattern forming. Since the July 2025 peak, XRP has spent about 173 days moving sideways within a descending wedge. Compared to the past cycle, trading volume has been much lower, averaging around $1 billion. However, the pattern’s shape and timing closely match past trends.

Bird notes that XRP has not broken down despite months of severe downward pressure. Instead of falling below key support levels, the price has been squeezed into a tighter range within the same descending wedge pattern. It also held near the $1.94 level as it approached the tip of the wedge. The analyst stated that this move shows the market is not moving sideways at random but is entering a late-stage compression before a larger upward move. 

If historical trends hold, Bird has predicted that XRP could surge to between $4 and $4.5. With the cryptocurrency currently trading around $1.87, this would represent a surge of more than 113%. 

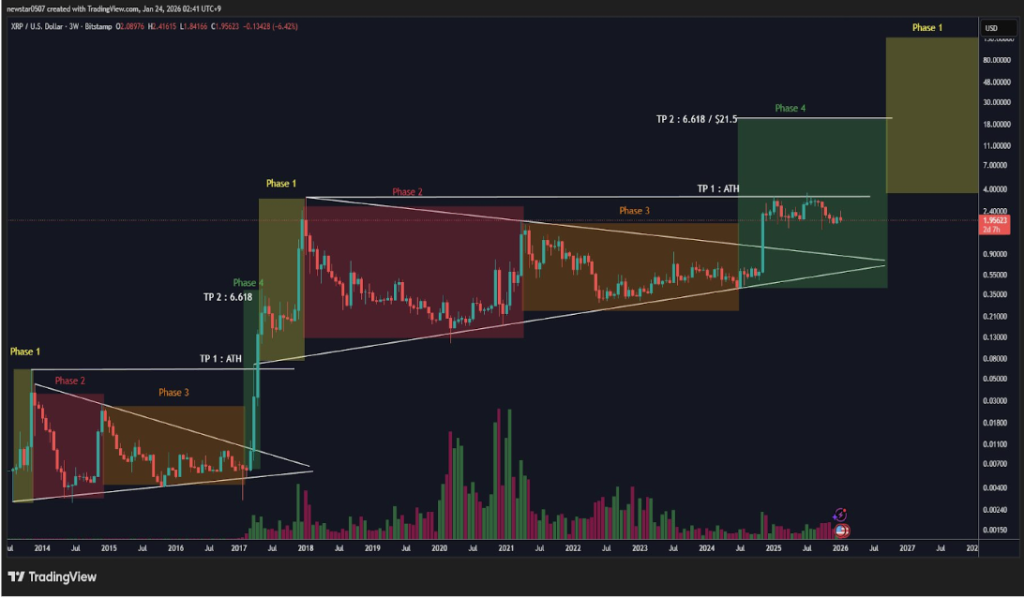
Analyst Predicts 2017 XRP Price Explosion In 2026

Despite XRP’s recent crash below $1.9, analysts still believe its price could recover and launch a strong rally. A recent analysis by market expert Steph is Crypto reflects this optimistic outlook. 

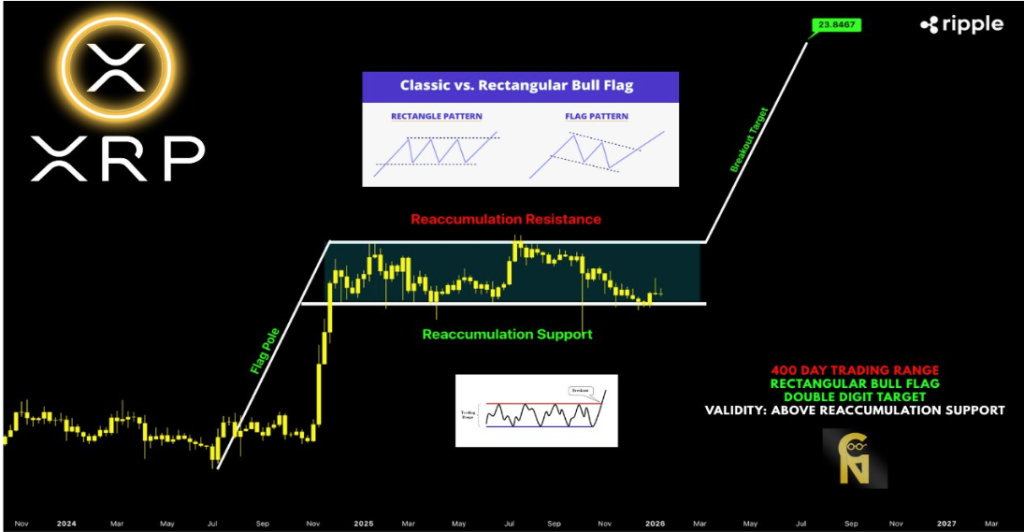
In his post on X, Steph is Crypto predicted that XRP could be on the verge of a price explosion similar to the one in 2017. At the time, the cryptocurrency recorded a powerful rally, jumping from around $0.005 to more than $0.25. If this same trend repeats, the analyst forecasts a breakout from around $2 to above $22. 

XRP

Bitcoin Price Enters Next Parabolic Phase, Analysts Set New Targets

The recent market downturn has not deterred analysts from maintaining a bullish outlook on the Bitcoin price. New reports from these market watchers suggest Bitcoin may be entering a new parabolic phase, potentially signaling the end of its prolonged correction. While one analyst points to BTC’s correlation with gold as a signal of a possible ATH, another applies an Elliott Wave analysis to set a new price target for the leading cryptocurrency. 

Bitcoin Price Prepares For $245,000 Parabolic Move

A recent technical analysis by Crypto Tice suggests that gold has taken the lead, while Bitcoin currently stands at a transition point. The analyst presented a weekly price chart tracking both assets, and showing how gold’s price movement could be used to determine Bitcoin’s next parabolic move to a $245,000 all-time high. 

The chart tracks gold and Bitcoin’s price action from 2016 through projected moves into 2026, showing a repeating pattern where uncertainty peaks in gold first. After which, capital flows into the precious metal, its price then breaks out and ranges, and then money rotates into BTC. Crypto Tice has said that this rotation phase has repeated in every market cycle.  

In the first cycle, from July 2017 to Q4 2018, gold climbed to an all-time high before trading in a narrow range, signaling broader trend exhaustion rather than a breakdown. Shortly afterward, Bitcoin launched a strong rally, reflecting a rotation of capital from the precious metal into a higher-risk asset. 

Bitcoin

The same pattern appeared during the 2020-2021 cycle. Gold reached a new peak and stalled in a tight range, while Bitcoin followed with a powerful breakout to the upside. That surge aligned with another green profit rotation zone on the analyst’s price chart. 

On the far right side of the chart, Crypto Tice has revealed that gold has once again reached a record high in the current cycle and is consolidating inside a red range. At the same time, Bitcoin has already moved sharply higher and is now experiencing a modest pullback. The analyst calls this overlap a “transfer window” between the two assets.

Crypto Tice noted that this recent pause mirrors the same pattern seen in past cycles before Bitcoin staged a major price rally. The analyst has predicted that if BTC continues to follow this historical trend, it could soon enter a new parabolic phase, potentially triggering a price surge above $245,000.  

Elliott Wave Analyst Shares Next BTC Price Target

In a separate analysis, crypto market expert Merlijn the Trader has shared a video chart analysis showing a repeating Elliott wave structure that could indicate Bitcoin’s next potential bullish target. From late 2024 to mid 2025, BTC formed a five-wave pattern, creating higher lows and building a base that led to a significant price rally. 

According to Merlijn the Trader, Bitcoin is repeating this five-wave pattern in the current cycle. Waves 1 through 3 are already complete, showing higher lows, while Waves 4 and 5 are forming a base following a massive price crash. Once this stage completes, the analyst predicts BTC could rally strongly from its current price above $87,900 toward $124,000.

Bitcoin

Crypto Traders Share Odds Of XRP Price Rising 40% This Year, Can It Still Rally?

Retail traders are increasingly optimistic about XRP, even though the cryptocurrency’s price is currently struggling to keep up above $1.90. Despite the recent lack of follow-through in price action, different data shows confidence is building beneath the surface. 

Data from prediction markets by Robinhood shows traders are actively pricing in the possibility of a sizable upside move for XRP’s price action this year, with odds pointing toward a rally of roughly 40% from current levels.

How Prediction Market Pricing Is Reflecting Bullish Expectations

Data from prediction markets hosted on Robinhood shows that traders are actively trading contracts tied to XRP reaching specific price levels in 2026. Notably, the data shows that the contract for XRP trading at $2.75 in 2026 is currently quoted with a bid of $0.66 and an ask of $0.73. 

An ask of $0.73 means that the Robinhood prediction platform believes the likelihood of XRP reaching or exceeding $2.75 is high enough to demand a significant premium. Although this does not represent a guaranteed probability, it suggests that traders offering liquidity see that outcome as more likely than not, placing implied odds in the 73% range based on current pricing.

That same optimism is present as price targets move higher, though more measured. The contract tied to XRP crossing $3.00 is priced around 50 cents. This implies the market views that level as a roughly even chance and a 50% scenario that the XRP price breaks above $3 again in 2026. The ask price drops to 44 cents for an XRP price bet of $3.25, which means there is a 44% chance XRP reaches this level.

Can XRP Still Rally While Near $1.90?

Recent price action has seen XRP now back to trading around support at $1.9. At the time of writing, XRP is trading at $1.88, down by 5% in the past seven days. This decline is part of an extended correction move after XRP’s rally in early January was rejected around $2.41 on January 6. 

The entire crypto industry is now back to a mood of fear, according to CoinMarketCap’s Fear & Greed Index. The index shows that the overall market sentiment is currently sitting at a Fear reading of 29. Even so, this risk-off mood has done little to dampen bullish expectations among many XRP investors. Several forecasts published in January continue to point toward a move into new all-time price highs this year.

Standard Chartered’s analysts, for example, have projected that XRP could reach $8 in 2026 if sustained ETF inflows and clearer regulation are able to increase institutional interest. Another price outlook echoed the idea that a new all-time high above $5 is possible before the year ends based on the current trend of XRP outflows from crypto exchange reserves.

XRP

Major Reasons Why The XRP Price Could Recover And Surge Again

Crypto analyst Darkfost has highlighted reasons why the XRP price could soon witness a bullish reversal and potentially reach new local highs. This comes amid bearish sentiment in the market, which on-chain analytics platform Santiment said could set the stage for a reversal in the altcoin’s price.  

Why The XRP Price Could Soon See A Bullish Reversal 

In a CryptoQuant blog post, Darkfost stated that negative funding rates signal a potential XRP price reversal. The analyst noted that the altcoin is currently trading around 47% below its all-time high (ATH) set in July last year. Furthermore, the altcoin is said to have naturally entered a phase of distribution and correction after a gain of over 600% since November 2024. 

Darkfost assured that this type of movement is healthy after such a strong rally for the price. He further remarked that what stands out is the timing of the bearish consensus, as it did not form at the top but rather during a drawdown of more than 50%. Now, there are predominantly short positions on XRP, with funding rates on Binance mostly negative since December, indicating that leveraged short positions have the upper hand. 

XRP

The analyst noted that historically, the market tends to move against a late consensus. As such, while the accumulation of shorts creates short-term selling pressure, it also builds latent buying pressure. Darkfost said that if the XRP price starts to rise, these short positions could be liquidated, fueling the upward move. 

He revealed that a similar pattern has occurred for the token price since 2024. The first was between August and September 2024, and the second was during the April 2025 correction, when funding rates turned negative for a period before a bullish rebound occurred. The analyst stated that this price rebound was due to a shift in investor sentiment and funding rates returning to positive territory. 

A Rally Starter For XRP

In an X post, Santiment stated that XRP traders are showing major FUD, which they claimed is usually a rally starter for the XRP price. The on-chain analytics platform revealed that the altcoin has fallen into ‘Extreme Fear’ territory, with small retail traders becoming pessimistic about the token after a 19% decline from its recent high on January 5th. 

Santiment noted that historically, this level of bearish commentary has led to price rallies. This is based on the belief that prices move in the opposite direction to retail’s expectations more often than not. The altcoin has dropped again following the recent decline in the broader crypto market, led by Bitcoin. BTC fell below $87,000 yesterday on the back of U.S. political tensions, government shutdown risk, and ahead of this week’s FOMC meeting. 

At the time of writing, the XRP price is trading at around $1.88, down in the last 24 hours, according to data from CoinMarketCap.

XRP

Global Liquidity Says Bitcoin Is Extremely Undervalued – Here’s The ‘Real’ Figure

Crypto pundit Kyle Chassé has pointed to the rising global liquidity to prove that Bitcoin is currently undervalued. His comments come as fiat currencies like the Dollar and Yen continue to weaken amid concerns about governments’ fiscal policies. 

Global Liquidity Points To A Bitcoin Target Of $270,000

In an X post, Kyle Chassé shared an accompanying chart highlighting a Bitcoin target of $270,000 based on rising global liquidity. The pundit stated that the herd says that $90,000 BTC is expensive, but that the fiat ledger has reminded everyone why the digital ledger exists. This came as he revealed that the global M2 money supply has hit a record $98 trillion, driven by aggressive expansion from the U.S., the Eurozone, China, and Japan. 

Chassé further noted that year-to-date (YTD) global liquidity growth is now 6.2%, the fastest pace since the 2020 pandemic response. The pundit warned that in a system where the fiat denominator is permanently diluted, fixed-supply assets are not going up in price, but that cash is “loudly becoming worthless.” As such, he believes that BTC is a good hedge against currency debasement and potentially inflation. 

Bitcoin

The pundit’s comments notably come amid a decline in the dollar, with the DXY down since the start of the year. The yen is also down YTD, as these fiat declines are coming amid a push by the governments to increase spending. Increased government spending is considered bullish for Bitcoin, given its fixed supply compared to fiat currencies, which governments continue to print. BitMEX co-founder Arthur Hayes had also recently predicted that a rise in dollar liquidity would spark higher BTC prices. 

However, that is yet to be the case as Bitcoin continues to trade like a risk asset and has erased its year-to-date (YTD) gains amid political tensions in the U.S. A U.S. government shutdown is also looking more likely by January 31, sparking a BTC drop below $87,000 yesterday. 

BTC Will Rise Once Liquidity Returns

Crypto pundit Merlijn assured that Bitcoin will rise once liquidity comes back. In an X post, he urged market participants to zoom out and that the BTC pattern would become obvious. The pundit revealed that the flagship crypto has already recorded waves 1, 2, and 3 with lower highs, which signal trend fatigue. 

Now, Bitcoin is looking to form waves 4 and 5, which would signal a reset, absorption, and base building. Merlijn suggested that the bottom may not yet be in, but that once that happens, BTC could rally to as high as $124,000, bringing it close to its current all-time high (ATH) of $126,000. 

At the time of writing, the Bitcoin price is trading at around $87,700, down in the last 24 hours, according to data from CoinMarketCap.

Bitcoin

Altcoins Don’t Move Slowly: 6-Week Window Can Rewrite Years Of Price Action

Crypto traders often assume that meaningful gains need long timelines to take place, and they often give up during the wait and silence. However, crypto has a habit of shattering that belief without warning. History shows that when conditions line up, altcoins do not grind higher over years. They release and erase multiple years of drawdowns in a matter of weeks. 

That memory was highlighted by a crypto commentator known as Waterman on the social media platform X, who noted a familiar seasonal window between February and late April to early May for an altcoin explosion.

Speed Matters More Than Time

The most notable example of an altcoin rally season was in 2021, when the entire altcoin market went on a rally to new all-time highs, many of which are still unbroken for some cryptocurrencies. 

The 2021 cycle delivered some of the clearest reminders of just how fast capital can rotate once momentum takes hold. Solana moved from roughly $20 to $200 in about 50 days, a clean tenfold run. Although Solana has since broken above this peak to register a new all-time high of $293 in January 2025, this was still Solana’s most explosive rally to date.

Dogecoin followed an even sharper trajectory, climbing from $0.07 to a peak of $0.73 in under a month due to speculative interest that flowed into other memecoins like Shiba Inu. Unlike Solana, Dogecoin is yet to reclaim or surpass this peak price.

Avalanche went further, rallying from around $3 to $60 in less than 40 days, a twentyfold expansion that unfolded faster than most long-term projections ever anticipate. None of these moves required years of development or prolonged accumulation.

A Timeframe To Watch Closely

Notably, February through late April or early May has more often than not been the period where altcoin performance increases the most. If that pattern repeats, the coming weeks may matter far more than the years that came before them.

At the time of writing, the notion of an altcoin season is still impeded by strong Bitcoin dominance. Much of that comes down to how the entire crypto industry ecosystem has changed massively since 2021, especially after the launch of crypto-based ETFs. That steady demand has kept capital inflows concentrated around Bitcoin and slowed the usual rotation into altcoins.

Meme coins like Dogecoin and Shiba Inu have struggled to keep up in terms of price action, even with the launch of Dogecoin ETFs. Although the ETF has boosted visibility, it has not yet resulted into sustained upside.

At the same time, investors have become more selective, favoring cryptocurrencies tied to clearer utility. As a result, many crypto communities have been working to create utility for their meme coins.

Nonetheless, as noted by Waterman, you only need about four to six weeks for an altcoin to wipe out three to four years of suffering. You don’t need one to two years for altcoins to make massive gains.

Featured image from YouHodler, chart from TradingView

XRP Enters Phase 4 In Long-Term Chart Structure: Road To $21.5 Now Open

Technical analysis of XRP’s price action on the 3-week candlestick timeframe chart shows that the cryptocurrency is about to play out a road to the double-digit threshold based on its long-term structure. 

The analysis, which was shared on the social media platform X alongside a multiyear chart, points to XRP trading in what is labeled Phase 4. At the center of this setup is a clear technical target of a break above the previous all-time high and a run to at least $21.5

XRP Price Action In Phases

Technical analysis of XRP price action shows that the cryptocurrency has been trading in a series of four phases for more than a decade. One full sequence of four phases unfolded between mid-2013 and mid-2017 as the foundation for XRP’s first rally to price peaks. Since then, a second set of four phases has been developing and following a similar pattern. 

XRP transitioned into a new phase 1 and phase 2 sequence that led to a 2018 peak for phase 1 and then a pullback for phase 2 between 2018 and 2020. This was followed by an unusually long p3 that stretched from 2019 to mid-2024, visible on the chart as a broad, multi-year consolidation with converging trendlines of lower highs and higher lows. During this time, XRP’s price action was trapped inside the compression structure, just like the behavior seen during phase 3 of the first cycle.

XRP Price Chart. Source: @amonyx On X

Phase 4 Returns: XRP To Double Digits

According to the technical analysis, phase 4 began in 2025, when XRP finally broke above the compression range in mid-2024. This breakout was the same structural transition seen in mid-2017, when XRP exited consolidation and entered expansion. 

Phase 4 has already been in progress for several months and includes the period when XRP rallied to new all-time highs in mid-2025, eventually topping out at $3.65 in July. Since that peak, however, XRP’s price action has been playing out a corrective downward trend and is down by roughly 48% at the time of writing. 

Despite the ongoing correction, the projection is that XRP is still in phase 4 and is going to break into new all-time highs soon. This shows that phase 4 could unfold over an extended period and not with a single impulse move. The current all-time high of $3.65 is the first major technical hurdle, and a break above it will serve as confirmation that XRP is back into price discovery.

Based on this technical analysis, past expansion ratios from the previous cycle are applied and a 6.618 Fibonacci extension is measured from the phase 3 support low. This points to a projected price level near $21.5. At the time of writing, XRP is trading at $1.89, meaning a move to that level would represent an increase of roughly 1,040% from current prices.

Featured image from Pexels, chart from TradingView

Analyst Says You’re Not Bullish Enough On Ethereum – What Does He Mean?

A growing number of analysts believe Ethereum’s current price action is being misunderstood. Although frustration is growing due to Ethereum’s inability to hold above $3,000, some technical analysts are quick to point out that the structure forming beneath the surface tells a very different story. According to one analyst, the real risk right now is not being bullish on Ethereum and trying to short in anticipation of a downside breakout.

Higher Lows And A Structure That Keeps Tightening

The analyst’s technical view on Ethereum is focused less on short-term momentum and more on the structure developing on the chart, which he argues is even clearer than what is currently visible on Bitcoin’s chart.

Notably, Ethereum’s price action is carving out a series of higher lows on the daily candlestick timeframe chart to form a tightening triangular pattern since December 2025. This kind of behavior shows that each pullback is being absorbed at progressively higher levels, which is how strong trends reset before continuation.

Ethereum needs to avoid a breakdown below key support zones in order for this trend continuation setup to still be valid. According to the analyst, a dip under $2,860 would begin to weaken the pattern, while a close below $2,780 would invalidate the higher-low structure. 

At the time of writing, Ethereum is trading around $2,950, which is dangerously close to the lower boundary of this setup. Therefore, some traders will be tempted to short Ethereum at this level, but the analyst called it the dumbest thing to do here.

As long as those levels ($2,860 and $2,780) hold, the analyst sees no technical justification for betting against ETH, especially near the lower boundary of the channel where buyers have repeatedly stepped in. 

If support holds, the next move would be a gradual return to the upper trendline of the channel, which is just below $3,340. A move into that region would bring price back into direct contact with overhead resistance and set the stage for a breakout if buying pressure continues to increase.

Ethereum Price Chart. Source: @Tryrexcrypto on X

The Bigger Picture Behind Ethereum’s Price Action

Ethereum is entering 2026 without clear bullish momentum, a reality that has dampened sentiment across the spot and derivatives markets. Spot ETF inflows into Ethereum and Bitcoin have slowed down, and issuers have been highlighted with consistent days of outflows.

Nonetheless, major asset managers are still holding huge amounts of Ethereum and are working on diversifying their activities on Ethereum. BlackRock, for example, filed with the SEC in December to launch a staked Ethereum exchange-traded fund, a move that will bring in more institutional investors into the Ethereum ecosystem.

Speaking of staking, BitMine Technologies recently amped up its ETH staking to over $5.71 billion worth of Ethereum. On-chain data from Arkham Intelligence shows that the firm has staked an additional 171,264, worth $503.2 million, pushing its total stake to over 1.94 million ETH.

Featured image from Unsplash, chart from TradingView

$7 Trillion Player Is Moving Into Bitcoin, Can This Trigger A Surge To $200,000?

Swiss banking giant UBS, with assets under management (AuM) of up to $7 trillion, is set to launch Bitcoin trading for some of its clients. This comes amid predictions that regulatory clarity and broader adoption could send the BTC price to as high as $200,000. 

UBS To Offer Bitcoin Trading To Some Wealth Clients

Bloomberg reported that UBS is planning to launch crypto trading for some of its wealth clients, starting with its private bank clients in Switzerland. The bank will reportedly begin by offering these clients the opportunity to invest in Bitcoin and Ethereum. At the same time, the crypto offering could further expand to clients in the Pacific-Asia region and the U.S.

The banking giant is currently in discussions with potential partners, and there is no clear timeline for when it could launch Bitcoin and Ethereum trading for clients. This move is said to be partly due to increased demand from wealth clients for crypto exposure. UBS also faces increased competition as other Wall Street giants are working to offer crypto trading. 

Morgan Stanley, in partnership with Zerohash, announced plans to launch crypto trading in the first half of this year, starting with Bitcoin, Ethereum, and Solana. The banking giant may soon also be able to offer its crypto products, as it has filed with the SEC to launch spot BTC, ETH, and SOL ETFs. 

Furthermore, JPMorgan, another of UBS’ competitors, is considering offering crypto trading to institutional clients, although this plan is still in the early stages. The bank already accepts Bitcoin and Ethereum as collateral from its clients. Last year, it also filed to offer BTC structured notes that will track the performance of the BlackRock Bitcoin ETF.

Can Bank’s Entry Trigger A BTC Rally To $200,000  

Kevin O’Leary predicted that Bitcoin could rally to between $150,000 and $200,000 this year, driven by the passage of the CLARITY Act. His prediction came just as White House Crypto Czar David Sacks said banks would fully enter crypto once the bill passes. As such, there is a possibility that BTC could reach this $200,000 psychological level in anticipation of the amount of new capital that could flow into BTC from these banks once the bill passes. 

BitMine’s Chairman, Tom Lee, also predicted during a CNBC interview that Bitcoin could reach between $200,000 and $250,000 this year, partly due to growing institutional adoption by Wall Street giants. Meanwhile, Binance founder Changpeng “CZ” Zhao said that a BTC rally to $200,000 is the “most obvious thing in the world” to him.

At the time of writing, the Bitcoin price is trading at around $89,600, up in the last 24 hours, according to data from CoinMarketCap.

Bitcoin

End Of This Reaccumulation Phase Could Trigger Most Aggressive XRP Rally Ever

XRP has spent most of the past few months trading with lower highs since July 2025, frustrating traders and compressing price action into an increasingly tight range. 

However, a technical breakdown shared by crypto analyst ChartNerd argued that what looks like stagnation may actually be the final preparation phase before a historic move. The price structure suggests something far bigger that sends XRP on its most aggressive rally in eight years, but the implications only become clear when the full setup is examined.

A 400-Day Rectangular Reaccumulation Still Holding Structure

According to technical analysis done by ChartNerd, XRP’s price action has been locked inside a rectangular reaccumulation zone for about 400 days, and this has led to the formation of what looks like a rectangular bull flag on a macro timeframe. The technical chart shows a strong impulsive move from July 2024 to December 2024 acting as the flagpole, right when XRP peaked at the $3.4 price zone back then.

This impulsive flagpole has been followed by a long period of sideways trading where XRP’s price has repeatedly respected a clearly defined support around $1.8 and resistance boundaries around $3.6. This type of structure is associated with reaccumulation within the support and resistance zones, especially when it is playing out after a sharp expansion move and holding for this length of time.

Each dip into reaccumulation support has been absorbed, preventing any sustained breakdown and keeping the broader pattern intact. ChartNerd noted that the rectangular flag will be valid as long as this support level is defended, and this will activate the expansion journey.

XRP Price Chart. Source: @ChartNerdTA on X

Macro Breakout Projection Puts XRP Price Target At $23

According to ChartNerd, bearish participants are increasingly pressured by the fact that this fractal is still holding despite repeated attempts to invalidate it. The longer XRP’s price action is trapped inside the rectangle without breaking down, the more likely it becomes that the eventual resolution favors the dominant trend that preceded the consolidation. In this case, that trend was bullish, which strengthens the case for an upside breakout once resistance is cleared.

If the rectangular bull flag resolves to the upside as projected, the chart outlines a breakout trajectory that would carry XRP into double-digit territory, with a long-term target region near $23. This price target projection is derived from the height of the flagpole extended from the top of the reaccumulation range.

ChartNerd labelled this possible move as one of the most aggressive rallies XRP could see in seven to eight years. At the time of writing, XRP is trading around $1.92, meaning a move toward the $23 region would represent a gain of over 1,000% from current levels, which is a type of percentage expansion XRP has played out well in the past.

Featured image from Unsplash, chart from TradingView

XRP Dev Shares How To Retire In A Few Years

A recent statement from an XRP Ledger (XRPL) developer suggests that XRP could be the key to an early retirement shortcut. Unlike steady paychecks or slow-growing investments in traditional assets, cryptocurrencies have the ability to create generational wealth rapidly, due to their penchant for sudden and explosive price moves. Among the thousands of digital assets on the market, the developer highlighted the token as his primary choice for investors seeking substantial returns, even sharing strategies for how the coin can help them retire in a few years. 

XRP Emerges As Shortcut To Early Retirement

A DropCoin XRPL developer, identified as ‘Bird’ on X, announced on Thursday, January 22, that buying and holding XRP at current prices could help investors retire within a few years. The bold claim quickly caught the attention of many in the crypto community, with some asking the developers to elaborate on the strategies involved and the expected timeline for achieving such wealth. 

Related Reading: XRP Price Obliteration Is Not A Matter Of If, New All-Time Highs Are Coming

Not stopping there, Bird claimed that investing in the token could eliminate the need for a job, suggesting that long-term investors may eventually rely on the potential profits from their holdings as a primary source of income. His statements were in response to a post by Watcher.Guru, which the developer directly referenced to support his optimistic long-term outlook. 

In that post, Watcher Guru quoted a statement reportedly made by Binance’s founder ChangPeng Zhao, who also agreed that holding crypto assets over time could make jobs unnecessary and allow investors to retire sooner than planned. The Ledger developer shared a screenshot of Zhao making similar remarks about Artificial Intelligence, suggesting that the Binance founder views both crypto and AI as powerful tools for achieving long-term financial freedom

A crypto community member who responded to Bird’s post questioned how long an investor has to hold XRP before retiring early. The developer answered humorously that it could be held indefinitely, adding that some investors could reach early retirement this year, while others may need a few more years. He emphasized that the timeline ultimately depends on how many tokens an investor holds.  

How High The Altcoin Could Rise To Enable Early Retirement

Addressing questions from the crypto community members, Bird shared his outlook on how high he believes XRP’s price could rise, helping investors achieve early retirement. He predicted that within the next few years, the cryptocurrency could rise to $100 and beyond—a significant jump from its current market price of around $1.90. 

Related Reading: How Donald Trump’s Latest Crypto Move Will Boost Demand For XRP

The Ledger developer suggested that reaching $100 could be a gradual process for the altcoin, forecasting an initial rally to $10 in the First Quarter (Q1) of 2026. Notably, Bird’s remarks reflect a classic buy-the-dip and hold strategy, where investors accumulate during downtrends and patiently wait for the price to rally explosively before taking profits.

XRP

XRP To $11, And Then $70: The Next Impulse Wave To Watch Out For

Crypto analyst CryptoBull has highlighted targets that XRP could reach as it eyes double digits. The analyst is confident the altcoin could reach these targets, noting that current price action is mirroring the previous bull run. 

XRP Eyes Rally To $11 And Then $70

In an X post, Crypto Bull stated that the next impulse will take XRP to $11 and that the last wave will take the altcoin to $70. This came as he noted that the price pattern is mirroring the previous bull run, with the only difference being time, which he claimed makes sense, as the altcoin needs longer accumulation to reach higher prices. 

The analyst also indicated that it could take a year of accumulation for XRP to reach the $11 price target, meaning the last wave to $70 could take much longer. This prediction comes despite the current decline in the crypto market, with XRP trading below the psychological $2 price level.  

XRP

Despite the current bearish sentiment, crypto analyst CW has also declared that the XRP rally is about to begin and that the road to $21.5 is just the beginning. He noted that this is the Phase 4 peak while the first goal is for the altcoin to break its current all-time high (ATH)

His accompanying chart showed that XRP could reach this $21 target by year-end. Meanwhile, there is the possibility of the altcoin rallying above $100 in the next Phase 1, which could happen next year. Crypto Pundit X Finance Bull recently highlighted the CLARITY Act and Trump’s tariffs as factors that could boost XRP’s demand and lead to higher prices for the altcoin. 

He expects the CLARITY Act to boost XRP’s demand, especially with Trump’s Crypto Czar predicting that more banks will enter into crypto once the bill passes. X Finance Bull predicts that XRP will be the token of choice for these banks based on his belief that Ripple will provide the rails to onboard them. 

XRP Breaking Out Of Multi-Year Triangle

Crypto analyst XForce revealed in an X post that XRP is breaking out of the largest 6+ year triangle in history, yet people are calling it a fakeout. He added that he is not a permabull or permanbear on the altcoin but that he follows trends and plays macro breakout patterns. His accompanying chart indicated that XRP was on the verge of a move to the upside, with a potential rally above $11.50. 

On the lower timeframe, crypto analyst Chart Nerd stated that XRP is currently breaking out of a two-week falling wedge structure. He noted that this is a bullish reversal pattern that could send the altcoin back to $2.40 in the short term, as this is where the wedge formed. He highlighted a key resistance between $2.13 and $2.20, which the altcoin will need to break above to confirm a reversal. 

At the time of writing, the XRP price is trading at around $1.92, up in the last 24 hours, according to data from CoinMarketCap.

XRP

Bitcoin Pattern From 2022 That Led To Crash To $20,000 Reappears

Bitcoin (BTC) is mirroring the same setup from its 2022 bull cycle, which led to a massive price crash to $20,000. According to market expert Crypto Bullet, this recurring structure could signal another major correction for BTC ahead. However, this time the leading cryptocurrency could give up almost a quarter of its current value. 

2022 Bitcoin Chart Pattern Signals Over 20% Crash

In his technical analysis released on X, Crypto Bullet revealed that Bitcoin is currently repeating a 2022 structure that could lead to a more than 20% decline in its value. To support his bearish outlook, the analyst presented a parallel chart comparing Bitcoin’s price action from 2023-2022 and 2025-2026, highlighting similar technical patterns, price behavior, and Moving Averages (MA). 

During the 2022 cycle, Bitcoin experienced a similar pattern, beginning with a test of the 100-day Moving Average (MA100), highlighted as the blue trendline on the chart. After facing rejection at that level, the price pulled back to a nearby support zone inside a rising channel. From there, BTC staged a sharp rally, surging to fresh highs around $48,500, where it aligned with the 200-day Moving Average (MA200), marked in orange. 

However, the recovery proved short-lived. Bitcoin soon reversed course and failed to reclaim the MA200 as support. Once the cryptocurrency’s price structure was lost, downside momentum accelerated, pushing the price into a much deeper correction toward the $20,000 level. 

According to Crypto Bullet, Bitcoin is repeating this exact pattern in 2026. It has already retested the MA100, gotten rejected, and moved lower into a support zone within a similar ascending channel. The chart also showed that in both cycles, BTC reached a “market cycle top,” first around December 2023 and then again in November 2025, before breaking down and entering a consolidation phase

Given how closely Bitcoin is mirroring its 2022 setup, Crypto Bullet has forecast another dramatic price crash, predicting a more than 23.5% drop from its current price near $89,500 to $68,450. Before this decline happens, the analyst expects BTC to experience a short-term recovery, potentially climbing back above the $100,000 psychological level to reach $102,000. 

Bitcoin Could Still Rally To $92,000

Crypto analyst Tyrex has stated that Bitcoin has been consolidating for the past 48 hours, with price holding above $89,000 for most of that period. Despite the muted price action, he believes that BTC could soon rally to $92,000. The analyst also noted that the broader market is in a state of fear, with many traders anticipating further declines in Bitcoin.

However, the analyst cautions that this expected drop may be a trap. He points out that an ascending channel is forming on Bitcoin’s chart, prompting him to adopt a more bullish outlook despite the prevailing bearish sentiment and sideways price movement.  

Featured image from Unsplash, chart from TradingView

Another Dogecoin ETF Has Gone Live For Trading, How Did It Perform?

The US crypto market has welcomed a new entrant as 21Shares rolls out its Spot Dogecoin ETF, giving investors another avenue to engage with the infamous dog-themed meme coin. Trading kicked off amid a mix of curiosity and caution, with on-chain data already showing how much the DOGE ETF has performed so far. 

21Shares Launches Dogecoin ETF

In a press release on Thursday, January 22, 21Shares announced the official launch of its Spot Dogecoin ETF, TDOG, which began trading on NASDAQ the same day. The new ETF provides investors with direct exposure to Dogecoin through a fully backed, regulated, and transparent vehicle. Each ETF share is also backed 1:1 by DOGE held in institutional-grade custody. 

Notably, the launch of the new TDOG ETF brings the total number of US Dogecoin ETFs to three, joining Grayscale’s GDOG and Bitwise’s BWOW. 21Shares is also the only ETF provider endorsed by House of Doge, the official corporate arm of the Dogecoin foundation, highlighting the global asset manager’s close ties to the meme coin. 

As one of the largest crypto ETF issuers, 21Shares continues to expand its crypto product lineup with the introduction of TDOG. This follows the investment company’s previous ETF offerings, including TSOL, a Solana ETF released in November 2025; ARKB, a Spot Bitcoin ETF launched in January 2024; and TETH, an Ethereum ETF introduced in July of the same year. Together, these products demonstrate 21Shares’ commitment to providing institutional-grade access to high-demand digital assets. 

Federick Brokate, Global Head of Business Development at 21Shares, highlighted DOGE’s large and active global community, calling it a unique digital asset with constantly growing use cases. He added that the new TDOG ETF will give investors regulated, physically backed exposure through a familiar ETF structure they know and trust. 

Marco Margiotta, the CEO of House of Doge, also shared comments on the recently launched 21Shares ETF. He said that TDOG is a step toward making Dogecoin easier to access through traditional financial systems. He also disclosed that House of Doge’s partnership with 21Shares will help more people get involved as the Dogecoin ecosystem grows. 

How 21Shares Dogecoin ETF Has Performed So Far

Contrary to expectations, 21Shares’ recently launched Dogecoin ETF saw weak performance on the first day of trading, signaling investors’ lack of interest in the investment product. Data from SoSoValue shows that TDOG experienced no inflows on January 22 and instead declined by about 0.07%. Despite it being the second day of trading, the DOGE ETF has still not registered any flows. 

Dogecoin

This lackluster performance has been observed across all Dogecoin ETFs this week. Grayscales’ GDOG and Bitwise BWOW have reported zero inflows over the last week. The last time GDOG saw positive activity was on January 8, when it received around $333,083 in investments. Before that, the ETF recorded its highest inflows on January 2, totaling roughly $2.3 million. Since its launch in November 2025, GDOG ETF inflows have been unstable, with more days of inactivity than significant investment. 

Dogecoin

XRP Price Recovery Is Possible If It Reclaims This Ichimoku Base

The XRP price may be preparing for a long-overdue recovery, as a crypto analyst has just highlighted a critical area that could flip the cryptocurrency’s downward momentum into a bullish one. According to the market expert, XRP must reclaim the Ichimoku Base before it can resume its upside to new levels. 

XRP Price Recovery To Resume Above Ichimoku Base

Market analyst Xaif Crypto took to X this Thursday to deliver a fresh weekly update on XRP as the cryptocurrency enters a pivotal technical area after months of downside pressure. The accompanying chart shows price retreating from a prior peak in late 2024 and sliding back into a clearly marked demand zone in the blue box. 

According to the analyst, the recent retreat follows a clear downtrend, with lower highs pushing price back toward a previous consolidation zone. This blue-box area represents the main battleground, as prior trading activity built a base that could act as support if XRP revisits that level. 

So far, XRP appears to be stabilizing within this demand zone. Candles on the chart show hesitation and reduced selling pressure. The chart also draws attention to an Ichimoku structure, with XRP attempting to reclaim its Ichimoku Base. According to Xaif Crypto, this base will determine XRP’s next big move.

XRP

The analyst has suggested that reclaiming this level could signal a potential shift in market sentiment. He disclosed that a strong close above it could favor upside continuation, weakening the ongoing downtrend and giving buyers more room to target upper resistance levels. Conversely, Xaif Crypto predicts that a break below the Ichimoku Base would likely lead to a deeper correction for XRP, as support would be lost and selling could accelerate. 

For now, XRP sits at a make-or-break level that could decide whether it recovers from its current slump. Xaif Crypto’s chart has outlined potential targets if the cryptocurrency manages to reclaim and hold above the Ichimoku Base. Currently hovering around $1.95, XRP faces potential bullish targets at $2.09, $2.20, $2.31, and $2.45. The analyst has also highlighted that traders and investors should closely watch the weekly close for confirmation of a sustained recovery.  

Analyst Says XRP Is Planning A Major Reversal

Despite dropping below $2 earlier this week, analysts remain optimistic about XRP’s price outlook. According to market expert Crypto GVR, XRP could be attempting a major price reversal from the $1-$1.5 range. Based on his chart analysis, the analyst predicts that XRP could decline first from its current price around $1.95 to roughly $1.13 before rebounding sharply to new highs.

He has set a bullish target at $3.25. marking the next upside for XRP. If XRP were to crash to $1.13 and then surge to $3.25, this would represent a staggering 187% increase in value. 

XRP

Ethereum Funding Rates Pushing Towards Negative: What’s Going On?

Ethereum is currently trading under pressure after failing to push above the $3,000 level again over the past 24 hours, a move that is reflecting trader sentiment across the derivatives markets. ETH is currently trading at $2,925, down 2.7% on the day, after moving within a 24-hour range capped at $3,012.99 and finding lows around $2,909.60, according to price data from CoinGecko. 

As price action weakens, a notable change has been developing, with on-chain data showing funding rates drifting toward negative territory and derivative positioning beginning to tilt more defensively.

Funding Rates Slide As Shorts Gain Ground

Ethereum’s failure to hold above $3,000 is an important psychological break for traders, especially after several failed attempts to hold above that level in January. Price action over the past week shows sellers maintaining control after ETH rejected around $3,360 on January 18, followed by a steady push lower toward the high-$2,900s. 

Although the pullback has so far been orderly above $2,900, this decline has come alongside fading momentum across the derivatives market.

One of the clearest signals for this can be seen in Ethereum’s OI-weighted funding rate, which has been steadily compressing and is now edging toward negative levels. At the time of writing, Ethereum’s OI-weighted is at 0.0008%, close to breaking into negative territory and far below readings around 0.009%, which it registered earlier in the month.

Ethereum

Funding rates turning negative typically indicate that short positions are paying longs, meaning stronger demand for downside exposure. Funding spikes that previously accompanied the price rebound in early January have faded, and the overall trend suggests bearish positioning is slowly gaining the upper hand.

Open Interest, Liquidations, And What’s Next

Although Ethereum’s price action fell below $3,000, derivatives traders have stayed in the market, keeping total open interest at high levels. Data from CoinGlass shows aggregate Ethereum open interest increasing by 0.68% in the past 24 hours, which shows that many traders are not exiting Ethereum entirely. At the time of writing, the total open interest is sitting at about 13.36 million ETH, equivalent to roughly $39.19 billion.

Looking across major exchanges, Binance has the largest share of ETH open interest, accounting for about $8.95 billion, but it is down by 0.8% in the past 24 hours. CME follows with approximately $5.73 billion in open interest, up by 3.72% in the past 24 hours. Gate comes next at around $4.01 billion, while MEXC comes in close at $3.51 billion worth of ETH open interest.

Over the past 24 hours, Ethereum liquidations totaled $64.34 million, with long positions ($52.52 million) accounting for the majority of losses.

A hold above $2,900 could allow Ethereum’s funding rates to normalize and open the door for another rebound attempt to $3,000. However, a continued fall in funding rates into negative territory could see bearish control pushing Ethereum below $2,900.

Ethereum

XRP Price Obliteration Is Not A Matter Of If, New All-Time Highs Are Coming

XRP’s price action over the past several days has been tight and uneasy in a way that tends to make traders impatient. XRP is now drifting sideways just below $2, compressing into a narrower range between $1.9 and $1.96. To some, this looks like weakness. 

To others, it looks like upside pressure is building. One technical analyst believes XRP’s price action is approaching a moment that could redefine the entire structure. That view was shared on X by crypto analyst Archie, who noted that its current consolidation is a precursor to a violent breakout that will send its price into new all-time highs.

Why The Current XRP Structure Matters

According to the technical analysis in question, XRP has been carving out a tightening pattern directly beneath a descending trendline that has acted as resistance since the beginning of the year. XRP printed a higher high of $2.4 in early January, retraced, and then began compressing into a narrow range of lower highs on the 30-minute candlestick chart. 

The chart shows how the token has repeatedly respected the trendline without collapsing below support at $1.9. This, in turn, has created what Archie describes as a coil right under the resistance trendline. Interestingly, this kind of structure tends to resolve quickly once price makes contact with the trendline again. 

Trendline Obliteration And The Push Beyond $2

According to the analyst’s prediction, the next touch of the trendline will not be another rejection. Instead, the next touch will lead to a clean break that sends XRP decisively through $2, which is a little more than a checkpoint. From his perspective, the repeated tests of resistance have weakened it, increasing the probability of a breakout as opposed to another downward rejection.

At the time of writing, the altcoin is trading at $1.91, down by 2.6% in the past 24 hours. However, looking closely at the chart Archie shared gives structure to what to expect once the trendline breaks.

XRP

The first level is just above the descending trendline itself, around the $2.00 to $2.05 region. In the context of the chart, a clean move through this level is what flips the structure from compression below resistance into expansion above resistance.

Above that, the next highlighted resistance is just below $2.20. The chart then shows a broader resistance cluster between roughly $2.35 and $2.40. Reaching and breaking above this zone is much more significant, as it would show that the breakout is a genuine trend reversal.

At the top end of the projection, the highest marked region is around $2.60. This zone appears to be the final upside target shown on the chart and would place XRP firmly into price discovery territory relative to recent structure.

XRP

How Donald Trump’s Latest Crypto Move Will Boost Demand For XRP

Crypto pundit X Finance Bull has explained how Donald Trump’s push to sign the crypto bill into law will boost demand for XRP. This follows White House Crypto Czar David Sack’s prediction about how banks will come into crypto once the CLARITY Act passes.

How Donald Trump’s Crypto Push Will Boost XRP’s Demand

In an X post, X Finance Bull shared a video in which Donald Trump’s crypto adviser, David Sacks, stated that banks will begin to adopt crypto once the crypto bill passes. The pundit noted that this means banks are already positioned, while Ripple has the stack and XRP has the liquidity, and the rails are in place. As such, he believes that the token will be the go-to crypto once these banks enter the crypto industry. 

X Finance Bull further mentioned that institutions that have been waiting over the past few years will return and announce their buys and use of XRP once Donald Trump signs the CLARITY Act into law. The pundit added that this moment resets who is early and that he never needed hype to hold the altcoin. “Research and study were always enough,” he said. 

X Finance Bull also questioned why market participants were panic-selling if banks are going all in once Donald Trump signs the crypto bill into law. The pundit’s statements come just as Ripple partnered with DXC to integrate the token and RLUSD into DXC’s Hogan core banking platform. 

The banking platform powers more than 300 million deposit accounts and over $5 trillion in deposits globally. As such, this is a major step in XRP’s adoption, as the partnership will integrate Ripple’s payment technology into large-scale banking environments.

Trump’s Tariff Move Will Also Boost The Altcoin

In another X post, X Finance Bull claimed that Donald Trump’s move with tariffs will also boost XRP’s demand.  He shared a video of how the U.S. president said that $18 trillion is flowing into the U.S. economy thanks to these tariffs. The pundit asserted that such money flows put pressure on banks, payroll systems, FX rails, and settlement speed. 

X Finance Bull further noted that this creates nonstop cross-border payments and liquidity needs, and this is where Ripple and XRP come in. He explained that while old rails leak money, Ripple and the altcoin were built to stop that. The pundit also alluded to Ripple executives meeting with Donald Trump and to the token being mentioned as part of the digital asset stockpile. He added that the CLARITY Act is next and that when rules lock in, the U.S. capital will need U.S. rails. 

At the time of writing, the XRP price is trading at around $1.92, down almost 2% in the last 24 hours, according to data from CoinMarketCap.

XRP

Here’s Why The Bitcoin, Ethereum, And Solana Prices Are Still Crashing Hard

Crypto researcher Axel has provided insights into why the Bitcoin, Ethereum, and Solana prices are still crashing. This comes as BTC continues to see a supply overhang, which threatens to put more downward pressure on crypto prices. 

Why The Bitcoin, Ethereum, and Solana Prices Are Still Crashing

In a research report, Axel noted that anomalous exchange inflows accompanied the BTC breakdown below the $90,000 zone as sellers prepared in advance. The market is also still at risk of further selling pressure as the 1.0 level of the short-term holders’ SOPR is now acting as a resistance rather than support. As such, there is a possibility that Bitcoin, Ethereum, and Solana prices will decline further. 

Further commenting on Bitcoin netflows into exchanges, Axel noted that between January 20 and 21, almost 17,000 BTC flowed into exchanges, coinciding with BTC dropping to as low as $87,000, while Ethereum and Solana prices also dropped. The crypto researcher explained that these anomalously high values followed a period of predominantly negative netflow in the first half of this month. 

Bitcoin

In the context of the falling Bitcoin price, Axel stated that such a spike is more likely to reflect supply preparation than neutral transfers. In other words, the breakdown below $90,000 appears to be structural rather than emotional. Meanwhile, Bitcoin netflow returned to neutral levels yesterday, but the accumulated inflow still creates a supply overhang, which could lead to further declines in the prices of Bitcoin, Ethereum, and Solana. 

Axel noted that a signal of improvement would be if netflow turns negative again amid rising prices, which could indicate that the overhang has cleared. However, with the short-term holders’ 7-day SMA SOPR below 0.996, the crypto researcher suggested that BTC faces increased selling pressure on every recovery as these holders look to sell at breakeven. He added that a reversal trigger could be confirmed if the SOPR breaks above 1.0 from below, with the 7-day SMA holding unity for three to five days to filter out false spikes after the selloff. 

Why A Break Above $100,000 Looks Unlikely For Now

In its latest research report, on-chain analytics platform Glassnode explained that a Bitcoin rally above $100,000 looks unlikely for now as the supply overhang persists. They noted how this overhang supply above $98,000 remains the dominant sell-side force capping short to mid-term rebounds. 

Alluding to the Unspent Realized Price Distribution metric, Glassnode noted that the recent BTC rally has partially filled the prior air gap between $93,000 and $98,000, driven by redistribution from top buyers into newer market participants. 

However, the unresolved supply overhang is expected to likely cap attempts above the $98,400 short-term holders’ cost basis and the $100,000 level. A meaningful and sustained acceleration in demand momentum is said to be required for a clean breakout above $100,000 to occur.

Bitcoin

Bitcoin Price Following The 2022 Fractal? Here Was The Previous Outcome

Technical analysis shared by crypto analyst CryptoBullet on X highlighted a familiar price action that suggests that Bitcoin’s current structure may be closely tracking a 2022 price fractal. 

Bitcoin’s price action in recent days has changed into a more fragile posture, with the cryptocurrency falling back below the psychological $90,000 level after failing to sustain higher ground above $97,000 on January 14.

How Bitcoin’s Current Structure Resembles The 2022 Fractal

According to CryptoBullet, Bitcoin’s present price action is closely following an interesting structure that it previously played out in 2022. Technical analysis on the daily candlestick timeframe chart posted by the analyst shows the earlier 2022 move as a transparent projection layered behind current price action, with a striking similarity in both rhythm and volatility. 

As it stands, Bitcoin has experienced a significant 28.7% pullback from its October 2025 peak and is now trading in a choppy consolidation, a behavior that closely matches the early stages of the 2022 downturn.

Bitcoin

CryptoBullet noted, however, that there is an important distinction. During the 2022 decline, Bitcoin had already tested the 50-week moving average and the 200-day moving average at this stage of the cycle. In the current setup, Bitcoin’s price action is trading below those levels but has not yet made a direct test, and this means that the structure may still be incomplete.

What The 2022 Outcome Predicts For Bitcoin’s Next Move

The projection in the background of the chart shows Bitcoin making one more push higher over the coming month, briefly reclaiming levels above $100,000 before running into a strong resistance at the 50-week moving average.

If this scenario plays out, the move would resemble the final relief rally seen in 2022, where the price rallied into long-term resistance before rolling over. CryptoBullet noted that timing also supports this idea, noting that considering the 2022 top is lined up with the October 2025 top, there appears to be roughly one month of price action left for a final leg up. 

The projection is that Bitcoin pushes to at least $100,000 again sometime in February 2026. However, support must hold above $83,000 in order for this bullish portion of the setup to be valid.

Although the short-term projection is bullish, the broader implication of the 2022 fractal is bearish for the mid-term. According to the chart’s projected path, Bitcoin is shown rejecting at the 50-week moving average after a brief rally, followed by a sustained decline that eventually drags its price action below $71,500. 

This prediction is based on exactly what unfolded in 2022, when a final pump gave way to a deeper corrective phase. That said, fractals are guides, not guarantees, meaning price history may rhyme, but it does not always repeat itself exactly.

Bitcoin

❌