SANTA CLARA, Calif., Jan 22, 2026 – Recently, International Data Corporation (IDC) released the report “China Large Language Model (LLM) Security Assessment Platform Vendor Technology Evaluation” (Doc#CHC53839325, October 2025). NSFOCUS was selected for this report based on its proven product performance and LLM security assessment methodology. With a comprehensive capability matrix built across model security, data […]
If you’re a penetration tester, you know that lateral movement is becoming increasingly difficult, especially in well-defended environments. One common technique for remote command execution has been the use of DCOM objects.
Over the years, many different DCOM objects have been discovered. Some rely on native Windows components, others depend on third-party software such as Microsoft Office, and some are undocumented objects found through reverse engineering. While certain objects still work, others no longer function in newer versions of Windows.
This research presents a previously undescribed DCOM object that can be used for both command execution and potential persistence. This new technique abuses older initial access and persistence methods through Control Panel items.
First, we will discuss COM technology. After that, we will review the current state of the Impacket dcomexec script, focusing on objects that still function, and discuss potential fixes and improvements, then move on to techniques for enumerating objects on the system. Next, we will examine Control Panel items, how adversaries have used them for initial access and persistence, and how these items can be leveraged through a DCOM object to achieve command execution.
Finally, we will cover detection strategies to identify and respond to this type of activity.
COM/DCOM technology
What is COM?
COM stands for Component Object Model, a Microsoft technology that defines a binary standard for interoperability. It enables the creation of reusable software components that can interact at runtime without the need to compile COM libraries directly into an application.
These software components operate in a client–server model. A COM object exposes its functionality through one or more interfaces. An interface is essentially a collection of related member functions (methods).
COM also enables communication between processes running on the same machine by using local RPC (Remote Procedure Call) to handle cross-process communication.
Terms
To ensure a better understanding of its structure and functionality, let’s revise COM-related terminology.
COM interface A COM interface defines the functionality that a COM object exposes. Each COM interface is identified by a unique GUID known as the IID (Interface ID). All COM interfaces can be found in the Windows Registry under HKEY_CLASSES_ROOT\Interface, where they are organized by GUID.
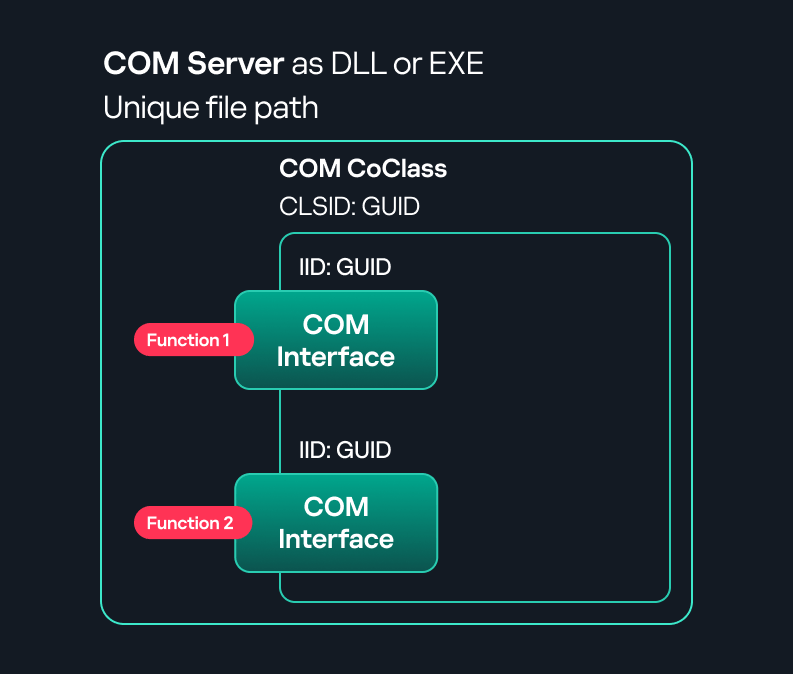
COM class (COM CoClass) A COM class is the actual implementation of one or more COM interfaces. Like COM interfaces, classes are identified by unique GUIDs, but in this case the GUID is called the CLSID (Class ID). This GUID is used to locate the COM server and activate the corresponding COM class.
All COM classes must be registered in the registry under HKEY_CLASSES_ROOT\CLSID, where each class’s GUID is stored. Under each GUID, you may find multiple subkeys that serve different purposes, such as:
InprocServer32/LocalServer32: Specifies the system path of the COM server where the class is defined. InprocServer32 is used for in-process servers (DLLs), while LocalServer32 is used for out-of-process servers (EXEs). We’ll describe this in more detail later.
ProgID: A human-readable name assigned to the COM class.
TypeLib: A binary description of the COM class (essentially documentation for the class).
AppID: Used to describe security configuration for the class.
COM server A COM is the module where a COM class is defined. The server can be implemented as an EXE, in which case it is called an out-of-process server, or as a DLL, in which case it is called an in-process server. Each COM server has a unique file path or location in the system. Information about COM servers is stored in the Windows Registry. The COM runtime uses the registry to locate the server and perform further actions. Registry entries for COM servers are located under the HKEY_CLASSES_ROOT root key for both 32- and 64-bit servers.
Component Object Model implementation
Client–server model
In-process server In the case of an in-process server, the server is implemented as a DLL. The client loads this DLL into its own address space and directly executes functions exposed by the COM object. This approach is efficient since both client and server run within the same process.
In-process COM server
Out-of-process server Here, the server is implemented and compiled as an executable (EXE). Since the client cannot load an EXE into its address space, the server runs in its own process, separate from the client. Communication between the two processes is handled via ALPC (Advanced Local Procedure Call) ports, which serve as the RPC transport layer for COM.
Out-of-process COM server
What is DCOM?
DCOM is an extension of COM where the D stands for Distributed. It enables the client and server to reside on different machines. From the user’s perspective, there is no difference: DCOM provides an abstraction layer that makes both the client and the server appear as if they are on the same machine.
Under the hood, however, COM uses TCP as the RPC transport layer to enable communication across machines.
Distributed COM implementation
Certain requirements must be met to extend a COM object into a DCOM object. The most important one for our research is the presence of the AppID subkey in the registry, located under the COM CLSID entry.
The AppID value contains a GUID that maps to a corresponding key under HKEY_CLASSES_ROOT\AppID. Several subkeys may exist under this GUID. Two critical ones are:
These registry settings grant remote clients permissions to activate and interact with DCOM objects.
Lateral movement via DCOM
After attackers compromise a host, their next objective is often to compromise additional machines. This is what we call lateral movement. One common lateral movement technique is to achieve remote command execution on a target machine. There are many ways to do this, one of which involves abusing DCOM objects.
In recent years, many DCOM objects have been discovered. This research focuses on the objects exposed by the Impacket script dcomexec.py that can be used for command execution. More specifically, three exposed objects are used: ShellWindows, ShellBrowserWindow and MMC20.
ShellWindows
ShellWindows was one of the first DCOM objects to be identified. It represents a collection of open shell windows and is hosted by explorer.exe, meaning any COM client communicates with that process.
In Impacket’s dcomexec.py, once an instance of this COM object is created on a remote machine, the script provides a semi-interactive shell.
Each time a user enters a command, the function exposed by the COM object is called. The command output is redirected to a file, which the script retrieves via SMB and displays back to simulate a regular shell.
Internally, the script runs this command when connecting:
cmd.exe /Q /c cd \ 1> \\127.0.0.1\ADMIN$\__17602 2>&1
This sets the working directory to C:\ and redirects the output to the ADMIN$ share under the filename __17602. After that, the script checks whether the file exists; if it does, execution is considered successful and the output appears as if in a shell.
When running dcomexec.py against Windows 10 and 11 using the ShellWindows object, the script hangs after confirming SMB connection initialization and printing the SMB banner. As I mentioned in my personal blog post, it appears that this DCOM object no longer has permission to write to the ADMIN$ share. A simple fix is to redirect the output to a directory the DCOM object can write to, such as the Temp folder. The Temp folder can then be accessed under the same ADMIN$ share. A small change in the code resolves the issue. For example:
ShellBrowserWindow
The ShellBrowserWindow object behaves almost identically to ShellWindows and exhibits the same behavior on Windows 10. The same workaround that we used for ShellWindows applies in this case. However, on Windows 11, this object no longer works for command execution.
MMC20
The MMC20.Application COM object is the automation interface for Microsoft Management Console (MMC). It exposes methods and properties that allow MMC snap-ins to be automated.
This object has historically worked across all Windows versions. Starting with Windows Server 2025, however, attempting to use it triggers a Defender alert, and execution is blocked.
As shown in earlier examples, the dcomexec.py script writes the command output to a file under ADMIN$, with a filename that begins with __:
OUTPUT_FILENAME = '__' + str(time.time())[:5]
Defender appears to check for files written under ADMIN$ that start with __, and when it detects one, it blocks the process and alerts the user. A quick fix is to simply remove the double underscores from the output filename.
Another way to bypass this issue is to use the same workaround used for ShellWindows – redirecting the output to the Temp folder. The table below outlines the status of these objects across different Windows versions.
Windows Server 2025
Windows Server 2022
Windows 11
Windows 10
ShellWindows
Doesn’t work
Doesn’t work
Works but needs a fix
Works but needs a fix
ShellBrowserWindow
Doesn’t work
Doesn’t work
Doesn’t work
Works but needs a fix
MMC20
Detected by Defender
Works
Works
Works
Enumerating COM/DCOM objects
The first step to identifying which DCOM objects could be used for lateral movement is to enumerate them. By enumerating, I don’t just mean listing the objects. Enumeration involves:
Finding objects and filtering specifically for DCOM objects.
Identifying their interfaces.
Inspecting the exposed functions.
Automating enumeration is difficult because most COM objects lack a type library (TypeLib). A TypeLib acts as documentation for an object: which interfaces it supports, which functions are exposed, and the definitions of those functions. Even when TypeLibs are available, manual inspection is often still required, as we will explain later.
There are several approaches to enumerating COM objects depending on their use cases. Next, we’ll describe the methods I used while conducting this research, taking into account both automated and manual methods.
Automation using PowerShell In PowerShell, you can use .NET to create and interact with DCOM objects. Objects can be created using either their ProgID or CLSID, after which you can call their functions (as shown in the figure below).
Shell.Application COM object function list in PowerShell
Under the hood, PowerShell checks whether the COM object has a TypeLib and implements the IDispatch interface. IDispatch enables late binding, which allows runtime dynamic object creation and function invocation. With these two conditions met, PowerShell can dynamically interact with COM objects at runtime.
Our strategy looks like this:
As you can see in the last box, we perform manual inspection to look for functions with names that could be of interest, such as Execute, Exec, Shell, etc. These names often indicate potential command execution capabilities.
However, this approach has several limitations:
TypeLib requirement: Not all COM objects have a TypeLib, so many objects cannot be enumerated this way.
IDispatch requirement: Not all COM objects implement the IDispatch interface, which is required for PowerShell interaction.
Interface control: When you instantiate an object in PowerShell, you cannot choose which interface the instance will be tied to. If a COM class implements multiple interfaces, PowerShell will automatically select the one marked as [default] in the TypeLib. This means that other non-default interfaces, which may contain additional relevant functionality, such as command execution, could be overlooked.
Automation using C++ As you might expect, C++ is one of the languages that natively supports COM clients. Using C++, you can create instances of COM objects and call their functions via header files that define the interfaces.However, with this approach, we are not necessarily interested in calling functions directly. Instead, the goal is to check whether a specific COM object supports certain interfaces. The reasoning is that many interfaces have been found to contain functions that can be abused for command execution or other purposes.
This strategy primarily relies on an interface called IUnknown. All COM interfaces should inherit from this interface, and all COM classes should implement it.The IUnknown interface exposes three main functions. The most important is QueryInterface(), which is used to ask a COM object for a pointer to one of its interfaces.So, the strategy is to:
Enumerate COM classes in the system by reading CLSIDs under the HKEY_CLASSES_ROOT\CLSID key.
Check whether they support any known valuable interfaces. If they do, those classes may be leveraged for command execution or other useful functionality.
This method has several advantages:
No TypeLib dependency: Unlike PowerShell, this approach does not require the COM object to have a TypeLib.
Use of IUnknown: In C++, you can use the QueryInterface function from the base IUnknown interface to check if a particular interface is supported by a COM class.
No need for interface definitions: Even without knowing the exact interface structure, you can obtain a pointer to its virtual function table (vtable), typically cast as a void*. This is enough to confirm the existence of the interface and potentially inspect it further.
The figure below illustrates this strategy:
This approach is good in terms of automation because it eliminates the need for manual inspection. However, we are still only checking well-known interfaces commonly used for lateral movement, while potentially missing others.
Manual inspection using open-source tools
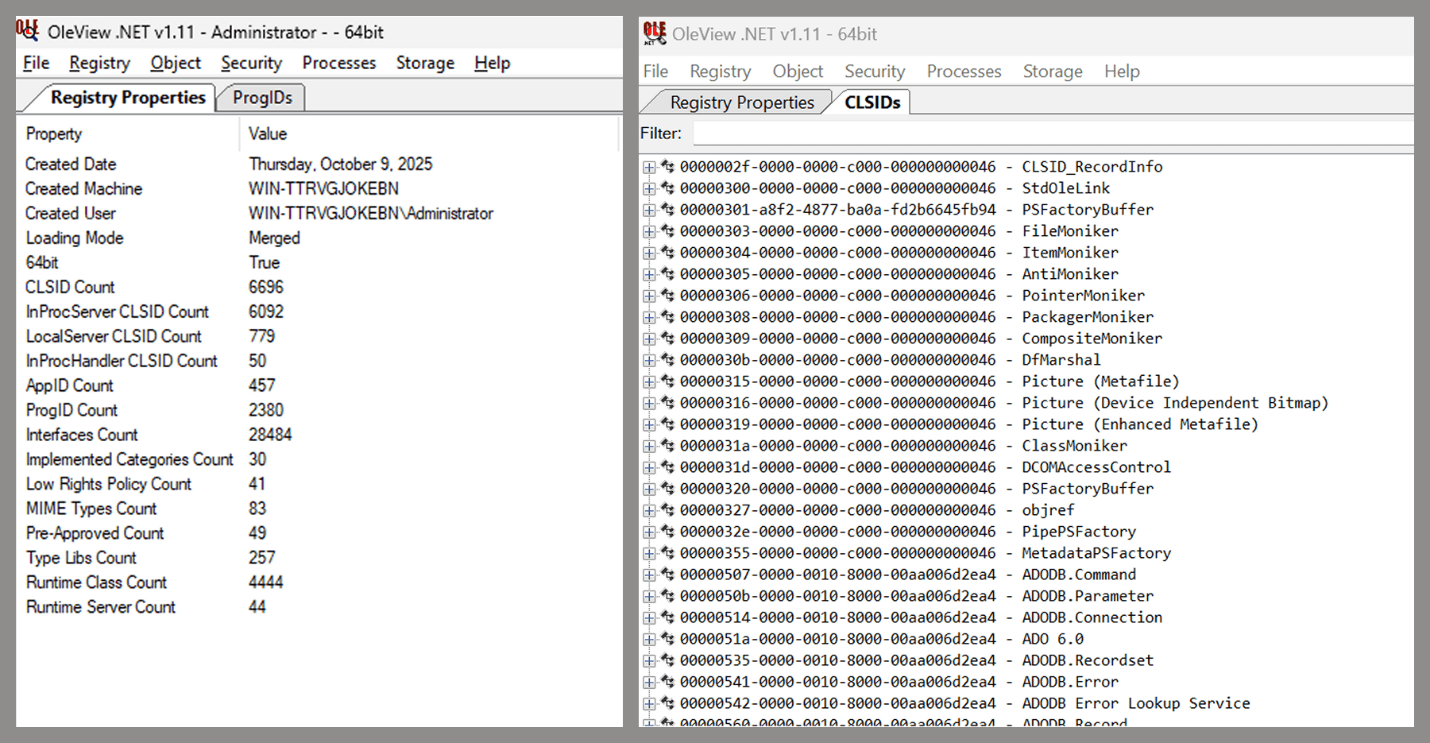
As you can see, automation can be difficult since it requires several prerequisites and, in many cases, still ends with a manual inspection. An alternative approach is manual inspection using a tool called OleViewDotNet, developed by James Forshaw. This tool allows you to:
List all COM classes in the system.
Create instances of those classes.
Check their supported interfaces.
Call specific functions.
Apply various filters for easier analysis.
Perform other inspection tasks.
Open-source tool for inspecting COM interfaces
One of the most valuable features of this tool is its naming visibility. OleViewDotNet extracts the names of interfaces and classes (when available) from the Windows Registry and displays them, along with any associated type libraries.
This makes manual inspection easier, since you can analyze the names of classes, interfaces, or type libraries and correlate them with potentially interesting functionality, for example, functions that could lead to command execution or persistence techniques.
Control Panel items as attack surfaces
Control Panel items allow users to view and adjust their computer settings. These items are implemented as DLLs that export the CPlApplet function and typically have the .cpl extension. Control Panel items can also be executables, but our research will focus on DLLs only.
Control Panel items
Attackers can abuse CPL files for initial access. When a user executes a malicious .cpl file (e.g., delivered via phishing), the system may be compromised – a technique mapped to MITRE ATT&CK T1218.002.
Adversaries may also modify the extensions of malicious DLLs to .cpl and register them in the corresponding locations in the registry.
Under HKEY_CURRENT_USER:
HKCU\Software\Microsoft\Windows\CurrentVersion\Control Panel\Cpls
Under HKEY_LOCAL_MACHINE:
For 64-bit DLLs:
HKLM\Software\Microsoft\Windows\CurrentVersion\Control Panel\Cpls
For 32-bit DLLs:
HKLM\Software\WOW6432Node\Microsoft\Windows\CurrentVersion\Control Panel\Cpls
These locations are important when Control Panel DLLs need to be available to the current logged-in user or to all users on the machine. However, the “Control Panel” subkey and its “Cpls” subkey under HKCU should be created manually, unlike the “Control Panel” and “Cpls” subkeys under HKLM, which are created automatically by the operating system.
Once registered, the DLL (CPL file) will load every time the Control Panel is opened, enabling persistence on the victim’s system.
It’s worth noting that even DLLs that do not comply with the CPL specification, do not export CPlApplet, or do not have the .cpl extension can still be executed via their DllEntryPoint function if they are registered under the registry keys listed above.
There are multiple ways to execute Control Panel items:
This calls the Control_RunDLL function from shell32.dll, passing the CPL file as an argument. Everything inside the CPlApplet function will then be executed.
However, if the CPL file has been registered in the registry as shown earlier, then every time the Control Panel is opened, the file is loaded into memory through the COM Surrogate process (dllhost.exe):
COM Surrogate process loading the CPL file
What happened was that a Control Panel with a COM client used a COM object to load these CPL files. We will talk about this COM object in more detail later.
The COM Surrogate process was designed to host COM server DLLs in a separate process rather than loading them directly into the client process’s address space. This isolation improves stability for the in-process server model. This hosting behavior can be configured for a COM object in the registry if you want a COM server DLL to run inside a separate process because, by default, it is loaded in the same process.
‘DCOMing’ through Control Panel items
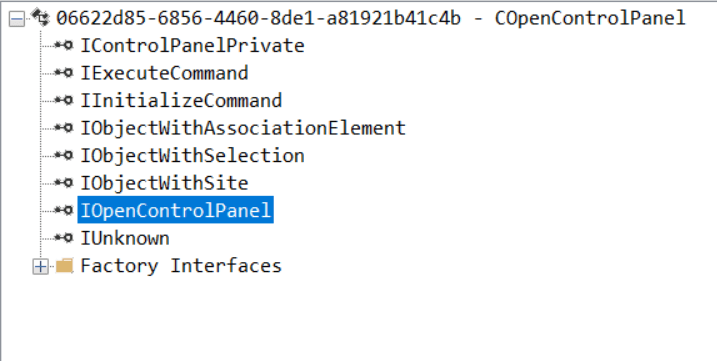
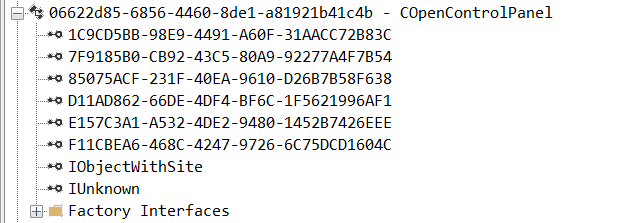
While following the manual approach of enumerating COM/DCOM objects that could be useful for lateral movement, I came across a COM object called COpenControlPanel, which is exposed through shell32.dll and has the CLSID {06622D85-6856-4460-8DE1-A81921B41C4B}. This object exposes multiple interfaces, one of which is IOpenControlPanel with IID {D11AD862-66DE-4DF4-BF6C-1F5621996AF1}.
IOpenControlPanel interface in the OleViewDotNet output
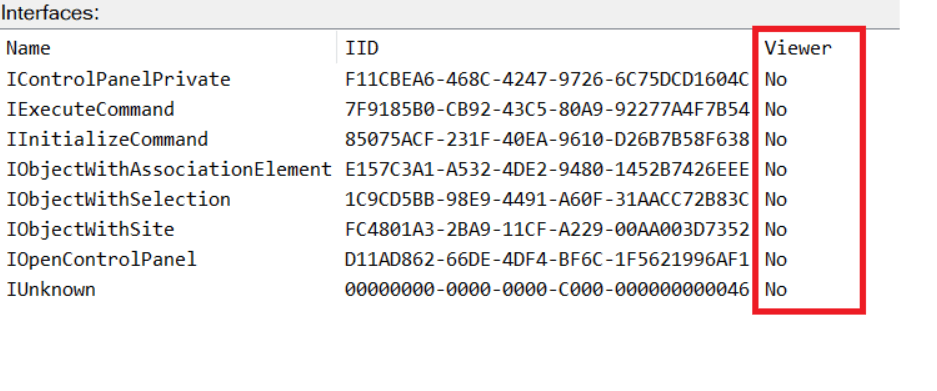
I immediately thought of its potential to compromise Control Panel items, so I wanted to check which functions were exposed by this interface. Unfortunately, neither the interface nor the COM class has a type library.
COpenControlPanel interfaces without TypeLib
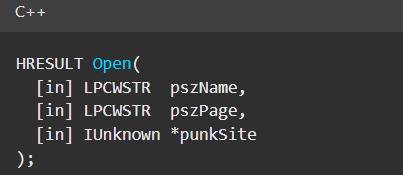
Normally, checking the interface definition would require reverse engineering, so at first, it looked like we needed to take a different research path. However, it turned out that the IOpenControlPanel interface is documented on MSDN, and according to the documentation, it exposes several functions. One of them, called Open, allows a specified Control Panel item to be opened using its name as the first argument.
Full type and function definitions are provided in the shobjidl_core.h Windows header file.
Open function exposed by IOpenControlPanel interface
It’s worth noting that in newer versions of Windows (e.g., Windows Server 2025 and Windows 11), Microsoft has removed interface names from the registry, which means they can no longer be identified through OleViewDotNet.
COpenControlPanel interfaces without names
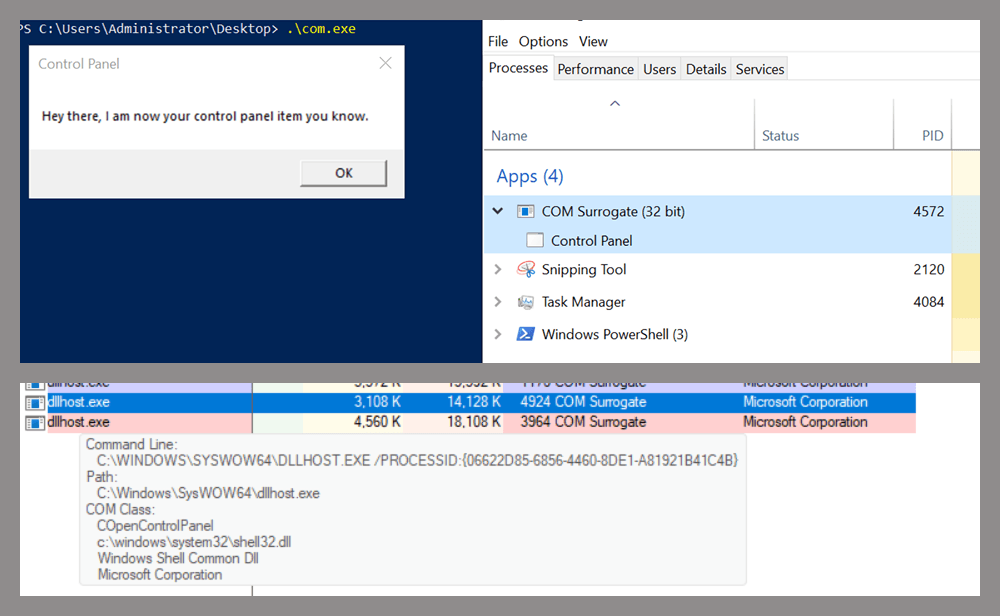
Returning to the COpenControlPanel COM object, I found that the Open function can trigger a DLL to be loaded into memory if it has been registered in the registry. For the purposes of this research, I created a DLL that basically just spawns a message box which is defined under the DllEntryPoint function. I registered it under HKCU\Software\Microsoft\Windows\CurrentVersion\Control Panel\Cpls and then created a simple C++ COM client to call the Open function on this interface.
As expected, the DLL was loaded into memory. It was hosted in the same way that it would be if the Control Panel itself was opened: through the COM Surrogate process (dllhost.exe). Using Process Explorer, it was clear that dllhost.exe loaded my DLL while simultaneously hosting the COpenControlPanel object along with other COM objects.
COM Surrogate loading a custom DLL and hosting the COpenControlPanel object
Based on my testing, I made the following observations:
The DLL that needs to be registered does not necessarily have to be a .cpl file; any DLL with a valid entry point will be loaded.
The Open() function accepts the name of a Control Panel item as its first argument. However, it appears that even if a random string is supplied, it still causes all DLLs registered in the relevant registry location to be loaded into memory.
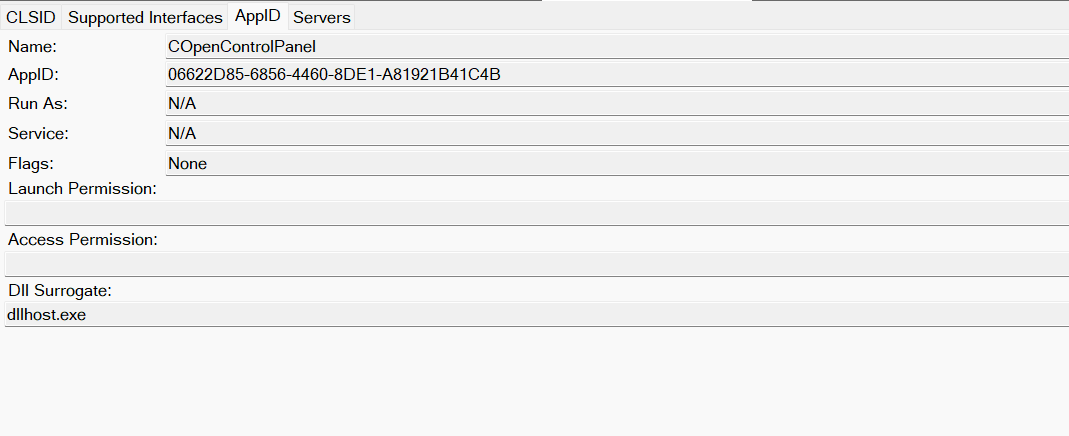
Now, what if we could trigger this COM object remotely? In other words, what if it is not just a COM object but also a DCOM object? To verify this, we checked the AppID of the COpenControlPanel object using OleViewDotNet.
COpenControlPanel object in OleViewDotNet
Both the launch and access permissions are empty, which means the object will follow the system’s default DCOM security policy. By default, members of the Administrators group are allowed to launch and access the DCOM object.
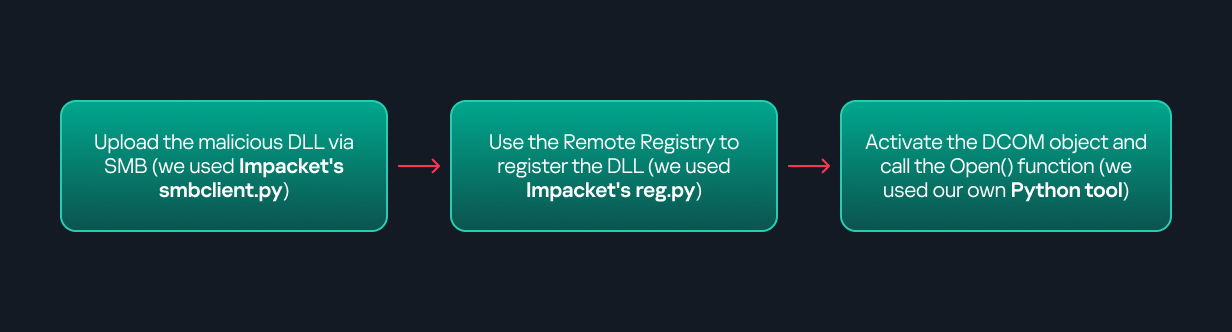
Based on this, we can build a remote strategy. First, upload the “malicious” DLL, then use the Remote Registry service to register it in the appropriate registry location. Finally, use a trigger acting as a DCOM client to remotely invoke the Open() function, causing our DLL to be loaded. The diagram below illustrates the flow of this approach.
Malicious DLL loading using DCOM
The trigger can be written in either C++ or Python, for example, using Impacket. I chose Python because of its flexibility. The trigger itself is straightforward: we define the DCOM class, the interface, and the function to call. The full code example can be found here.
Once the trigger runs, the behavior will be the same as when executing the COM client locally: our DLL will be loaded through the COM Surrogate process (dllhost.exe).
As you can see, this technique not only achieves command execution but also provides persistence. It can be triggered in two ways: when a user opens the Control Panel or remotely at any time via DCOM.
Detection
The first step in detecting such activity is to check whether any Control Panel items have been registered under the following registry paths:
Although commonly known best practices and research papers regarding Windows security advise monitoring only the first subkey, for thorough coverage it is important to monitor all of the above.
In addition, monitoring dllhost.exe (COM Surrogate) for unusual COM objects such as COpenControlPanel can provide indicators of malicious activity.
Finally, it is always recommended to monitor Remote Registry usage because it is commonly abused in many types of attacks, not just in this scenario.
Conclusion
In conclusion, I hope this research has clarified yet another attack vector and emphasized the importance of implementing hardening practices. Below are a few closing points for security researchers to take into account:
As shown, DCOM represents a large attack surface. Windows exposes many DCOM classes, a significant number of which lack type libraries – meaning reverse engineering can reveal additional classes that may be abused for lateral movement.
Changing registry values to register malicious CPLs is not good practice from a red teaming ethics perspective. Defender products tend to monitor common persistence paths, but Control Panel applets can be registered in multiple registry locations, so there is always a gap that can be exploited.
Bitness also matters. On x64 systems, loading a 32-bit DLL will spawn a 32-bit COM Surrogate process (dllhost.exe *32). This is unusual on 64-bit hosts and therefore serves as a useful detection signal for defenders and an interesting red flag for red teamers to consider.
We all encounter IoT and home automation in some form or another, from smart speakers to automated sensors that control water pumps. These services appear simple and straightforward to us, but many devices and protocols work together under the hood to deliver them.
One of those protocols is Zigbee. Zigbee is a low-power wireless protocol (based on IEEE 802.15.4) used by many smart devices to talk to each other. It’s common in homes, but is also used in industrial environments where hundreds or thousands of sensors may coordinate to support a process.
There are many guides online about performing security assessments of Zigbee. Most focus on the Zigbee you see in home setups. They often skip the Zigbee used at industrial sites, what I call ‘non-public’ or ‘industrial’ Zigbee.
In this blog, I will take you on a journey through Zigbee assessments. I’ll explain the basics of the protocol and map the attack surface likely to be found in deployments. I’ll also walk you through two realistic attack vectors that you might see in facilities, covering the technical details and common problems that show up in assessments. Finally, I will present practical ways to address these problems.
Zigbee introduction
Protocol overview
Zigbee is a wireless communication protocol designed for low-power applications in wireless sensor networks. Based on the IEEE 802.15.4 standard, it was created for short-range and low-power communication. Zigbee supports mesh networking, meaning devices can connect through each other to extend the network range. It operates on the 2.4 GHz frequency band and is widely used in smart homes, industrial automation, energy monitoring, and many other applications.
You may be wondering why there’s a need for Zigbee when Wi-Fi is everywhere? The answer depends on the application. In most home setups, Wi-Fi works well for connecting devices. But imagine you have a battery-powered sensor that isn’t connected to your home’s electricity. If it used Wi-Fi, its battery would drain quickly – maybe in just a few days – because Wi-Fi consumes much more power. In contrast, the Zigbee protocol allows for months or even years of uninterrupted work.
Now imagine an even more extreme case. You need to place sensors in a radiation zone where humans can’t go. You drop the sensors from a helicopter and they need to operate for months without a battery replacement. In this situation, power consumption becomes the top priority. Wi-Fi wouldn’t work, but Zigbee is built exactly for this kind of scenario.
Also, Zigbee has a big advantage if the area is very large, covering thousands of square meters and requiring thousands of sensors: it supports thousands of nodes in a mesh network, while Wi-Fi is usually limited to hundreds at most.
There are lots more ins and outs, but these are the main reasons Zigbee is preferred for large-scale, low-power sensor networks.
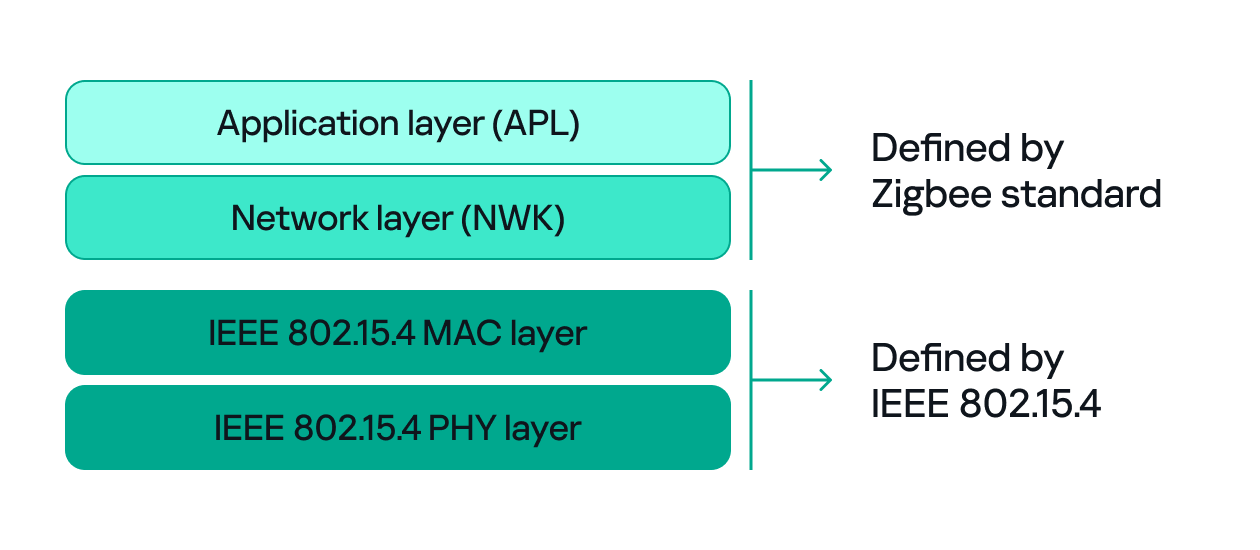
Since both Zigbee and IEEE 802.15.4 define wireless communication, many people confuse the two. The difference between them, to put it simply, concerns the layers they support. IEEE 802.15.4 defines the physical (PHY) and media access control (MAC) layers, which basically determine how devices send and receive data over the air. Zigbee (as well as other protocols like Thread, WirelessHART, 6LoWPAN, and MiWi) builds on IEEE 802.15.4 by adding the network and application layers that define how devices form a network and communicate.
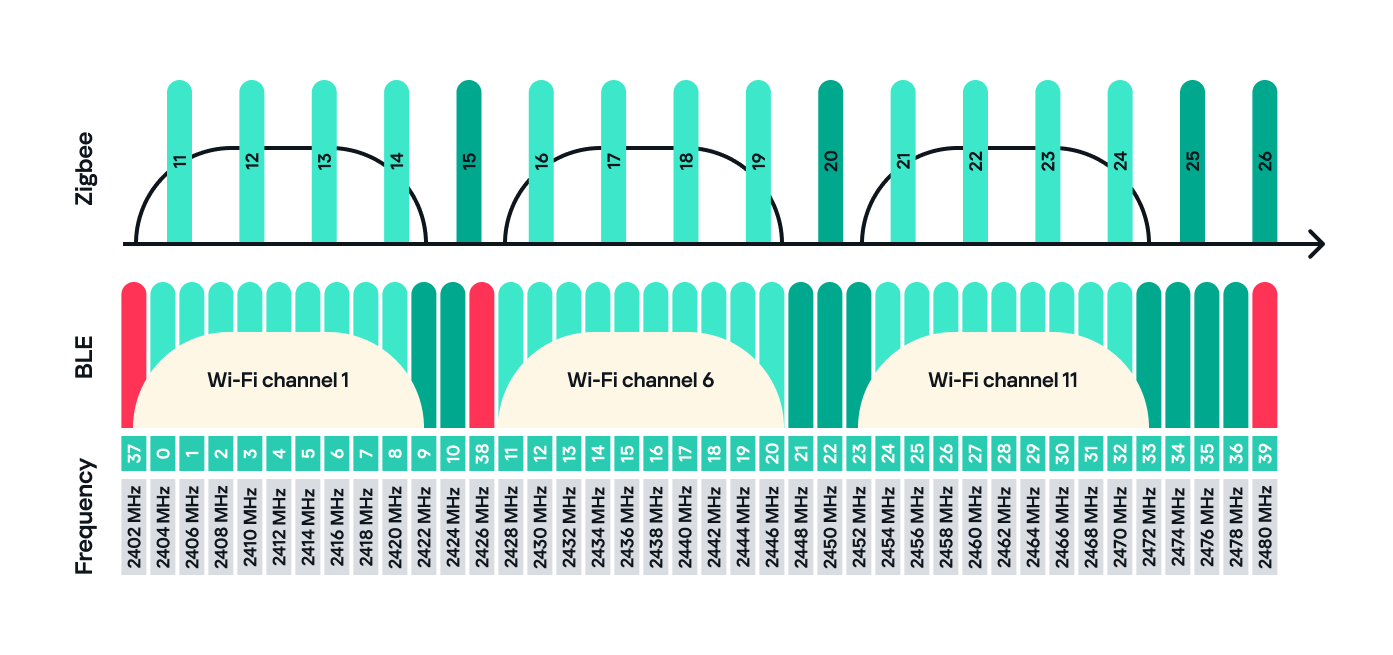
Zigbee operates in the 2.4 GHz wireless band, which it shares with Wi-Fi and Bluetooth. The Zigbee band includes 16 channels, each with a 2 MHz bandwidth and a 5 MHz gap between channels.
This shared frequency means Zigbee networks can sometimes face interference from Wi-Fi or Bluetooth devices. However, Zigbee’s low power and adaptive channel selection help minimize these conflicts.
Devices and network
There are three main types of Zigbee devices, each of which plays a different role in the network.
Zigbee coordinator
The coordinator is the brain of the Zigbee network. A Zigbee network is always started by a coordinator and can only contain one coordinator, which has the fixed address 0x0000.
It performs several key tasks:
Starts and manages the Zigbee network.
Chooses the Zigbee channel.
Assigns addresses to other devices.
Stores network information.
Chooses the PAN ID: a 2-byte identifier (for example, 0x1234) that uniquely identifies the network.
Sets the Extended PAN ID: an 8-byte value, often an ASCII name representing the network.
The coordinator can have child devices, which can be either Zigbee routers or Zigbee end devices.
Zigbee router
The router works just like a router in a traditional network: it forwards data between devices, extends the network range and can also accept child devices, which are usually Zigbee end devices.
Routers are crucial for building large mesh networks because they enable communication between distant nodes by passing data through multiple hops.
Zigbee end device
The end device, also referred to as a Zigbee endpoint, is the simplest and most power-efficient type of Zigbee device. It only communicates with its parent, either a coordinator or router, and sleeps most of the time to conserve power. Common examples include sensors, remotes, and buttons.
Zigbee end devices do not accept child devices unless they are configured as both a router and an endpoint simultaneously.
Each of these device types, also known as Zigbee nodes, has two types of address:
Short address: two bytes long, similar to an IP address in a TCP/IP network.
Extended address: eight bytes long, similar to a MAC address.
Both addresses can be used in the MAC and network layers, unlike in TCP/IP, where the MAC address is used only in Layer 2 and the IP address in Layer 3.
Zigbee setup
Zigbee has many attack surfaces, such as protocol fuzzing and low-level radio attacks. In this post, however, I’ll focus on application-level attacks. Our test setup uses two attack vectors and is intentionally small to make the concepts clear.
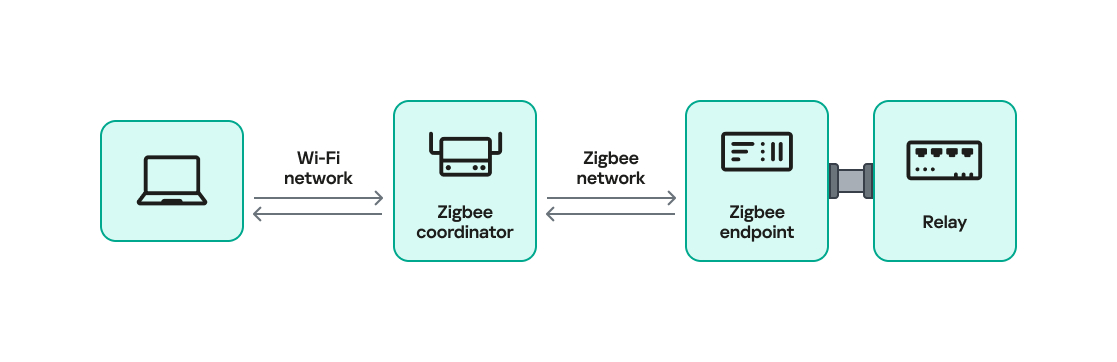
In our setup, a Zigbee coordinator is connected to a single device that functions as both a Zigbee endpoint and a router. The coordinator also has other interfaces (Ethernet, Bluetooth, Wi-Fi, LTE), while the endpoint has a relay attached that the coordinator can switch on or off over Zigbee. This relay can be triggered by events coming from any interface, for example, a Bluetooth command or an Ethernet message.
Our goal will be to take control of the relay and toggle its state (turn it off and on) using only the Zigbee interface. Because the other interfaces (Ethernet, Bluetooth, Wi-Fi, LTE) are out of scope, the attack must work by hijacking Zigbee communication.
For the purposes of this research, we will attempt to hijack the communication between the endpoint and the coordinator. The two attack vectors we will test are:
Spoofed packet injection: sending forged Zigbee commands made to look like they come from the coordinator to trigger the relay.
Coordinator impersonation (rejoin attack): impersonating the legitimate coordinator to trick the endpoint into joining the attacker-controlled coordinator and controlling it directly.
Spoofed packet injection
In this scenario, we assume the Zigbee network is already up and running and that both the coordinator and endpoint nodes are working normally. The coordinator has additional interfaces, such as Ethernet, and the system uses those interfaces to trigger the relay. For instance, a command comes in over Ethernet and the coordinator sends a Zigbee command to the endpoint to toggle the relay. Our goal is to toggle the relay by injecting simulated legitimate Zigbee packets, using only the Zigbee link.
Sniffing
The first step in any radio assessment is to sniff the wireless traffic so we can learn how the devices talk. For Zigbee, a common and simple tool is the nRF52840 USB dongle by Nordic Semiconductor. With the official nRF Sniffer for 802.15.4 firmware, the dongle can run in promiscuous mode to capture all 802.15.4/Zigbee traffic. Those captures can be opened in Wireshark with the appropriate dissector to inspect the frames.
How do you find the channel that’s in use?
Zigbee runs on one of the 16 channels that we mentioned earlier, so we must set the sniffer to the same channel that the network uses. One practical way to scan the channels is to change the sniffer channel manually in Wireshark and watch for Zigbee traffic. When we see traffic, we know we’ve found the right channel.
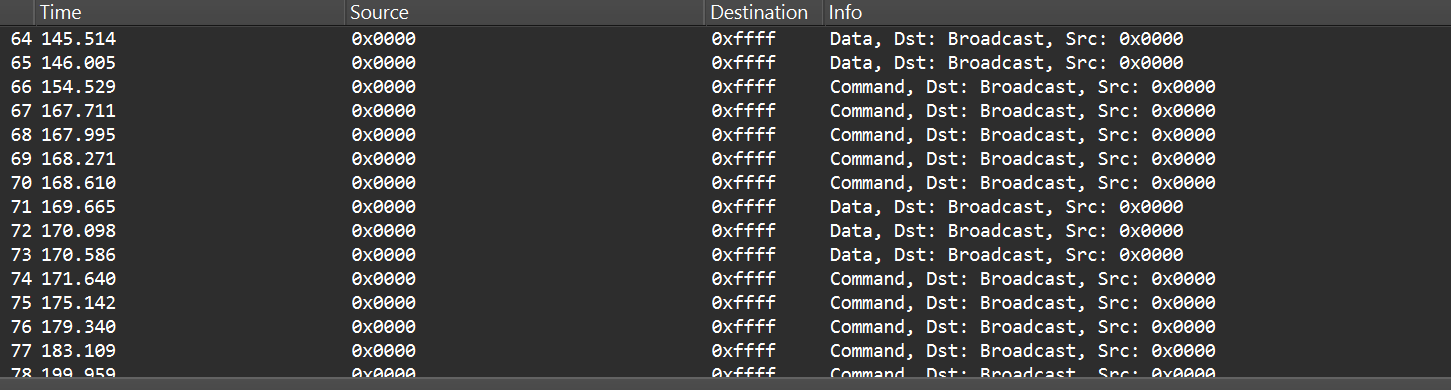
After selecting the channel, we will be able to see the communication between the endpoint and the coordinator, though it will most likely be encrypted:
In the “Info” column, we can see that Wireshark only identifies packets as Data or Command without specifying their exact type, and that’s because the traffic is encrypted.
Even when Zigbee payloads are encrypted, the network and MAC headers remain visible. That means we can usually read things like source and destination addresses, PAN ID, short and extended MAC addresses, and frame control fields. The application payload (i.e., the actual command to toggle the relay) is typically encrypted at the Zigbee network/application layer, so we won’t see it in clear text without encryption keys. Nevertheless, we can still learn enough from the headers.
Decryption
Zigbee supports several key types and encryption models. In this post, we’ll keep it simple and look at a case involving only two security-related devices: a Zigbee coordinator and a device that is both an endpoint and a router. That way, we’ll only use a network encryption model, whereas with, say, mesh networks there can be various encryption models in use.
The network encryption model is a common concept. The traffic that we sniffed earlier is typically encrypted using the network key. This key is a symmetric AES-128 key shared by all devices in a Zigbee network. It protects network-layer packets (hop-by-hop) such as routing and broadcast packets. Because every router on the path shares the network key, this encryption method is not considered end-to-end.
Depending on the specific implementation, Zigbee can use two approaches for application payloads:
Network-layer encryption (hop-by-hop): the network key encrypts the Application Support Sublayer (APS) data, the sublayer of the application layer in Zigbee. In this case, each router along the route can decrypt the APS payload. This is not end-to-end encryption, so it is not recommended for transmitting sensitive data.
Link key (end-to-end) encryption: a link key, which is also an AES-128 key, is shared between two devices (for example, the coordinator and an endpoint).
The link key provides end-to-end protection of the APS payload between the two devices.
Because the network key could allow an attacker to read and forge many types of network traffic, it must be random and protected. Exposing the key effectively compromises the entire network.
When a new device joins, the coordinator (Trust Center) delivers the network key using a Transport Key command. That transport packet must be protected by a link key so the network key is not exposed in clear text. The link key authenticates the joining device and protects the key delivery.
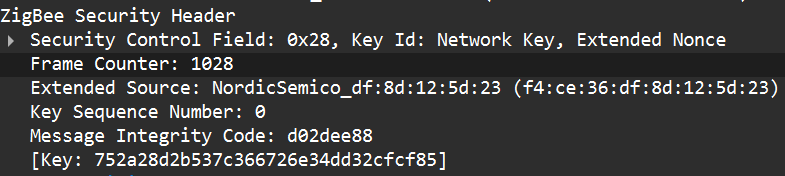
The image below shows the transport packet:
There are two common ways link keys are provided:
Pre-installed: the device ships with an installation code or link key already set.
Key establishment: the device runs a key-establishment protocol.
A common historical problem is the global default Trust Center link key, “ZigBeeAlliance09”. It was included in early versions of Zigbee (pre-3.0) to facilitate testing and interoperability. However, many vendors left it enabled on consumer devices, and that has caused major security issues. If an attacker knows this key, they can join devices and read or steal the network key.
Newer versions – Zigbee 3.0 and later – introduced installation codes and procedures to derive unique link keys for each device. An installation code is usually a factory-assigned secret (often encoded on the device label) that the Trust Center uses to derive a unique link key for the device in question. This helps avoid the problems caused by a single hard-coded global key.
Unfortunately, many manufacturers still ignore these best practices. During real assessments, we often encounter devices that use default or hard-coded keys.
How can these keys be obtained?
If an endpoint has already joined the network and communicates with the coordinator using the network key, there are two main options for decrypting traffic:
Guess or brute-force the network key. This is usually impractical because a properly generated network key is a random AES-128 key.
Force the device to rejoin and capture the transport key. If we can make the endpoint leave the network and then rejoin, the coordinator will send the transport key. Capturing that packet can reveal the network key, but the transport key itself is protected by the link key. Therefore, we still need the link key.
To obtain the network and link keys, many approaches can be used:
The well-known default link key, ZigBeeAlliance09. Many legacy devices still use it.
Identify the device manufacturer and search for the default keys used by that vendor. We can find the manufacturer by:
Checking the device MAC/OUI (the first three bytes of the 64-bit extended address often map to a vendor).
Physically inspecting the device (label, model, chip markings).
Extract the firmware from the coordinator or device if we have physical access and search for hard-coded keys inside the firmware images.
Once we have the relevant keys, the decryption process is straightforward:
Open the capture in Wireshark.
Go to Edit -> Preferences -> Protocols -> Zigbee.
Add the network key and any link keys in our possession.
Wireshark will then show decrypted APS payloads and higher-level Zigbee packets.
After successful decryption, packet types and readable application commands will be visible, such as Link Status or on/off cluster commands:
Choose your gadget
Now that we can read and potentially decrypt traffic, we need hardware and software to inject packets over the Zigbee link between the coordinator and the endpoint. To keep this practical and simple, I opted for cheap, widely available tools that are easy to set up.
For the hardware, I used the nRF52840 USB dongle, the same device we used for sniffing. It’s inexpensive, easy to find, and supports IEEE 802.15.4/Zigbee, so it can sniff and transmit.
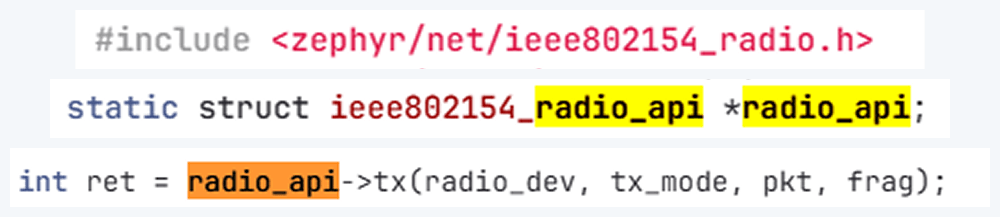
The dongle runs the firmware we can use. A good firmware platform is Zephyr RTOS. Zephyr has an IEEE 802.15.4 radio API that enables the device to receive raw frames, essentially enabling sniffer mode, as well as send raw frames as seen in the snippets below.
Using this API and other components, we created a transceiver implementation written in C, compiled it to firmware, and flashed it to the dongle. The firmware can expose a simple runtime interface, such as a USB serial port, which allows us to control the radio from a laptop.
At runtime, the dongle listens on the serial port (for example, /dev/ttyACM1). Using a script, we can send it raw bytes, which the firmware will pass to the radio API and transmit to the channel. The following is an example of a tiny Python script to open the serial port:
I used the Scapy tool with the 802.15.4/Zigbee extensions to build Zigbee packets. Scapy lets us assemble packets layer-by-layer – MAC → NWK → APS → ZCL – and then convert them to raw bytes to send to the dongle. We will talk about APS and ZCL in more detail later.
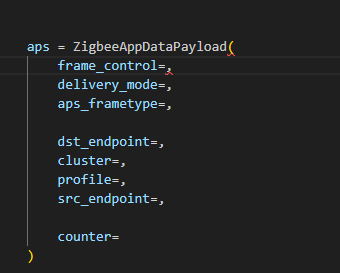
Here is an example of how we can use Scapy to craft an APS layer packet:
from scapy.layers.dot15d4 import Dot15d4, Dot15d4FCS, Dot15d4Data, Dot15d4Cmd, Dot15d4Beacon, Dot15d4CmdAssocResp
from scapy.layers.zigbee import ZigbeeNWK, ZigbeeAppDataPayload, ZigbeeSecurityHeader, ZigBeeBeacon, ZigbeeAppCommandPayload
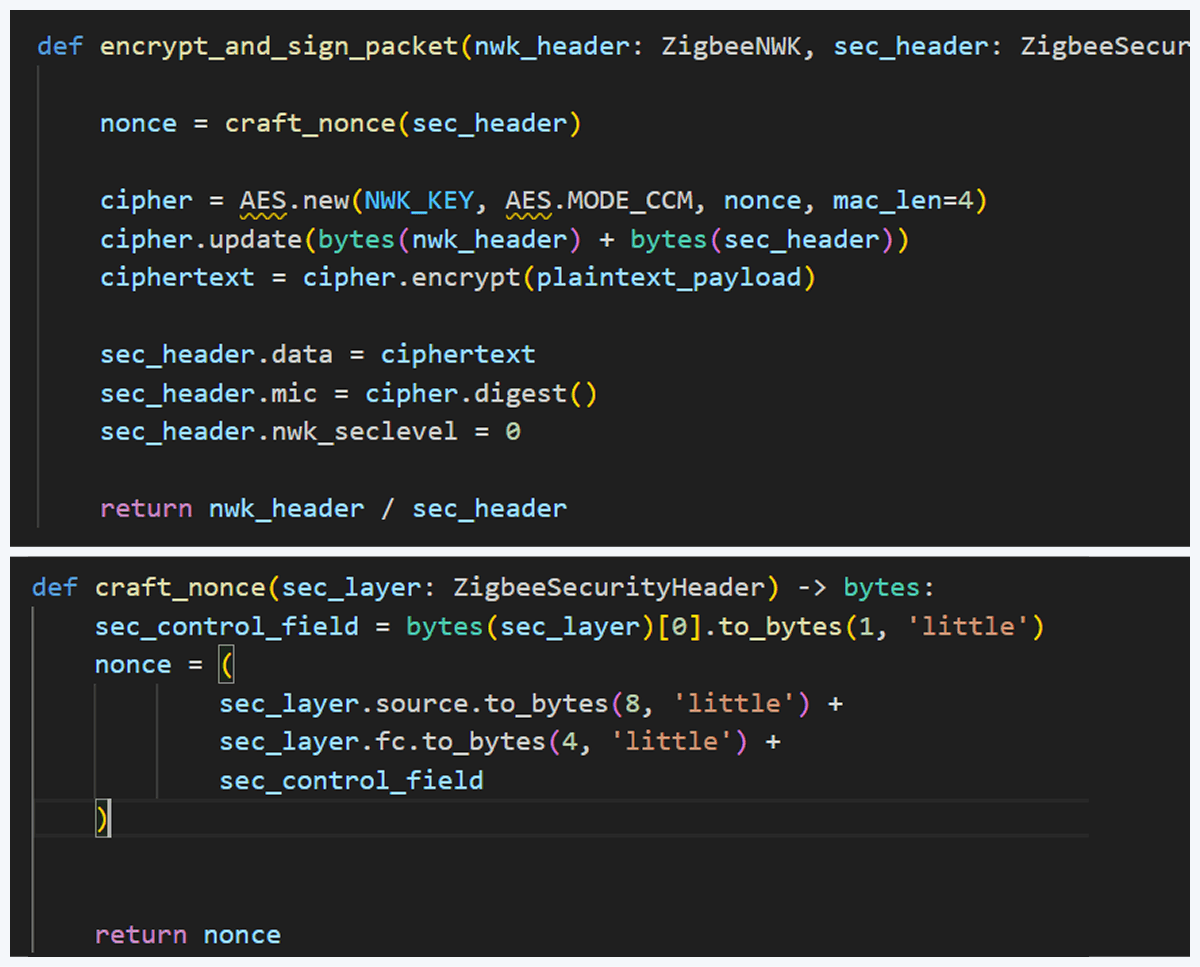
Before sending, the packet must be properly encrypted and signed so the endpoint accepts it. That means applying AES-CCM (AES-128 with MIC) using the network key (or the correct link key) and adhering to Zigbee’s rules for packet encryption and MIC calculation. This is how we implemented the encryption and MIC in Python (using a cryptographic library) after building the Scapy packet. We then sent the final bytes to the dongle.
This is how we implemented the encryption and MIC:
Crafting the packet
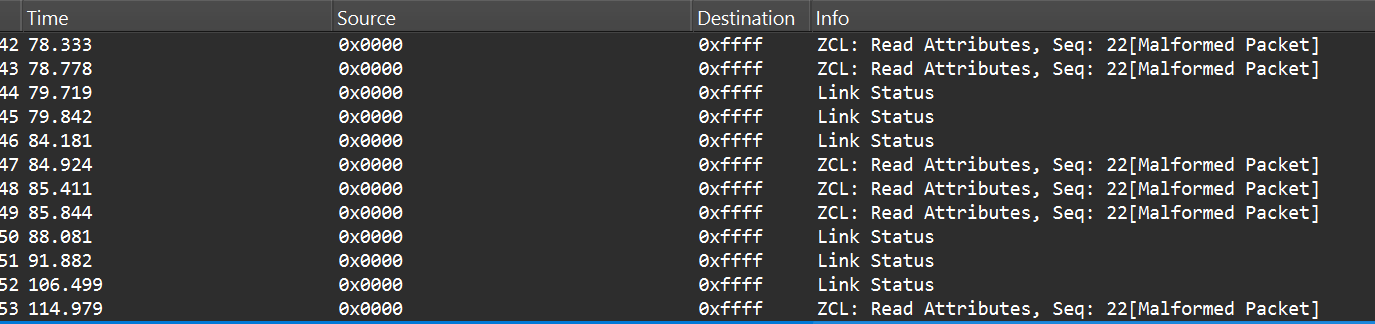
Now that we know how to inject packets, the next question is what to inject. To toggle the relay, we simply need to send the same type of command that the coordinator already sends. The easiest way to find that command is to sniff the traffic and read the application payload. However, when we look at captures in Wireshark, we can see many packets under ZCL marked [Malformed Packet].
A “malformed” ZCL packet usually means Wireshark could not fully interpret the packet because the application layer is non-standard or lacks details Wireshark expects. To understand why this happens, let’s look at the Zigbee application layer.
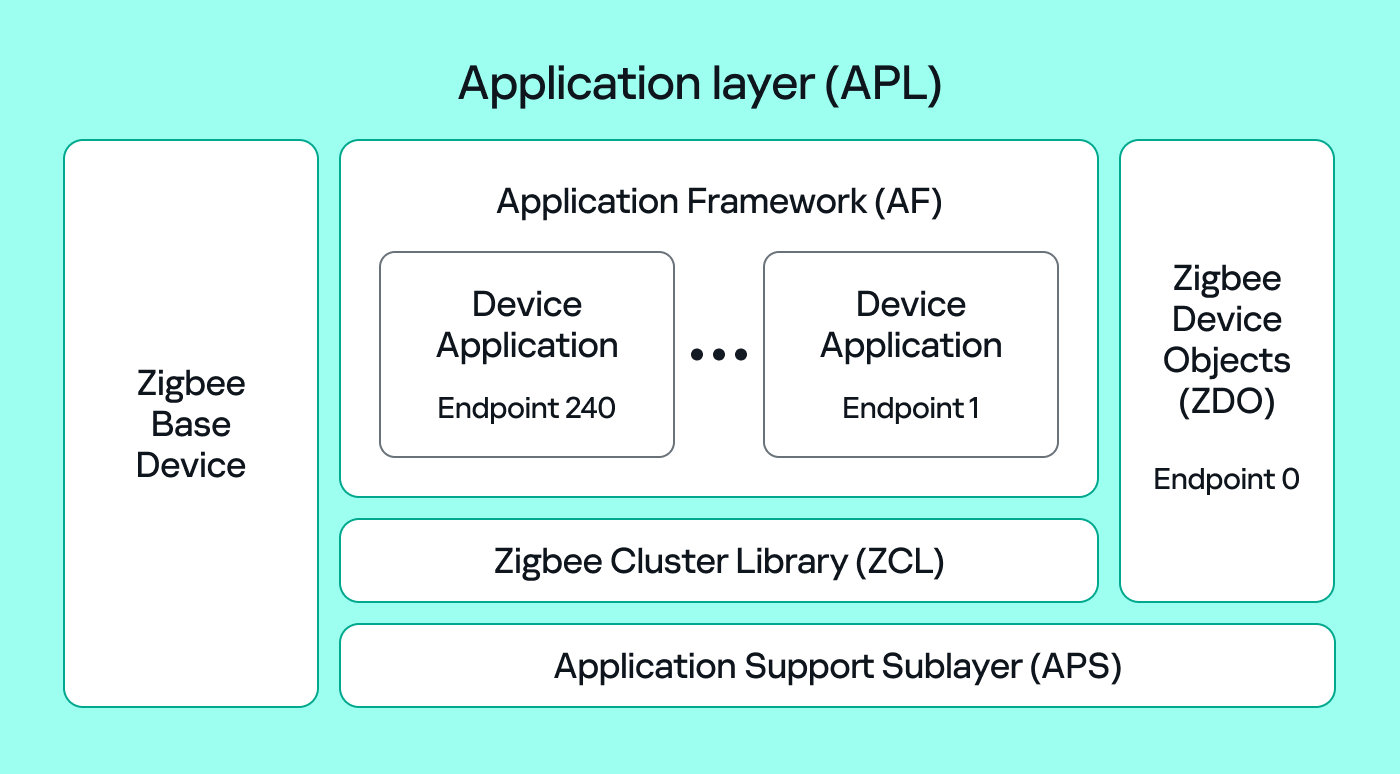
Application Support Sublayer (APS): routes messages to the correct profile, endpoint, and cluster, and provides application-level security.
Application Framework (AF): contains the application objects that implement device functionality. These objects reside on endpoints (logical addresses 1–240) and expose clusters (sets of attributes and commands).
Zigbee Cluster Library (ZCL): defines standard clusters and commands so devices can interoperate.
Zigbee Device Object (ZDO): handles device discovery and management (out of scope for this post).
To make sense of application traffic, we must introduce three concepts:
Profile: a rulebook for how devices should behave for a specific use case. Public (standard) profiles are managed by the Connectivity Standards Alliance (CSA). Vendors can also create private profiles for proprietary features.
Cluster: a set of attributes and commands for a particular function. For example, the On/Off cluster contains On and Off commands and an OnOff attribute that displays the current state.
Endpoint: a logical “port” on the device where a profile and clusters reside. A device can host multiple endpoints for different functions.
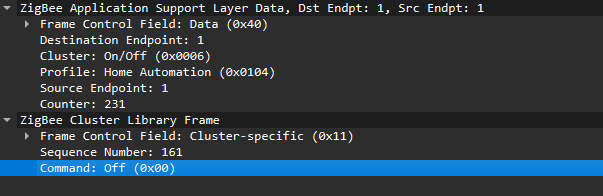
Putting all this together, in the standard home automation traffic we see APS pointing to the home automation profile, the On/Off cluster, and a destination endpoint (for example, endpoint 1). In ZCL, the byte 0x00 often means “Off”.
In many industrial setups, vendors use private profiles or custom application frameworks. That’s why Wireshark can’t decode the packets; the AF payload is custom, so the dissector doesn’t know the format.
So how do we find the right bytes to toggle the switch when the application is private? Our strategy has two phases.
Passive phase
Sniff traffic while the system is driven legitimately. For example, trigger the relay from another interface (Ethernet or Bluetooth) and capture the Zigbee packets used to toggle the relay. If we can decrypt the captures, we can extract the application payload that correlates with the on/off action.
Active phase
With the legitimate payload at hand, we can now turn to creating our own packet. There are two ways to do that. First, we need to replay or duplicate the captured application payload exactly as it is. This works if there are no freshness checks like sequence numbers. Otherwise, we have to reverse-engineer the payload and adjust any counters or fields that prevent replay. For instance, many applications include an application-level counter. If the device ignores packets with a lower application counter, we must locate and increment that counter when we craft our packet.
Another important protective measure is the frame counter inside the Zigbee security header (in the network header security fields). The frame counter prevents replay attacks; the receiver expects the frame counter to increase with each new packet, and will reject packets with a lower or repeated counter.
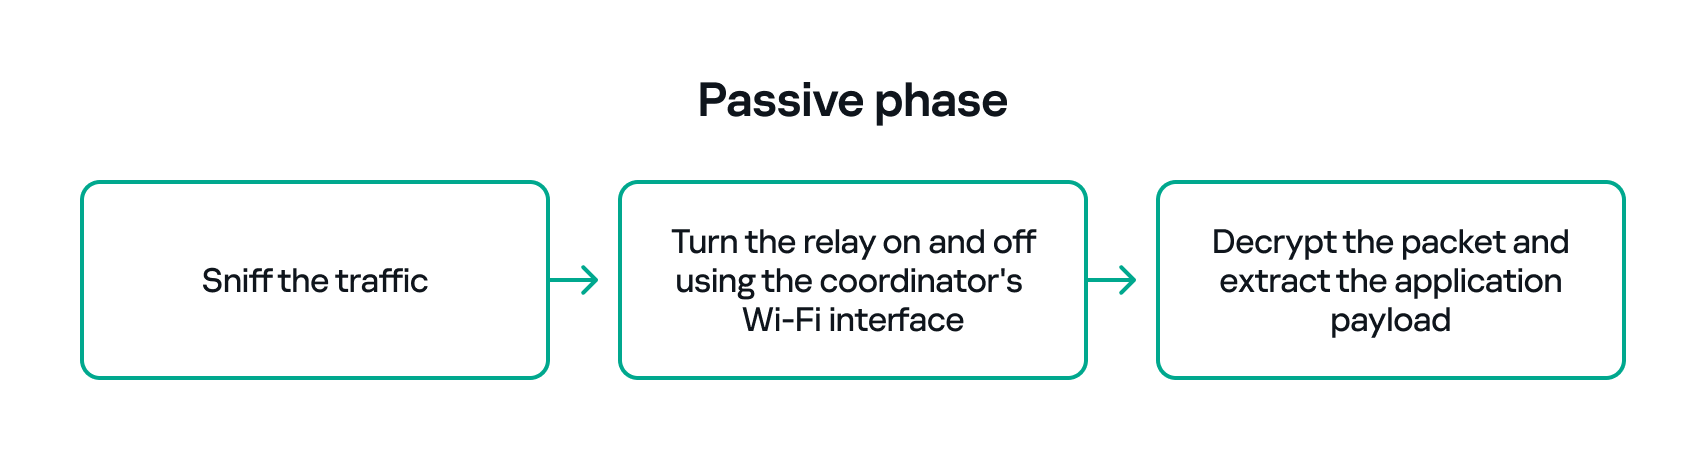
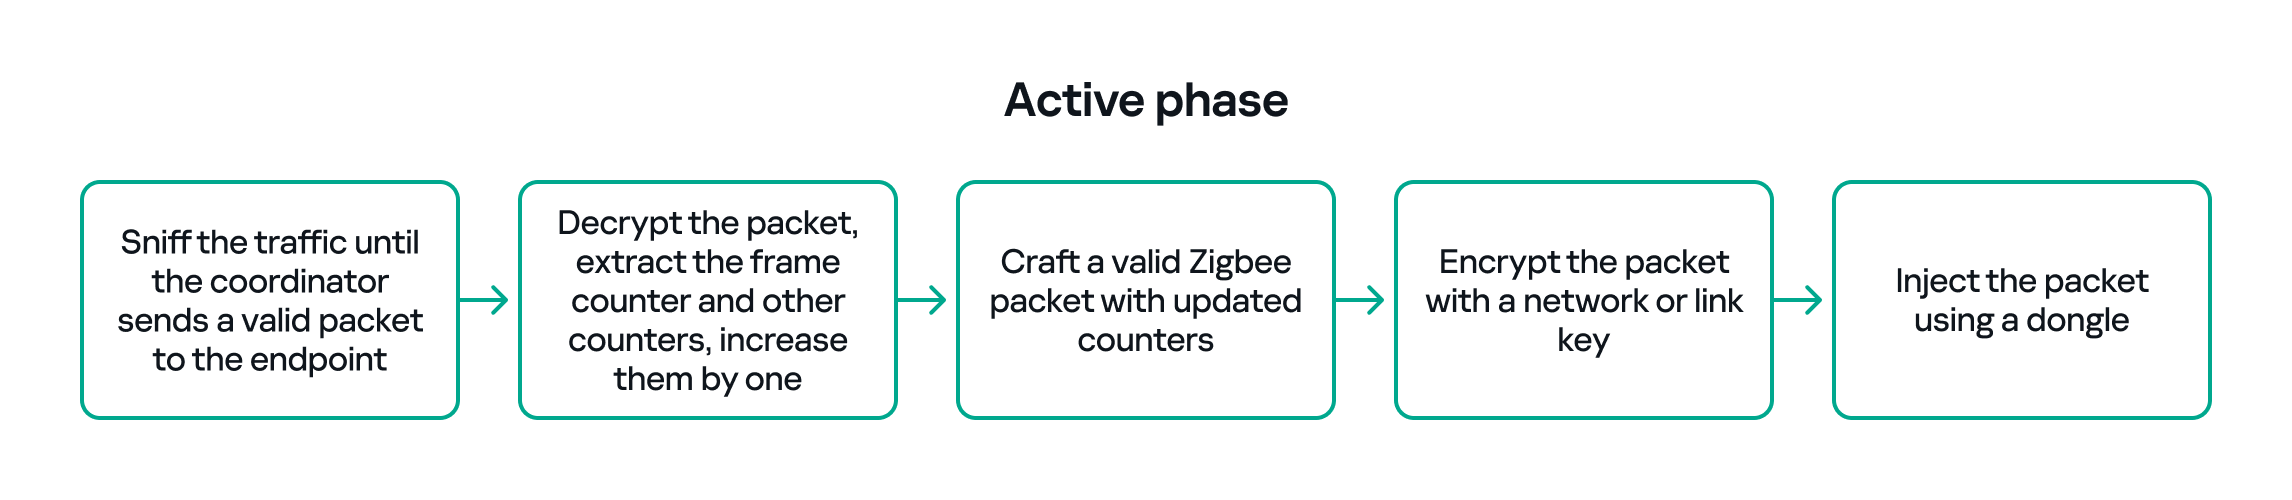
So, in the active phase, we must:
Sniff the traffic until the coordinator sends a valid packet to the endpoint.
Decrypt the packet, extract the counters and increase them by one.
Build a packet with the correct APS/AF fields (profile, endpoint, cluster).
Include a valid ZCL command or the vendor-specific payload that we identified in the passive phase.
Encrypt and sign the packet with the correct network or link key.
Make sure both the application counter (if used) and the Zigbee frame counter are modified so the packet is accepted.
The whole strategy for this phase will look like this:
If all of the above are handled correctly, we will be able to hijack the Zigbee communication and toggle the relay (turn it off and on) using only the Zigbee link.
Coordinator impersonation (rejoin attack)
The goal of this attack vector is to force the Zigbee endpoint to leave its original coordinator’s network and join our spoofed network so that we can take control of the device. To do this, we must achieve two things:
Force the endpoint to leave the original network.
Spoof the original coordinator and trick the node into joining our fake coordinator.
Force leaving
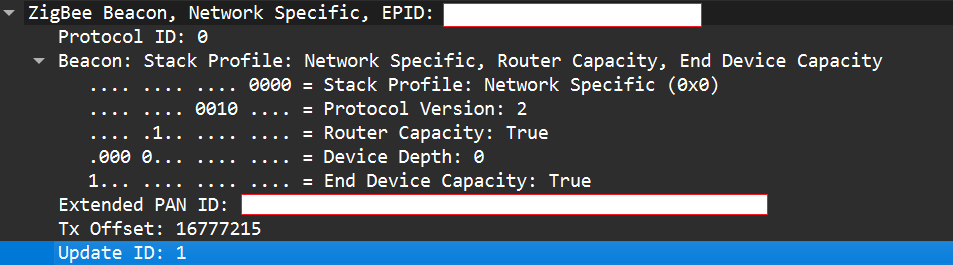
To better understand how to manipulate endpoint connections, let’s first describe the concept of a beacon frame. Beacon frames are periodic announcements sent by a coordinator and by routers. They advertise the presence of a network and provide join information, such as:
PAN ID and Extended PAN ID
Coordinator address
Stack/profile information
Device capacity (for example, whether the coordinator can accept child devices)
When a device wants to join, it sends a beacon request across Zigbee channels and waits for beacon replies from nearby coordinators/routers. Even if the network is not beacon-enabled for regular synchronization, beacon frames are still used during the join/discovery process, so they are mandatory when a node tries to discover networks.
Note that beacon frames exist at both the Zigbee and IEEE 802.15.4 levels. The MAC layer carries the basic beacon structure that Zigbee then extends with network-specific fields.
Now, we can force the endpoint to leave its network by abusing how Zigbee handles PAN conflicts. If a coordinator sees beacons from another coordinator using the same PAN ID and the same channel, it may trigger a PAN ID conflict resolution. When that happens, the coordinator can instruct its nodes to change PAN ID and rejoin, which causes them to leave and then attempt to join again. That rejoin window gives us an opportunity to advertise a spoofed coordinator and capture the joining node.
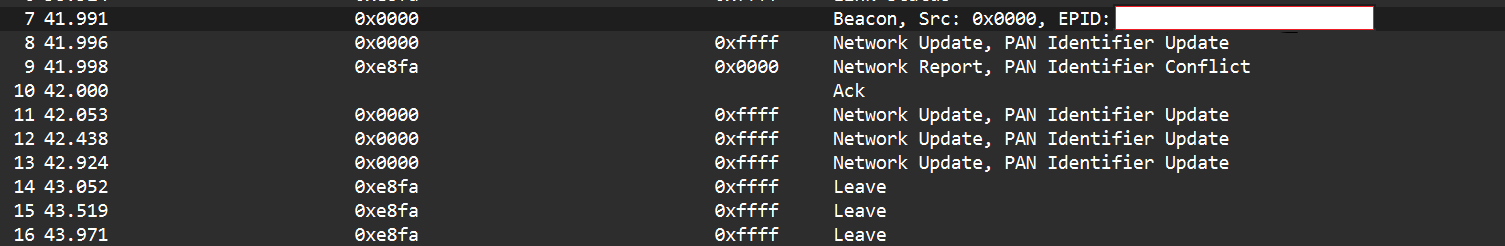
In the capture shown below, packet 7 is a beacon generated by our spoofed coordinator using the same PAN ID as the real network. As a result, the endpoint with the address 0xe8fa leaves the network (see packets 14–16).
Choose me
After forcing the endpoint to leave its original network by sending a fake beacon, the next step is to make the endpoint choose our spoofed coordinator. At this point, we assume we already have the necessary keys (network and link keys) and understand how the application behaves.
To impersonate the original coordinator, our spoofed coordinator must reply to any beacon request the endpoint sends. The beacon response must include the same Extended PAN ID (and other fields) that the endpoint expects. If the endpoint deems our beacon acceptable, it may attempt to join us.
I can think of two ways to make the endpoint prefer our coordinator.
Jam the real coordinator
Use a device that reduces the real coordinator’s signal at the endpoint so that it appears weaker, forcing the endpoint to prefer our beacon. This requires extra hardware.
Exploit undefined or vendor-specific behavior
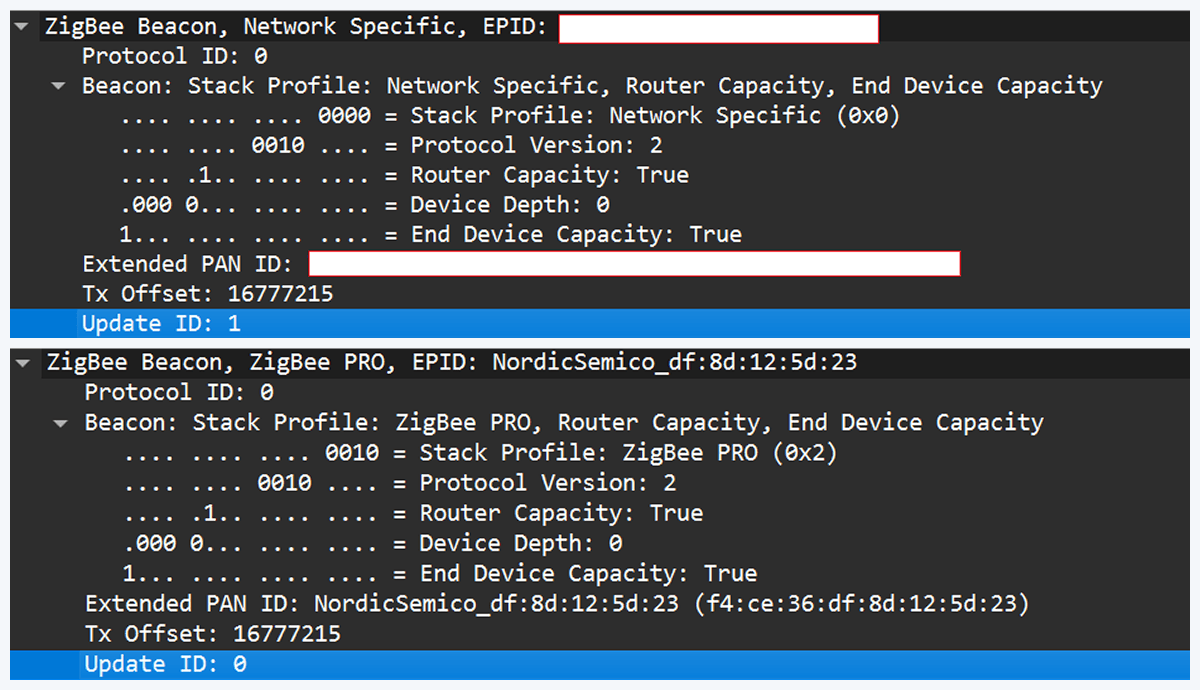
Zigbee stacks sometimes behave slightly differently across vendors. One useful field in a beacon is the Update ID field. It increments when a coordinator changes network configuration.
If two coordinators advertise the same Extended PAN ID but one has a higher Update ID, some stacks will prefer the beacon with the higher Update ID. This is undefined behavior across implementations; it works on some stacks but not on others. In my experience, sometimes it works and sometimes it fails. There are lots of other similar quirks we can try during an assessment.
Even if the endpoint chooses our fake coordinator, the connection may be unstable. One main reason for that is the timing. The endpoint expects ACKs for the frames it sends to the coordinator, as well as fast responses regarding connection initiation packets. If our responder is implemented in Python on a laptop that receives packets, builds responses, and forwards them to a dongle, the round trip will be too slow. The endpoint will not receive timely ACKs or packets and will drop the connection.
In short, we’re not just faking a few packets; we’re trying to reimplement parts of Zigbee and IEEE 802.15.4 that must run quickly and reliably. This is usually too slow for production stacks when done in high-level, interpreted code.
A practical fix is to run a real Zigbee coordinator stack directly on the dongle. For example, the nRF52840 dongle can act as a coordinator if flashed with the right Nordic SDK firmware (see Nordic’s network coordinator sample). That provides the correct timing and ACK behavior needed for a stable connection.
However, that simple solution has one significant disadvantage. In industrial deployments we often run into incompatibilities. In my tests I compared beacons from the real coordinator and the Nordic coordinator firmware. Notable differences were visible in stack profile headers:
The stack profile identifies the network profile type. Common values include 0x00, which is a network-specific (private) profile, and 0x02, which is a Zigbee Pro (public) profile.
If the endpoint expects a network-specific profile (i.e., it uses a private vendor profile) and we provide Zigbee Pro, the endpoint will refuse to join. Devices that only understand private profiles will not join public-profile networks, and vice versa. In my case, I could not change the Nordic firmware to match the proprietary stack profile, so the endpoint refused to join.
Because of this discrepancy, the “flash a coordinator firmware on the dongle” fix was ineffective in that environment. This is why the standard off-the-shelf tools and firmware often fail in industrial cases, forcing us to continue working with and optimizing our custom setup instead.
Back to the roots
In our previous test setup we used a sniffer in promiscuous mode, which receives every frame on the air regardless of destination. Real Zigbee (IEEE 802.15.4) nodes do not work like that. At the MAC/802.15.4 layer, a node filters frames by PAN ID and destination address. A frame is only passed to upper layers if the PAN ID matches and the destination address is the node’s address or a broadcast address.
We can mimic that real behavior on the dongle by running Zephyr RTOS and making the dongle act as a basic 802.15.4 coordinator. In that role, we set a PAN ID and short network address on the dongle so that the radio only accepts frames that match those criteria. This is important because it allows the dongle to handle auto-ACKs and MAC-level timing: the dongle will immediately send ACKs at the MAC level.
With the dongle doing MAC-level work (sending ACKs and PAN filtering), we can implement the Zigbee logic in Python. Scapy helps a lot with packet construction: we can create our own beacons with the headers matching those of the original coordinator, which solves the incompatibility problem. However, we must still implement the higher-level Zigbee state machine in our code, including connection initiation, association, network key handling, APS/AF behavior, and application payload handling. That’s the hardest part.
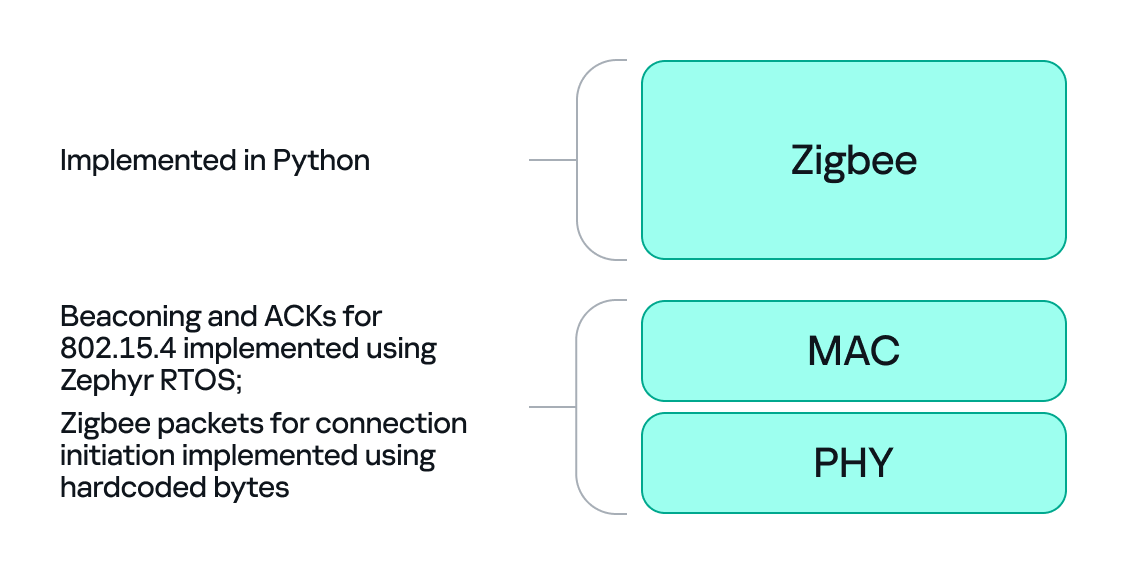
There is one timing problem that we cannot solve in Python: the very first steps of initiating a connection require immediate packet responses. To handle this issue, we implemented the time-critical parts in C on the dongle firmware. For example, we can statically generate the packets for connection initiation in Python and hard-code them in the firmware. Then, using “if” statements, we can determine how to respond to each packet from the endpoint.
So, we let the dongle (C/Zephyr) handle MAC-level ACKs and the initial association handshake, but let Python build higher-level packets and instruct the dongle what to send next when dealing with the application level. This hybrid model reduces latency and maintains a stable connection. The final architecture looks like this:
Deliver the key
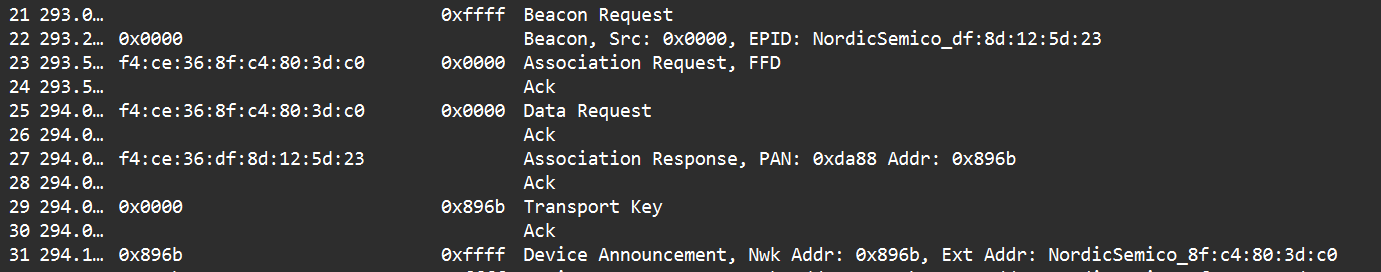
Here’s a quick recap of how joining works: a Zigbee endpoint broadcasts beacon requests across channels, waits for beacon responses, chooses a coordinator, and sends an association request, followed by a data request to identify its short address. The coordinator then sends a transport key packet containing the network key. If the endpoint has the correct link key, it can decrypt the transport key packet and obtain the network key, meaning it has now been authenticated. From that point on, network traffic is encrypted with the network key. The entire process looks like this:
The sticking point is the transport key packet. This packet is protected using the link key, a per-device key shared between the coordinator (Trust Center) and the joining endpoint. Before the link key can be used for encryption, it often needs to be processed (hashed/derived) according to Zigbee’s key derivation rules. Since there is no trivial Python implementation that implements this hashing algorithm, we may need to implement the algorithm ourselves.
Now that we’ve managed to obtain the hashed link key and deliver it to the endpoint, we can successfully mimic a coordinator.
The final success
If we follow the steps above, we can get the endpoint to join our spoofed coordinator. Once the endpoint joins, it will often remain associated with our coordinator, even after we power it down (until another event causes it to re-evaluate its connection). From that point on, we can interact with the device at the application layer using Python. Getting access as a coordinator allowed us to switch the relay on and off as intended, but also provided much more functionality and control over the node.
Conclusion
In conclusion, this study demonstrates why private vendor profiles in industrial environments complicate assessments: common tools and frameworks often fail, necessitating the development of custom tools and firmware. We tested a simple two-node scenario, but with multiple nodes the attack surface changes drastically and new attack vectors emerge (for example, attacks against routing protocols).
As we saw, a misconfigured Zigbee setup can lead to a complete network compromise. To improve Zigbee security, use the latest specification’s security features, such as using installation codes to derive unique link keys for each device. Also, avoid using hard-coded or default keys. Finally, it is not recommended to use the network key encryption model. Add another layer of security in addition to the network level protection by using end-to-end encryption at the application level.
The world of payment security never stands still, and neither does PCI DSS. PCI DSS 4.0.1 Compliance is now the latest update that is the new talk of the town. Don’t worry it’s not that massive and heavy on changes but it is here to make a remarkable difference in transparency and finance.
The Payment Card Industry Data Security Standard (PCI DSS v.4.0) is a data security framework that helps businesses keep their customers’ sensitive data safe. Every organization, regardless of size and location, that handles customers payment card data has to be PCI DSS compliant. PCI DSS v4.0 consists of 12 main requirements, categorized under 6 core principles that every organization must adhere to in order to maintain compliance.
Since 2008, 4 years from the date it was first introduced, PCI DSS has undergone multiple revisions to keep up with the emerging cyber threats and evolving payment technologies. With each update, organizations are expected to refine their security practices to meet stricter compliance expectations.
Now, with PCI DSS 4.0.1, organizations must once again adapt to the latest regulatory changes. But what does this latest version bring to the table, and how can your organization ensure a smooth transition? Let’s take a closer look.
Introduction to PCI DSS v4.0.1
PCI DSS 4.0.1 is a revised version of PCI DSS v4.0, published by the PCI Security Standard Council (PCI SSC) on June 11, 2024. The latest version focuses on minor adjustments, such as formatting corrections and clarifications, rather than introducing new requirements. Importantly, PCI DSS version 4.0.1 does not add, delete, or modify any existing requirements. So, organizations that have already started transitioning to PCI DSS 4.0, won’t face any drastic changes, but it is crucial to understand the key updates to ensure full compliance.
PCI DSS 4.0.1 changes
We know PCI DSS 4.0.1 does not introduce any brand-new requirements, so what kind of refinements does it bring, and are they worth noting?
The answer is: Yes, they are, and you should comply with them to avoid non-compliance. The new updates aim to enhance clarity, consistency, and usability rather than overhaul existing security controls in PCI DSS.
Below are some of the significant updates in PCI DSS 4.0.1:
Improved Requirement Clarifications: The PCI Security Standards Council (PCI SSC) has fine-tuned the wording of several requirements to remove ambiguity. This ensures businesses have a clearer understanding of what’s expected.
Formatting Enhancements: To ensure uniformity across the framework, some sections have been reformatted. This may not impact your technical security controls but will help streamline audits and documentation.
Additional Implementation Guidance: Organizations now have more explanatory notes to assist them in correctly implementing security controls and compliance measures.
No Change in Compliance Deadlines: The transition deadline to PCI DSS 4.0 remains firm—March 31, 2025—so organizations need to stay on track with their compliance efforts.
Alignment with Supporting Documents: Updates ensure consistency across various PCI DSS-related materials like Self-Assessment Questionnaires (SAQs) and Reports on Compliance (ROCs), making assessments more straightforward.
Steps to comply with the new version of PCI DSS 4.0.1
1) Familiarize Yourself with PCI DSS 4.0.1 Updates
Review the official documentation from the PCI Security Standards Council.
Understand the refinements and how they apply to your current compliance efforts.
If you’re already transitioning to PCI DSS 4.0, confirm that 4.0.1 does not require any drastic modifications.
2) Conduct a Compliance Gap Analysis
Compare your existing security controls against PCI DSS 4.0.1 to identify areas needing adjustment.
Engage with internal stakeholders to assess any potential compliance gaps.
3) Update Policies and Documentation
Revise internal policies, security documentation, and operational procedures to align with clarified requirements.
Ensure that SAQs, ROCs, and Attestations of Compliance (AOCs) reflect the latest version.
4) Validate Security Controls
Perform security assessments, penetration testing, and vulnerability scans to confirm compliance.
Make necessary adjustments based on the refined guidance provided in PCI DSS 4.0.1.
5) Train Your Team on Key Updates
Conduct training sessions to educate staff and stakeholders on clarified expectations.
Ensure that compliance teams understand how the changes affect security protocols.
6) Consult a Qualified Security Assessor (QSA)
If your organization requires external validation, work closely with an experienced QSA (like the experts from VISTA InfoSec) to confirm that your compliance strategy meets PCI DSS 4.0.1 expectations.
Address any concerns raised by the assessor to avoid compliance delays.
7) Maintain Continuous Compliance and Monitoring
Implement robust logging, monitoring, and threat detection mechanisms.
Regularly test and update security controls to stay ahead of evolving cyber threats.
8) Prepare for the March 2025 Compliance Deadline
Keep track of your progress to ensure you meet the transition deadline.
If you’re already compliant with PCI DSS 4.0, verify that all adjustments from v4.0.1 are incorporated into your security framework.
FAQs
What are the main changes in PCI DSS 4.0.1 compared to 4.0?
PCI DSS 4.0.1 introduces clarifications, minor corrections, and additional guidance to make existing requirements in PCI DSS 4.0 easier to understand and implement.
Why was PCI DSS 4.0.1 released so soon after PCI DSS 4.0?
PCI DSS 4.0.1 was released to address feedback from organizations and assessors, ensuring requirements are clear, consistent, and practical without changing the core security goals of version 4.0.
How should organizations prepare for PCI DSS 4.0.1?
Organizations should review the updated documentation, perform a gap analysis, update policies and procedures if needed, and confirm alignment with the clarified requirements.
Are there new technical requirements in PCI DSS 4.0.1?
No new technical requirements were added. PCI DSS 4.0.1 focuses on clarifications and corrections to help organizations implement PCI DSS 4.0 more effectively.
What happens if my business does not comply with PCI DSS 4.0.1?
Failure to comply with PCI DSS 4.0.1 can lead to fines, loss of the ability to process card payments, and increased risk of data breaches due to weak security practices.
Conclusion
PCI DSS compliance isn’t just a checkbox exercise, it is your very first commitment when it comes to safeguarding your customer’s data and strengthening cybersecurity. While PCI DSS 4.0.1 may not introduce serious changes, its refinements serve as a crucial reminder that security is an ongoing journey, not a one-time effort. With the March 2025 compliance deadline fast approaching, now is the time to assess, adapt, and act.
Need expert guidance to navigate PCI DSS 4.0.1 seamlessly? Partner with us at VISTA InfoSec for a smooth, hassle-free transition to the latest version of PCI DSS. Because in payment security, compliance is just the beginning, true protection is the actual goal.
The Future of Cyber Resilience The algorithms are hunting us. Not with malicious code, but with something far more insidious. During a recent Black Hat Conference roundtable hosted by Chuck...
Securing the Digital Frontier: How AI is Reshaping Application Security The software development landscape is transforming at breakneck speed. Developers now generate code faster than ever, but this acceleration comes...
Network Visibility: The Silent Guardian of Cybersecurity Network complexity is killing enterprise security teams. Buried under mountains of configuration data, manual processes, and endless troubleshooting, cybersecurity professionals are drowning in...
Getting PCI DSS compliant is like preparing for a big exam. You cannot just walk into it blind, you first need to prepare, check your weak areas, next fix them, and then only face the audit. If you are here today for the roadmap, I assume you are preparing for an audit now or sometime in the future, and I hope this PCI DSS 4.0 Readiness Roadmap helps you as your preparation guide. So, let’s get started!
Step 1: List down everything in scope
The first mistake many companies make is they don’t know what is really in the PCI scope. So, start with an inventory.
This is one area where many organizations rely on pci dss compliance consultants to help them correctly identify what truly falls under cardholder data scope.
Applications: Your payment gateway (Stripe, Razorpay, PayPal, Adyen), POS software, billing apps like Zoho Billing, CRMs like Salesforce that store customer details, in-house payment apps.
Databases: MySQL, Oracle, SQL Server, MongoDB that store PAN or related card data.
Servers: Web servers (Apache, Nginx, IIS), application servers (Tomcat, Node.js), DB servers.
Write all this down in a spreadsheet. Mark which ones store, process, or transmit card data. This becomes your “scope map.”
Step 2: Do a gap check (compare with PCI DSS 4.0 requirements)
Now take the PCI DSS 4.0 standard and see what applies to you. Some basics:
Firewalls – Do you have them configured properly or are they still at default rules?
Passwords – Are your systems still using “welcome123” or weak defaults? PCI needs strong auth.
Encryption – Is card data encrypted at rest (DB, disk) and in transit (TLS 1.2+)? If not, you may fail your PCI DSS compliance audit.
Logging – Are you logging access to sensitive systems, and storing logs securely (like in Splunk, ELK, AWS CloudTrail)?
Access control – Who has access to DB with card data? Is it limited on a need-to-know basis?
Example: If you’re running an e-commerce store on Magento and it connects to MySQL, check if your DB is encrypted and whether DB access logs are kept.
Step 3: Fix the weak spots (prioritize risks)
If your POS terminals are outdated (like old Verifone models), replace or upgrade.
If your AWS S3 buckets storing logs are public, fix them immediately.
If employees are using personal laptops to process payments, enforce company-managed devices with endpoint security (like CrowdStrike, Microsoft Defender ATP).
If your database with card data is open to all developers, restrict it to just DB admins.
Real story: A retailer I advised had their POS terminals still running Windows XP. They were shocked when I said PCI won’t even allow XP as it’s unsupported.
Step 4: Train your people
PCI DSS is not just about tech. If your staff doesn’t know, they’ll break controls.
Train call center staff not to write card numbers on paper.
Train IT admins to never copy card DBs to their laptops for “testing.”
Train developers to follow secure coding (OWASP Top 10, no hard-coded keys). This not only helps with PCI but also complements SOC 2 compliance.
Example: A company using Zendesk for support had to train agents not to ask customers for card details over chat or email.
Step 5: Set up continuous monitoring
Auditors don’t just look for controls, they look for evidence.
Centralize your logs in SIEM (Splunk, QRadar, ELK, Azure Sentinel).
Set up alerts for failed logins, privilege escalations, or DB exports.
Do penetration testing on your payment apps (internal and external).
Example: If you are using AWS, enable CloudTrail + GuardDuty to continuously monitor activity.
Step 6: Do a mock audit (internal readiness check)
Before the official audit, test yourself.
Pick a PCI DSS requirement (like Requirement 8: Identify users and authenticate access). Check if you can prove strong passwords, MFA, and unique IDs.
Review if your network diagrams, data flow diagrams, and inventories are up to date.
Run a mock interview: ask your DB admin how they control access to the DB. If they can’t answer, it means you are not ready.
Example: I’ve seen companies that have everything in place but fail because their staff can’t explain what’s implemented.
Step 7: Engage your QSA (when you’re confident)
Finally, once you have covered all major gaps, bring in a QSA (like us at VISTA InfoSec). A QSA will validate and certify your compliance. But if you follow the above steps, the audit becomes smooth and you can avoid surprises.
We recently helped Vodafone Idea achieve PCI DSS 4.0 certification for their retail stores and payment channels. This was a large-scale environment, yet with the right PCI DSS 4.0 Readiness Roadmap (like the one above), compliance was achieved smoothly.
Remember, even the largest organizations can achieve PCI DSS 4.0 compliance if they start early, follow the roadmap step by step, and keep it practical.
Final Words for PCI DSS 4.0 Readiness Roadmap
Most businesses panic only when the audit date gets close. But PCI DSS doesn’t work that way. If you wait till then, it’s already too late.
So, start now. Even small steps today (like training your staff or fixing one gap) move you closer to compliance.
Having trouble choosing a QSA? VISTA InfoSec is here for you!
For more than 20 years, we at VISTA InfoSec have been helping businesses across fintech, telecom, cloud service providers, retail, and payment gateways achieve and maintain PCI DSS compliance. Our team of Qualified Security Assessors (QSAs) and technical experts works with companies of every size, whether it’s a start-up launching its first payment app or a large enterprise.
So, don’t wait! Book a free PCI DSS strategy call today to discuss your roadmap. You may also book a free one-time consultation with our qualified QSA.
The goal of YATAS is to help you create a secure AWS environment without too much hassle. It won't check for all best practices but only for the ones that are important for you based on my experience. Please feel free to tell me if you find something that is not covered.
You can ignore results of checks by adding the following to your .yatas.yml file:
ignore:
  - id: "AWS_VPC_004"
    regex: true
    values:
      - "VPC Flow Logs are not enabled on vpc-.*"
  - id: "AWS_VPC_003"
    regex: false
    values:
      - "VPC has only one gateway on vpc-08ffec87e034a8953"
Exclude a test
You can exclude a test by adding the following to your .yatas.yml file:
plugins:
  - name: "aws"
    enabled: true
    description: "Check for AWS good practices"
    exclude:
      - AWS_S3_001
Specify which tests to run
To only run a specific test, add the following to your .yatas.yml file:
plugins:
  - name: "aws"
    enabled: true
    description: "Check for AWS good practices"
    include:
      - "AWS_VPC_003"
      - "AWS_VPC_004"
Get error logs
You can get the error logs by adding the following to your env variables:
export YATAS_LOG_LEVEL=debug
The available log levels are: debug, info, warn, error, fatal, panic and off by default
The term “open source” refers in particular to records this is publically available. A huge part of the internet cannot be found using major search engines. This is called as “Deep Web”. Deep Web is a mass of websites, databases, files, and more that cannot be indexed by Google, Bing, Yahoo, or any other search engine. Despite this, much of the content of the dark web can be considered open source because it is easily available to the public.
There is plenty of information available online that can be found using online tools other than regular search engines. Tools like Shodan can be used to find IP addresses, open ports, CCTV, printers, and everything else that is connected to the internet.
Information can be considered open source if it is:
Published or broadcasted for a public audience like news
Available to the public by request for eg. census data
Available to the public by subscription or purchase
Could be seen or heard by any casual observer
Made available at a meeting open to the public
Obtained by visiting any place or attending any event that is open to the public
How is the Open Source Intelligence Used?
OSINT is widely used in:
1.Ethical Hacking & Penetration Testing
Security professionals use open-source intelligence to identify weaknesses in networks so that they can be remediated before they are exploited by hackers. Commonly found weaknesses include:
Accidental leaks of sensitive information, like through social media
Open ports or unsecured internet-connected devices
Unpatched software, such as websites running old versions of CMS
Leaked or exposed assets.
2.Identifying External Threats
From identifying which new vulnerabilities are being actively exploited to intercepting threat actors about an upcoming attack, open source intelligence enables security professionals to prioritize their time to address the most significant current threats.
The fact that open-source intelligence is frequently combined with other intelligence categories, is one of the most crucial things to comprehend about. Open-source intelligence is frequently filtered and verified using information from closed sources like external intelligence-sharing forums and closed dark web communities. Analysts can carry out these tasks with the use of a variety of instruments.
The Dark Side of Open Source Intelligence
If security analysts can access everything, threat actors can do the same with ease. Threat actors use open-source intelligence tools and tactics to identify potential targets and exploit weaknesses in target networks. Attackers attempt to exploit a weakness once it has been identified to breach the target.
This procedure is the main cause of the high number of attacks on small and medium-sized businesses. It is not because threat actors target particular businesses; rather, it is because open-source intelligence tools can spot design flaws in a company’s network or website. Additionally, threat actors look for data about people and organizations that can be used to support complex social engineering campaigns utilizing phishing (email), vishing (phone or voicemail), and Smishing (SMS). Sensitive information often published on social networks and blogs can be used to create social engineering campaigns that are very persuasive to convince individuals to compromise the network or assets of their company.
This is why it is crucial to use open-source intelligence for security objectives. It provides you a chance to identify and address network vulnerabilities in your company and delete critical data before threat actors utilize the same tools and strategies to take advantage of them.
Open Source Intelligence Techniques
The methodology to perform OSINT falls under two categories: Passive OSINT & Active OSINT.
Passive OSINT Threat Intelligence Platforms (TIPs) are frequently used in passive OSINT to aggregate several threat feeds into one convenient location. This issue is resolved by more sophisticated threat intelligence solutions, which automate the process of prioritizing and ignoring warnings in accordance with the unique requirements of a company. These solutions use artificial intelligence, machine learning, and natural language processing. Similar to this, organized threat groups frequently employ botnets to gather crucial data using methods like traffic sniffing and keylogging.
Active OSINT is the use of a variety of techniques to search for specific insights or information. For security professionals, this type of collection work is usually done for one of two reasons:
A passively collected alert has highlighted a potential threat and further insight is required.
While there are numerous free and practical tools available to security experts and threat actors alike search engines like Google are among the most often utilized open-source intelligence tools.
The frequency with which common, well-intentioned people unintentionally leave important assets and information exposed to the internet is one of the largest problems encountered by security experts. The data and assets they reveal can be found using a set of sophisticated search techniques known as “Google Dork” queries.
“sensitive but unclassified” filetype: txt publicintelligence.net”
If you type this search term into a search engine, it returns only TXT documents from the Public Intelligence website that contain the words “sensitive but unclassified” somewhere in the document text. As you can imagine, with hundreds of commands at their disposal, security professionals and threat actors can use similar techniques to search for almost anything.
Beyond search engines, literally hundreds of technologies are available for locating network vulnerabilities or exposed assets.
There are a ton of free and paid programs with common features that may be used to search and analyze open-source data, including:
Metadata search
Code search
People and identity investigation
Phone number research
Email search and verification
Linking social media accounts
Image analysis
Geospatial research and mapping
Wireless network detection and packet analysis
WRAP UP!
All security disciplines can benefit greatly from open-source intelligence. It will take some time and some trial and error to find the best set of tools and methods for your particular needs. The tools and methods required to locate unsecured assets differ from those that will enable you to act on a threat alert. The presence of a clear strategy is the most crucial element in the success of any open-source intelligence endeavor. Once goals have been stated and objectives are clear, it will be much easier to find the best tools and methodologies.
Red team assessors are professional hackers who are hired to assess the IT Infrastructure of an organization. They are hired to evaluate and perform hacks on systems in a way a malicious hacker would perform an attack and break in into the systems. They basically simulate an attack to exploit gaps in the organization’s IT Infrastructure.
This is precisely the way how a red team assessor evaluates the effectiveness of an organization’s security controls in place. Compared to the penetration test, the red team assessment is broader in scope involving a full-scale attack on the IT Infrastructure which lasts for hours, days, or even weeks.
This type of hack provides insightful data on how and for how long a hacker managed to maintain access within their systems and network. Such assessments help organizations improve and strengthen their cyber security posture. Covering more of this in detail we have today shared the top 5 reasons why we believe organizations must hire red team assessors.
Top 5 reasons to hire a red team assessor
1) Identify Gaps in the IT Infrastructure
Red Team Assessors are often hired by IT firms and businesses to help them identify potential gaps in the systems. More than often the internal team fails to identify gaps, vulnerabilities, or weaknesses in systems that a hacker would possibly find. Such loopholes and gaps are essential to be identified and fixed immediately to prevent incidents of breaches and hacks.
The exercise is performed for finding gaps in terms of operational disruptions, coding errors, misconfigured patches, insider threats, and weaknesses in processes, workflows, technology, and negligence of people involved such as employees, suppliers, and business vendors. So, for these reasons, it is recommended that organizations annually perform a thorough red team assessment to identify such gaps and remediate vulnerabilities in systems. After all, even the best of defense can fall prey to attacks by hackers, given the dynamics of the evolving cybersecurity industry.
2) Evaluate the Effectiveness of Security Controls
Evaluating the effectiveness of security controls is crucial for a business looking to strengthen its cyber security posture. So, Red team assessment is one of the best ways of evaluating the effectiveness and performance of security controls established within the organization. Although internal assessment of security controls and systems may suggest strong security in place, yet a third-party assessment may suggest otherwise.
This is because internal teams may tend to overlook certain things that a third party may detect. So, in that sense, the Red team assessment is a perfect exercise as it gives the organizations a third-party perspective of their cybersecurity posture. Further, their assessment and reports give more credibility to the stakeholders of the organizations.
Moreover, the red team assessment exposes vulnerabilities and weaknesses in the infrastructure and verifies the effectiveness of the security control implemented in the organization. This helps the organization fix gaps and improve the security controls while also allowing the organization to strengthen the overall cybersecurity posture in the industry.
3.Risk Exposure & Impact
Performing red team assessment involves simulating a real attack on systems and infrastructure. This helps the organization understand the risk exposure to the organization and the potential impact of a security breach or compromise on business.
The assessment demonstrates different ways and means by which a hacker can stage an attack on systems and IT infrastructure. It also demonstrates the amount of damage that the attack could have on the organization and the extent of data leakage in case of a compromise.
Not just that, the assessment also helps an organization understand and prioritize their resources on assets and processes that need immediate attention. This is especially for those assets that are highly exposed to risk. Overall, the assessment conducted by the red team assessor highlights the vulnerabilities and their implications on the IT infrastructure and operations.
4.Effectiveness of Security Team
Simulation of real attacks allows the organization to test the effectiveness of not just the security controls but also the effectiveness of the security team within the organization. The assessment will help organizations evaluate how well the security team is equipped to deal with situations of data breach and how quickly can they address the issue. Incidents of data leakage and compromise need to be neutralized at the earliest to prevent further damage. For this, the security team should be well equipped and undergo regular training. So, this way red team assessment will ensure the effectiveness of not just the controls in place but also the effectiveness of the security team.
5.Effectiveness of Incident Response Plans
Red Team Assessment also provides an opportunity for the organization, to test the effectiveness of its incident response plans. The test evaluates the security controls and the real-time incident response of an organization in case of an incident. This process demonstrates the preparedness of the organization in terms of responding to incidents and, strategies for mitigating the risk. The entire process also works as a guide for organizations to improve their Incident Response plans and establish a strong cybersecurity program within the organization.
Final Thought
Red Team Assessors are professional hackers having the skills, experience, and expertise of finding gaps and security flaws like a real-world hacker would, in a given scenario. So, talking about hiring a read team assessor, it would definitely be considered as a good decision for it helps find vulnerabilities and also test the effectiveness of controls in place.
Their dynamic approach and multi-layered, thorough assessment process bring out the accuracy in the evaluation process and test the effectiveness of the organization’s security controls. So, organizations looking to strengthen their cybersecurity programs and ensure the effectiveness of their security controls must definitely consider hiring a red team assessor for performing the exercise.
The goal of YATAS is to help you create a secure AWS environment without too much hassle. It won't check for all best practices but only for the ones that are important for you based on my experience. Please feel free to tell me if you find something that is not covered.
You can ignore results of checks by adding the following to your .yatas.yml file:
ignore:
  - id: "AWS_VPC_004"
    regex: true
    values:
      - "VPC Flow Logs are not enabled on vpc-.*"
  - id: "AWS_VPC_003"
    regex: false
    values:
      - "VPC has only one gateway on vpc-08ffec87e034a8953"
Exclude a test
You can exclude a test by adding the following to your .yatas.yml file:
plugins:
  - name: "aws"
    enabled: true
    description: "Check for AWS good practices"
    exclude:
      - AWS_S3_001
Specify which tests to run
To only run a specific test, add the following to your .yatas.yml file:
plugins:
  - name: "aws"
    enabled: true
    description: "Check for AWS good practices"
    include:
      - "AWS_VPC_003"
      - "AWS_VPC_004"
Get error logs
You can get the error logs by adding the following to your env variables:
export YATAS_LOG_LEVEL=debug
The available log levels are: debug, info, warn, error, fatal, panic and off by default