Reading view

There are new articles available, click to refresh the page.

Ethereum Stalls In A Critical Zone As Breakout Structures Wait For Confirmation

Ethereum remains under pressure in a key support zone, teetering between a potential rebound and further decline. While bullish patterns like the cup-and-handle and ascending triangle are shaping up, confirmation is required before any decisive move.

Last Defense Zone: $2,274–$2,104 And The Libra Reversal Setup

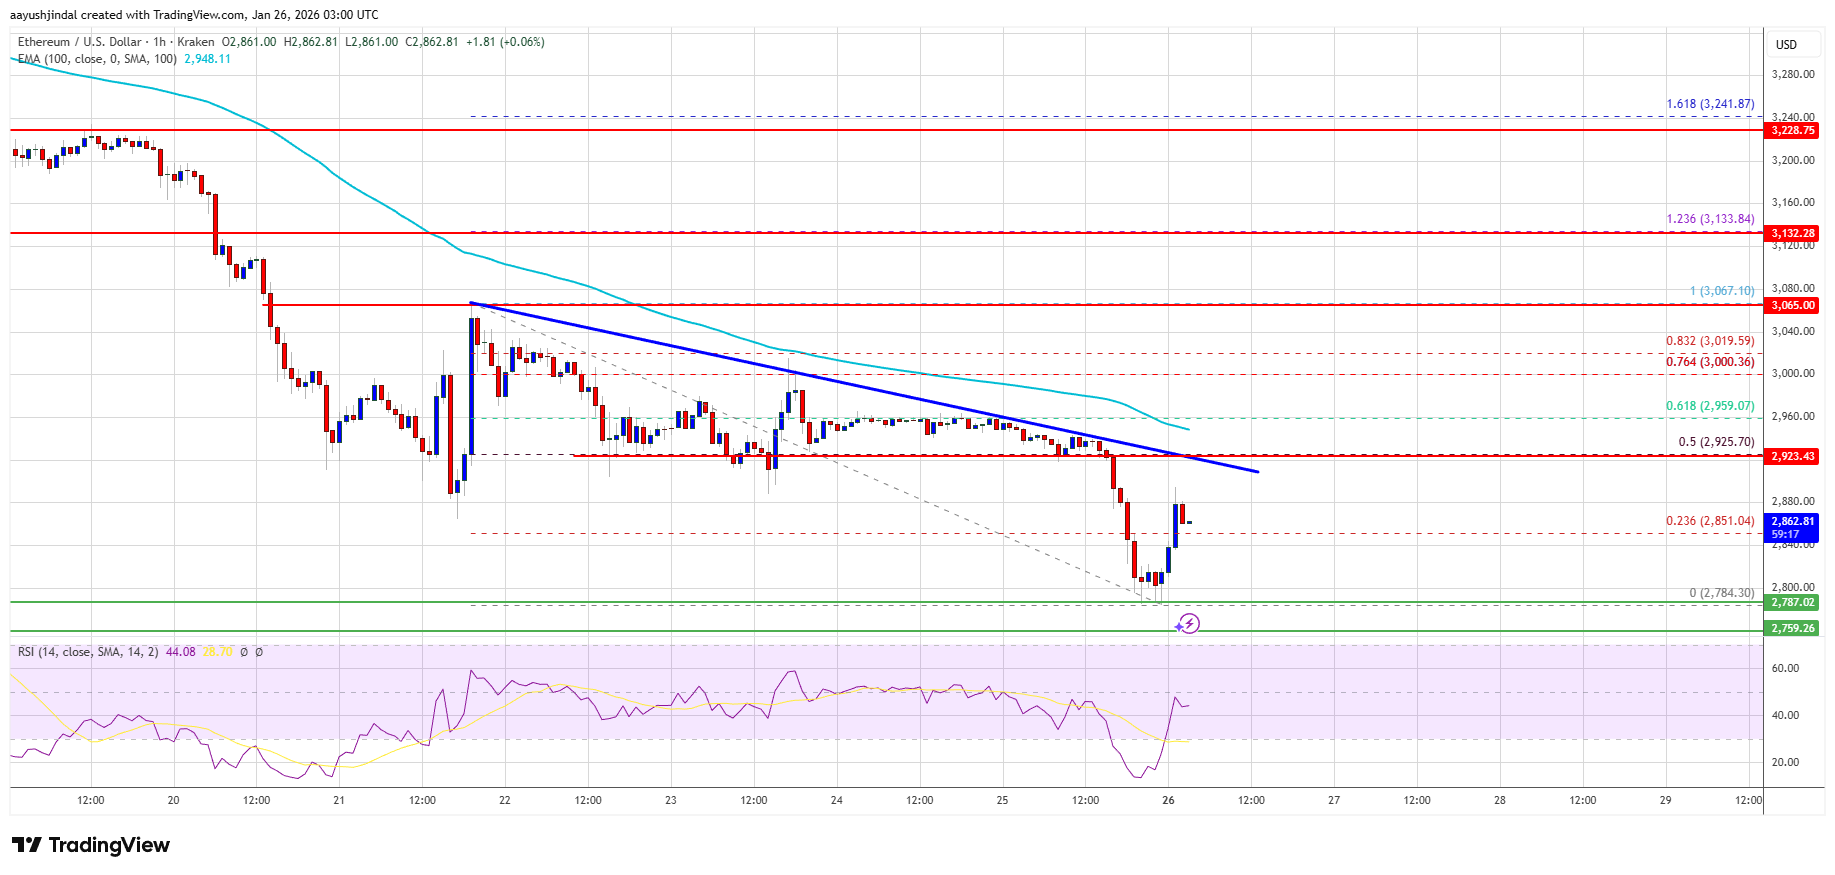
Kamile Uray shared that Ethereum is currently trying to hold above the critical support zone between $2,775 and $2,623. This area has become a key battleground for bulls and bears, with buyers attempting to defend it to prevent further downside. If this support continues to hold, ETH could regain short-term stability and make another attempt to move higher.

On the upside, a sustained bounce from this zone could allow Ethereum to revisit the pink box resistance around the $3,445 level. A clean breakout above this resistance would activate bullish structures such as a cup-and-handle or an ascending triangle, signaling growing bullish momentum and opening the path toward the $3,894 level. However, this becomes possible if ETH manages to close above the $3,661 peak, confirming the formation of the first major high.

Ethereum

The $3,894 level carries technical significance, as it represents the 0.618 Fibonacci retracement of the most recent downward wave. A decisive close above this level would suggest continuation of the recovery. Failure to hold above it, however, could trigger renewed selling pressure and lead to another corrective move lower.

On the downside, if Ethereum loses the $2,623 support, a deeper decline toward the pink box zone between $2,274 and $2,104 would become likely. This area is notable for the potential formation of a bullish Libra pattern. Should reversal confirmation emerge from this zone, ETH could attempt another recovery phase, with the broader objective of retesting its previous highs.

Waiting For Confirmation: ETH’s Next Move Depends On Price Action

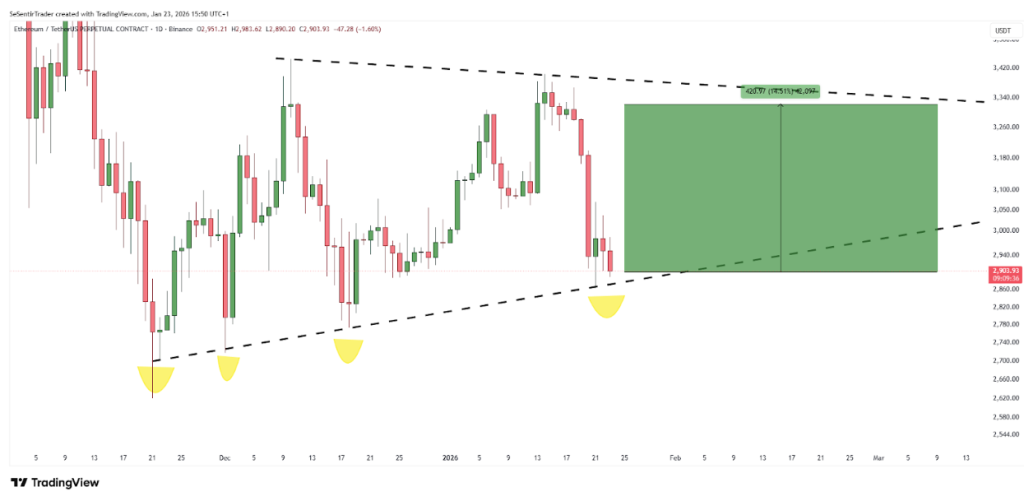
Ethereum is currently following the trajectory outlined by Crypto Candy in a recent update on X. As predicted, the asset dipped into the lower support range between $2,600 and $2,700 and is now attempting to stage a recovery from the zone. Should this upward momentum persist, the immediate objective for bulls is a return to the $3,070 level.

However, for Ethereum to firmly re-enter bullish territory and shift the broader market structure, it must close decisively above the $3,070 threshold. This level serves as the primary gateway for any sustained recovery beyond the current relief rally. Until that breakout occurs, the prevailing market bias remains firmly bearish, as the failure to reclaim and hold above $3,070 suggests that the path of least resistance is still to the downside, with lower price points remaining the primary expectation for the short term.

Ethereum

Crypto Traders Share Odds Of XRP Price Rising 40% This Year, Can It Still Rally?

Retail traders are increasingly optimistic about XRP, even though the cryptocurrency’s price is currently struggling to keep up above $1.90. Despite the recent lack of follow-through in price action, different data shows confidence is building beneath the surface. 

Data from prediction markets by Robinhood shows traders are actively pricing in the possibility of a sizable upside move for XRP’s price action this year, with odds pointing toward a rally of roughly 40% from current levels.

How Prediction Market Pricing Is Reflecting Bullish Expectations

Data from prediction markets hosted on Robinhood shows that traders are actively trading contracts tied to XRP reaching specific price levels in 2026. Notably, the data shows that the contract for XRP trading at $2.75 in 2026 is currently quoted with a bid of $0.66 and an ask of $0.73. 

An ask of $0.73 means that the Robinhood prediction platform believes the likelihood of XRP reaching or exceeding $2.75 is high enough to demand a significant premium. Although this does not represent a guaranteed probability, it suggests that traders offering liquidity see that outcome as more likely than not, placing implied odds in the 73% range based on current pricing.

That same optimism is present as price targets move higher, though more measured. The contract tied to XRP crossing $3.00 is priced around 50 cents. This implies the market views that level as a roughly even chance and a 50% scenario that the XRP price breaks above $3 again in 2026. The ask price drops to 44 cents for an XRP price bet of $3.25, which means there is a 44% chance XRP reaches this level.

Can XRP Still Rally While Near $1.90?

Recent price action has seen XRP now back to trading around support at $1.9. At the time of writing, XRP is trading at $1.88, down by 5% in the past seven days. This decline is part of an extended correction move after XRP’s rally in early January was rejected around $2.41 on January 6. 

The entire crypto industry is now back to a mood of fear, according to CoinMarketCap’s Fear & Greed Index. The index shows that the overall market sentiment is currently sitting at a Fear reading of 29. Even so, this risk-off mood has done little to dampen bullish expectations among many XRP investors. Several forecasts published in January continue to point toward a move into new all-time price highs this year.

Standard Chartered’s analysts, for example, have projected that XRP could reach $8 in 2026 if sustained ETF inflows and clearer regulation are able to increase institutional interest. Another price outlook echoed the idea that a new all-time high above $5 is possible before the year ends based on the current trend of XRP outflows from crypto exchange reserves.

XRP

Gold Hits Record $5K While Bitcoin Struggles To Keep Pace

Gold shone brightly today, racing to a new high while crypto took the back seat, and the gap between the two assets opened wide.

On Monday, the precious metal moved past the $5,000 mark, registering a price point market sentinels had not witnessed before. Bitcoin, by contrast, failed to keep pace and traded well below its recent highs.

Gold Hits Record Levels

Safe-haven demand pushed gold sharply higher. Prices were up above $5k an ounce and inked roughly $5,110 at the peak. Silver, for its part, did not go unnoticed, jumping to fresh peaks near $107/ounce.

Traders pointed to simmering geopolitical friction and talk of tougher trade moves led by US President Donald Trump as fuel for the rally.

A weaker greenback made metals more attractive to customers overseas, and central bank buying provided steady backing. Liquidity in some corners were thin as investors rushed to shift cash into things that feel stable when risk elevates.

Bitcoin Falls Behind

Market numbers show Bitcoin hovering in the mid-$80,000s range, retreating from peaks seen late last year. Reports note the alpha crypto is roughly 30% below the highest level it hit reached in October 2025, leaving some holders quite jittery.

Volatility was another factor. Where bullion is being sought for safety, Bitcoin is viewed more as a growth or speculative play, and that difference in investor application becomes clear when markets tighten. Some funds slashed their crypto exposure, signaling a short reroute away from high-risk gambits.

Why Investors Are Shifting

Analysts and traders described a simple choice: shelter or swing for gains. When headlines push worry, money flows into assets that are widely trusted across markets and governments.

Metals fit that ticket. Based on market chatter, fears of a US government funding clash and fresh tariff announcements stacked pressure on stocks and added a sense of urgency to safe-haven acquisition.

Options and futures trading hinted at a more cautious perpective, with volatility indexes rising and bond yields behaving in ways that made the yellow metal look more appealing by comparison.

What Traders Are Watching

Market watchers said eyes will be glued on a few key metrics: The dollar’s path, moves by major central banks, and any sign that US politics escalates could keep metals elevated.

For Bitcoin, network activity, large wallet flows, and regulatory headlines will likely set the tone. Some traders expect swings both ways. Others caution that when risk appetite is back, crypto may bounce hard, but that outcome is not a sure thing and will be dependent on a string of policy and macro moves.

Featured image from Unsplash, chart from TradingView

Bitcoin Large Holders Lead the Way As BTC Accumulation Picks Up, Is A Rebound Brewing?

Over the weekend, volatility observed across the broader cryptocurrency market intensified, causing the price of Bitcoin to fall back to the $86,000 mark once again. Even with the bearish price action in the past few days, buying activity continues to pick up pace in the market, especially among large BTC holders.

Bitcoin’s Largest Wallets Show Conviction

Bitcoin’s price may have been struggling with heightened volatility as a result of the broader market bearish market action, but bullish sentiment remains present among investors. In the weakening condition, large BTC whales or deep-pocket investors’ sentiment turns positive and are steadily reentering the market.

Data from Santiment, a popular market intelligence and on-chain data platform, suggests that these major investors are building positions at an encouraging and steady pace, even though the broader momentum is demonstrating weakening conditions. In the past, long-term whale accumulation has typically happened in uncertain times when prices don’t accurately reflect underlying confidence.

Santiment noted that the buying activity is spotted among wallet addresses holding over 1,000 BTC. After months of consistent buying, the group has now collectively acquired about 104,340 BTC, which represents a more than 1.5% rise. 

Bitcoin

As a result of the recent purchase, the investors’ overall holdings are currently sitting at 7.17 million BTC, marking their largest level since September 15, 2025. These wealthy investors are subtly consuming available supplies rather than distributing into recent market swings, indicating confidence in Bitcoin’s medium- to long-term potential

While buying pressure is growing among large Bitcoin holders, the number of whale transactions has also experienced a massive upswing. Santiment added that the amount of +$1 million daily transfers has exploded, reaching a 2-month high level.

A Continued Drop In BTC Open Interest

A continued drop in Bitcoin’s Open Interest is coinciding with the ongoing drop in price. Darkfost, a market expert and CryptoQuant author, highlighted that open interest is steadily declining, which does not support the emergence of a new trend as seen on the weekly change basis.

Since November, the metric has remained broadly negative, suggesting that the drop has continued for several weeks. Although there was a brief improvement earlier this month, it was followed by a price reaction. 

Overall, when open interest rises, Darkfost stated that it mostly signals trend continuation to even a trend reversal, triggered by an influx of long positions. Furthermore, this is confirmed with funding rates, but this is what happens in most cases.

On Sunday, as BTC displays a steady correction, deleveraging also increased. While this is bearish in the short term, these phases simultaneously aid in cleaning the market of excessive leverage. Thus, it is critical to remember that futures are still the primary source of volume, making keeping an eye on developments there an essential move.

Bitcoin

Major Reasons Why The XRP Price Could Recover And Surge Again

Crypto analyst Darkfost has highlighted reasons why the XRP price could soon witness a bullish reversal and potentially reach new local highs. This comes amid bearish sentiment in the market, which on-chain analytics platform Santiment said could set the stage for a reversal in the altcoin’s price.  

Why The XRP Price Could Soon See A Bullish Reversal 

In a CryptoQuant blog post, Darkfost stated that negative funding rates signal a potential XRP price reversal. The analyst noted that the altcoin is currently trading around 47% below its all-time high (ATH) set in July last year. Furthermore, the altcoin is said to have naturally entered a phase of distribution and correction after a gain of over 600% since November 2024. 

Darkfost assured that this type of movement is healthy after such a strong rally for the price. He further remarked that what stands out is the timing of the bearish consensus, as it did not form at the top but rather during a drawdown of more than 50%. Now, there are predominantly short positions on XRP, with funding rates on Binance mostly negative since December, indicating that leveraged short positions have the upper hand. 

XRP

The analyst noted that historically, the market tends to move against a late consensus. As such, while the accumulation of shorts creates short-term selling pressure, it also builds latent buying pressure. Darkfost said that if the XRP price starts to rise, these short positions could be liquidated, fueling the upward move. 

He revealed that a similar pattern has occurred for the token price since 2024. The first was between August and September 2024, and the second was during the April 2025 correction, when funding rates turned negative for a period before a bullish rebound occurred. The analyst stated that this price rebound was due to a shift in investor sentiment and funding rates returning to positive territory. 

A Rally Starter For XRP

In an X post, Santiment stated that XRP traders are showing major FUD, which they claimed is usually a rally starter for the XRP price. The on-chain analytics platform revealed that the altcoin has fallen into ‘Extreme Fear’ territory, with small retail traders becoming pessimistic about the token after a 19% decline from its recent high on January 5th. 

Santiment noted that historically, this level of bearish commentary has led to price rallies. This is based on the belief that prices move in the opposite direction to retail’s expectations more often than not. The altcoin has dropped again following the recent decline in the broader crypto market, led by Bitcoin. BTC fell below $87,000 yesterday on the back of U.S. political tensions, government shutdown risk, and ahead of this week’s FOMC meeting. 

At the time of writing, the XRP price is trading at around $1.88, down in the last 24 hours, according to data from CoinMarketCap.

XRP

70% Of Institutional Investors Aren’t Buying The Bitcoin Top Narrative – Here’s Why

Investors are showing a steady faith in Bitcoin even as money moves elsewhere. According to Coinbase’s Charting Crypto Q1 2026 report, many big players think the current price is a bargain. The mood is cautious, but the view among large institutions leans toward holding for the long run.

Institutional Confidence And Behavior

Reports say about 71% of institutional investors view Bitcoin as undervalued when it sits between $85,000 and $95,000. Independent investors are not far behind, with 60% sharing that view.

A quarter of institutions felt the price was fair, and only a small share thought it was too high. These numbers show a strong tilt toward belief in future gains.

Gold And Silver Are Doing Very Well

Gold has climbed sharply, and silver has more than doubled since last October. That flow into metals has come as investors seek shelter while worries over global tensions rise.

Stocks have not surged as much; the S&P 500 has posted modest gains. The contrast is clear: some money went into traditional hedges instead of crypto.

Geopolitical Friction And Trade Signals

Reports note renewed tariff threats from US President Donald Trump and rising strain between the US and parts of the Middle East.

Such moves have been linked to market nervousness. If energy supply or trade routes are hit, risk assets often wobble. That makes Bitcoin more sensitive than usual to headlines.

Bitcoin Price Action In Context

Bitcoin has been trading in the high $80,000s. It briefly tried to hold above $90K but slipped back, touching nearer $86,000 at times.

Volatility has returned, and liquidations were seen after the big October move. Still, many technical analysts keep longer-term targets on their charts, arguing that the broader trend is not necessarily broken.

Institutional Game Plan

Reports say 80% of those large investors would either keep their stakes or add more if prices fell another 10%. More than 60% have already held or raised their positions since October’s peak.

Over half think the market is in an accumulation phase or still in a bear cycle, which explains why many prefer to buy on weakness rather than sell.

Macro Outlook And Possible Tailwinds

Coinbase expects the Federal Reserve to cut rates twice in 2026, an outlook that could help risk assets if it comes to pass. Consumer inflation has been steady and GDP growth looked strong in the last quarter. These conditions could nudge sentiment back toward risk-taking, though timing is far from sure.

The story is not simply bullish or bearish. On one hand, large investors show clear conviction and are willing to act on dips.

On the other, safe-haven flows and geopolitical shocks keep a lid on rapid re-rating. The near-term path is likely choppy, while the longer view depends on whether macro calm returns and whether demand for crypto picks up again.

Featured image from Unsplash, chart from TradingView

Bitcoin Price Prediction: Analyst Forecasts 72.86% Crash To $30,000

A new Bitcoin price prediction has been put forward following a long-term technical analysis shared on the social media platform X by crypto analyst Leshka.eth. The analysis compares Bitcoin’s current structure on the weekly timeframe to the 2021 market peak, showing how price behavior is repeating an identical pattern. 

Based on how Bitcoin has interacted with a rising multi-year channel in previous cycles, the analysis proposes a projection as to how Bitcoin could be setting up for a powerful corrective move that sends the price back to as low as $30,000.

Bitcoin Weekly Structure About To Break

Technical analysis of Bitcoin’s price action on the weekly candlestick timeframe chart shows that the leading cryptocurrency has been trading with higher highs and higher lows since 2018. Interestingly, this trend of higher highs has led to repeated interaction with a rising resistance trendline that has defined every major cycle top.

As shown in the chart below, Bitcoin pushes into this upper boundary during each bull market, only to be rejected once momentum fades. These rejection points are clearly marked across multiple cycles, including the 2017 and 2021 peaks. This repeated failure is a defining feature of Bitcoin’s macro cycles of exhaustion after prolonged upside expansion.

Bitcoin once again rallied into this same long-term trendline when it broke to new all-time highs in October 2025 before stalling and rolling over. Bitcoin’s price failed to hold above the trendline and has corrected by about 30% since then. The leading cryptocurrency is now trading below $90,000, and this technical outlook introduces the possibility that the current pullback is not yet complete and could extend further.

Bitcoin price

Bitcoin Weekly Candlestick Chart. Source: @leshka_eth on X

Bitcoin Crash Extension To $30,000?

The chart also highlights the depth of prior bear market declines once Bitcoin was rejected at this long-term structure. After the 2017 cycle top, Bitcoin fell roughly 84.99% from peak to trough. Following the 2021 high, Bitcoin once again declined by about 77.47% before finding a bottom near the lower boundary of the broader rising channel. 

Based on the current setup, the projected downside move marked on the chart measures approximately 72.86%. Applying a drawdown of that magnitude from the recent cycle high places Bitcoin’s potential bottom around $30,000.

Interestingly, Grok AI offered a more optimistic interpretation of Bitcoin’s near-term outlook based on responses to questions under the same technical post. According to Grok, aggregated views from sources such as CNBC, Reddit, and Forbes suggest that the probability of Bitcoin dropping into the $30,000 to $40,000 range is relatively low, estimated at around 15% to 25% by bearish cycle models.

On the other hand, many analysts instead expect higher price floors, often above $50,000. Some long-term projections extend over $200,000, with names like Binance co-founder Changpeng Zhao predicting $200,000 and Tom Lee predicting $250,000 in 2026.

Bitcoin price chart from Tradingview.com

Why Is Japan Going All In On XRP? Expert Exposes What’s Going On Behind The Scenes

Japan appears to be going all in on XRP, as new reports reveal that the country is working toward reclassifying the cryptocurrency. An XRP advocate and expert known on X as ‘SonOfaRichard’ has exposed what’s going on behind the scenes, noting that Japan is now transforming XRP into a real financial infrastructure, formally integrating it into the country’s capital markets. 

Behind Japan’s New Commitment To XRP

For many countries, particularly the US and South Korea, XRP has primarily been viewed as a digital asset for payments and trading, subject to both bullish and bearish price action. However, Japan has recently taken a step further, moving beyond the speculative bubble and aiming to reclassify the altcoin and integrate it into the country’s financial infrastructure. 

In his post on X, SonOfaRichard delved deep into this ongoing development, highlighting the significance and implications of Japan’s involvement in XRP. He said that Japan is not merely expressing bullish sentiment on XRP, as many countries, traders, and analysts do. Instead, it is changing how the cryptocurrency is classified domestically by placing it under the Financial Instruments and Exchange Act (FIEA). This move represents a significant regulatory shift rather than a market-driven endorsement. 

According to the expert, assets under the FIEA are not designed to fuel speculative market pumps. By moving XRP under this new regulatory framework, Japan would effectively position it alongside traditional financial products, such as bonds, funds, and derivatives. This shift removes primary focus on short-term price movements and prioritizes structure and oversight as a pathway toward long-term market development and maturation.

SonOfaRichard has said that Japan’s reclassification of XRP will introduce insider trading controls, custody audits, disclosure standards, and clearer rules for institutional balance sheets. He explained that once the process is complete, it will not be treated as an experiment but as a full infrastructure normalization. He added that institutions that have been waiting for clear regulatory approval may soon receive it, as Japan moves closer to granting final authorization.

Timeline For Japan’s Reclassification

In his post, SonOfaRichard clarified the timeline of Japan’s reclassification of XRP. He explained that it would not be an immediate change, as the process follows Japan’s fiscal-year logic, not the US calendar. Legislative submission is expected in 2026, with full implementation aligned with Japan’s formal fiscal rails and taking effect only after official approval. 

The XRP expert noted that Japan’s regulatory system runs on a fiscal year from April to March, and new rules typically come into effect at the start of the fiscal cycle rather than mid-year.  This means XRP’s reclassification will likely occur sometime in Q2 2026. 

SonOfaRichard also emphasized that the reclassification will focus on institutional treatment, custody, disclosure, and compliance standards. He added that the process represents a massive structural shift and will therefore unfold slowly and deliberately to ensure proper alignment with Japan’s established regulatory frameworks. 

XRP price chart from Tradingview.com

Solana (SOL) Slips Further As Bears Target Deeper Support Zones

Solana failed to settle above $132 and extended losses. SOL price is now consolidating losses below $130 and might struggle to start a recovery wave.

  • SOL price started a fresh decline below $132 and $130 against the US Dollar.
  • The price is now trading below $130 and the 100-hourly simple moving average.
  • There is a key bearish trend line forming with resistance at $126 on the hourly chart of the SOL/USD pair (data source from Kraken).
  • The price could start a recovery wave if the bulls defend $118 or $115.

Solana Price Dips Further

Solana price failed to remain stable above $132 and started a fresh decline, like Bitcoin and Ethereum. SOL declined below the $130 and $126 support levels.

The price gained bearish momentum below $122. A low was formed at $117, and the price is now consolidating losses. The price recovered a few points and climbed above the 23.6% Fib retracement level of the downward move from the $132 swing high to the $117 low.

Solana is now trading below $130 and the 100-hourly simple moving average. On the upside, immediate resistance is near the $125 level or the 50% Fib retracement level of the downward move from the $132 swing high to the $117 low.

Solana Price

The next major resistance is near the $126 level. There is also a key bearish trend line forming with resistance at $126 on the hourly chart of the SOL/USD pair. The main resistance could be $132. A successful close above the $132 resistance zone could set the pace for another steady increase. The next key resistance is $140. Any more gains might send the price toward the $144 level.

Another Drop In SOL?

If SOL fails to rise above the $126 resistance, it could continue to move down. Initial support on the downside is near the $119 zone. The first major support is near the $117 level.

A break below the $117 level might send the price toward the $115 support zone. If there is a close below the $115 support, the price could decline toward the $102 support in the near term.

Technical Indicators

Hourly MACD – The MACD for SOL/USD is losing pace in the bearish zone.

Hourly Hours RSI (Relative Strength Index) – The RSI for SOL/USD is below the 50 level.

Major Support Levels – $117 and $115.

Major Resistance Levels – $126 and $132.

XRP Price Bearish Continuation Confirmed As Downside Pressure Builds

XRP price extended losses and traded below $1.880. The price is now consolidating and might decline further if it remains below $1.920.

  • XRP price started a fresh decline below the $1.90 zone.
  • The price is now trading below $1.90 and the 100-hourly Simple Moving Average.
  • There is a key bearish trend line forming with resistance at $1.885 on the hourly chart of the XRP/USD pair (data source from Kraken).
  • The pair could continue to move down if it stays below $1.90.

XRP Price Dips Further

XRP price failed to stay above $1.950 and started a fresh decline, like Bitcoin and Ethereum. The price declined below $1.920 and $1.90 to enter a short-term bearish zone.

The price even spiked below $1.850. A low was formed at $1.810, and the price is now consolidating losses. There was a recovery wave above $1.850. The price cleared the 23.6% Fib retracement level of the downward move from the $1.963 swing high to the $1.810 low, but the bears remained active.

The price is now trading below $1.90 and the 100-hourly Simple Moving Average. If there is a fresh upward move, the price might face resistance near the $1.8850 level and the 50% Fib retracement level of the downward move from the $1.963 swing high to the $1.810 low. There is also a key bearish trend line forming with resistance at $1.885 on the hourly chart of the XRP/USD pair.

XRP Price

The first major resistance is near the $1.90 level. A close above $1.90 could send the price to $1.950. The next hurdle sits at $2.00. A clear move above the $2.00 resistance might send the price toward the $2.050 resistance. Any more gains might send the price toward the $2.120 resistance. The next major hurdle for the bulls might be near $2.20.

Downside Break?

If XRP fails to clear the $1.90 resistance zone, it could start a fresh decline. Initial support on the downside is near the $1.840 level. The next major support is near the $1.820 level.

If there is a downside break and a close below the $1.820 level, the price might continue to decline toward $1.780. The next major support sits near the $1.750 zone, below which the price could continue lower toward $1.70.

Technical Indicators

Hourly MACD – The MACD for XRP/USD is now gaining pace in the bearish zone.

Hourly RSI (Relative Strength Index) – The RSI for XRP/USD is now near the 50 level.

Major Support Levels – $1.840 and $1.820.

Major Resistance Levels – $1.8850 and $1.90.

Ethereum Price Sinks To $2,800, Raising Fresh Downside Fears

Ethereum price extended losses and traded below the $2,865 zone. ETH is now consolidating losses and might aim for a recovery if it clears $2,920.

  • Ethereum remained in a bearish zone and traded below $2,950.
  • The price is trading below $2,900 and the 100-hourly Simple Moving Average.
  • There is a bearish trend line forming with resistance at $2,920 on the hourly chart of ETH/USD (data feed via Kraken).
  • The pair could start a fresh increase if it stays above the $2,800 zone.

Ethereum Price Dips Further

Ethereum price failed to remain stable above $2,950 and extended losses, like Bitcoin. ETH price declined below $2,880 and $2,865 to enter a bearish zone.

The bears even pushed the price below $2,840. The price finally tested $2,800 and is currently consolidating losses. There was a minor upside above the 23.6% Fib retracement level of the downward wave from the $3,067 swing high to the $2,784 swing low.

Ethereum price is now trading below $2,900 and the 100-hourly Simple Moving Average. If the bulls can protect more losses below $2,800, the price could attempt another increase.

Immediate resistance is seen near the $2,920 level. There is also a bearish trend line forming with resistance at $2,920 on the hourly chart of ETH/USD. The first key resistance is near the $2,960 level or the 61.8% Fib retracement level of the downward wave from the $3,067 swing high to the $2,784 swing low. The next major resistance is near the $3,000 level. A clear move above the $3,000 resistance might send the price toward the $3,065 resistance.

Ethereum Price

An upside break above the $3,065 region might call for more gains in the coming days. In the stated case, Ether could rise toward the $3,120 resistance zone or even $3,150 in the near term.

More Losses In ETH?

If Ethereum fails to clear the $2,920 resistance, it could start a fresh decline. Initial support on the downside is near the $2,840 level. The first major support sits near the $2,800 zone.

A clear move below the $2,800 support might push the price toward the $2,780 support. Any more losses might send the price toward the $2,720 region. The main support could be $2,650.

Technical Indicators

Hourly MACDThe MACD for ETH/USD is losing momentum in the bearish zone.

Hourly RSIThe RSI for ETH/USD is now below the 50 zone.

Major Support Level – $2,800

Major Resistance Level – $2,920

Bitcoin Price Breakdown Risk Grows As Bears Aim For $85K

Bitcoin price extended losses and traded below $88,500. BTC is consolidating losses and might attempt a recovery wave if it clears $88,500.

  • Bitcoin started a minor recovery wave from the $86,000 level.
  • The price is trading below $88,200 and the 100 hourly Simple moving average.
  • There is a new bearish trend line forming with resistance at $88,000 on the hourly chart of the BTC/USD pair (data feed from Kraken).
  • The pair might recover if it manages to settle above $86,200 and $86,000.

Bitcoin Price Dips Further

Bitcoin price failed to stay above the $89,000 support and extended losses. BTC declined sharply below the $88,500 and $87,000 support levels.

The bears even pushed the price below $86,500. A low was formed at $86,007, and the price is now attempting a recovery wave. There was a move above the 23.6% Fib retracement level of the downward move from the $91,099 swing high to the $86,007 low.

Bitcoin is now trading below $88,500 and the 100 hourly Simple moving average. If the price remains stable above $86,500, it could attempt a fresh increase. Immediate resistance is near the $88,000 level. There is also a new bearish trend line forming with resistance at $88,000 on the hourly chart of the BTC/USD pair.

The first key resistance is near the $88,500 level since it is close to the 50% Fib retracement level of the downward move from the $91,099 swing high to the $86,007 low.

Bitcoin Price

A close above the $88,500 resistance might send the price further higher. In the stated case, the price could rise and test the $89,200 resistance. Any more gains might send the price toward the $90,000 level. The next barrier for the bulls could be $91,000 and $91,500.

More Losses In BTC?

If Bitcoin fails to rise above the $88,500 resistance zone, it could start another decline. Immediate support is near the $86,700 level. The first major support is near the $86,200 level.

The next support is now near the $85,500 zone. Any more losses might send the price toward the $83,500 support in the near term. The main support sits at $82,500, below which BTC struggle to recover in the near term.

Technical indicators:

Hourly MACD – The MACD is now losing pace in the bearish zone.

Hourly RSI (Relative Strength Index) – The RSI for BTC/USD is now below the 50 level.

Major Support Levels – $86,700, followed by $86,000.

Major Resistance Levels – $88,500 and $89,200.

XRP Enters Phase 4 In Long-Term Chart Structure: Road To $21.5 Now Open

Technical analysis of XRP’s price action on the 3-week candlestick timeframe chart shows that the cryptocurrency is about to play out a road to the double-digit threshold based on its long-term structure. 

The analysis, which was shared on the social media platform X alongside a multiyear chart, points to XRP trading in what is labeled Phase 4. At the center of this setup is a clear technical target of a break above the previous all-time high and a run to at least $21.5

XRP Price Action In Phases

Technical analysis of XRP price action shows that the cryptocurrency has been trading in a series of four phases for more than a decade. One full sequence of four phases unfolded between mid-2013 and mid-2017 as the foundation for XRP’s first rally to price peaks. Since then, a second set of four phases has been developing and following a similar pattern. 

XRP transitioned into a new phase 1 and phase 2 sequence that led to a 2018 peak for phase 1 and then a pullback for phase 2 between 2018 and 2020. This was followed by an unusually long p3 that stretched from 2019 to mid-2024, visible on the chart as a broad, multi-year consolidation with converging trendlines of lower highs and higher lows. During this time, XRP’s price action was trapped inside the compression structure, just like the behavior seen during phase 3 of the first cycle.

XRP Price Chart. Source: @amonyx On X

Phase 4 Returns: XRP To Double Digits

According to the technical analysis, phase 4 began in 2025, when XRP finally broke above the compression range in mid-2024. This breakout was the same structural transition seen in mid-2017, when XRP exited consolidation and entered expansion. 

Phase 4 has already been in progress for several months and includes the period when XRP rallied to new all-time highs in mid-2025, eventually topping out at $3.65 in July. Since that peak, however, XRP’s price action has been playing out a corrective downward trend and is down by roughly 48% at the time of writing. 

Despite the ongoing correction, the projection is that XRP is still in phase 4 and is going to break into new all-time highs soon. This shows that phase 4 could unfold over an extended period and not with a single impulse move. The current all-time high of $3.65 is the first major technical hurdle, and a break above it will serve as confirmation that XRP is back into price discovery.

Based on this technical analysis, past expansion ratios from the previous cycle are applied and a 6.618 Fibonacci extension is measured from the phase 3 support low. This points to a projected price level near $21.5. At the time of writing, XRP is trading at $1.89, meaning a move to that level would represent an increase of roughly 1,040% from current prices.

Featured image from Pexels, chart from TradingView

Colombia Pension Giant Takes First Step Into Bitcoin – Details

AFP Protección, Colombia’s second-largest private pension manager, is preparing a new product that will give some savers a way to gain exposure to Bitcoin. Reports say the move will be limited, targeted and tied to advisory checks rather than open to every account holder.

Bitcoin As An Option For Qualified Savers

Reports note the fund will be offered only to investors who meet a risk profile and pass a tailored advisory process. That means access won’t be automatic; it will be conditional on an assessment meant to match a person’s tolerance with a small, optional slice of crypto.

The product is designed for long-term allocation and not for quick trading or speculation, according to market coverage. AFP Protección’s executives emphasized that core pension portfolios will remain focused on traditional assets such as bonds and equities, and that any Bitcoin exposure would be a narrow, complementary allocation.

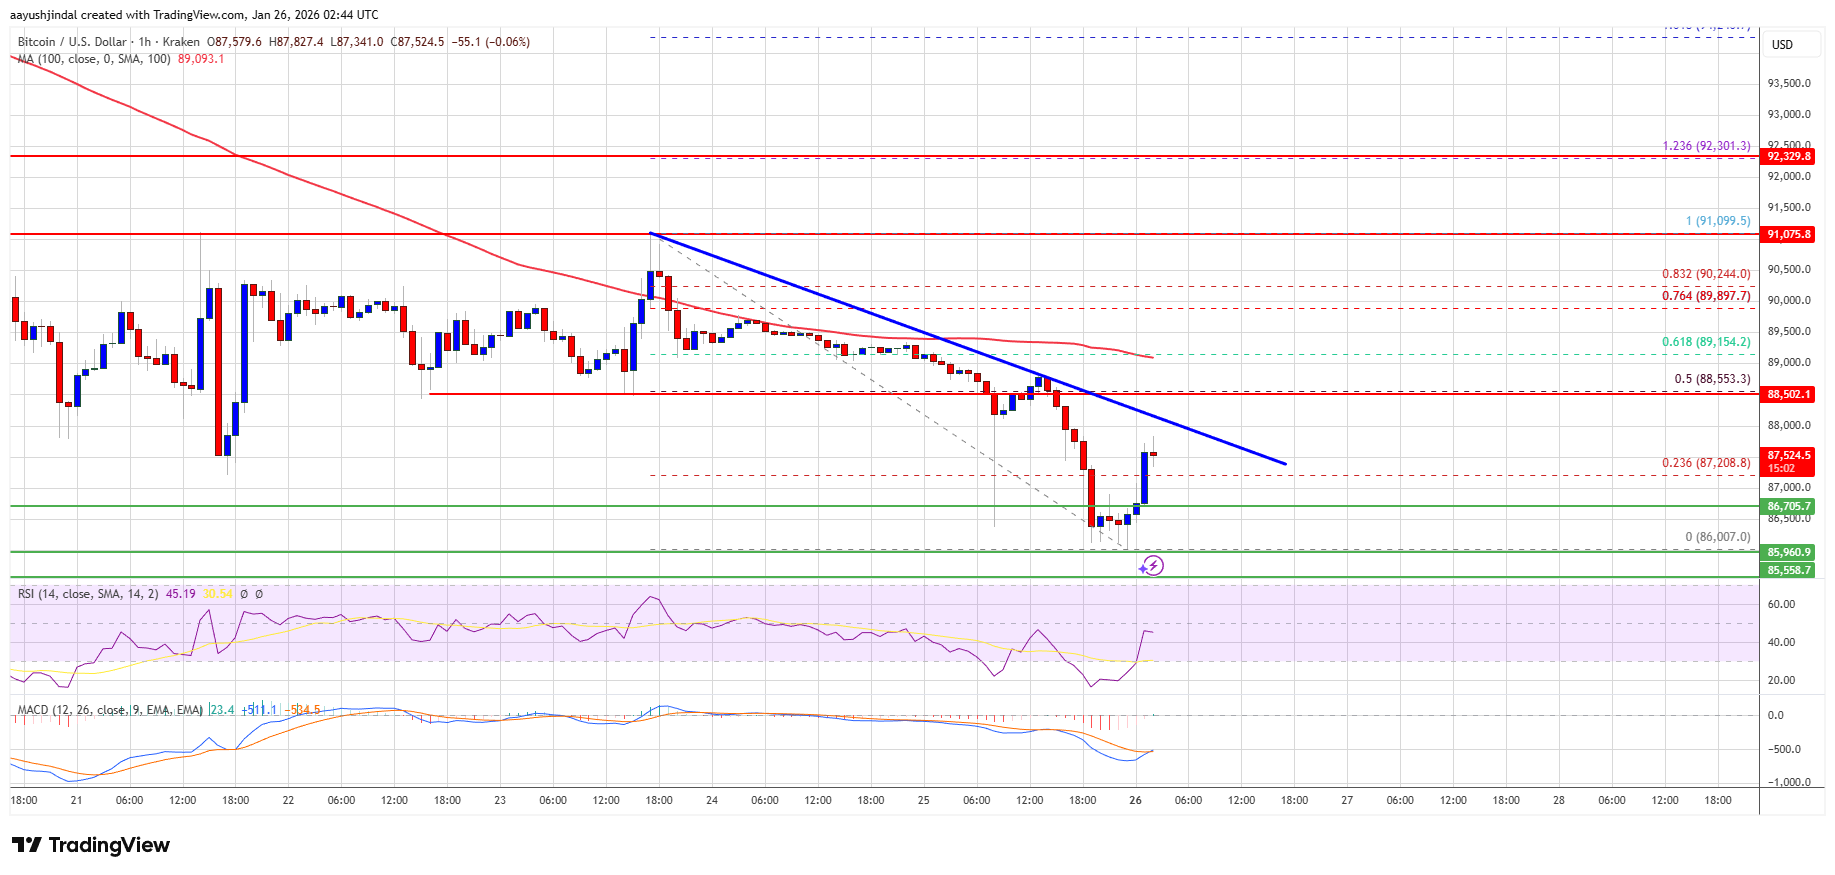
💥 En primicia, Valora Analitik conoció que Protección se prepara para lanzar desde Colombia un fondo con exposición a Bitcoin. El producto no estará enfocado en la especulación de corto plazo, sino en ampliar las opciones de diversificación con una gestión integral de riesgos y… pic.twitter.com/nAO8mbsTLi

— Valora Analitik (@ValoraAnalitik) January 22, 2026

The language used by the firm frames the initiative as diversification rather than a wholesale shift of retirement capital. Juan David Correa, who serves as president of Protección SA, confirmed the plan in an interview with local media outlet Valora Analitik.

Size And Reach Of The Manager

AFP Protección manages assets for millions of clients and has a sizable balance sheet. Reports put its assets under management at roughly 220 trillion Colombian pesos — roughly US$55 billion — and note that the firm serves a broad base of workers through mandatory pensions, voluntary saving plans and severance accounts. The sheer scale of the manager helps explain why even a small, optional product gets wide attention.

Regulation And Reporting

Reports also point to a tightening regulatory backdrop in Colombia. Tax and customs authorities have rolled out new crypto reporting rules that align with international reporting standards.

Those rules are likely to affect how crypto products are structured and how returns or transfers are reported for tax purposes. The change in rules is one reason AFP Protección has framed its product as measured and compliant.

How This Fits A Regional Trend

Across Latin America, some institutional players have been experimenting with limited crypto exposure for years. Colombia’s move follows earlier steps by one or two other local managers and fits a regional pattern where established firms test small, controlled offerings before widening access. The step will be watched closely by investors and regulators overseas.

Reports say potential participants should expect thorough suitability checks, clear disclosures and limits on how much of a retirement portfolio can sit in the new vehicle.

Featured image from Pexels, chart from TradingView

Bitcoin Finds A Real-World Use Case In Las Vegas Stores

Small shops and some bigger chains in Las Vegas are now taking Bitcoin for everyday buys. People scan a QR code, pay from a phone, and the merchant gets paid. According to local reports, owners are trying this out to cut the cost of credit card processing and to attract customers who prefer crypto.

Merchants Cut Costs With Bitcoin

Reports say the move is largely about fees. Credit card processing often takes away 2.5–3.5% of a sale. For many small operators, that is painful. Payment tools that accept Bitcoin — often routed over the Lightning Network or through services that can convert crypto to cash — have lowered that burden for merchants.

According to FOX5, more businesses across Las Vegas are now accepting Bitcoin payments, from chains like Steak ’n Shake to small shops and medical practices. Merchants said Bitcoin helps attract new customers and cut costs, while Square has enabled about 4 million U.S. merchants…

— Wu Blockchain (@WuBlockchain) January 24, 2026

Square’s program, which lets millions of US merchants enable Bitcoin checkout with no processing fee through 2026, helped speed up adoption in the area.

Stores Report Real Transactions

Business owners are reporting real use, not just experiments. Juice stands and cafes have processed payments. Some larger outlets are listed on public payment maps so customers can find them.

This has meant more foot traffic from people who travel with crypto or who prefer to keep their cards for other uses. Reports note both new customers and savings on fees as clear benefits.

Lightning Network Speeds Up Payments

The Lightning Network is being used to make payments faster and cheaper at the cash register. It moves small Bitcoin payments quickly without the long wait a base-layer transfer can cause.

Merchants scan a code or show one on a screen. The payment is then sent from the buyer’s wallet and settled almost instantly. This technical fix has made in-person Bitcoin payments workable for the first time at many spots.

How Owners See It

Owners are balancing savings against new risks. Some keep crypto for a short time, then sell it for cash. Others leave part of their receipts in Bitcoin. Chargebacks, a problem with cards, are reduced when crypto is used.

A few places say small boosts in sales followed their switch to crypto, yet long-term patterns are still being watched. Reports have disclosed these mixed outcomes as part of a slow but clear shift.

Customers Find New Ways To Pay

Shoppers are adapting. Tourists who carry crypto find these spots useful. Locals who are curious try the method at least once. Payment apps and merchant directories make the process easier for everyone.

For those who like simple steps, scanning a QR code and approving a payment on a phone works fine. For others it is a novelty that might stick.

Featured image from Unsplash, chart from TradingView

💾

Las Vegas Valley businesses are accepting Bitcoin as payment as the cryptocurrency continues to grow in popularity.For more Local News from KVVU: https://www...

XRP Charts Flash Familiar Signal As Analyst Calls For $11, Then $70

A growing number of chart watchers are pointing to a long stretch of sideways trading for XRP and saying this setup has come before big rallies. According to a widely followed analyst known as CryptoBull, the current price action echoes earlier runs in the token’s history.

The signal is simple: long quiet periods sometimes lead to sharp moves when buying pressure returns. That does not mean a jump is guaranteed. Markets can stay quiet for a long time, and timing is uncertain.

Pattern Mirrors Prior Cycles

Based on reports, XRP’s weekly structure shows a stretch of range trading after strong breakouts from earlier years. The comparison reaches back several cycles. In past examples, long ranges eventually gave way to impulsive runs that pushed the price far above prior highs.

The next impulse will take #XRP to $11 and the last wave to $70. The price pattern is copying the previous bullrun, only difference is time, which makes sense, as we need longer accumulation for higher prices. pic.twitter.com/WJxzYDVRKT

— CryptoBull (@CryptoBull2020) January 23, 2026

CryptoBull argues the present consolidation has lasted longer than previous ones, which, he says, could compress price action and build fuel for a larger expansion when momentum flips. The idea rests on history repeating itself in broad strokes, not in exact moves.

Longer Accumulation Could Support Bigger Targets

Some analysts see a sixfold move as plausible if the same pattern plays out. That kind of rise would put XRP near $11, a figure being discussed by multiple commentators. There is also talk of a further, final wave lifting the token much higher in a later stage — talk that reaches $70 in extreme scenarios.

A bottom test—where price revisits support to confirm strength before a new push—has appeared in a few past cycles and is being watched closely now.

The presence of such tests can either validate a base or warn that the range has more work to do. Timelines are vague, and a long accumulation period can stretch for years before any decisive breakout.

RLUSD Rumors Fuel Speculative Calls

Reports that BlackRock may use Ripple’s RLUSD stablecoin have added fuel to the fire. News like that has pushed sentiment upward and sparked fresh technical calls, with some forecasts ranging from $6 to $14 in near- to mid-term scenarios.

Other voices go far beyond, naming targets that would imply market caps so large they would be hard to reconcile with today’s market size.

These more extreme numbers should be treated with caution, because they assume near-perfect conditions and massive capital flows that may never arrive. Still, adoption whispers can tilt sentiment and speed up moves when buyers pile in.

Featured image from Unsplash, chart from TradingView

Money Keeps Leaving: Bitcoin ETFs Shed $1.72 Billion In Just 5 Sessions

US-based spot Bitcoin exchange-traded funds pulled funds for a fifth straight trading day, and the totals added up quickly. According to Farside data, about $103.5 million left on Friday, bringing the five-day sum to roughly $1.72 billion.

Bitcoin was trading near $89,160 at the time of these reports — still well below the $100,000 mark it last reached on November 13. This movement has sent a clear signal: many investors are stepping back right now.

ETF Flows And Who Is Selling

Reports note that ETF flows are often on the radar as a quick read on investor mood, but the picture is not always simple. Large outflows can reflect institutional rebalancing or tactical moves by funds, not only mass retail selling.

The US market had a four-day trading week because of Martin Luther King Jr. Day on Monday, which may have concentrated trades into fewer sessions and amplified the numbers. Still, losing more than a billion dollars in a few days will get attention.

Market Mood And Metals

The wider mood has soured. The Crypto Fear & Greed Index registered an Extreme Fear score of 25, and sentiment trackers have been flashing caution. Reports say Santiment believes retail traders are pulling back while attention drifts toward more traditional assets.

Meanwhile, metals have been strong. Reports disclose that with gold trading near $5,000 and silver approaching $100, some market players feel Bitcoin has been left out of a rally that lifted metals, which has weighed on confidence in the crypto market.

Bitcoin Price Action

Bitcoin has struggled to find a steady rhythm over the past week. Prices slipped below the $89,000 to $90,000 range as traders reacted to fresh geopolitical tension and renewed trade worries, before stabilizing as nerves eased.

This was driven higher after some soft political indicators around tariff threats, only to substantiate the idea that markets rarely react to conflict but rather to changes in tone and expectations.

Signals That Could Matter

These movements illustrate how Bitcoin behaves more like a risk asset rather than an asset shelter, falling in tandem with equities when unexpected financial shocks hit the globe, before rebounding when the fever subsides to gather fresh buyers.

Current price patterns indicate caution, where traders are weighing short-term political risks against medium- and long-term macro patterns, as well as institutional interests.

There are some quieter indications that the rout could be losing steam. To this effect, there are assertions suggesting that supply distribution on-chain and social chatter can be circumstantial evidence showing there is less selling pressure.

Featured image from Money; Shutterstock, chart from TradingView

Bitcoin Bears Record Fall In Market Strength — Is A Trend Reversal On?

In the past three days, the price of Bitcoin has moved between $88,000 to $90,000, indicating a rather stable market with little volatility. This ongoing price consolidation comes after the leading cryptocurrency suffered a significant setback in its goal to reclaim its psychological six-figure valuation.

During the week, Bitcoin prices fell from around $96,000 to below $88,000, establishing a new yearly low for 2026. However, amid this discouraging price action, the underlying on-chain data suggests a developing exhaustion among market bears, thus hinting at a highly-anticipated trend reversal.

Market Optimism Despite Negative Reading

In a recent QuickTake post, popular analyst Burak Kesmeci shares insight on a potential bullish reversal in the Bitcoin market following recent changes in the Growth Rate Difference – an on-chain metric that measures variation between the asset’s market cap growth rate and realized cap growth rate. 

For context, the market cap reflects the total market value of an asset, determined by price and circulating supply. Therefore, it’s often a speculative indicator. Conversely, the realized cap measures the actual capital inflows to an asset. It’s a slow-moving, structural metric, and it’s best for ascertaining capital commitment and the underlying market strength.

When the Bitcoin Growth Rate Difference is positive, it indicates a bull market, as speculative demand exceeds actual capital inflows. On the other hand, a negative value suggests that price growth is slower than real money inflows, which are characteristic of a bearish or consolidatory market.


Bitcoin

According to Kesmeci, the Bitcoin Growth Rate Difference has been negative since October 30, suggesting investors have been in a bear market over the last three months. During this time, prices have famously crashed by over 17%. 

However, the Growth Rate Difference has also increased from -0.0013 on November 22nd to -0.0009 on January 24, suggesting a budding resurgence in speculation and price growth. Moreover, this development also indicates that bearish fatigue is setting in, paving the way for a bullish market rebound. Nevertheless, a clean break above the 0 midline to confirm entry into bull territory and on-chain support for upside momentum.

Bitcoin Price Overview

At press time, Bitcoin is valued at $89,223, reflecting a minor loss of 0.25% in the last day. Meanwhile, the daily trading volume is down by 58.72,% indicating that most market participants are less willing to engage the market at the moment, thus explaining the sluggish price action. 

Bitcoin

Analyst Says You’re Not Bullish Enough On Ethereum – What Does He Mean?

A growing number of analysts believe Ethereum’s current price action is being misunderstood. Although frustration is growing due to Ethereum’s inability to hold above $3,000, some technical analysts are quick to point out that the structure forming beneath the surface tells a very different story. According to one analyst, the real risk right now is not being bullish on Ethereum and trying to short in anticipation of a downside breakout.

Higher Lows And A Structure That Keeps Tightening

The analyst’s technical view on Ethereum is focused less on short-term momentum and more on the structure developing on the chart, which he argues is even clearer than what is currently visible on Bitcoin’s chart.

Notably, Ethereum’s price action is carving out a series of higher lows on the daily candlestick timeframe chart to form a tightening triangular pattern since December 2025. This kind of behavior shows that each pullback is being absorbed at progressively higher levels, which is how strong trends reset before continuation.

Ethereum needs to avoid a breakdown below key support zones in order for this trend continuation setup to still be valid. According to the analyst, a dip under $2,860 would begin to weaken the pattern, while a close below $2,780 would invalidate the higher-low structure. 

At the time of writing, Ethereum is trading around $2,950, which is dangerously close to the lower boundary of this setup. Therefore, some traders will be tempted to short Ethereum at this level, but the analyst called it the dumbest thing to do here.

As long as those levels ($2,860 and $2,780) hold, the analyst sees no technical justification for betting against ETH, especially near the lower boundary of the channel where buyers have repeatedly stepped in. 

If support holds, the next move would be a gradual return to the upper trendline of the channel, which is just below $3,340. A move into that region would bring price back into direct contact with overhead resistance and set the stage for a breakout if buying pressure continues to increase.

Ethereum Price Chart. Source: @Tryrexcrypto on X

The Bigger Picture Behind Ethereum’s Price Action

Ethereum is entering 2026 without clear bullish momentum, a reality that has dampened sentiment across the spot and derivatives markets. Spot ETF inflows into Ethereum and Bitcoin have slowed down, and issuers have been highlighted with consistent days of outflows.

Nonetheless, major asset managers are still holding huge amounts of Ethereum and are working on diversifying their activities on Ethereum. BlackRock, for example, filed with the SEC in December to launch a staked Ethereum exchange-traded fund, a move that will bring in more institutional investors into the Ethereum ecosystem.

Speaking of staking, BitMine Technologies recently amped up its ETH staking to over $5.71 billion worth of Ethereum. On-chain data from Arkham Intelligence shows that the firm has staked an additional 171,264, worth $503.2 million, pushing its total stake to over 1.94 million ETH.

Featured image from Unsplash, chart from TradingView

Bitcoin Price Mirroring Key Patterns From 2021 – Is History About To Repeat?

The Bitcoin price is showing signs of history repeating itself, as current price action mirrors key patterns from the 2021 cluster. With resistance near $91,000–$92,000 and the macro downtrend looming, traders are watching closely to see if BTC will break higher or face renewed pressure. The coming days could prove decisive in shaping the next major move.

Bitcoin Mirrors 2021 Cluster: History In Motion

Bitcoin continues to mirror the price patterns seen during the 2021 cluster. Crypto analyst Rekt Capital noted that the current market structure is echoing historical behavior, suggesting that similar dynamics are at play. Traders are closely watching these familiar patterns to gauge whether the cycle is repeating itself or if new trends may emerge.

The rules of the game remain consistent. A bearish acceleration would likely be triggered if Bitcoin breaks down from the macro descending triangle base, currently positioned around $82,000. Conversely, a bullish bias would require a decisive break above the macro downtrend, which sits near $100,000. These levels serve as critical decision points for the market, dictating whether bulls or bears gain control in the coming sessions.

Bitcoin

So far, Bitcoin has encountered rejection in the high $90,000s, falling just short of the macro downtrend. This mirrors previous market behavior, in which the asset developed a basing structure near the triangle’s base before attempting to push higher toward the downtrend’s upper boundary. It demonstrates that history is repeating itself for now, with the market consolidating and preparing for its next directional move.

If the macro downtrend continues to act as resistance, the triangle’s base may gradually weaken over time. Such a development would increase the risk of further downside, making the reaction at both the base and the downtrend crucial. 

BTC Surpasses $91,000 Before Facing Selling Pressure

In a recent market update by Ted, it was noted that while Bitcoin broke above the $91,000 threshold yesterday, the rally met significant resistance. Sellers entered the market with substantial force at these local highs, effectively capping the momentum and preventing a sustained breakout.

As a result of this rejection, Bitcoin has retreated into the “no-trading zone.” Ted suggests that this period of sideways price action is likely to persist through the next couple of days, largely driven by the typical low-liquidity environment seen during the weekend.

Looking ahead, the outlook remains cautious. Ted emphasizes that any upward movements will likely be short-lived until BTC can decisively clear the $91,000 to $92,000 resistance zone. Meanwhile, such a move must be backed by strong spot demand to prove its validity.

Bitcoin

❌