The XRP Ledger Now Hosts $150M+ Worth of Tokenized U.S. Treasury Debt

The XRP Ledger now hosts over $150 million worth of tokenized U.S. Treasury Debt amid a rapid increase in RWA value over the past year.
The XRP Ledger now hosts over $150 million worth of tokenized U.S. Treasury Debt amid a rapid increase in RWA value over the past year.
The cryptocurrency market faced a sharp correction in the early hours of January 26, with BTC erasing its entire monthly progress. After peaking at $97,000 on January 14, Bitcoin slid approximately 10.9% to briefly dip below the $87,000 mark. This volatility has pushed the January return to -0.5%, reflecting a broader “risk-off” sentiment across the digital asset space. The pullback is being attributed largely to rising uncertainty around U.S. government shutdown, alongside broader risk-off sentiment across global markets.The GameFi sector bore the brunt of the sell-off, dropping nearly 5%, led by double-digit losses in Axie Infinity (AXS). While Ethereum fell below $2,900, some assets showed resilience; notably, River (RIVER) surged 30% and Beam (BEAM) rose 19%, suggesting that despite the macro-level decline, specific project catalysts continue to drive isolated pockets of growth.
But what else is happening in crypto news today? Follow our up-to-date live coverage below.
The post [LIVE] Crypto News Today: Latest Updates for Jan. 26, 2026 – BTC Slumps 11% From Monthly High Below $87K Amid Market Wide Slump appeared first on Cryptonews.
Crypto traders often assume that meaningful gains need long timelines to take place, and they often give up during the wait and silence. However, crypto has a habit of shattering that belief without warning. History shows that when conditions line up, altcoins do not grind higher over years. They release and erase multiple years of drawdowns in a matter of weeks.
That memory was highlighted by a crypto commentator known as Waterman on the social media platform X, who noted a familiar seasonal window between February and late April to early May for an altcoin explosion.
The most notable example of an altcoin rally season was in 2021, when the entire altcoin market went on a rally to new all-time highs, many of which are still unbroken for some cryptocurrencies.
The 2021 cycle delivered some of the clearest reminders of just how fast capital can rotate once momentum takes hold. Solana moved from roughly $20 to $200 in about 50 days, a clean tenfold run. Although Solana has since broken above this peak to register a new all-time high of $293 in January 2025, this was still Solana’s most explosive rally to date.
Dogecoin followed an even sharper trajectory, climbing from $0.07 to a peak of $0.73 in under a month due to speculative interest that flowed into other memecoins like Shiba Inu. Unlike Solana, Dogecoin is yet to reclaim or surpass this peak price.
Avalanche went further, rallying from around $3 to $60 in less than 40 days, a twentyfold expansion that unfolded faster than most long-term projections ever anticipate. None of these moves required years of development or prolonged accumulation.
Notably, February through late April or early May has more often than not been the period where altcoin performance increases the most. If that pattern repeats, the coming weeks may matter far more than the years that came before them.
At the time of writing, the notion of an altcoin season is still impeded by strong Bitcoin dominance. Much of that comes down to how the entire crypto industry ecosystem has changed massively since 2021, especially after the launch of crypto-based ETFs. That steady demand has kept capital inflows concentrated around Bitcoin and slowed the usual rotation into altcoins.
Meme coins like Dogecoin and Shiba Inu have struggled to keep up in terms of price action, even with the launch of Dogecoin ETFs. Although the ETF has boosted visibility, it has not yet resulted into sustained upside.
At the same time, investors have become more selective, favoring cryptocurrencies tied to clearer utility. As a result, many crypto communities have been working to create utility for their meme coins.
Nonetheless, as noted by Waterman, you only need about four to six weeks for an altcoin to wipe out three to four years of suffering. You don’t need one to two years for altcoins to make massive gains.
Featured image from YouHodler, chart from TradingView

Technical analysis of XRP’s price action on the 3-week candlestick timeframe chart shows that the cryptocurrency is about to play out a road to the double-digit threshold based on its long-term structure.
The analysis, which was shared on the social media platform X alongside a multiyear chart, points to XRP trading in what is labeled Phase 4. At the center of this setup is a clear technical target of a break above the previous all-time high and a run to at least $21.5
Technical analysis of XRP price action shows that the cryptocurrency has been trading in a series of four phases for more than a decade. One full sequence of four phases unfolded between mid-2013 and mid-2017 as the foundation for XRP’s first rally to price peaks. Since then, a second set of four phases has been developing and following a similar pattern.
XRP transitioned into a new phase 1 and phase 2 sequence that led to a 2018 peak for phase 1 and then a pullback for phase 2 between 2018 and 2020. This was followed by an unusually long p3 that stretched from 2019 to mid-2024, visible on the chart as a broad, multi-year consolidation with converging trendlines of lower highs and higher lows. During this time, XRP’s price action was trapped inside the compression structure, just like the behavior seen during phase 3 of the first cycle.
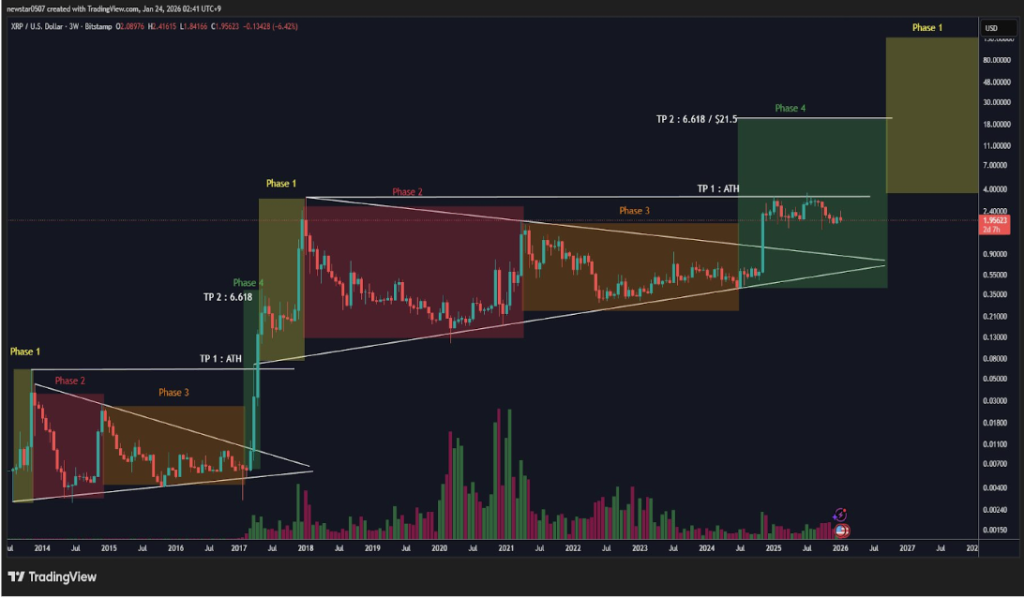
XRP Price Chart. Source: @amonyx On X
According to the technical analysis, phase 4 began in 2025, when XRP finally broke above the compression range in mid-2024. This breakout was the same structural transition seen in mid-2017, when XRP exited consolidation and entered expansion.
Phase 4 has already been in progress for several months and includes the period when XRP rallied to new all-time highs in mid-2025, eventually topping out at $3.65 in July. Since that peak, however, XRP’s price action has been playing out a corrective downward trend and is down by roughly 48% at the time of writing.
Despite the ongoing correction, the projection is that XRP is still in phase 4 and is going to break into new all-time highs soon. This shows that phase 4 could unfold over an extended period and not with a single impulse move. The current all-time high of $3.65 is the first major technical hurdle, and a break above it will serve as confirmation that XRP is back into price discovery.
Based on this technical analysis, past expansion ratios from the previous cycle are applied and a 6.618 Fibonacci extension is measured from the phase 3 support low. This points to a projected price level near $21.5. At the time of writing, XRP is trading at $1.89, meaning a move to that level would represent an increase of roughly 1,040% from current prices.
Featured image from Pexels, chart from TradingView

XRP may be setting up for another major move if a familiar historical pattern continues to play out. A widely followed market watcher recently shared this bullish outlook, projecting a run into the double-digit range.
Dom Kwok, co-founder of EasyA, has reiterated his long-term XRP price outlook, insisting it will reach four-digit figures. In a recent tweet, he said the years of work building around the XRP ecosystem are aimed at something far bigger than today’s prices.
The XRP community is buzzing with bullish price predictions after reports revealed that BlackRock is using Ripple’s RLUSD stablecoin as collateral for its tokenized funds. This adoption has sparked widespread discussions within the XRP community, seamlessly linking narratives of institutional involvement with technical analysis that highlights ambitious upside potential.
In the last week, Bitcoin suffered another correction wave with prices dropping to around $88,000 as the crypto market continues to face a weak investor appetite. While the premier cryptocurrency has experienced some slight relief, an approaching monthly close indicates the market is at a critical juncture that could define its price direction for February.
According to seasoned analyst KillaXBT, Bitcoin is heading into a pivotal monthly close next week, as recent price action suggests the market is approaching an inflection point. Notably, after sweeping external highs near $94,600 earlier in the month, BTC has since faced firm rejection, pushing price back toward the lower end of its recent range between $88,000-$90,000.
The rejection from these highs resulted in pronounced upper wicks on higher timeframes, a structure that often signals aggressive selling pressure. However, KillaXBT explains that such wicks are frequently partially or fully retraced, due to liquidity. With a full trading week still remaining before the monthly candle closes, the market analyst postulates that there are three primary scenarios that could determine price direction for February.

Firstly, Bitcoin could rise into the end of the month, allowing for a stronger monthly close. Under this scenario, February could begin with price forming the upper portion of the current wick, potentially revisiting the low-to-mid $90,000s before rolling over later in the month toward the $83,800 region.
In the second scenario, Bitcoin closes the month near current levels around $89,000, followed by an early-February move to hunt liquidity in the $91,000–$92,000 range before resuming a downward trend. Interestingly, both scenarios align with the idea that the market may first move higher to rebalance liquidity before resolving lower.
The third scenario presents a more severe outcome that aligns with a potential market breakdown. In this case, KillaXBT forecasts Bitcoin could retrace below the weekly and monthly open at $87,664 and close beneath this level before February. The analyst describes this scenario as “violently bearish”, as it increases the probability of a rapid move towards a lower support in the new month.
Notably, KillaXBT favors the first two scenarios, as the present sentiment being heavily bearish indicates that most investors are least expecting a move to the higher side. However, the analyst also emphasizes that the loss of $83,800 support in any scenario would significantly alter the outlook for any remaining long exposure.
At press time, Bitcoin trades at $89,645 following a minor 1.4% gain in the last day.
For years, XRP price performance has been a source of frustration for many investors. While the broader crypto market has cycled through hype-driven rallies, XRP has often moved more slowly, leading to repeated claims that it is underperforming or broken.

After six months of witnessing lower highs and lower lows amid a market downtrend, XRP has finally broken the bearish structure with a new higher high. XRP is gradually pushing toward new territories after months of a sustained downtrend.

A prominent wealth expert argues that XRP’s value goes far beyond price speculation, warning that those betting against the asset are likely to regret it. Although XRP plays a clear role in cross-border settlements, critics have often downplayed this utility and dismissed the token as just another speculative play.
Cathie Wood’s Ark Invest has filed an S-1 application with the U.S. SEC for the ARK CoinDesk 20 Crypto ETF, highlighting XRP among the fund’s most significant holdings.
The total value of the tokenized RWA on the XRP Ledger has finally hit the $1 billion milestone amid a rapid expansion since the start of the year. While XRP and the broader crypto market have faced a roadblock to the earlier bullish momentum, real-world asset (RWA) tokenization has continued to expand across multiple blockchains, and the XRP Ledger (XRPL) remains a major beneficiary of the growth.
As the market searches for direction, fresh price targets from industry figures are reviving discussions around how high major altcoins like XRP could realistically climb in the next bullish phase. Zia ul Haque, founder of Open4profit, recently shared his bullish crypto targets for 2026.
XRP has given back all of its early‑year gains, sliding toward the $1.90. Despite the pullback, several on‑chain and market indicators are pointing to a possible breakout from current levels, driven largely by a sharp decline in XRP held on exchanges.
Market analyst Sam Daodu notes that over the past months, a substantial portion of XRP has steadily moved off centralized trading platforms and into long‑term storage and institutional custody.
On‑chain figures indicate that XRP exchange balances dropped from roughly 4 billion tokens in early 2025 to about 1.5 billion by late December. This 57% decline represents the steepest annual reduction in XRP exchange supply on record.
Data from CryptoQuant reinforces this trend, showing shrinking XRP reserves on major trading platforms such as Binance, where balances continued to fall into early 2026. At the same time, wallet accumulation has increased, particularly among institutional custody accounts.
Daodu argues that with fewer tokens available on exchanges, buying pressure that previously moved XRP only marginally can now drive gains of 10% to 15% within days.
When combined with approximately $1.37 billion in XRP exchange-traded fund (ETF) inflows recorded since November 2025, Daodu believes the conditions favor a potential breakout toward the $4 to $5 range, rather than another rally that stalls below $3.
Looking ahead, Daodu outlines three broad price paths for XRP, each tied to how exchange balances and ETF inflows evolve. In a bullish scenario, the altcoin could move into the $4 to $5 range if monthly ETF inflows average $300-$500 million and exchange balances fall below 1.5 billion tokens.
A more neutral outcome would see XRP trading between $2.50 and $3.50. This scenario assumes ETF inflows slow to roughly $50 million to $70 million per week and exchange balances continue to decline at a steadier pace.
The bearish case hinges on the possibility that the supply contraction thesis proves overstated. If rapid transfers refill exchange order books, escrow releases increase selling pressure, or ETF demand slows due to tighter macroeconomic conditions, XRP could lose support.
In that scenario, prices may fall below $2.00 and revisit the $1.60 level during periods of risk aversion. Prolonged uncertainty could see XRP trading between $1.50 and $2.00 for much of 2026, according to the analyst.
At the time of writing, the altcoin was trading at $1.94. This represented losses of 4% and 8% over seven and fourteen-day periods, respectively. This positions the fifth-largest cryptocurrency in terms of market cap 46% below the current all-time high of $3.64 reached back in July of last year.
Featured image from DALL-E, chart from TradingView.com
Bitcoin is trading below the $90,000 level once again, as the market continues to drift through a phase defined by indecision, rising caution, and growing fear. After repeated failures to reclaim this psychological threshold, price action has started to reflect a lack of conviction on both sides, with buyers hesitating to step in aggressively and sellers pressing every rebound attempt. While the broader trend has not fully collapsed, the inability to hold key levels is increasing uncertainty around Bitcoin’s next major move.
Top analyst Darkfost argues that on-chain signals are starting to mirror conditions typically seen near the end of prolonged drawdowns. According to his analysis, Bitcoin’s unrealized profits and losses are sliding back toward levels that have historically appeared only at the exit of bear markets, when the market has already absorbed a deep reset in sentiment. This shift suggests that stress is building under the surface, even if price has not yet entered a full capitulation phase.
Since Bitcoin’s last all-time high, Darkfost notes that many late-arriving investors have moved into uncomfortable territory, facing mounting downside pressure as the market cools. As a result, unrealized profits are shrinking, unrealized losses are expanding, and the overall balance continues to deteriorate—an environment that often forces traders into a decisive choice between holding through volatility or exiting under stress.
Darkfost highlighted a chart based on an adjusted version of NUPL (Net Unrealized Profit/Loss), designed to capture investor stress more accurately during shifting market regimes. Instead of relying solely on the standard market cap, the model incorporates the realized capitalization of both Short-Term Holders (STHs) and Long-Term Holders (LTHs), then compares that blended realized foundation against Bitcoin’s traditional market cap.

The result is a clearer view of how much profit or loss sits “on paper” across the market, filtered through a more structural lens. To reduce noise and better define trend shifts, the metric is smoothed using an average, producing what Darkfost refers to as aNUPL.
The key takeaway is that Bitcoin is approaching levels that have historically forced investors into a binary decision. When unrealized profits compress and unrealized losses expand to these ranges, holders typically face two outcomes: hold and continue accumulating, or capitulate and lock in losses. That difference in behavior becomes critical because it shapes liquidity, sentiment, and the next directional trend.
If long-term participants absorb the pressure and keep holding, the market can stabilize and rotate back into recovery. But if selling accelerates from stressed cohorts, the decline can deepen into a broader bear phase. This is why tracking realized and unrealized profit dynamics remains essential, especially during periods of uncertainty.
Bitcoin is trading around $89,000 on the weekly chart after a steep selloff that pushed the price out of its prior distribution zone. The latest candle reflects heavy downside pressure, with BTC dropping roughly 4.8% on the week and struggling to stabilize near a key pivot that has repeatedly acted as support and resistance throughout the cycle.

After failing to hold above the psychological $90,000 threshold, the market is now trapped in a tight consolidation range, suggesting traders are waiting for confirmation before committing to a larger move.
From a trend standpoint, Bitcoin remains vulnerable as it trades below the blue moving average, which is now acting as overhead resistance near the low-$100K region. The rejection from that dynamic level aligns with the broader structure: BTC topped near the mid-$120K range, then entered a sharp corrective leg that reset momentum into early 2026. While the green moving average continues to slope upward and is approaching the current price zone, the market has not yet shown the strength needed to reclaim its former trend trajectory.
Importantly, the weekly structure is now compressing. If buyers can defend the $88K–$90K region and push BTC back above $92K–$95K, it would signal a recovery attempt toward the moving average band. However, a sustained failure here increases the risk of a deeper retracement toward the low-$80K zone, where prior demand previously emerged.
Featured image from ChatGPT, chart from TradingView.com


With the amount of innovation and participation increasing so rapidly it is transforming Web3 from a niche technology to an expanding digital ecosystem where developers, investors, and end users can interact in a multitude of new ways. As a result, this rapid growth has led to a greater need for trust, transparency, and accountability in Web3 and the best method to establish trust and confidence in project teams is through KYC verification.

Bitcoin slipped today as on-chain data showed large investors shifting capital toward gold-backed assets instead of crypto. The move comes as traditional safe havens surge to fresh all-time highs, leaving the digital asset market in the red.

UBS is moving closer to offering cryptocurrency trading to some of its banking clients, marking a significant step in the bank’s gradual entry into digital assets. The initiative reflects growing demand from wealthy investors and mirrors a broader shift across global finance as traditional institutions seek regulated exposure to cryptocurrencies.
Wyoming Senator Cynthia Lummis has called on US lawmakers to swiftly pass the CLARITY Act, which would bring structure to the US crypto market. She reiterated the legislation’s importance to the growth of the digital asset sector in her recent X post, calling for a decisive move in Congress.