Reading view

There are new articles available, click to refresh the page.

Bitcoin Whales Keep Buying Through Volatility As Retail Steps Away

Bitcoin is facing renewed volatility after a sharp drop from the $97,000 region to nearly $87,000 in just a few days, shaking market confidence and forcing bulls into defense mode. The pullback comes as geopolitical tension between the United States and the European Union escalated this week, with trade-war rhetoric returning to the spotlight and uncertainty rising around potential retaliatory measures tied to broader disputes, including the situation surrounding Greenland.

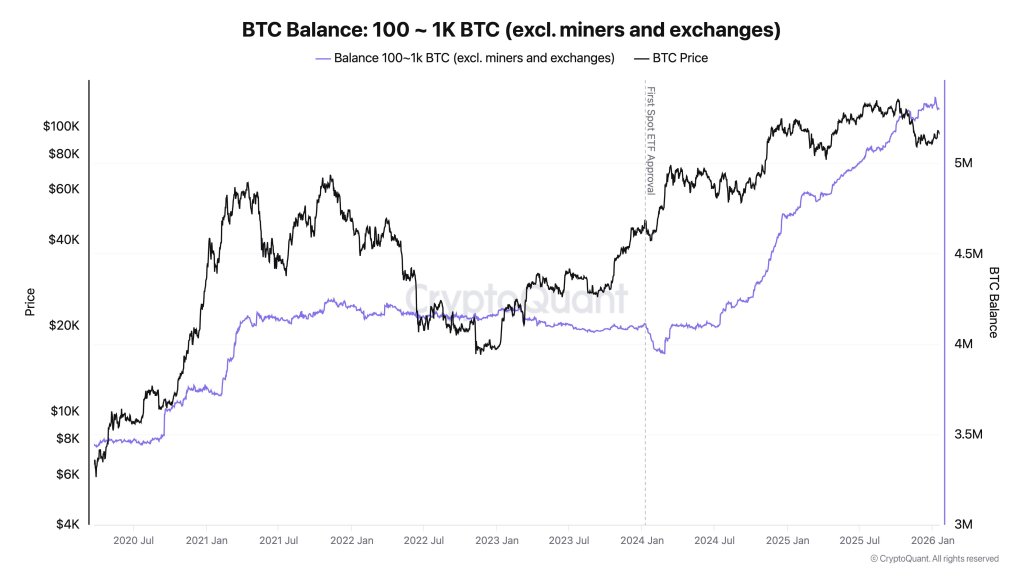
Despite the downside pressure, on-chain behavior suggests the market structure is not collapsing, but shifting. Since January, Bitcoin whales have continued to accumulate through corrective phases, absorbing spot supply even as price action weakened.

At the same time, retail investors appear to be stepping back after the drawdown, reducing activity and participation across the market. This divergence highlights a familiar dynamic: short-term fear tends to push smaller traders out, while larger holders use volatility to build exposure at discounted levels.

With price now stabilizing near a major psychological zone, Bitcoin is entering a critical stretch where demand must return to confirm whether this move was a temporary shakeout or the start of deeper weakness.

Whales Keep Accumulating as Bitcoin Fights to Hold $90K

Bitcoin is now attempting to hold above the $90,000 level as volatility remains elevated and traders look for signs of stabilization after the recent swing lower. Price action has become increasingly reactive to macro headlines, and the $90K zone is acting as a key psychological threshold that could determine whether the market consolidates or extends the correction.

In this environment, short-term sentiment can flip quickly, especially as liquidity thins and intraday moves become sharper across both spot and derivatives markets.

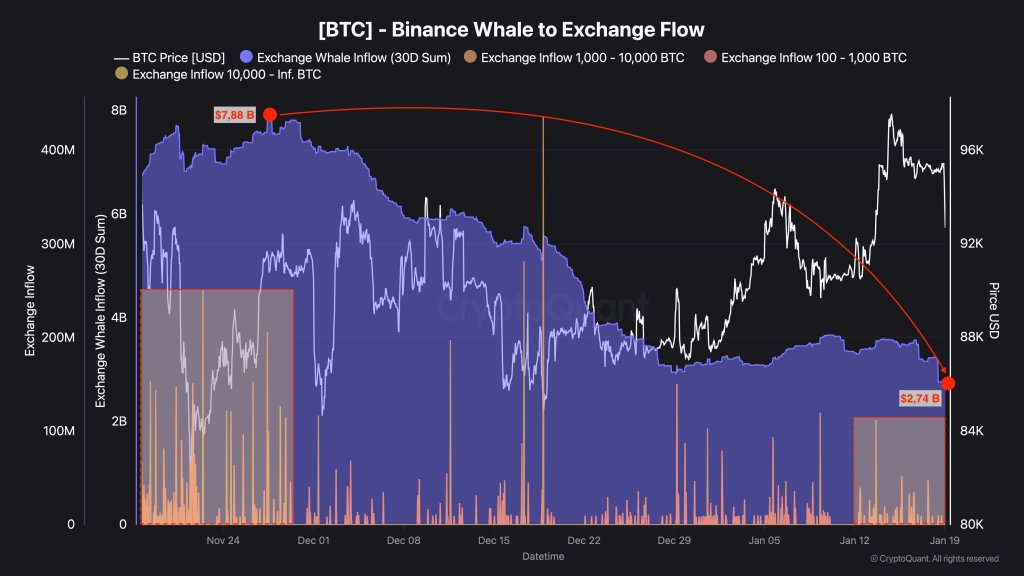
However, a CryptoQuant report suggests the underlying structure has not broken down. Even after geopolitical risks intensified and broader risk appetite deteriorated, whale holdings have not declined on a monthly basis.

Instead, large holders have continued increasing exposure, reinforcing the view that the current phase reflects structural accumulation rather than broad distribution. This matters because sustained whale buying during drawdowns typically implies supply is being absorbed at lower levels, reducing the probability of a cascading sell-off driven purely by spot sellers.

Bitcoin Total Whale Holdings | Source: CryptoQuant

In practical terms, the market has shaken, but whale conviction has not. While retail participants often reduce exposure during periods of uncertainty, larger investors tend to operate with longer time horizons, stepping in when volatility forces weak hands out.

If this accumulation trend persists, it can help establish a stronger base below price and create conditions for a more stable recovery once demand improves. For now, Bitcoin’s next move depends on whether $90K holds under continued macro pressure.

Price Action Details: Consolidation Continues

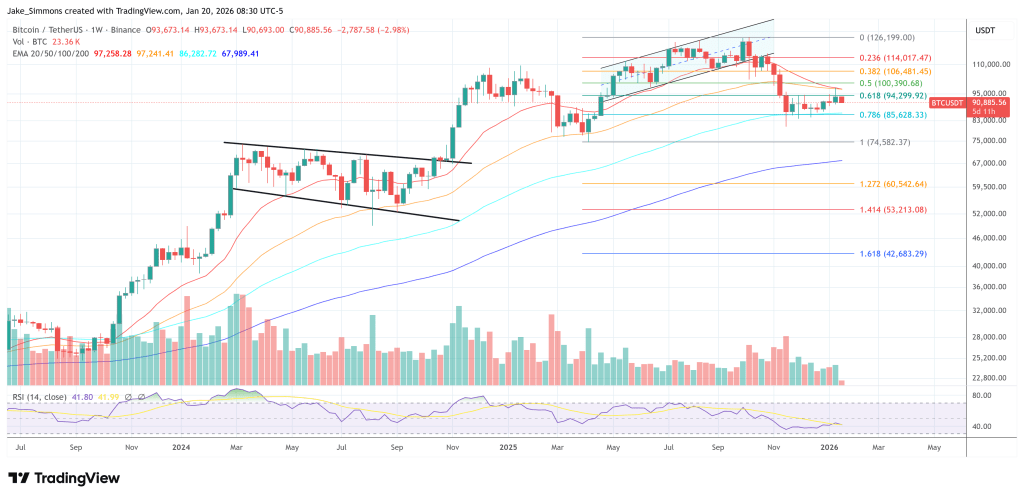
Bitcoin is attempting to stabilize near the $90,000 level after last week’s volatility sent price sharply lower from the prior range above $100,000. The weekly chart shows BTC holding a higher-low structure since the November breakdown, but momentum remains fragile as sellers continue to defend overhead resistance zones. After reclaiming the mid-$80,000s, price pushed back toward $90,000, yet the latest weekly close suggests hesitation and a lack of strong follow-through from buyers.

BTC testing key demand level | Source: BTCUSDT chart on TradingView

From a trend perspective, BTC is trading below the short-term moving average, which has rolled over and now acts as dynamic resistance. The rebound has been constructive, but it remains corrective until the price can break and hold above that blue trend line. Meanwhile, the longer-term averages are still rising, reflecting that the broader cycle is not broken, but that the market is transitioning into a slower consolidation phase.

Volume also confirms this uncertainty. Sell-side spikes marked the initial breakdown, while recent recovery candles have not shown the same level of aggressive demand. For bulls, holding the $88,000–$90,000 zone is critical to prevent a deeper pullback. A clean weekly close above $92,000 would improve the short-term outlook and open the door for a stronger recovery leg.

Featured image from ChatGPT, chart from TradingView.com 

Volatility Expands, But Bitcoin Whales And Sharks Aren’t Selling — They’re Buying More

Bitcoin briefly reclaimed the pivotal $90,000 price mark once again after a brief bounce, but volatility still lingers around the largest cryptocurrency asset. During the ongoing volatile landscape, investors appear to have found a new niche, and that is buying BTC at a significant and fast rate.

Large Bitcoin Holders Are Buying In The Noise

The ongoing market volatility may have significantly impacted the Bitcoin price direction, but this is not the same for investors’ sentiment and activity. In the current bearish state, BTC investors are now sending a clear bullish signal, especially as indicated in the activity of the largest holders.

Sentiment observed among BTC large holders has shifted toward buying once again. According to research shared by Santiment, a leading on-chain data analytics platform, whales and sharks continue to accumulate more BTC even as market volatility intensifies. 

During the ongoing bearish market, BTC’s price fell back to the $89,400 level, and assets like Silver and Gold experienced a steady spike. Instead of being shaken out by the pullback, these high-net-worth investors are persistently building positions, indicating a great level of confidence beneath the surface. 

When these key investors start to buy BTC at a rapid rate again while the broader market signals caution, it is often viewed as a strategic move or repositioning ahead of a potential price spike. This kind of behavior is typically seen during transitional phases.

Bitcoin

Data shows that wallet addresses holding between 10 and 10,000 BTC have purchased an additional +36,322 BTC, representing an over 0.27% rise in the past 9 days. Should this renewed buying pressure from big investors continue, it is likely to play a role in determining BTC’s next major move as it reshapes its supply and price dynamics.

While whale investors steadily add to their positions, wallet addresses holding 0.01 BTC have been dumping to the noise. This group, regarded as shrimp holders, has offloaded over 132 BTC within the same timeframe, indicating a -0.28% drop.

Santiment highlighted that it is considered an optimal condition for a crypto breakout when smart money accumulates, and retailers dump. In the absence of a geopolitical issue, this pattern continues to demonstrate a long-term bullish divergence.

Risk Around BTC Is Becoming High

Following the bearish reaction on Wednesday, the Bitcoin Risk Index metric experienced a surge, reaching the 21 level and hovering just below the High Risk zone at level 25. This uptick suggests that the continuation of the consolidation phase is highly likely and will be bolstered by the massive high-risk environment seen over the past few months.

Despite the surge, the market is still technically in a low-risk environment, and buyers are struggling to hold the pivotal support level at $89,200. At this level, the market is presented with two different scenarios.

The first, which is the bullish scenario, tells that BTC could undergo a clear push toward $94,800 and possibly $99,000 if $89,200 support holds in the short term. Meanwhile, in the bearish scenario, a continued consolidation below the support level driven by sellers would cause a drop to $84,500, marking the next line of defense for buyers.

Bitcoin

Bitcoin’s Power Shift: New Whales Now Control The Market

Bitcoin has slipped below the $90,000 level as markets react to rising macroeconomic tension between the United States and the European Union, with fresh concerns tied to geopolitical friction around Greenland. The renewed risk-off tone pressured equities and crypto alike, reinforcing Bitcoin’s sensitivity to global headlines when uncertainty spikes and investors reduce exposure across high-beta assets.

Beyond price action, on-chain data suggests a deeper shift is taking place inside the Bitcoin market. A report by analyst MorenoDV highlights that, for the first time in history, “new whales” now account for a larger share of Bitcoin’s Realized Cap than long-term “OG” whales. Realized Cap tracks the aggregate cost basis of coins based on their last on-chain movement, meaning this change signals that a substantial portion of BTC supply has recently changed hands at higher prices.

Bitcoin Realized Cap: New vs Old Whales | Source: CryptoQuant

This transfer of influence matters because it reshapes short-term supply dynamics. When newer large holders dominate realized capital, market behavior can become more reactive, with marginal supply increasingly controlled by investors who entered later in the cycle and may be more sensitive to volatility. As Bitcoin battles to reclaim $90,000, this evolving whale structure may help explain why rebounds feel less stable and why selling pressure can reappear quickly during macro-driven pullbacks.

New Whales Now Dictate Bitcoin’s Short-Term Direction

Realized Cap measures Bitcoin’s aggregate cost basis by valuing coins at the price of their last on-chain movement. When this metric shifts toward new whales—short-term holder whales holding more than 1,000 BTC with UTXO age below 155 days—it signals that a meaningful share of supply has recently changed hands at elevated prices. In other words, market control is moving away from experienced, cycle-tested holders and toward capital that arrived late in the trend.

This transition helps explain Bitcoin’s current behavior. The realized price of new whales sits near $98,000, while spot price continues trading below that level. As a result, this cohort is estimated to be carrying roughly $6 billion in unrealized losses. These losses are not just paper drawdowns—they shape decision-making and increase sensitivity to volatility, especially during sharp corrections.

Short/Long-Term Whale Realized Price | Source: CryptoQuant

On-chain realized PnL data suggests that since the market peak, new whales have driven the bulk of realized losses. During the recent drawdown, they repeatedly sold into weakness and used brief rebounds to exit positions. Reflecting risk management rather than conviction.

Old whales tell the opposite story. With a realized price around $40,000, long-term whales remain deeply profitable. Their activity has been limited relative to the flows coming from new whales. For now, Bitcoin’s direction is being dictated by this newer, more fragile whale cohort.

Bitcoin Breaks Below Key Support

Bitcoin is showing renewed weakness after losing the $90,000 psychological level, with price now trading near $88,300 on the daily chart. The structure reflects a clear downtrend from the late-2025 highs, followed by a failed attempt to recover. After a sharp drop in November, BTC stabilized and built a short consolidation base, but the rebound into early January lacked follow-through and quickly turned into another rejection.

BTC testing support level | Source: BTCUSDT chart on TradingView

From a technical perspective, BTC remains trapped below its major moving averages, which are now acting as dynamic resistance. The shorter-term average has rolled over sharply, while the broader trend line above continues to slope downward. Signaling that momentum remains capped, and sellers are still in control on rallies. The recent bounce toward the mid-$90K region was rejected aggressively, confirming that overhead supply remains heavy and buyers are not yet strong enough to flip the trend.

Volume patterns support this narrative. The biggest spikes occurred during the selloff leg, showing forced activity and distribution. While the most recent recovery attempts have been met with weaker participation. As long as Bitcoin stays below the $90K–$92K zone, price action suggests the market is still searching for a stable bottom. The downside risk remains elevated if fear accelerates across the broader crypto market.

Featured image from ChatGPT, chart from TradingView.com 

Bitcoin Whale Panic Fades: Sell Pressure On Binance Falls Off A Cliff

Bitcoin’s exchange-side supply signal is flashing a notable change: whale-sized transfers into Binance have dropped sharply from late-November panic levels, suggesting large holders are no longer leaning on the sell button with the same urgency.

Selling Pressure From Bitcoin Whales Fade

CryptoQuant contributor Darkfost said current data shows a “clear decline in whale transactions,” specifically BTC inflows to exchanges, meaning “large holders are sending significantly less BTC to trading platforms than before.”

In the post, the chart focus was Binance inflows segmented by transaction size, spanning transfers from 100 BTC up to the largest prints above 10,000 BTC, flows that are commonly interpreted as potential sell-side positioning when they hit an exchange.

The key backdrop in Darkfost’s thread is how quickly whale behavior shifted around the market’s late-2025 drawdown. “December has been particularly challenging, even for these investors,” the analyst wrote, adding that whales are typically “more cautious” and “less sensitive to market movements than retail participants,” often acting with “greater discipline and patience.”

That discipline appeared to crack as Bitcoin rolled over from its latest all-time high near $126,000. Darkfost described a surge in whale inflows to Binance at the end of November as BTC “continued its correction,” with the “average monthly total” reaching “nearly $8 billion” during a period when BTC “fell back below the $90,000 level.”

“This phase clearly triggered a panic-driven move,” the post said. “Transactions ranging between 100 and 10,000 BTC increased significantly, especially as price broke below the $85,000 level. This behavior reflects real stress among certain whales, who chose to sell quickly in order to limit losses, thereby reinforcing selling pressure on the market.”

The crux is what changed since that cluster. “Today, the situation looks very different,” Darkfost wrote. Those Binance inflows “have been divided by three and now stand at around $2.74 billion,” with “daily movements” becoming “far less frequent than during the cluster observed at the end of November.”

The analyst framed the drop as an observable behavioral pivot rather than a single-day anomaly. “This shift in dynamics suggests that whales have changed their behavior,” Darkfost wrote. “They are no longer selling aggressively and now appear to favor waiting.”

Bitcoin Whale to Exchange Flows

Institutional Demand Side Remains Robust

While Darkfost’s post focuses on whale-associated inflows as a proxy for potential sell pressure, CryptoQuant CEO Ki Young Ju pointed investors to the other side of the ledger: institutional accumulation.

Institutional demand for Bitcoin remains strong,” Ki wrote on X. “US custody wallets typically hold 100–1,000 BTC each. Excluding exchanges and miners, this gives a rough read on institutional demand. ETF holdings included.”

Ki added that “577K BTC ($53B) [was] added over the past year, and still flowing in,” characterizing the trend as ongoing rather than a completed wave.

Bitcoin Balance: 100-1,000 BTC

At press time, Bitcoin traded at $90,885.

Bitcoin price chart

Bitcoin Records Large Exchange Inflows As Price Climbs — What Next For BTC?

Bitcoin recently failed to overcome the $97,000 resistance following its price surge seen in mid-January. At the moment, the leading cryptocurrency has taken on a state of inertia, with no significant movement in either direction seen. However, an investigation of on-chain dynamics has recently revealed that trouble might be looming for the flagship cryptocurrency.

Sudden Inflows: Caution Or Opportunity?

In a QuickTake post on CryptoQuant, key opinion leader CryptoZeno shares a potentially foreboding observation on Bitcoin’s market dynamics, saying the premier cryptocurrency could be facing a risk of distribution in the near-term.

This conjecture is based on the Bitcoin: Exchange Inflow (Total) – All Exchanges metric, which serves the basic function of tracking the total amount of BTC transferred into centralized exchanges over a certain period.  CryptoZeno highlights in the post that exchange inflows have seen sharp surges through Bitcoin’s most-recent trading sessions, which represent one of the most significant spikes seen in the month of January.

Bitcoin

Typically, large inflows of BTC into exchanges act as a telltale sign that investors are preparing to distribute their holdings. This is contrary to any inclination towards long-term holding. Interestingly, the sign of distribution-readiness is more typical if the event were to occur just after a strong advance of the BTC price. 

Also citing historical occurrences, CryptoZeno explains that such behavior, where BTC holders increasingly send their tokens to exchanges, suggests that investors are venturing out of Bitcoin and to more “liquid venues.” Expectedly, such a massive dispersal of their holdings would translate into price as increased sell-side pressure, especially in the short-term. 

Notably, the analyst makes it clear that inflows alone do not tell a sure story of an immediate reversal. More accurately, spikes in exchange inflows often come before heightened volatility periods or corrective price action.

Analyst Highlights Mid- To Large-Size Bands As Main BTC ‘Movers’

CryptoZeno provides more context by merging the Spent Output Value Bands with the Exchange Inflow metric. This shows which investor cohort was more involved in creating the distribution signal seen. On inspection of the blended metric, it becomes apparent that the spike in exchange inflows was largely induced by mid-to-large size bands (10-100 BTC, and 100-1,000BTC).

Bitcoin

These size bands, according to the crypto expert, are associated with whales, long-term investors who are repositioning, or even ETFs. These investor classes do not merely act without strategic reasons. As a result, their activity is usually more important compared to retail activity.

A simultaneous increment to exchange inflows, alongside large investor distribution, is another sign that the Bitcoin market is on the brink of a fragile phase. In the event that inflows remain high as price struggles to reclaim past highs, the world’s leading cryptocurrency could be entering a phase of trouble, as it would suggest the predominance of supply over demand.

As of this writing, Bitcoin is worth $95,250, recording almost no growth since the past day.

Bitcoin

Bitcoin Smart Money Buys, While Retail Dumps: Why The Latest Rally Looks Well-Founded

A few days ago, the price of Bitcoin experienced a bounce after weeks of trading below the $91,000 mark. However, this renewed momentum appears to be gradually fading as the crypto market slowly shifts toward a bearish state, with large and retail BTC investors moving in a distinct direction.

What’s Happening Behind The Bitcoin’s Rise

Bitcoin may have slightly pulled back from its most recent bounce, but the price is still holding strong above the $95,000 level. Meanwhile, the latest jump has attracted significant attention in the broader cryptocurrency market, with the move being increasingly viewed as well-justified rather than speculative.

Currently, on-chain and market data are showing a clear divergence in who is driving the ongoing move. Santiment, a leading market intelligence and on-chain data analytics platform, disclosed that itcoin’s surge to a high of $97,800 on Wednesday seemed more than warranted due to the behavior of large and retail investors.

Institutions, long-term investors, and big wallets, together referred to as smart money, have been discreetly accumulating while retail traders have been gradually lowering their exposure and selling into strength. With the rotation of supply from weaker hands to more conviction-driven investors reducing selling pressure, the rally’s foundation is being strengthened.

Bitcoin

When whales are buying more BTC, and retail investors are dumping, it reflects a very bullish market outlook. Since January 10, whales and sharks, particularly wallets holding between 10 and 10,000 BTC, have been amassing BTC, collectively scooping up more than 32,693 BTC. This massive purchase represents a +0.24% rise to their collective holdings.

On the other hand, retail or shrimp holders, those holding less than 0.01 BTC, have collectively offloaded over 149 BTC since January 10. Data shows that the dump represents a 30% decline in their holdings altogether.

Santiment highlighted that the key signal underneath the action is that smart money is finally buying consistently, while micro money bows out. Furthermore, it is considered an ideal setup for a bull run. However, how long retail doubts the formed tiny rally will determine how long it lasts, and the “Very Bullish” green zone is still in place for the time being.

Ongoing FUD In The Market Set To Propel BTC’s Price

Even with the recent recovery, Bitcoin is seeing negative interactions from crypto enthusiasts and analysts on social media platforms. This behavior implies that the crowd is not entirely confident in the BTC rally that occurred on Wednesday. Although the development may seem present itself as negative, it is actually a good sign that the rally might extend.

Social data reveals that commentary toward BTC across social media platforms has sharply leaned to a bearish outlook as prices have bounced this week. With markets often moving in the opposite direction of retail sentiment, Santiment noted that the most FUD in 10 days is likely to propel BTC to its first return above the $100,000 mark, which was last seen on November 13, 2025.

Bitcoin

Bitcoin Rally Accompanied By ‘Very Bullish’ Whale-Retail Behavior, Santiment Says

On-chain analytics firm Santiment has revealed how Bitcoin is currently in a bullish zone based on the behavior of whale and retail investors.

Bitcoin Major & Retail Entities Have Shown Opposite Trajectories Recently

In a new post on X, Santiment has talked about how Bitcoin investor behavior currently compares between the top and low ends. Sharks and whales make up for the former category, while retail investors represent the latter. Formally, the wallet ranges of the two sides of the market are defined as 10 to 10,000 BTC and less than 0.01 BTC. Below is the chart shared by Santiment that shows the trend in the Bitcoin supply held by each of these cohorts over the last few months.

Bitcoin Sharks & Whales Vs Retail

As is visible in the graph, the Bitcoin sharks and whales have seen their combined supply rise during the last few days, indicating that the large investors have been accumulating. Meanwhile, the retail investors have sold instead. This could imply that the big-money hands are backing the latest price rally, while small holders don’t believe the run will last, so they are exiting with their profits. If history is to go by, this may actually be a positive signal.

According to the analytics firm, whale and retail behavior diverging in this manner puts the market in what it defines as the “Very Bullish” zone. “This is the ideal setup for a bull run,” noted Santiment.

In the chart, the analytics firm has also highlighted four other zones for BTC based on the trajectories followed by the whale and retail supplies. “Very Bearish” (colored in red) follows the same contrarian logic as the Very Bullish region, with the zone appearing when large entities are selling, and retail is accumulating. Bearish (orange), Neutral (yellow), and Bullish (blue) map out the spectrum between the two extreme regions.

Bitcoin’s latest venture into the green Very Bullish zone has come as sharks and whales have loaded up on 32,693 BTC (worth about $3.1 billion) since January 10th, corresponding to a supply increase of 0.24%. Retail investors have sold 149 BTC ($14.4 million) in this window instead, equivalent to a drop of 0.30%.

It now remains to be seen whether BTC will stay in this region for long or if another shift in investor behavior will take place. “How long it lasts depends on how long retail doubts the mini rally that has formed,” explains Santiment.

BTC Price

Bitcoin witnessed a break beyond the $97,000 level on Wednesday, but the bullish momentum has since cooled, with the BTC price returning to the $96,900 mark.

Bitcoin Price Chart

Bitcoin On-Chain Alert: 2021 Cycle Coins Just Moved

On-chain data shows tokens aged between 3 and 5 years old have just moved on the Bitcoin network with two large transactions.

3 To 5 Years Old Bitcoin Supply Has Seen Movement Recently

As pointed out by CryptoQuant community analyst Maartunn in a new post on X, two transactions involving old tokens have just occurred on the Bitcoin blockchain. The on-chain metric of interest here is the “Spent Output Age Bands,” which tracks how many tokens that the various coin age groups or “age bands” are moving on the network.

In the context of the current topic, the age band of interest is the one containing coins that have been dormant for between three and five years. Here is the chart for the Bitcoin Spent Output Age Bands shared by Maartunn that shows the data specifically for this cohort:

Bitcoin SOAB

As is visible in the above graph, the Bitcoin Spent Output Age Bands have captured two large transactions from the 3 to 5 years age band during the past couple of days. The first of these involved 539 BTC, while the second moved 1,566 BTC.

The 3 to 5 years age band corresponds to coins that were purchased between January 2021 and January 2023, essentially covering the cycle spanning over the 2021 bull market and 2022 bear market. Thus, the tokens that have just been moved were held by investors who had been sitting silent since buying in the previous cycle.

“Dormant supply waking up is often a signal—either smart money rotating or early holders exiting,” explained the analyst. It now remains to be seen whether these transactions were a temporary deviation or if long-term holder whales will make more such moves in the near future.

In some other news, CryptoQuant has shared its 2025 review of digital asset exchange activity. One interesting finding is that stablecoins are heavily concentrated on Binance, with the exchange holding a combined $47.6 billion in USDT and USDC reserves. This is equivalent to 72% of the stablecoin holdings across the ten largest exchanges.

Binance also dominated 2025 in spot trading activity, recording close to $7 trillion in volume.

Bitcoin Spot Volume

Binance’s dominance of trading volume wasn’t quite as stark as that of its stablecoin reserves, however, as it made up for 41% of the total spot volume among the top 10 platforms. The exchange’s share of the futures trading volume was similar, coming out at 42%.

Overall spot and futures trading volume in the cryptocurrency sector grew during 2025 compared to the end of 2024, but the yearly growth rate declined.

BTC Price

Bitcoin has been moving sideways recently as its price is still trading around the $92,200 level.

Bitcoin Price Chart

❌