❌

Reading view

There are new articles available, click to refresh the page.

Volatility Expands, But Bitcoin Whales And Sharks Aren’t Selling β€” They’re Buying More

Bitcoin briefly reclaimed the pivotal $90,000 price mark once again after a brief bounce, but volatility still lingers around the largest cryptocurrency asset. During the ongoing volatile landscape, investors appear to have found a new niche, and that is buying BTC at a significant and fast rate.

Large Bitcoin Holders Are Buying In The Noise

The ongoing market volatility may have significantly impacted the Bitcoin price direction, but this is not the same for investors’ sentiment and activity. In the current bearish state, BTC investors are now sending a clear bullish signal, especially as indicated in the activity of the largest holders.

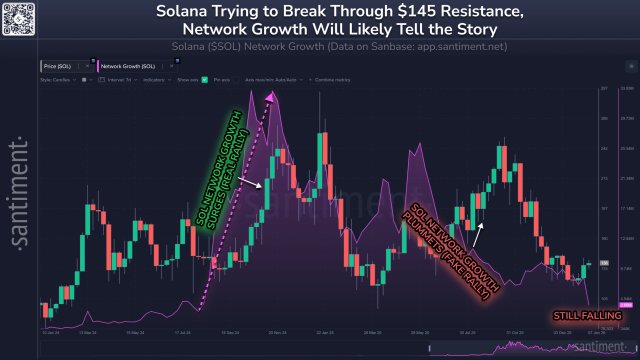
Sentiment observed among BTC large holders has shifted toward buying once again. According to research shared by Santiment, a leading on-chain data analytics platform, whales and sharks continue to accumulate more BTC even as market volatility intensifies.Β 

During the ongoing bearish market, BTC’s price fell back to the $89,400 level, and assets like Silver and Gold experienced a steady spike. Instead of being shaken out by the pullback, these high-net-worth investors are persistently building positions, indicating a great level of confidence beneath the surface.Β 

When these key investors start to buy BTC at a rapid rate again while the broader market signals caution, it is often viewed as a strategic move or repositioning ahead of a potential price spike. This kind of behavior is typically seen during transitional phases.

Bitcoin

Data shows that wallet addresses holding between 10 and 10,000 BTC have purchased an additional +36,322 BTC, representing an over 0.27% rise in the past 9 days. Should this renewed buying pressure from big investors continue, it is likely to play a role in determining BTC’s next major move as it reshapes its supply and price dynamics.

While whale investors steadily add to their positions, wallet addresses holding 0.01 BTC have been dumping to the noise. This group, regarded as shrimp holders, has offloaded over 132 BTC within the same timeframe, indicating a -0.28% drop.

Santiment highlighted that it is considered an optimal condition for a crypto breakout when smart money accumulates, and retailers dump. In the absence of a geopolitical issue, this pattern continues to demonstrate a long-term bullish divergence.

Risk Around BTC Is Becoming High

Following the bearish reaction on Wednesday, the Bitcoin Risk Index metric experienced a surge, reaching the 21 level and hovering just below the High Risk zone at level 25. This uptick suggests that the continuation of the consolidation phase is highly likely and will be bolstered by the massive high-risk environment seen over the past few months.

Despite the surge, the market is still technically in a low-risk environment, and buyers are struggling to hold the pivotal support level at $89,200. At this level, the market is presented with two different scenarios.

The first, which is the bullish scenario, tells that BTC could undergo a clear push toward $94,800 and possibly $99,000 if $89,200 support holds in the short term. Meanwhile, in the bearish scenario, a continued consolidation below the support level driven by sellers would cause a drop to $84,500, marking the next line of defense for buyers.

Bitcoin

Santiment Says XRP Social Sentiment Hits β€˜Extreme Fear’: Buy Signal?

XRP is back in a familiar spot: social chatter has turned sharply bearish even as the market probes support after an early-January surge. Analytics firm Santiment said its social data shows XRP slipping into β€œExtreme Fear” after a roughly 19% pullback from its early-month high, a setup it argues has historically preceded rallies.

Santiment wrote on Jan. 22 via X: β€œAccording to our social data, XRP has fallen into β€˜Extreme Fear’ territory. Small retail traders have become pessimistic toward the #5 market cap cryptocurrency after a -19% drop since the high back on January 5th. Historically, this high level of bearish commentary leads to rallies. Prices move the opposite to retails’ expectations more often than not.”

The chart Santiment shared pairs XRP’s 6-hour candles with a social ratio measuring positive versus negative commentary, and overlays three β€œbuy” and three β€œsell” markers tied to sentiment bands. Those bands are explicitly labeled as a β€œfear zone” (where prices β€œgo up”), a neutral zone, and a β€œgreed zone” (where prices β€œgo down”).

XRP social sentiment

How Reliable Is The XRP Social Sentiment Signal?

To check the timing, daily XRP spot data for the same late-December-to-January window broadly supports the chart’s claim that extreme sentiment readings often show up near inflection points, with an important caveat: not every signal front-runs a turn cleanly, and some arrive early.

The first β€œbuy” marker on the chart is dated Jan. 2. On that day, XRP closed around $2.01 after trading as low as roughly $1.87, and the market proceeded to accelerate into the week’s blow-off move: by Jan. 5 XRP closed near $2.35, and the Jan. 6 session printed a high around $2.42. In other words, the Jan. 2 β€œbuy” call landed ahead of the sharp leg higher that set the period’s high.

The first β€œsell” marker is dated Jan. 7, immediately after the peak. XRP closed around $2.16 that day and then bled lower across the next sessions, sliding toward the low-$2.00s by Jan. 12. On sequence alone, that sell signal aligns with the market shifting from post-spike distribution into a steadier downtrend.

The second β€œsell” marker, Jan. 11, is less straightforward. XRP closed near $2.07 on Jan. 11 and dipped again on Jan. 12, but then logged a sharp rebound on Jan. 13, closing around $2.17. Traders treating the Jan. 11 marker as an immediate top signal would have faced a short-term whipsaw before downside resumed.

That brings the chart’s third β€œsell” marker (Jan. 13) which appears to target that rebound itself. From Jan. 13’s close near $2.17, XRP rolled back over: it faded through mid-month and ultimately slid into the Jan. 20 low around $1.87 (intraday), which maps cleanly to the chart’s contention that β€œgreed-zone” sentiment can coincide with local exhaustion.

On the β€œbuy” side late in the window, Santiment flags Jan. 18 and Jan. 20–21. The Jan. 18 marker arrived early: XRP closed around $1.99 on Jan. 18 but continued lower into Jan. 20 before rebounding. The current Jan. 20–21 marker fits better in the short term, with XRP bouncing from the Jan. 20 close near $1.89 to roughly $1.95 by today. Even so, that rebound has so far been modest relative to the broader drawdown from the $2.4 area peak.

Santiment’s broader point is contrarian: when social feeds tip into one-sided pessimism, marginal selling pressure may already be exhausted, setting up mean reversion. The recent signal history partially supports that while also showing the practical risk: entries can be early, and β€œextreme fear” can persist if trend conditions remain heavy.

At press time, XRP traded at $1.9498.

XRP price

Bitcoin Smart Money Buys, While Retail Dumps: Why The Latest Rally Looks Well-Founded

A few days ago, the price of Bitcoin experienced a bounce after weeks of trading below the $91,000 mark. However, this renewed momentum appears to be gradually fading as the crypto market slowly shifts toward a bearish state, with large and retail BTC investors moving in a distinct direction.

What’s Happening Behind The Bitcoin’s Rise

Bitcoin may have slightly pulled back from its most recent bounce, but the price is still holding strong above the $95,000 level. Meanwhile, the latest jump has attracted significant attention in the broader cryptocurrency market, with the move being increasingly viewed as well-justified rather than speculative.

Currently, on-chain and market data are showing a clear divergence in who is driving the ongoing move. Santiment, a leading market intelligence and on-chain data analytics platform, disclosed that itcoin’s surge to a high of $97,800 on Wednesday seemed more than warranted due to the behavior of large and retail investors.

Institutions, long-term investors, and big wallets, together referred to as smart money, have been discreetly accumulating while retail traders have been gradually lowering their exposure and selling into strength. With the rotation of supply from weaker hands to more conviction-driven investors reducing selling pressure, the rally’s foundation is being strengthened.

Bitcoin

When whales are buying more BTC, and retail investors are dumping, it reflects a very bullish market outlook. Since January 10, whales and sharks, particularly wallets holding between 10 and 10,000 BTC, have been amassing BTC, collectively scooping up more than 32,693 BTC. This massive purchase represents a +0.24% rise to their collective holdings.

On the other hand, retail or shrimp holders, those holding less than 0.01 BTC, have collectively offloaded over 149 BTC since January 10. Data shows that the dump represents a 30% decline in their holdings altogether.

Santiment highlighted that the key signal underneath the action is that smart money is finally buying consistently, while micro money bows out. Furthermore, it is considered an ideal setup for a bull run. However, how long retail doubts the formed tiny rally will determine how long it lasts, and the β€œVery Bullish” green zone is still in place for the time being.

Ongoing FUD In The Market Set To Propel BTC’s Price

Even with the recent recovery, Bitcoin is seeing negative interactions from crypto enthusiasts and analysts on social media platforms. This behavior implies that the crowd is not entirely confident in the BTC rally that occurred on Wednesday. Although the development may seem present itself as negative, it is actually a good sign that the rally might extend.

Social data reveals that commentary toward BTC across social media platforms has sharply leaned to a bearish outlook as prices have bounced this week. With markets often moving in the opposite direction of retail sentiment, Santiment noted that the most FUD in 10 days is likely to propel BTC to its first return above the $100,000 mark, which was last seen on November 13, 2025.

Bitcoin

Solana’s Price Next Move Tied To Its On-Chain Strength: Can The Network Deliver?

Solana’s price has delivered a slight rebound as the broader crypto market gradually shifts towards a bullish outlook. Although the price of SOL may be demonstrating strength once again, its future trajectory is largely tied to the performance of the leading network in the days ahead.

Network Performance Becomes The Key Catalyst For Solana’s Price

Following a slight bounce on Monday, Solana is back above the $140 price mark. However, on-chain data suggests that the altcoin is nearing a turning point where its next significant price change may depend more on how well its network functions going forward than on market sentiment.

This thesis was outlined by Santiment, a leading market intelligence and on-chain data platform, after examining the correlation between SOL’s current price movement and its network activity. With price spikes coinciding with reduced network activity, the focus is now on the blockchain’s ability to maintain that momentum.

Santiment highlighted that as ongoing market volatility cools off, the price of SOL experienced a leg up as high as $144, drawing dangerously close to breaking past its $145 resistance level. While the price remains below the key resistance level, the altcoin awaits its next major catalyst in order to clear this level.

Solana

According to the on-chain platform, this will mostly depend on whether SOL network growth can start to increase once more, drawing attention to its fading new wallet creation. Data shows that the number of new wallet addresses created in a weekly timeframe has dropped significantly over the last few weeks.

In contrast to the prior optimistic moments, when new addresses were generated at record rates, accompanied by soaring trading and meme-coin activity, the slowdown represents a significant change.

As of November 2024, the number of weekly wallet addresses created was approximately 30.2 million. Fast forward to today, and the figure has fallen sharply, sitting at about 7.3 million. This massive drop in wallet creation signals a growing cooling phase in user onboarding across the SOL network.Β 

SOL Maintaining Large Daily Transactions

New wallet addresses may have reduced significantly, but Solana’s transaction scale remains robust. Despite fluctuations in the overall market momentum, SOL maintains a remarkably high level of daily transactions, demonstrating the power of its network.

In a recent report from Solana Daily on the X platform, it was revealed that the network has persistently carried out more than 60 million transactions every day for the past 750 days. This consistency demonstrates the chain’s widespread use in Decentralized Finance (DeFi), Non-Fungible Tokens (NFTs), payments, and high-throughput applications that depend on its affordability and speed.

An interesting aspect of this growth is that the network has maintained zero uptime within the timeframe, reinforcing its position as a reliable hub for on-chain activity. Currently, Solana is supported by real usage rather than just speculative spikes, which increases network efficiency.

Solana

❌