It's no secret that Milwaukee is one of the most popular tool brands, and while many owners love the M18 line of powerful 18V tools, Milwaukee's M12 platform is equally excellent at a lower price point. If you're looking to get your money's worth with a new tool purchase, here are five M12 tools that live up to the hype.
Do you have any old, outdated gas-powered tools you'd like to give a new lease on life? If so, Makita has a neat new product you'll absolutely love. Makita is launching a 40V max XGT electric motor unit, which is a 25 to 50cc gas engine replacement electric motor you can drop in, bolt on, and go.
AI coding work is rising fast, but the biggest payoff isn’t evenly shared. A Science analysis suggests seasoned developers get stronger gains than newcomers, which could reshape how you learn, interview, and prove value.
DeWALT is a popular brand among enthusiasts and professionals thanks to its wide array of tools, with more arriving all the time. If you have a few DeWALT 20V tools and battery packs and go to buy another tool, you'll see models like the 20V MAX, XR, and Atomic—but what does that actually mean?
And how a more advanced approach changed the way I trade momentum, breakouts, and liquidity
Volume is one of the most widely used metrics in trading. Every crypto trader, from beginner to professional, has stared at the green and red bars under their chart trying to decode market intent.
But here’s the uncomfortable truth:
Most traders are reading the wrong volume. Or worse — they’re reading it in the wrong context.
This is especially true when it comes to the popular Daily 24h Volume indicator. You’ve probably seen it on exchanges like Binance, Bybit, OKX — and on TradingView indicators that attempt to emulate it.
And while the metric sounds intuitive (“how much volume traded in the last 24h”), it’s often misunderstood and misapplied in live trading.
In this article, I want to break down:
Why many traders rely on Daily 24h Volume Indicator
What its conceptual weaknesses are
How it differs from standard bar-by-bar volume
A clear comparison between the two
And how these insights led me to build a customized, more actionable volume engine that I personally use
Let’s start with the basics.
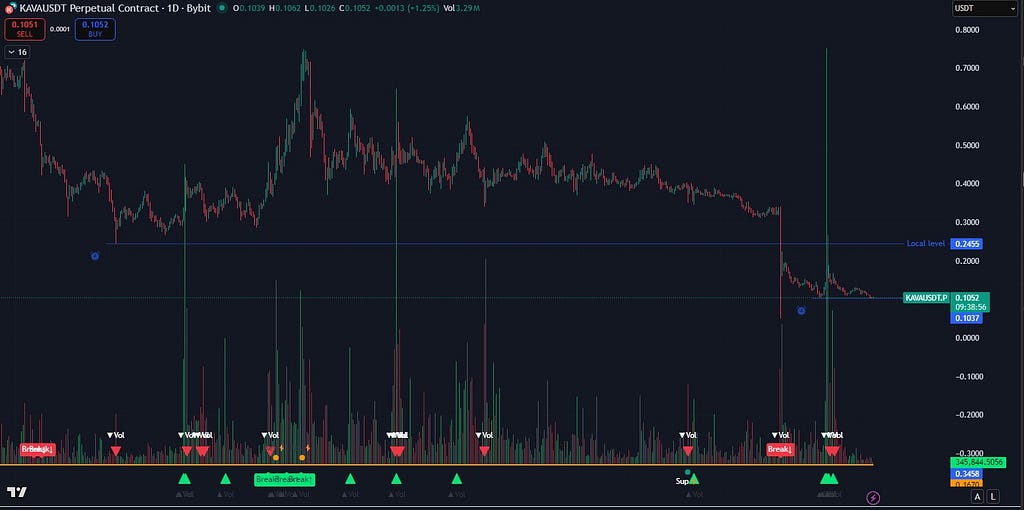
1. Why Traders Use Daily 24h Volume Indicator
At the bottom, the 24-hour volume is highlighted in red, compared to the standard volume indicator above.
Daily 24h Volume Indicator is attractive because:
It reflects overall market participation
It updates continuously and shows exchange-wide liquidity
It gives a sense of the asset’s current “activity level”
For example:
If 24h volume is rising → traders assume interest is growing
If 24h volume is dropping → traders assume liquidity is drying up
It’s a macro-level liquidity gauge.
But here’s the problem:
Daily 24h volume does NOT tell you what’s happening right now on your candle. It tells you what happened in the past day, smoothed into one enormous rolling window. This introduces several pitfalls.
2. The Weaknesses of Daily 24h Volume (Why It Misleads Traders)
Weakness 1 — It’s a rolling metric, not a per-bar signal
Daily 24 volume cannot show momentum shifts inside a candle. You might think volume is increasing… But it’s actually just updating the rolling window.
Weakness 2 — It hides individual bar structure
It blends all buy/sell pressure, spikes, and micro-movements into one big number.
You miss:
Who is in control (buyers or sellers)
Strength of candle body
Wick dominance
Volume spikes on breakouts
Weakness 3 — It reacts slowly
Because it covers the full 24h window, it behaves like a moving average:
Big events fade slowly
Sudden surges barely move the line
It lags on market turns
Weakness 4 — Traders assume it reflects “current volume”
But the bar forming RIGHT NOW could have:
Huge actual volume
But Daily 24 barely moves
— or —
Very small actual volume
But Daily 24 stays high from past candles
This disconnect confuses decision-making.
3. Standard Volume vs Daily 24 Volume — Conceptual Differences
Below is a simplified comparison to set things straight.
In short:
Daily 24h volume is liquidity context.
Per-bar volume is actionable information.
Most traders mix these two concepts — and get confused signals as a result.
4. Why I Built My Own Volume Indicator
After years of active crypto trading, I realized I needed:
Something as reliable as per-candle volume
Something as informative as exchange 24h volume
Something that actually helps predict breakouts and momentum shifts
Something that reflects real buying/selling pressure, not just bar color
Something that filters noise and highlights meaningful spikes
This led me to develop the Advanced Volume Suite — a tool that merges the strengths of both worlds:
Exchange-style liquidity
Real-time actionable volume signals
Momentum detection
Spike identification
Breakout confirmation
It’s the volume engine I personally use in my trading, and now I’m sharing it publicly.
The next section describes how it works.
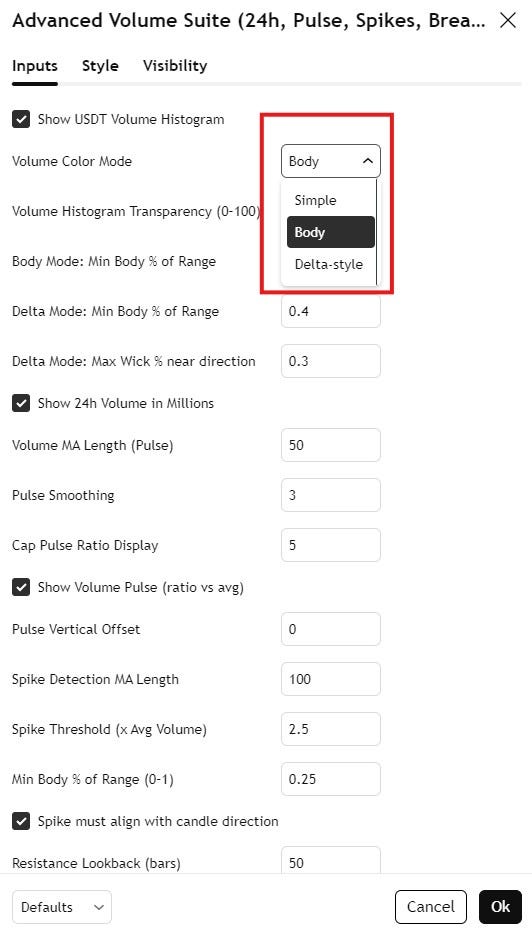
5. Introducing a complete professional toolkit for reading true market volume, momentum, and liquidity: Advanced Volume Suite (24h, Pulse, Spikes, Breakout Pressure)
🔍 What This Indicator Does
The Advanced Volume Suite is a multi-layered volume analysis system designed for traders who rely on volume as a primary decision driver. It expands far beyond TradingView’s standard volume bars by adding:
✔ True USDT Volume
All volume is converted into USDT value (volume × close) to normalize activity across increasing or decreasing prices.
✔ Rolling 24-Hour Volume (Exchange-style metric)
The indicator calculates a custom 24h rolling volume, just like Binance and Bybit display.
✔ Volume Pulse (Strength vs Average)
A powerful ratio that measures momentum inside each bar.
The numbers tell a stark story: $1.42 billion lost across 149 documented incidents in 2024 due to smart contract vulnerabilities, with access control flaws accounting for $953.2 million in damages alone. While the Web3 community debates the perfect AI solution for smart contract security, billions continue to drain from protocols that could have been protected..
An open-source Android application designed to identify and test devices vulnerable to CVE-2025-36911, a critical authentication bypass flaw in Google’s Fast Pair Bluetooth protocol. The vulnerability, commonly referred to as WhisperPair, affects millions of Bluetooth audio devices worldwide, enabling unauthorised pairing and potentially granting access to microphoneswithout user consent. CVE-2025-36911 represents a significant cryptographic weakness […]
If you've ever used a 3D printer, you may recall the wondrous feeling when you first printed something you could have never sculpted or built yourself. Download a model file, load some plastic filament, push a button, and almost like magic, a three-dimensional object appears. But the result isn't polished and ready for mass production, and creating a novel shape requires more skills than just pushing a button. Interestingly, today's AI coding agents feel much the same way.
Since November, I have used Claude Code and Claude Opus 4.5 through a personal Claude Max account to extensively experiment with AI-assisted software development (I have also used OpenAI's Codex in a similar way, though not as frequently). Fifty projects later, I'll be frank: I have not had this much fun with a computer since I learned BASIC on my Apple II Plus when I was 9 years old. This opinion comes not as an endorsement but as personal experience: I voluntarily undertook this project, and I paid out of pocket for both OpenAI and Anthropic's premium AI plans.
Throughout my life, I have dabbled in programming as a utilitarian coder, writing small tools or scripts when needed. In my web development career, I wrote some small tools from scratch, but I primarily modified other people's code for my needs. Since 1990, I've programmed in BASIC, C, Visual Basic, PHP, ASP, Perl, Python, Ruby, MUSHcode, and some others. I am not an expert in any of these languages—I learned just enough to get the job done. I have developed my own hobby games over the years using BASIC, Torque Game Engine, and Godot, so I have some idea of what makes a good architecture for a modular program that can be expanded over time.
Security researchers and penetration testers gain a comprehensive open-source reconnaissance platform with the release of Argus v2.0, a Python-based information gathering toolkit that consolidates 135 specialised modules into a unified command-line interface. The toolkit addresses the growing complexity of modern attack surface management by providing integrated access to network mapping, web application analysis, and threat […]
A new Harmonic Security report reveals a sharp rise in sensitive data shared with generative AI tools like ChatGPT, increasing the risk of security breaches, compliance violations, and data exposure across global organizations.
Welcome back, aspiring digital forensics investigators!
AnyDesk first appeared around 2014 and very quickly became one of the most popular tools for legitimate remote support and system administration across the world. It is lightweight, fast, easy to deploy. Unfortunately, those same qualities also made it extremely attractive to cybercriminals and advanced persistent threat groups. Over the last several years, AnyDesk has become one of the preferred tools used by attackers to maintain persistent access to compromised systems.
Attackers abuse AnyDesk in a few different ways. Sometimes they install it directly and configure a password for unattended access. Other times, they rely on the fact that many organizations already have AnyDesk installed legitimately. All the attacker needs to do is gain access to the endpoint, change the AnyDesk password or configure a new access profile, and they now have quiet, persistent access. Because remote access tools are so commonly used by administrators, this kind of persistence often goes unnoticed for days, weeks, or even months. During that time the attacker can come and go as they please. Many organizations do not monitor this activity closely, even when they have mature security monitoring in place. We have seen companies with large infrastructures and centralized logging completely ignore AnyDesk connections. This has allowed attackers to maintain footholds across geographically distributed networks until they were ready to launch ransomware operations. When the encryption finally hits critical assets and the cryptography is strong, the damage is often permanent, unless you have the key.
We also see attackers modifying registry settings so that the accessibility button at the Windows login screen opens a command prompt with the highest privileges. This allows them to trigger privileged shells tied in with their AnyDesk session while minimizing local event log traces of normal login activity. We demonstrated similar registry hijacking concepts previously in “PowerShell for Hackers – Basics.” If you want a sense of how widespread this abuse is, look at recent cyberwarfare reporting involving Russia.
Kaspersky has documented numerous incidents where AnyDesk was routinely used by hacktivists and financially motivated groups during post-compromise operations. In the ICS-CERT reporting for Q4 2024, for example, the “Crypt Ghouls” threat actor relied on tools like Mimikatz, PingCastle, Resocks, AnyDesk, and PsExec. In Q3 2024, the “BlackJack” group made heavy use of AnyDesk, Radmin, PuTTY and tunneling with ngrok to maintain persistence across Russian government, telecom, and industrial environments. And that’s just a glimpse of it.
Although AnyDesk is not the only remote access tool available, it stands out because of its polished graphical interface and ease of use. Many system administrators genuinely like it. That means you will regularly encounter it during investigations, whether it was installed for legitimate reasons or abused by an attacker.
With that in mind, let’s look at how to perform digital forensics on a workstation that has been compromised through AnyDesk.
Investigating AnyDesk Activity During an Incident
Today we are going to focus on the types of log files that can help you determine whether there has been unauthorized access through AnyDesk. These logs can reveal the attacker’s AnyDesk ID, their chosen display name, the operating system they used, and in some cases even their IP address. Interestingly, inexperienced attackers sometimes do not realize that AnyDesk transmits the local username as the connection name, which means their personal environment name may suddenly appear on the victim system. The logs can also help you understand whether there may have been file transfers or data exfiltration.
For many incident response cases, this level of insight is already extremely valuable. On top of that, collecting these logs and ingesting them into your SIEM can help you generate alerts on suspicious activity patterns such as unexpected night-time access. Hackers prefer to work when users are asleep, so after-hours access from a remote tool should always trigger your curiosity.
Here are the log files and full paths that you will need for this analysis:
AnyDesk can be used in two distinct ways. The first is as a portable executable. In that case, the user runs the program directly without installing it. When used this way, the logs are stored under the user’s AppData directory. The second way is to install AnyDesk as a service. Once installed, it can be configured for unattended access, meaning the attacker can log in at any time using only a password, without the local user needing to confirm the session. When AnyDesk runs as a service, you should also examine the ProgramData directory as it will contain its own trace files. The AppData folder will still hold the ad.trace file, and together these files form the basis for your investigation.
With this background in place, let’s begin our analysis.
Connection Log Timestamps
The connection_trace.txt logs are relatively readable and give you a straightforward record of successful AnyDesk connections. Here is an example with a randomized AnyDesk ID:
Incoming 2025–07–25, 12:10 User 568936153 568936153
The real AnyDesk ID has been redacted. What matters is that the log clearly shows there was a successful inbound connection on 2025–07–25 at 12:10 UTC from the AnyDesk ID listed at the end. This already confirms that remote access occurred, but we can dig deeper using the other logs.
Gathering Information About the Intruder
Now we move into the part of the investigation where we begin to understand who our attacker might be. Although names, IDs, and even operating systems can be changed by the attacker at any time, patterns still emerge. Most attackers do not constantly change their display name unless they are extremely paranoid. Even then, the timestamps do not lie. Remote logins occurring repeatedly in the middle of the night are usually a strong indicator of unauthorized access.
We will work primarily with the ad.trace and ad_svc.trace files. These logs can be noisy, as they include a lot of error messages unrelated to the successful session. A practical way to cut through the noise is to search for specific keywords. In PowerShell, that might look like this:
These commands filter out only the most interesting lines and save them into new files called adtrace.log and adsvc.log, while still letting you see the results in the console. The tee command behaves this way both in Windows and Linux. This small step makes the following analysis more efficient.
IP Address
In many cases, the ad_svc.trace log contains the external IP address from which the attacker connected. You will often see it recorded as “Logged in from,” alongside the AnyDesk ID listed as “Accepting from.” For the sake of privacy, these values were redacted in the screenshot we worked from, but they can be viewed easily inside the adsvc.log file you created earlier.
Once you have the IP address, you can enrich it further inside your SIEM. Geolocation, ASN information, and historical lookups may help you understand whether the attacker used a VPN, a hosting provider, a compromised endpoint, or even their home ISP.
Name & OS Information
Inside ad.trace you will generally find the attacker’s display name in lines referring to “Incoming session request.” Right next to that field you will see the corresponding AnyDesk ID. You may also see references to the attacker’s operating system.
In the example we examined, the attacker was connecting from a Linux machine and had set their display name to “IT Dep” in an attempt to appear legitimate. As you can imagine, users do not always question a remote session labeled as IT support, especially if the attacker acts confidently.
Data Exfiltration
AnyDesk does not only provide screen control. It also supports file transfer both ways. That means attackers can upload malware or exfiltrate sensitive company data directly through the session. In the ad.trace logs you will sometimes see references such as “Preparing files in …” which indicate file operations are occurring.
This line alone does not always tell you what exact files were transferred, especially if the attacker worked out of temporary directories. However, correlating those timestamps with standard Windows forensic artifacts, such as recent files, shellbags, jump lists, or server access logs, often reveals exactly what the attacker viewed or copied. If they accessed remote file servers during the session, those server logs combined with your AnyDesk timestamps can paint a very clear picture of what happened.
In our case, the attacker posing as the “IT Dep” accessed and exfiltrated files stored in the Documents folder of the manager who used that workstation.
Summary
Given how widespread AnyDesk is in both legitimate IT environments and malicious campaigns, you should always consider it a high-priority artifact in your digital forensics and incident response workflows. Make sure the relevant AnyDesk log files are consistently collected and ingested into your SIEM so that suspicious activity does not go unnoticed, especially outside business hours. Understanding how to interpret these logs shows the attacker’s behavior that otherwise feels invisible.
Our team strongly encourages you to remain aware of AnyDesk abuse patterns and to include them explicitly in your investigation playbooks. If you need any support building monitoring, tuning alerts, or analyzing remote access traces during an active case, we are always happy to help you strengthen your security posture.
앤트로픽은 클로드 코드의 기능을 프로그래밍 영역을 넘어 일상적인 기업 업무 흐름으로 확장하기 위한 ‘코워커(Cowork)’를 프리뷰 버전으로 12일 공개했다.
이 새로운 코딩 어시스턴트는 조직이 특정 폴더에 대한 접근 권한을 부여할 경우 일정 요약, 보고서 작성, 파일 정리와 같은 작업을 자동화할 수 있도록 지원한다. 코워커는 관련 도구, 데이터베이스, 애플리케이션과의 연동도 가능하다.
또한 크롬 환경에서 클로드와 함께 사용하면 브라우저 접근이 필요한 작업도 수행할 수 있다. 앤트로픽은 공식 블로그를 통해 사용자가 AI 기반 어시스턴트가 하나의 작업을 마칠 때까지 기다리지 않고 여러 작업을 병렬로 할당할 수 있다고 설명했다.
애널리스트들은 코워커의 도입이 AI 어시스턴트를 보다 다양한 비즈니스 기능에 활용하려는 앤트로픽의 전략적 방향성을 보여준다고 분석했다.
컨설팅 기업 에베레스트 그룹의 총괄 애널리스트 베르시타 스리바스타바는 “코워커는 단순한 대화를 넘어 범위가 제한된 실행 중심 기능으로 확장함으로써, 지식 기반 역할에서 주를 이루는 문서 및 파일 중심 업무에 클로드를 실질적으로 활용하려는 의도를 반영한다”라고 설명했다.
스리바스타바는 이어 가드레일을 명확하게 설정할 수 있는 리서치, 프로젝트 관리 조직(PMO), 운영, 분석과 같은 역할에서도 새로운 도구의 효과를 기대할 수 있으며, 이러한 영역에서 도입이 가장 활발하게 이뤄질 가능성이 높다고 전망했다.
컨설팅 기업 퓨처럼그룹의 데이터·AI·인프라 부문 총괄 브래들리 심민 역시 같은 견해를 보이며, 코워커가 개발자에게도 유용할 수 있다고 언급했다. 심민은 코워커를 앤트로픽의 ‘컴퓨터 사용(computer-use)’ 기능과 커맨드라인 유틸리티가 자연스럽게 진화한 결과로 평가했다.
코워커는 브라우저를 통해 시스템 화면을 살펴보거나 스크린샷을 찍는 방식이 아니라 운영체제의 핵심 기능에 직접 접근할 수 있기 때문에, 에이전트 기반 소프트웨어 개발 워크플로 인접 영역에 위치한 작업을 자동화하고 운영 단계로 확장하는 데 활용할 수 있다는 설명이다.
심민은 예로 “프로젝트의 일부인 JSON 데이터를 빠르게 마크다운 형식으로 변환해 비개발자도 해당 정보를 쉽게 읽을 수 있도록 만드는 작업”을 들었다.
다만 앤트로픽은 코워커에 시스템이나 환경 접근 권한을 부여할 경우 주의가 필요하다고 경고했다. 프롬프트를 잘못 이해해 파일 삭제와 같은 파괴적인 명령을 실행할 수 있기 때문이다. 다만 명령이나 작업을 실행하기 전에는 사용자에게 확인을 요청하도록 설계돼 있다고 밝혔다.
또한 악성 콘텐츠가 도구에 내장된 방어 체계를 우회해 클로드의 계획을 변경할 수 있는 프롬프트 인젝션 공격 위험도 함께 지적했다.
또 다른 컨설팅 기업 무어인사이트앤드스트래티지의 수석 애널리스트 제이슨 앤더슨은 이러한 문제를 완화하기 위해, 제품이 정식 출시될 때 파일 삭제 시 복구할 수 있거나 이메일 전송을 취소할 수 있는 되돌리기 기능을 추가할 수 있다고 제안했다.
앤더슨은 이 기능이 프롬프트 인젝션 공격과 사용자 실수 모두를 보완할 수 있을 것이라고 분석했다. 현재 이 새로운 형태의 어시스턴트는 맥OS 애플리케이션을 통해 클로드 맥스 구독자에게 제공되고 있다. dl-ciokorea@foundryco.com
주요 바이브 코딩 플랫폼이 흔히 사용되는 프로그래밍 프롬프트에 대해 안전하지 않은 코드를 반복적으로 생성하고, 이 과정에서 ‘치명적’ 수준으로 평가되는 취약점까지 만들어낸다는 테스트 결과가 나왔다.
보안 스타트업 텐자이는 이들 도구가 정형화된 규칙이나 관행으로 대응할 수 있는 보안 결함은 비교적 잘 회피하지만, 안전과 위험을 가르는 기준이 상황에 따라 달라지는 영역에서는 어려움을 겪는다고 설명했다.
텐자이는 2025년 12월 진행한 이번 평가에서 클로드 코드(Claude Code), 오픈AI 코덱스(OpenAI Codex), 커서(Cursor), 레플릿(Replit), 데빈(Devin) 등 주요 바이브 코딩 도구 5종에서사전 정의된 프롬프트를 사용해 3가지 테스트 애플리케이션을 구축하는 방식으로 비교 분석했다.
그 결과, 5개 도구가 각각 3개씩 생성한 총 15개 애플리케이션의 코드에서 모두 69개의 취약점이 발견됐다. 이 가운데 약 45개는 ‘낮음~중간’ 수준의 심각도로 평가됐지만, 나머지 다수는 ‘높음’으로 분류됐다. 그중 6개는 ‘치명적’ 취약점에 해당했다.
낮음~중간 수준의 취약점 수는 5개 도구 모두에서 동일했지만, 치명적 등급의 취약점은 클로드 코드(4건), 데빈(1건), 코덱스(1건)에서 생성됐다.
가장 심각한 취약점은 API 인가 로직과 비즈니스 로직에서 발견됐다. API 인가 로직은 누가 특정 리소스에 접근하거나 어떤 작업을 수행할 수 있는지를 검증하는 기능이며, 비즈니스 로직은 허용돼서는 안 되는 사용자 행위를 구분한다. 두 영역 모두 전자상거래 시스템에서 핵심적인 보안 요소로 꼽힌다.
텐자이 연구진은 “AI가 생성한 코드 에이전트는 비즈니스 로직에 특히 취약한 경향이 있다. 개발자는 워크플로우가 어떻게 작동해야 하는지에 대한 직관적 이해를 바탕으로 판단하지만, 에이전트는 이러한 ‘상식’을 갖추지 못해 대부분 명시적인 지시에 의존한다”라고 설명했다.
반면 긍정적인 측면도 확인됐다. 이번 테스트에서 바이브 코딩 도구는 SQL 인젝션이나 크로스사이트 스크립팅과 같이, 오랫동안 사람이 작성한 애플리케이션을 괴롭혀 온 대표적인 보안 결함을 비교적 잘 회피했다. 이들 취약점은 여전히 OWASP 웹 애플리케이션 보안 위험 상위 10대 목록에 포함돼 있다.
텐자이는 “개발한 모든 애플리케이션에서 악용 가능한 SQL 인젝션이나 XSS 취약점은 한 건도 발견되지 않았다”라고 전했다.
사람 감독의 중요성
흔히 바이브 코딩은 일상적인 프로그래밍 작업을 자동화해 생산성을 높인다는 장점이 자주 강조된다. 이는 분명 사실이지만, 텐자이의 테스트 결과는 이 같은 접근에도 분명한 한계가 있음을 보여준다. 사람의 감독과 디버깅이 여전히 필수적이라는 것이다.
이는 새로운 발견이 아니다. ‘바이브 코딩’이라는 개념이 등장한 이후 지난 1년 동안, 적절한 감독이 없는 경우 도구가 새로운 사이버 보안 취약점을 유발할 수 있다는 연구 결과가 여러 차례 제시돼 왔다.
문제는 바이브 코딩 플랫폼이 단순히 코드 내 보안 결함을 놓친다는 데 그치지 않는다. 경우에 따라서는 무엇이 안전하고 무엇이 위험한지를 일반적인 규칙이나 사례로 정의하는 것 자체가 불가능하다는 점이 더 큰 과제로 지적된다.
텐자이는 서버 측 요청 위조(SSRF)를 예로 들며, “정상적인 URL 요청과 악의적인 요청을 구분하는 보편적인 기준은 존재하지 않는다. 안전과 위험의 경계는 맥락에 크게 좌우되기 때문에 정형화된 해결책을 적용하기 어렵다”라고 설명했다.
이에 따라 업계에서는 바이브 코딩 에이전트뿐만 아니라, 이를 검증하고 점검하는 바이브 코딩 검사 에이전트에도 주목해야 한다는 지적이 나온다. 소규모 스타트업인 텐자이는, 바이브 코딩을 검증하는 기술 영역에서 현재로서는 뚜렷한 해법이 제시되지 않고 있다고 보고 있다. 텐자이는 “테스트와 최근 연구 결과를 종합하면 이 문제를 포괄적으로 해결할 수 있는 솔루션은 아직 존재하지 않는다. 개발자가 코딩 에이전트의 일반적인 함정을 이해하고 이에 대비하는 것이 중요하다”라고 언급했다.
AI 디버깅
바이브 코딩과 관련한 보다 근본적인 질문은 도구의 성능이 아니라 사용 방식이다. 개발자에게 결과물을 꼼꼼히 확인하라고 말하는 것과, 실제로 그런 검토가 항상 이뤄진다고 전제하는 것은 다른 문제다. 사람이 직접 코드를 작성하던 시기에도 모든 실수가 사전에 통제되지는 않았다.
보안 서비스 기업 탈리온(Talion)의 공격 보안 총괄인 매튜 로빈스는 “바이브 코딩 방식을 도입할 때 기업은 보안 코드 검토가 전체 보안 소프트웨어 개발 주기의 일부로 포함되고 지속적으로 실행되도록 해야 한다. OWASP 안전한 코딩 관행이나, SEI CERT 코딩 표준과 같은 언어별 프레임워크 등 검증된 모범 사례도 함께 활용해야 한다”라고 설명했다.
로빈스는 코드가 배포되기 전 정적 분석과 동적 분석을 통해 반드시 검증해야 한다고 덧붙였다. 관건은 디버깅을 어떻게 제대로 수행하느냐다. 그는 “바이브 코딩은 분명 위험을 수반하지만, 전통적인 디버깅과 품질 보증을 넘어서는 업계 표준 프로세스와 가이드라인을 충실히 따르면 관리 가능한 수준”이라고 분석했다.
반면 애플리케이션 테스트 기업 체크마크스(Checkmarx)의 제품 마케팅 부사장 에란 킨스브루너는 전통적인 디버깅 방식이 AI 시대에는 한계에 직면할 수 있다고 지적했다.
킨스브루너는 “AI 속도로 진행되는 문제에 대해 더 많은 디버깅을 요구하는 잘못된 대응”이라며 “디버깅은 AI가 생성한 코드를 사후에 사람이 충분히 검토할 수 있다는 전제를 깔고 있지만, 바이브 코딩의 규모와 속도에서는 그런 전제가 더 이상 성립하지 않는다”라고 말했다.
그는 이어 “현실적인 해법은 보안을 개발 이후가 아니라 코드 생성 단계에 포함시키는 것”이라며 “AI 코딩 어시스턴트와 함께 작동하는 에이전트 기반 보안이 개발 환경 안에 기본적으로 통합돼야 한다”고 설명했다. dl-ciokorea@foundryco.com
If you’ve ever conducted an OSINT investigation, you probably know that the dark web is one of the hardest places to investigate. Whether you’re tracking ransomware groups or looking for leaked passwords manually searching through dark web results takes hours and gives you mostly junk and malware. This is where AI can change how you investigate. By using Large Language Models we can improve our searches and filter results faster. To do this, we have a tool called Robin.
In this article, we’ll explore how to install this tool, how to use it, and what features it provides. Let’s get rolling!
What is Robin
Robin is an open-source tool for investigating the dark web. It uses AI to improve your searches, filter results from dark web search engines, and summarize what you find. What makes Robin particularly valuable is its multi-model support. You can easily switch between OpenAI, Claude, Gemini, or local models like Ollama depending on your needs, budget, and privacy requirements. The tool is CLI-first, built for terminal users who want to integrate dark web intelligence into their existing workflows.
Step #1: Install Robin
For this demonstration, I’ll be using a Raspberry Pi as the hacking platform, but you can easily replicate all the steps using Kali or any other Debian-based distribution. To install the tool, we can either use the source code from GitHub or Docker. I will choose the first option. To begin, clone the repository first:
As shown in the downloaded files, this is a Python project. We need to create a virtual environment and install the required packages.
pi> python -m venv venv
pi> source venv/bin/activate
pi> pip3 install -r requirements.txt
Before Robin can search the dark web, we need to have Tor running on your system. Install Tor by opening your terminal and executing the following command:
pi> sudo apt install tor
Step #2: Configure Your API Key
In this demonstration, I will be using Google’s Gemini models. You can easily create an API key in Google AI Studio to access the models. If you open the config.py file, you will see which models support the tool.
Robin can be configured using either a .env file or system environment variables. For most users, creating a .env file in your Robin directory provides the cleanest approach. This method keeps your API credentials organized and makes it easy to switch between different configurations. Open the file in your preferred text editor and add your Gemini API key.
Step #3: Execute Your First Dark Web Investigation
First, let’s open the help screen to see which options this tool supports and to verify that we installed it correctly.
pi> python3 main.py –help
Currently, we can see two supported modes for using this tool: CLI and web UI. I prefer CLI, so I will demonstrate that. Let’s explore the help screen of the CLI mode.
pi> python3 main.py cli –help
It’s a straightforward help screen; we simply need to specify an LLM model and our query. Let’s search for credential exposure.
After a few minutes of processing, Robin produced the gathered information on the terminal. By default, it is formatted in Markdown and saved to a file with a name based on the current date and time. To view the results with Markdown formatting, I’ll use a command-line tool called glow.
pi> glow summary-xx-xx.md
The analysis examined various Tor-based marketplaces, vendors, and leak sources that advertise stolen databases and credentials. The findings reveal a widespread exposure of personally identifiable information (PII), protected health information (PHI), financial data, account credentials, and cryptocurrency private keys associated with major global organizations and millions of individuals. The report documents active threat actors, their tactics, and methods of monetization. Key risks have been identified, along with recommended next steps.
Understand the Limitations
While Robin is a powerful tool for dark web OSINT, it’s important to understand its limits. The tool uses dark web search engines, which only index a small part of what’s actually on hidden services. Many dark websites block indexing or require you to log in, so Robin can’t reach them through automated searches. For thorough investigations, you’ll still need to add manual research and other OSINT methods to what Robin finds.
The quality of Robin’s intelligence summaries depends a lot on the LLM you’re using and the quality of what it finds. Gemini 2.5 Flash gives great results for most investigations, but the AI can only work with the information in the search results. If your search doesn’t match indexed content, or if the information you need is behind a login wall, Robin won’t find it.
Summary
Conducting investigations on the dark web can be time-consuming when using traditional search tools. Since the dark web relies on anonymity networks, isn’t indexed by standard search engines, and contains a vast amount of irrelevant information, manual searching can often be slow and ineffective. Robin addresses these challenges by leveraging AI to enhance your searches, intelligently filter results, and transform findings into useful intelligence reports. While this tool does have limitations, it can be a valuable addition to your arsenal when combined with manual searching and other OSINT tools.
If you’re interested in deepening your knowledge of OSINT investigations or even starting your own investigation business, consider exploring our OSINT training to enhance your skills.
Are you trying to figure out what tools are best for testing your web applications? If so, you have likely done some research and know there are a lot of options from complex Java log parser tools to other tools that are much more simple in design, and as such free logging tools. If you […]
A new experimental tool called InvisibleJS has emerged on GitHub, demonstrating how JavaScript source code can be completely hidden from human view while remaining fully executable. Created by developer oscarmine, this proof-of-concept obfuscation technique leverages zero-width Unicode characters to encode executable payloads that appear as blank files to the naked eye. How InvisibleJS Works InvisibleJS employs steganographic […]


.webp?ssl=1)