Swiss banking giant UBS, with assets under management (AuM) of up to $7 trillion, is set to launch Bitcoin trading for some of its clients. This comes amid predictions that regulatory clarity and broader adoption could send the BTC price to as high as $200,000.
UBS To Offer Bitcoin Trading To Some Wealth Clients
Bloomberg reported that UBS is planning to launch crypto trading for some of its wealth clients, starting with its private bank clients in Switzerland. The bank will reportedly begin by offering these clients the opportunity to invest in Bitcoin and Ethereum. At the same time, the crypto offering could further expand to clients in the Pacific-Asia region and the U.S.
The banking giant is currently in discussions with potential partners, and there is no clear timeline for when it could launch Bitcoin and Ethereum trading for clients. This move is said to be partly due to increased demand from wealth clients for crypto exposure. UBS also faces increased competition as other Wall Street giants are working to offer crypto trading.
Morgan Stanley, in partnership with Zerohash, announced plans to launch crypto trading in the first half of this year, starting with Bitcoin, Ethereum, and Solana. The banking giant may soon also be able to offer its crypto products, as it has filed with the SEC to launch spot BTC, ETH, and SOL ETFs.
Furthermore, JPMorgan, another of UBS’ competitors, is considering offering crypto trading to institutional clients, although this plan is still in the early stages. The bank already accepts Bitcoin and Ethereum as collateral from its clients. Last year, it also filed to offer BTC structured notes that will track the performance of the BlackRock Bitcoin ETF.
Can Bank’s Entry Trigger A BTC Rally To $200,000
Kevin O’Leary predicted that Bitcoin could rally to between $150,000 and $200,000 this year, driven by the passage of the CLARITY Act. His prediction came just as White House Crypto Czar David Sacks said banks would fully enter crypto once the bill passes. As such, there is a possibility that BTC could reach this $200,000 psychological level in anticipation of the amount of new capital that could flow into BTC from these banks once the bill passes.
BitMine’s Chairman, Tom Lee, also predicted during a CNBC interview that Bitcoin could reach between $200,000 and $250,000 this year, partly due to growing institutional adoption by Wall Street giants. Meanwhile, Binance founder Changpeng “CZ” Zhao said that a BTC rally to $200,000 is the “most obvious thing in the world” to him.
At the time of writing, the Bitcoin price is trading at around $89,600, up in the last 24 hours, according to data from CoinMarketCap.
Crypto analyst CryptoBull has highlighted targets that XRP could reach as it eyes double digits. The analyst is confident the altcoin could reach these targets, noting that current price action is mirroring the previous bull run.
XRP Eyes Rally To $11 And Then $70
In an X post, Crypto Bull stated that the next impulse will take XRP to $11 and that the last wave will take the altcoin to $70. This came as he noted that the price pattern is mirroring the previous bull run, with the only difference being time, which he claimed makes sense, as the altcoin needs longer accumulation to reach higher prices.
The analyst also indicated that it could take a year of accumulation for XRP to reach the $11 price target, meaning the last wave to $70 could take much longer. This prediction comes despite the current decline in the crypto market, with XRP trading below the psychological $2 price level.
Despite the current bearish sentiment, crypto analyst CW has also declared that the XRP rally is about to begin and that the road to $21.5 is just the beginning. He noted that this is the Phase 4 peak while the first goal is for the altcoin to break its current all-time high (ATH).
His accompanying chart showed that XRP could reach this $21 target by year-end. Meanwhile, there is the possibility of the altcoin rallying above $100 in the next Phase 1, which could happen next year. Crypto Pundit X Finance Bull recently highlighted the CLARITY Act and Trump’s tariffs as factors that could boost XRP’s demand and lead to higher prices for the altcoin.
He expects the CLARITY Act to boost XRP’s demand, especially with Trump’s Crypto Czar predicting that more banks will enter into crypto once the bill passes. X Finance Bull predicts that XRP will be the token of choice for these banks based on his belief that Ripple will provide the rails to onboard them.
XRP Breaking Out Of Multi-Year Triangle
Crypto analyst XForce revealed in an X post that XRP is breaking out of the largest 6+ year triangle in history, yet people are calling it a fakeout. He added that he is not a permabull or permanbear on the altcoin but that he follows trends and plays macro breakout patterns. His accompanying chart indicated that XRP was on the verge of a move to the upside, with a potential rally above $11.50.
On the lower timeframe, crypto analyst Chart Nerd stated that XRP is currently breaking out of a two-week falling wedge structure. He noted that this is a bullish reversal pattern that could send the altcoin back to $2.40 in the short term, as this is where the wedge formed. He highlighted a key resistance between $2.13 and $2.20, which the altcoin will need to break above to confirm a reversal.
At the time of writing, the XRP price is trading at around $1.92, up in the last 24 hours, according to data from CoinMarketCap.
Crypto pundit X Finance Bull has explained how Donald Trump’s push to sign the crypto bill into law will boost demand for XRP. This follows White House Crypto Czar David Sack’s prediction about how banks will come into crypto once the CLARITY Act passes.
How Donald Trump’s Crypto Push Will Boost XRP’s Demand
In an X post, X Finance Bull shared a video in which Donald Trump’s crypto adviser, David Sacks, stated that banks will begin to adopt crypto once the crypto bill passes. The pundit noted that this means banks are already positioned, while Ripple has the stack and XRP has the liquidity, and the rails are in place. As such, he believes that the token will be the go-to crypto once these banks enter the crypto industry.
X Finance Bull further mentioned that institutions that have been waiting over the past few years will return and announce their buys and use of XRP once Donald Trump signs the CLARITY Act into law. The pundit added that this moment resets who is early and that he never needed hype to hold the altcoin. “Research and study were always enough,” he said.
X Finance Bull also questioned why market participants were panic-selling if banks are going all in once Donald Trump signs the crypto bill into law. The pundit’s statements come just as Ripple partnered with DXC to integrate the token and RLUSD into DXC’s Hogan core banking platform.
The banking platform powers more than 300 million deposit accounts and over $5 trillion in deposits globally. As such, this is a major step in XRP’s adoption, as the partnership will integrate Ripple’s payment technology into large-scale banking environments.
Trump’s Tariff Move Will Also Boost The Altcoin
In another X post, X Finance Bull claimed that Donald Trump’s move with tariffs will also boost XRP’s demand. He shared a video of how the U.S. president said that $18 trillion is flowing into the U.S. economy thanks to these tariffs. The pundit asserted that such money flows put pressure on banks, payroll systems, FX rails, and settlement speed.
X Finance Bull further noted that this creates nonstop cross-border payments and liquidity needs, and this is where Ripple and XRP come in. He explained that while old rails leak money, Ripple and the altcoin were built to stop that. The pundit also alluded to Ripple executives meeting with Donald Trump and to the token being mentioned as part of the digital asset stockpile. He added that the CLARITY Act is next and that when rules lock in, the U.S. capital will need U.S. rails.
At the time of writing, the XRP price is trading at around $1.92, down almost 2% in the last 24 hours, according to data from CoinMarketCap.
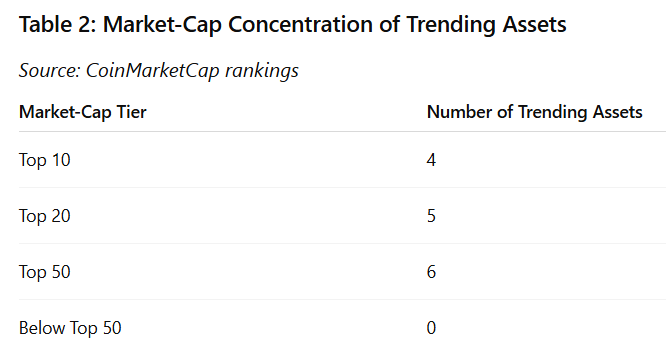
On January 22, 2026, CoinMarketCap’s most-viewed asset data reveals a market driven more by attention and reassessment than by short-term price strength.
Using CoinMarketCap’s official definition of “most viewed” assets over the last seven days, and filtering strictly to cryptocurrencies ranked within the top 50 by market capitalization, six assets stand out as the most consistently watched by users:
Bitcoin (BTC)
Ethereum (ETH)
XRP (XRP)
Solana (SOL)
Monero (XMR)
Pi Network (PI)
CoinMarketCap’s “most viewed” metric does not indicate bullish momentum or price leadership. It reflects user attention, meaning which assets investors, traders, and researchers are actively monitoring.
This distinction is critical. Trending, in this context, means high informational demand, not performance. All six assets posted negative seven-day price performance, according to CoinMarketCap price data, while showing mixed or modest positive movement over the last 24 hours. This pattern strongly suggests that users are watching volatility, drawdowns, and narrative shifts rather than chasing gains.
Source for all ranking, pricing, and view-based metrics: CoinMarketCap official asset pages and trending lists https://coinmarketcap.com
Why Attention Is Concentrated in Large-Cap Cryptocurrencies
One of the most telling aspects of this week’s CoinMarketCap trending data is what it excludes.
There are no micro-caps. There are no newly launched tokens. There are no thin-liquidity speculative plays.
Every trending asset sits comfortably inside the top 50 by market capitalization, based on CoinMarketCap’s rankings.
This concentration reflects a broader behavioral shift that typically appears during periods of market stress or uncertainty. When volatility increases and correlations tighten, investors prioritize assets that offer:
Deep liquidity
Long operating histories
Broad exchange support
Established narratives
Large-cap cryptocurrencies function as information anchors during uncertain periods. Market participants track them to understand sentiment, liquidity conditions, and systemic risk.
CoinMarketCap’s view data confirms that users are not seeking novelty. They are seeking clarity.
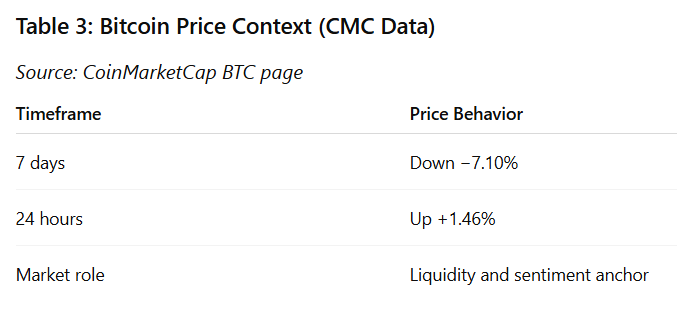
Bitcoin (BTC): The Market’s Primary Signal Asset
CMC Rank: 1
7-Day Price Change: −7.10%
24-Hour Price Change: +1.46%
Trending Signal: Top 10 most viewed assets on CoinMarketCap over the last 7 days
Source: CoinMarketCap BTC page
Bitcoin remains the most viewed asset in crypto markets, regardless of short-term price behavior. Its trending status reflects its role as the primary reference point for the entire digital asset ecosystem.
Over the past seven days, Bitcoin experienced a notable pullback, consistent with broader risk-off conditions across global markets. Despite this decline, the modest positive movement over the last 24 hours suggests stabilization rather than renewed momentum.
CoinMarketCap view data indicates that users are closely monitoring Bitcoin not because it is breaking out, but because it anchors:
Market-wide liquidity expectations
Correlation behavior with equities and commodities
Institutional positioning signals
During corrective phases, Bitcoin attracts heightened attention as participants assess whether price action represents temporary volatility or a deeper structural shift. The data suggests monitoring behavior, not speculative chasing.
Ethereum (ETH): Reassessment of Structure and Positioning
CMC Rank: 2
7-Day Price Change: −11.14%
24-Hour Price Change: +2.04%
Trending Signal: Top 10 most viewed assets on CoinMarketCap over the last 7 days
Source: CoinMarketCap ETH page
Ethereum’s sharper seven-day decline relative to Bitcoin helps explain its elevated view count. Larger drawdowns in major assets often trigger deeper analysis rather than immediate exit behavior.
Ethereum occupies a unique position in the crypto market. It combines elements of:
A settlement network
A smart contract platform
A yield-bearing asset via staking
When price declines accelerate, investors reassess these components together. CoinMarketCap’s trending data reflects this reassessment phase.
The positive 24-hour move suggests short-term stabilization, but the weekly decline keeps Ethereum firmly under scrutiny. View activity signals analysis and evaluation, not renewed bullish conviction.
XRP (XRP): Persistent Attention Without Momentum Leadership
CMC Rank: 5
7-Day Price Change: −8.69%
24-Hour Price Change: +1.96%
Trending Signal: Top 10 most viewed assets on CoinMarketCap over the last 7 days
Source: CoinMarketCap XRP page
XRP’s presence among the most viewed assets highlights how attention can persist independently of momentum.
Despite underperforming on a seven-day basis, XRP continues to attract interest due to its long-standing role in payment-focused blockchain discussions and its position among the largest crypto assets by market cap.
CoinMarketCap view data suggests that XRP is being monitored as part of broader portfolio reassessment rather than active accumulation. During market drawdowns, investors often revisit assets with distinct use-case narratives to evaluate relative resilience.
The data indicates curiosity and monitoring, not leadership.
Solana (SOL): High Beta Drives High Scrutiny
CMC Rank: 7
7-Day Price Change: −10.32%
24-Hour Price Change: +2.17%
Trending Signal: Top 10 most viewed assets on CoinMarketCap over the last 7 days
Source: CoinMarketCap SOL page
Solana’s trending status reflects its reputation as a high-beta large-cap asset. In volatile markets, Solana often experiences larger percentage moves than peers, which naturally increases attention.
The seven-day decline aligns with broader risk-off behavior, while the short-term rebound suggests tactical positioning rather than structural shift.
CoinMarketCap view data implies that traders and investors are closely watching Solana to gauge risk appetite within the crypto ecosystem. High view counts here reflect sensitivity to volatility rather than renewed optimism.
Monero (XMR): Attention Driven by Dislocation
CMC Rank: 12
7-Day Price Change: −30.24%
24-Hour Price Change: +2.12%
Trending Signal: Top 10 most viewed assets on CoinMarketCap over the last 7 days
Source: CoinMarketCap XMR page
Monero stands apart from the rest of the trending list.
Its seven-day drawdown is materially larger than that of any other asset discussed, yet it remains one of the most viewed cryptocurrencies on CoinMarketCap.
This pattern is typical when a major asset experiences a sharp, atypical move. Investors seek context, not momentum. They want to understand whether the move reflects liquidity pressure, regulatory concerns, or temporary dislocation.
The modest 24-hour recovery suggests stabilization, but the magnitude of the weekly decline keeps Monero under scrutiny. CoinMarketCap view data here reflects reassessment, not speculation.
Pi (PI): Edge-of-Top-50 Curiosity
CMC Rank: 48
7-Day Price Change: −9.77%
24-Hour Price Change: +4.67%
Trending Signal: Top 10 most viewed assets on CoinMarketCap over the last 7 days
Source: CoinMarketCap PI page
Pi is the lowest-ranked asset on this list, and that alone explains much of the attention it is receiving.
Assets near ranking thresholds often see elevated views during volatile periods, as investors evaluate whether they will gain or lose relative standing.
The stronger 24-hour rebound compared to peers adds to curiosity, but the negative seven-day performance places Pi firmly within the broader corrective trend.
CoinMarketCap view data suggests monitoring behavior rather than speculative enthusiasm.
What CoinMarketCap Trending Data Tells Us About the Market
Several conclusions emerge clearly from this dataset:
Trending reflects attention, not performance All six assets declined over seven days.
Large caps dominate focus Investors gravitate toward liquidity and durability.
Volatility increases informational demand Drawdowns drive research behavior.
Dislocations amplify attention Monero’s case is a clear example.
CoinMarketCap’s view metrics provide a valuable lens into investor psychology. Right now, that psychology is cautious, analytical, and defensive.
Final Takeaway
On January 22, 2026, CoinMarketCap trending data paints a picture of a market in evaluation mode.
Crypto is not being ignored. It is being examined closely.
When attention rises during drawdowns, it often signals preparation rather than panic. Investors are watching first, deciding later.
FAQs
1. What does “trending” mean on CoinMarketCap?
Trending refers to assets with the highest number of user views over a given period. It measures attention, not price performance.
2. Are trending coins always gaining in price?
No. Trending often increases during volatility or declines, when investors seek information.
3. Why are only large-cap coins trending right now?
During uncertain markets, users prioritize liquidity, longevity, and systemic relevance.
4. Why is Monero trending despite a sharp decline?
Large drawdowns in major assets typically trigger reassessment and research activity.
5. Does trending data predict future price moves?
No. It reflects interest, not direction.
6. Where does CoinMarketCap source its data?
CoinMarketCap aggregates price, volume, and user engagement data across major exchanges and platforms.
7. How should investors use trending data?
As a sentiment and attention indicator, not a trading signal.
The Shiba Inu price crashed to as low as $0.000007683 yesterday, sparking bearish sentiment towards the meme coin. This crash came on the back of a transfer of billions of SHIB tokens, which raised concerns of a potential sell-off by the whale in question.
Why The Shiba Inu Price Crashed
The Shiba Inu price crashed amid significant selling pressure, with a SHIB whale sending billions of tokens to Robinhood, likely to offload these tokens. Arkham data shows that the whale (0x2d0…9f7bB) first sent 210.365 billion SHIB tokens, worth $1.63 million, to the crypto exchange. These tokens represented about 97% of the whale’s SHIB holdings.
Further data from Arkham shows that the SHIB whale sent an additional 1.52 billion tokens to Robinhood and 7 billion tokens to liquidity provider B2C2 Group, which could be an OTC sale. The Shiba Inu price has notably crashed by over 7% in the last week, and it suffered its worst drop during this period yesterday amid the whale’s transfers. The whale now holds only 5.86 billion SHIB, worth $46,790.
The Shiba Inu price also crashed due to the sell-off in the broader crypto market, led by Bitcoin. BC dropped to as low as $87,000 yesterday amid concerns over trade tensions between the U.S. and Europe stemming from the Greenland-linked Trump tariffs. However, the market recovered towards the end of the day as Trump announced that he had canceled the proposed tariffs, having reached a Greenland deal with NATO.
Despite the recent Shiba Inu price crash, the meme coin is still up over 15% year-to-date (YTD) and ranks among the best-performing crypto assets this year. However, SHIb is still far off from its current all-time high (ATH) of $0.00008845.
Exchange Netflows For SHIB Remains Mixed
SHIB’s exchange netflows have remained mixed, indicating there is no clear accumulation pattern for the meme coin at the moment. CryptoQuant data shows that today’s net flows are negative, totaling just over 7 billion Shiba Inu tokens, suggesting that more coins are flowing into exchanges than out.
However, the total exchanges’ netflows yesterday were positive, at 1.6 billion tokens, indicating more tokens leaving exchanges, which is bullish for the Shiba Inu price as it hints at accumulation from whales. On January 16, SHIB’s netflows were also positive, totaling around 115 billion tokens. However, the positive netflows on that day were overshadowed by the negative flows of 214 billion SHIB recorded on January 20.
Crypto traders still remain bullish on the Shiba Inu price as CoinGlass data shows the long/short ratio is currently above 1. Derivatives trading volume has also jumped by over 20% while the open interest is up almost 3%.
At the time of writing, the Shiba Inu price is trading at around $0.000007978, up in the last 24 hours, according to data from CoinMarketCap.
Strategy continues to dominate as the largest Bitcoin treasury company. This time, the company has expanded its holdings, crossing 700,0000 BTC in the process, and currently holds over 3% of the total Bitcoin supply.
Strategy Now Holds 3.4% Of Bitcoin Supply As Holdings Top 700,000 BTC
Michael Saylor’s Strategy now holds approximately 3.4% of the total Bitcoin supply as the company increased its holdings to over 700,000. In a press release, the company revealed that it acquired 22,305 BTC for $2.13 billion at an average price of $95,284 per Bitcoin last week. It now holds 709,715 BTC, which it acquired for $53.92 billion at an average price of $75,979.
This purchase was Strategy’s largest weekly announcement since November 2024 and its fifth-largest announcement ever. It also came just a week after the company announced it had acquired 13,627 BTC for $1.25 billion. Meanwhile, this latest purchase has come amid a decline in BTC’s price.
Bitcoin dropped below $90,000 yesterday for the first time since the start of the year, dragging the Strategy stock with it. MSTR dropped as much as 8% yesterday, falling to around $160. The stock is still up over 3% year-to-date (YTD). However, it is worth noting that Saylor and his company continue to dilute MSTR shares to buy more Bitcoin. The company sold 10.4 million MSTR shares last week to fund most of this latest purchase.
Reactions To The Latest BTC Purchase
Market analyst Rob noted that Strategy no longer highlights BTC yield as a flagship metric. He further stated that even after buying over 35,000 BTC in the first few weeks of this year, the BTC yield achieved is 0.4%, which amounts to an annualized rate of about 6% to 10%. The analyst also remarked that the law of diminishing Bitcoin yield means the ability to deliver a yield decreases as the BTC stack grows.
With Strategy now holding over 700,000 BTC, Rob explained that it is harder to generate a return. According to him, this means that going forward, the play is more about squeezing the Bitcoin price itself higher rather than increasing the BTC per share. He added that this also explains why MSTR’s mNAV has collapsed to just over 1x.
Crypto commentator Ran Neuner warned that a company like Strategy buying and holding such a large concentration of a reserve asset is not healthy. He added that right now, Saylor and his company are the only ones really buying Bitcoin. Meanwhile, market expert Bit Paine said it is a market failure that Saylor is allowed to buy this much BTC at prices below $100,000.
At the time of writing, the BTC price is trading at around $90,000, down in the last 24 hours, according to data from CoinMarketCap.
Crypto analyst Dom has commented on the current XRP price action, revealing what the triple tap at $1.80 means for the altcoin. This comes as XRP sheds most of its gains from the start of the year amid the recent crypto market crash.
XRP Price Reaches Major Support With Triple Tap At $1.80
In an X post, Dom stated that there is a triple tap in the $1.80 zone, which is the last possible expression of a bottoming structure for the XRP price. The analyst warned that any further moves to the downside are likely to trigger a breakdown for the altcoin. He added that regaining $2.05 is the goal for bulls to put the chart back in a “safe zone.”
This analyst comes amid the XRP price crash below the psychological $2 level. The altcoin has crashed alongside the broader crypto market, losing most of its yearly gains in the process. This comes on the back of the latest Trump tariffs on eight European nations, which have sparked bearish sentiment in the market.
Commenting on the 30% rally for the XRP price earlier in the month, Dom reiterated that it was a weak move. He noted that the order flow analysis showed no strong buyer support and that the push was possible due to low liquidity. On-chain analytics platform Glassnode also recently commented on the current price action, noting that the current market structure for XRP closely resembles that of February 2022.
Glassnode stated that investors active over the 1-week to 1-month window are now accumulating below the cost basis of the 6-month to 12-month cohort. They added that as this structure persists, psychological pressure on top buyers continues to build over time.
XRP’s Structure Still Intact
In an X post, crypto analyst Egrag Crypto stated that the XRP price structure remains intact, with the upper resistance at between $3.40 and $3.60. Meanwhile, the lower support is between $1.85 and $1.95, and the price is currently near the range lows. The analyst also noted that the 21 EMA is sloping down and acting as resistance, with the price still below it, suggesting weak short-term momentum.
As for what could happen next, Egrag Crypto predicted a liquidity sweep rather than a confirmed breakdown in the XRP price. He explained that a wick below $1.85 is a normal liquidity behavior within a range. However, a weekly close below this level could signal structural failure and increase cycle risk.
Until that happens, Egrag Crypto noted that the XRP price is still ranging, holding structure, not broken, and not in macro failure. He added that his stance remains unchanged as he is still bullish and holding as long as the structure remains valid.
At the time of writing, the XRP price is trading at around $1.90, down over 3% in the last 24 hours, according to data from CoinMarketCap.
Bitcoin’s dominance over the broader crypto market has become the main reference point for traders trying to determine when an altcoin season will finally take shape. At the moment, Bitcoin still controls close to 60% of the total market, and this has so far kept any meaningful altcoin breakout at bay.
However, according to a Bitcoin analyst, history suggests that once this balance begins to shift, the transition into altcoin season tends to happen quickly, often playing out within a tight one-to-two-month timeframe.
Why Bitcoin Dominance Matters For Altcoin Season
In his analysis, the analyst explained that Bitcoin dominance, also known as BTC.D, is an important factor in determining when capital begins rotating into altcoins. BTC dominance measures Bitcoin’s share of the total crypto market capitalization, and declines in this metric have historically coincided with explosive altcoin rallies. At the time of writing, CoinMarketCap puts the Bitcoin dominance at 59%.
Looking back at 2017, the BTC.D chart shows Bitcoin’s dominance falling very quickly from around 96% in early March to about 60% by mid-May. That drop was the playout of one of the most aggressive altcoin rallies the market has ever seen.
A similar pattern played out in 2021, when BTC dominance fell from about 60% in early April to near 40% by mid-May. That move coincided with another powerful altcoin expansion, pushing Ethereum and several other major altcoins to new all-time highs. Many of those peaks, particularly among meme coins such as Dogecoin and Shiba Inu, are unbroken to this day.
The most important takeaway from both cycles, according to the analyst, is the speed of the move. In each case, it took just one to two months for a full-blown altcoin season to unfold once Bitcoin dominance began rolling over decisively.
BTC’s Next Move Could Decide Everything
The analyst notes that many investors underestimate how quickly this transition can happen. After waiting through multiple years of accumulation and consolidation, market participants often grow impatient just before the final stage. Historically, however, altcoin season has tended to play out very quickly once conditions align, not gradually over many months. Therefore, investors waiting for an altcoin season can still hold on for that move and not lose focus.
He also pointed to macro signals supporting a risk-on environment, referencing strength in assets such as small-cap equities, gold, and silver hitting all-time highs. These conditions are lining up for capital flowing into higher-beta assets once confidence returns.
Nonetheless, altcoins cannot sustain a true breakout without BTC first making a convincing move. If Bitcoin fails to push to a new all-time high, altcoins may see only short-lived relief rallies. On the other hand, a new Bitcoin all-time high could act as the deciding factor that brings retail traders back into the market and eventually leads to FOMO plus a breakout altcoin season.
Crypto pundit XRP Queen has described an XRP price target of $10 as being too low, claiming that this target was from a retail investor’s perspective. She also suggested how high the altcoin could go from an institutional standpoint.
Pundit Claims XRP Price Target Of $10 Is Too Low
In an X post, XRP Queen stated that people predicting XRP price targets of between $10 and $25 are still thinking of retail price targets. This came as she claimed that Ripple has been thinking about global infrastructures. The pundit highlighted the firm’s moves, including its acquisition of payment and custody infrastructure.
Furthermore, XRP Queen noted that Ripple has integrated with banks, funds, and institutions, which she claimed is positioning the altcoin for real-time global settlement. The pundit also believes that the crypto firm has secured regulatory clarity where it actually matters, which is bullish for the XRP price. Lastly, she mentioned that Ripple is actively pursuing a full banking license, having secured conditional approval from the Office of the Comptroller of the Currency (OCC).
XRP Queen declared that Ripple’s moves are how one builds financial plumbing. “Systems don’t move in pennies. They move in orders of magnitude. Lock in,” she added. Regarding how high the XRP price could rise based on institutional targets, XRP Queen suggested the altcoin could reach $100.
In an X post, she stated that people laugh at an XRP price target of $100 because they price it like a meme, but that institutions price the altcoin like infrastructure. As such, she believes the altcoin could reach these price targets based on its utility, especially as it gains traction as a token for real-time global settlement.
Canary Capital CEO Makes Bullish Case For XRP
In a YouTube video, crypto pundit Cheeky Crypto highlighted a statement from Canary Capital’s CEO, Steven McClurg, in which he said that an XRP price target of between $5 and $10 may sound like a lot to a retail trader. However, he believes that these price targets are a rounding error when one considers the trillions of dollars in liquidity required to settle global real-world assets (RWAs) at scale.
Cheeky Crypto also highlighted McClurg’s statement, in which he said the XRP Ledger is already processing real financial transactions and boasts real-world financial use cases, which he claims are drawing institutions’ attention.
Notably, the Canary Capital CEO had recently predicted that XRP would dominate the RWA industry, which is projected to become a trillion-dollar industry at some point. This could boost the altcoin’s utility as the XRP Ledger processes more RWA transactions, sending the XRP price higher in the process.
At the time of writing, the XRP price is trading at around $1.95, down in the last 24 hours, according to data from CoinMarketCap.
Crypto pundit Wimar has claimed that crypto exchanges are manipulating the Bitcoin price, causing it to crash from its 2026 high. This comes amid recent developments with the Trump tariffs, which have caused the flagship crypto to also decline.
Crypto Pundit Accuses Crypto Exchanges Of Manipulating Bitcoin Price
In an X post, Wimar asserted that crypto exchanges are manipulating the Bitcoin price. He noted how BTC just dumped from $95,500 to $91,900 with no news. The pundit claimed it is the same script, over and over again, as the flagship crypto rose from $89,000 to $95,000 and has now fallen to $91,000, just as it did when it rose from $85,000 to $88,000 and then fell to $84,000.
Wimar claimed that this is a liquidity hunt, alluding to the flows to prove that the Bitcoin price is manipulated. He noted that within minutes, Wintermute, Binance, Coinbase, and ETF-linked wallets were all active simultaneously. Large blocks were said to have moved from exchange to exchange, with huge market buys hitting thin books, and then, just as fast, these tokens were dumped.
The crypto pundit also highlighted Arkham data, noting that the flows tell the real story. Wimar claimed that coins move into exchanges right after the pump, which he stated is not a coincidence. The pundit further remarked that these crypto exchanges wait for a setup where liquidity is low, leverage is high, and funding is stretched.
Wimar asserted that these crypto exchanges run the same play every time, where they first pump the Bitcoin price fast on thin books to trigger FOMO and then liquidate shorts. Retail investors then see green candles and open long positions because the price action appears to be a breakout, but they fall into the trap, according to the pundit.
Wimar stated that once enough people are stuck in leverage, the coins hit crypto exchanges and selling starts, leading to a Bitcoin price crash. The pundit accused these exchanges of dumping into the demand they just created, forcing fresh longs to get liquidated and farming both long and short traders with no news.
BTC’s Current Price Action Isn’t Based On Headlines
Wimar doubled down on his accusation of crypto exchanges being responsible for the Bitcoin price crash, stating that BTC doesn’t move like this because of headlines. He claimed that it moves like because leverage piles up, and someone decides it is “payday.” As such, the pundit suggested that the Trump tariffs fears aren’t what is sparking this recent market crash.
Trump had announced fresh tariffs on France, the U.K., the Netherlands, Denmark, Germany, Sweden, Finland, and Norway over the weekend. The Bitcoin price had remained unchanged following the announcement, but began to crash following reports that the European Union (EU) was considering retaliatory tariffs.
At the time of writing, the Bitcoin price is trading at around $90,900, down over 2% in the last 24 hours, according to data from CoinMarketCap.
Featured image from Pixabay, chart from Tradingview.com
Crypto analyst ChartNerd has raised the possibility of the XRP price recording another 30% surge from its current level. This comes even as the altcoin risks erasing its year-to-date (YTD) gains due to the recent crypto market crash.
How The XRP Price Could Rally To $2.70
In an X post, ChartNerd stated that a potential XRP price rally to $2.70 is a possibility in the near term if the altcoin can hold the Fib support targets and mark a higher low. He highlighted three Fib support levels, including the 0.5 at $2, 0.618 at $1.99, and 0.786 at $1.89. He noted that the $2.70 was the base of the descending triangle, around the area where XRP broke down from following the October 10 crypto crash last year.
ChartNerd also explained that the XRP price was currently in a falling wedge breakout pattern and that this typically leads to rallies as high as where the coin had broken down. As such, in this case, XRP could reach the descending triangle resistance at $2.70. The crypto analyst had also highlighted bullish fundamentals that could drive the rally toward this target. This includes Ripple’s alleged ties to South Korea’s tokenized infrastructure and projected major expansion for XRP.
However, it is worth mentioning that the XRP price is also at risk of a further decline amid the latest crypto market crash, led by Bitcoin. BTC has dropped to as low as $92,000 in the last 24 hours, forcing XRP to crash below the psychological $2 level. This crash has occurred on the back of the latest Trump tariffs on some European nations over the U.S. proposed takeover of Greenland. The EU is weighing retaliatory tariffs, which could escalate this into another full-blown trade war.
The Crash Could Be A “Blessing In Disguise”
In another X post, ChartNerd suggested that the recent XRP price crash could be a blessing in disguise. This came as the analyst alluded to the $1.80 liquidity pocket on the monthly heatmap. He noted that this latest drawdown has swept the altcoin into that exact sell-side liquidity, a move which ChartNerd described as a clarity response.
ChartNerd also suggested that the XRP price is likely a minor setback rather than a major retracement. He noted that although altcoins are taking hefty hits, Bitcoin hasn’t lost any key structure and that all he sees is “opportunity” until the trendline is invalidated. As such, XRP could see a bounce if BTC successfully defends this trendline.
At the time of writing, the XRP price is trading at around $1.96, down over 4% in the last 24 hours, according to data from CoinMarketCap.
Canary Capital’s CEO, Steven McClurg, has predicted that XRP will be the leading token in real-world assets (RWAs), which is projected to be a trillion-dollar sector. This came as he highlighted recent developments that put the altcoin on course to dominate the industry.
Canary Capital CEO Predicts XRP Will Dominate RWAs
During an interview, the investment manager opined that XRP will be the leading token for real-world assets, based on Ripple’s moves over the last two years. He noted that the crypto firm has done a great job of integrating the XRP Ledger (XRPL) into many transactions and into Wall Street, which has led to institutional adoption.
The Canary Capital CEO further noted that the XRP Ledger is moving assets such as stablecoins, including Ripple’s RLUSD stablecoin, and other tokenized real-world assets. Notably, Ondo Finance has also tokenized its U.S. treasury fund (OUSG) on the XRPL, while Ripple has partnered with Securitize to add RLUSD access for BlackRock’s BUIDL fund.
Furthermore, Ripple partnered with Archax and UK-based asset manager abrdn to introduce the first tokenized money market fund on the XRP Ledger. There are also plans for the network to get a tokenized gold upgrade, even as demand for precious metals rises. It is also worth noting that Ripple has previously predicted that the XRP Ledger could dominate the real-world assets industry, putting XRP at the heart of the industry, as McClurg has also predicted.
Interestingly, McClurg’s prediction comes as the XRP ETFs draw institutional investors into the altcoin’s ecosystem. These ETFs have been a success since their launch, recording only one net outflow since November. Coincidentally, McClurg’s Canary Capital is currently the largest XRP ETF issuer, with $374 million in total net assets, according to SoSoValue data.
New Features To Onboard TradFi Onto The XRPL
Ripple and XRP Ledger developers continue to work on introducing new features on the network to attract traditional finance (TradFi) institutions. XRPL validator Vet recently revealed that compliance features for TradFi are coming to the network. This includes on-chain compliance tools such as KYC, AML, and other credentials, which will be used by lending protocols, as well as the XRPL DEX and the Permissioned DEX.
Meanwhile, Ripple developers also described Permissioned Domains, which are part of the amendments, as a game-changer for the XRP Ledger because they will bring institutional-grade controls to a public network, without sacrificing the trade-offs of a private chain. The developers further noted that this will set the stage for financial institutions to engage in permissioned flows on a fast, scalable, and resilient blockchain network such as the XRPL.
At the time of writing, the XRP price is trading at around $2.06, down in the last 24 hours, according to data from CoinMarketCap.
Is Bitcoin headed back into the $60Ks — and does that mean the four-year cycle is broken? 🤔Stephen McClurg, CEO of Canary Capital, explains why Bitcoin coul...
The Dogecoin Relative Strength Index (RSI) is said to have entered historical oversold levels. This has raised the possibility that the foremost meme coin could repeat its parabolic rally in the 2021 bull cycle.
Dogecoin Eyes Parabolic Rally As RSI Enters Oversold Levels
Crypto analyst Cryptollica has indicated that the Dogecoin price could record another parabolic rally as the RSI enters oversold levels. In an X post, the analyst noted that this is the fourth time in 12 years that the DOGE RSI has been this oversold, and that every time this has happened, it has been life-changing.
Cryptollica further remarked that the drop in Dogecoin’s RSI to this low has always been an “epic buying opportunity” and that those who loaded up made insane gains. In line with this, the analyst remarked that this is another massive opportunity. Meanwhile, Cryptollica alluded to previous times when the RSI dropped this low, including during the last cycle bottom, when DOGE dropped to $0.5.
Dogecoin rallied to a new all-time high (ATH) of $0.74 after bottoming at $0.05, recording massive gains in the process. Cryptollica noted that these setups don’t come often and urged market participants not to miss this one. His accompanying chart suggested that DOGE could rally to the psychological $1 level this time around, marking a new ATH for the foremost meme coin.
DOGE Mirroring Past Accumulation Pattern
In another X post, Cryptollica highlighted a similar DOGE/BTC pattern between the 2014-2017 and 2021-2026 accumulations. The analyst stated that the structure is identical and assured that the bleed against Bitcoin is not “death” but the necessary energy compression before the rotation. Cryptollica added that when the green line breaks, risk appetite changes instantly.
Meanwhile, Cryptollica declared that the fractal was loading, with Dogecoin set to be the heartbeat of the altcoin cycle. The analyst claimed that this is the final stage of a multi-year compression against Bitcoin. This historically leads to a specific volatility squeeze that precedes a massive capital rotation from BTC to altcoins.
Crypto analyst Bitcoinsensus raised the possibility of a Dogecoin rally to $0.70, which could be near. This came as the analyst noted that DOGE has been moving in a nice way up throughout this entire bull cycle. This is said to be evident in the mini cycles, with the foremost meme coin tapping the dotted line, followed by a slow retrace. Based on this pattern, Bitcoinensus noted that DOGE could soon target the $0.70 range if the strong momentum in the crypto market returns.
At the time of writing, the Dogecoin price is trading at around $0.137, down in the last 24 hours, according to data from CoinMarketCap.
Crypto analyst TARA has predicted that the Bitcoin price will still rally despite bearish signals that have surfaced. She highlighted why the flagship crypto could reach this level and what could happen once it touches the price target.
Analyst Predicts Bitcoin Price Surge To $99,000
In an X post, TARA opined that the Bitcoin price will reach $99,300, even though the flagship crypto is printing a bearish candlestick. She stated that BTC wants to touch this price target before it retraces deeper so that the correction does not break the critical support at $90,000. The analyst added that retracement levels for BTC will continue to be adjusted, with the new 2026 high above $97,000, while revealing subwaves on the way to the full target at $103,000.
Notably, crypto traders are currently betting on the Bitcoin price rallying past the $99,000 level and reaching the psychological $100,000 level. Polymarket data shows a 48% chance that BTC will rally to $100,000 this month. This follows the flagship crypto’s recent rally from around $92,000 to above $97,000 following the release of the soft CPI inflation data earlier this week.
The spot Bitcoin ETFs have also contributed to the Bitcoin price surge to start the year. In an X post, Bloomberg analyst Eric Balchunas highlighted that ETFs recorded net inflows of $843 million on January 14 and now boast 1-week net inflows of $1 billion and $1.5 billion year-to-date (YTD). With BTC rallying to $97,000 after trading sideways towards the end of last year, Balchunas opined that the buyers may have exhausted the sellers.
Arthur Hayes Predicts Bitcoin Rally On Rising Liquidity
In his latest blog post, BitMEX co-founder Arthur Hayes predicted that the Bitcoin price could sustain this rally as dollar liquidity rapidly increases. Hayes expects dollar liquidity to increase as U.S. President Donald Trump finds more ways to inject liquidity into the economy. The BitMEX co-founder highlighted how Trump plans to lower mortgage rates, which could cause Americans to borrow more.
Hayes also mentioned that the liquidity in 2025 didn’t support crypto portfolios, which is why the Bitcoin price underperformed. He urged market participants not to draw wrong conclusions from the 2025 underperformance, as it was always a liquidity story rather than a cyclical bear market, as some analysts suggested.
More liquidity could also flow into the market as Trump nominates a rate-cut advocate to replace Fed Chair Jerome Powell. This could lead to larger rate cuts, which would be bullish for the Bitcoin price and the broader crypto market.
At the time of writing, the Bitcoin price is trading at around $95,300, down in the last 24 hours, according to data from CoinMarketCap.
Crypto analyst Trader Tardigrade has revealed that the Dogecoin price is following a bullish signal, which could lead to a rally above the $0.15 level. This comes as the crypto market rebounds, with Bitcoin rallying to a new yearly above $97,000.
Dogecoin Price Eyes Rally Above $0.15 With This Bullish Signal
In an X post, Trader Tardigrade hinted that the Dogecoin price could rally above $0.15 after rebounding from the Kumo support, which was exactly what the bullish signal flagged. The rebound comes amid the broader crypto market rally, with major crypto assets also recording significant gains as Bitcoin rallies above $97,000, with the psychological $100,000 level now in sight.
In another X post, Trader Tardigrade revealed that the Dogecoin price has formed a bull flag on the weekly chart and is now targeting the $0.195 price level. This will bring the leading meme coin close to the psychological $0.2 level, with a break above it paving the way for new local highs.
Crypto analyst Crypto Tony highlighted the $0.154 level as being critical for the next leg up for the Dogecoin price. His accompanying chart showed that reclaiming this level would spark a rally above $0.16. One factor that could contribute to this bullish run for the foremost meme coin is renewed inflows into the Dogecoin ETFs.
SoSoValue data shows that these Dogecoin ETFs still recorded zero flows on January 14 despite the rebound in the Dogecoin price. However, this could change soon, as these funds notably saw increased demand at the start of the year, when DOGE rallied to as high as $0.15, making it one of the best-performing crypto assets among the top 10 coins by market cap.
What’s Next For DOGE As It Targets New Highs
In an X post, crypto analyst Kevin Capital stated that a successful retest followed by a new local high will be further evidence that the corrective phase for the Dogecoin price has ended. This came as he noted that DOGE, like BTC and many other altcoins, has since come back and successfully tested its key 4-hour MAs after breaking out of them, attempting to end its major corrective phase. The analyst added that a new high would be a break of $0.157.
Meanwhile, crypto analyst Bitcoinsensus has suggested that the Dogecoin price could rally to as high as $4.5 if DOGE is repeating its macro cycle pattern. The analyst noted that so far this cycle, the meme coin has maintained its ground and has mainly been moving sideways. As such, it remains to be seen if this cycle can be as explosive as the last ones.
At the time of writing, the Dogecoin price is trading at around $0.143, down in the last 24 hours, according to data from CoinMarketCap.
The crypto market was left in awe as the price of Bitcoin experienced a sudden surge, bringing the flagship asset dangerously close to the $100,000 mark. With the recent bounce, hopes for a retest of the current all-time high and beyond have reemerged. However, a crucial supply cluster continues to stand in the way.
A Fresh All-Time High Beckons For Bitcoin
Bitcoin’s price is gaining sharp upward traction as it retests the $98,000 price mark on Wednesday, a level last seen in November 2025. On-chain data shows that the crypto king is once again edging toward uncharted territory, with market structure pointing to a clear path toward a new all-time high.
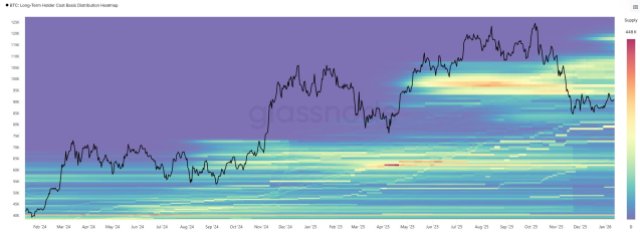
However, there is a significant barrier between present levels and price discovery: a dense supply cluster created by investors who have previously made purchases in the same range. This range was highlighted by Glassnode, a leading on-chain data platform, after examining the BTC Long-Term Holder Cost Basis Distribution Heatmap.
Data from the key metric shows a dense cost-basis cluster between the $93,000 and $109,000 price range, which is forming a substantial overhead supply zone. The supply zone serves as a technical and psychological barrier where a large number of holders may be waiting to take profits or quit at breakeven, resulting in concentrated resistance.
At this level, any sustained push higher must first absorb this supply, with a decisive breakout above the range. If Bitcoin is able to absorb this overhead supply and push through it decisively, momentum could pick up pace quickly. Glassnode noted that this crucial range is usually expected to reopen the path toward a new all-time high for Bitcoin over the longer term.
According to Glassnode in another post, BTC has ushered in the new year with constructive momentum, printing two higher highs and extending its value toward the $98,000 price level. However, the platform stated that the leg up currently runs directly into a historically supply zone.
BTC Market Is Displaying Deleveraging Signals
Looking at Bitcoin’s current action from an on-chain perspective, the flagship asset is starting to show signs of deleveraging. This deleveraging indicates that excess speculation is being removed from the market after a period of high leverage and aggressive positioning.
Coin Bureau’s report shared on X points to a sharp decline in BTC Open Interest (OI) from $15 billion in October to $10 billion today, as leveraged traders get flushed out. The drop represents an over 30% decrease within the period.
Interestingly, these deleveraging phases have often preceded major market bottoms, making this a critical moment for BTC. Nonetheless, should BTC continue to fall, more leverage is expected to still get wiped out.
At the time of writing, the Bitcoin price was trading at $96,247, demonstrating a 1.29% increase in the last 24 hours. Data from CoinMarketCap shows that trading volume is down despite the bullish price action, dropping by more than 3% in the past day.
Crypto pundit X Finance Bull has alleged that the Bank of America (BofA) is running tests for cross-border payments using Ripple-linked XRP. This follows an earlier statement from Ripple’s President, Monica Long, about the bank and the potential adoption of crypto.
Crypto Pundit Alleges That Bank of America Is Using Ripple’s XRP
In an X post, X Finance Bull claimed that the Bank of America is already running tests with Ripple and that cross-border payments are being rewritten. He added that Ripple provides the technology, the bank runs the tests, and the U.S. ensures legality. In line with this, he remarked that XRP is becoming the core financial plumbing.
In a video shared by crypto pundit Xaif last year, Ripple President Monica Long had mentioned that Bank of America was one of their early partners when they were developing the messaging software online payment solution. However, she didn’t say whether the partnership still exists till now.
Bank of America notably filed a patent for real-time net settlement using a distributed ledger system, which appeared to be based on Ripple’s payment network. This plan has since been abandoned as the bank never moved forward with the application. The bank has, however, opened up to crypto as it now allows its wealth clients to allocate up to 4% to crypto. The bank is also exploring issuing its stablecoin, which could make it a direct competitor to Ripple.
Meanwhile, Long also mentioned how several banks had contacted Ripple for payments and custody services after Donald Trump won the U.S. presidential elections. Ripple’s CEO, Brad Garlinghouse, had also previously mentioned that they secured more partnerships following Trump’s victory, as the U.S. president paved the way for a more regulatory-friendly environment.
Ripple’s Major Existing Banking Partners
Ripple has notably secured partnerships with other major banking institutions in recent times, as several nations provide a more regulatory-friendly environment. The crypto firm has partnered with Bank of New York Mellon (BNY), which is the largest custodian. The bank serves as the primary reserve custodian of Ripple’s RLUSD stablecoin.
Furthermore, Ripple recently announced that its Ripple Prime is an early adopter of BNY’s tokenized deposit services for institutional clients. These tokenized deposits operate on the bank’s private blockchain and don’t involve the XRP Ledger or XRP. Other major banks such as AMINA Bank, Absa, and SBI have also partnered with Ripple.
AMINA recently became the first European bank to integrate Ripple payments into its operations. SBI has also adopted Ripple payments. Meanwhile, the crypto firm provides custody services to Absa, one of South Africa’s largest banks.
At the time of writing, the XRP price is trading at around $2.10, down over 3% in the last 24 hours, according to data from CoinMarketCap.
Famous legal expert Bill Morgan has highlighted how Ripple was unable to promote XRP over the past few years due to its former legal battle against the U.S. Securities and Exchange Commission (SEC).
Why Ripple Was Unable To Promote XRP In The Past
In an X post, Bill Morgan stated that Ripple could not promote XRP or the XRP Ledger in the past for fear of being sued by the SEC for promoting and offering an unregistered security. He noted that despite that, the company was still sued by the regulator. The lawyer’s response followed XRPL stakeholder Wietse’s comments about how the XRPL has a track record of regularly being too early and also being too late.
Wietse made this comment after XRP community member Crypto Eri pointed out that the XRP Ledger has supported tokenized gold since, though it hasn’t received enough publicity. Wietse added that the network is too early for people to notice and realize how great certain things are, and too late for others, causing too little, too late catch-up.
However, Bill Morgan believes that XRP and XRP Ledger would have gotten more publicity if Ripple had been able to actively promote the altcoin in the past. He noted that during the SEC lawsuit, the crypto firm barely mentioned XRP. Meanwhile, the lawyer noted that Bitcoin, Ethereum, and other cryptos were promoted with impunity and that former SEC official Bill Hinman effectively promoted ETH while in office.
The lawyer added that, to this day, Ripple’s promotion of XRP and the XRP Ledger remains muted. He stated that the company does it by stealth under the cover of acquisitions and RLUSD. Morgan believes that this is nothing compared to how Michael Saylor actively talks about and promotes Bitcoin.
XRP Is Still At The Centre Of Ripple’s Vision
Ripple has, in recent times, reiterated that XRP is at the centre of its vision. In his New Year’s message, the firm’s CEO, Brad Garlinghouse, stated that the altcoin has been and will continue to be the heartbeat of that vision. This came as he noted that their two major acquisitions last year, Ripple Prime and GTreasury, will greatly accelerate and expand their ability to deliver on their vision, which is to enable the Internet of Value.
He added that building and using crypto infrastructure, updating their global financial plumbing, and rethinking legacy systems don’t happen overnight. As such, they will continue to take the long view of what crypto-based assets such as XRP and RLUSD can do rather than chasing cycles and hype.
At the time of writing, the XRP price is trading at around $2.16, up over 5% in the last 24 hours, according to data from CoinMarketCap.
Crypto analyst Morja has revealed his PEPE price prediction, alluding to the level the meme coin must hold to sustain its bullish momentum. Another crypto analyst painted a scenario in which the meme coin replicates the parabolic run it recorded in 2023.
PEPE Price Could Sustain Bullish Momentum If It Holds This Level
In an X post, Morja stated that a weekly candle close above the red level at $0.000005853 for the PEPE price would confirm a successful retest and reinforce the bullish movement. He further remarked that as long as the price holds above this level, upside continuation remains favored.
However, the analyst warned that on the way toward $0.000010867, a key resistance is located around $0.0000083, which may act as a significant reaction zone before any further upside continuation. Meanwhile, crypto analyst StudyE has painted a scenario in which the PEPE price goes parabolic, replicating its historic 2023 run.
The crypto analyst stated that this would happen if the PEPE price pumps into the January 15 to February 15 window. He further explained that the meme coin needs to be at the unfinished monthly candle in that time window in order to invalidate this. An invalidation would send PEPE higher first, and then the bottom would be in. If that doesn’t happen, it may have one more hurdle to overcome.
StudyE stated that no matter the path the PEPE price takes, it would lead to the same outcome and timeframe. Based on this, he declared that the fourth quarter of this year will be parabolic, regardless of what happens. It is worth mentioning that PEPE has been one of the best-performing crypto assets to start the new year, with the meme coin up over 30% year-to-date (YTD).
PEPE Eyes Rally To $0.00000728 In The Short Term
Crypto analyst CryptoLinx has predicted that the PEPE price could rally to $0.00000728 in the short term. The analyst noted that PEPE is breaking out of the downward channel right now and that the target for this pattern is a move back to the previous high. This is a level that the meme coin had reached at the beginning of the year, when it rallied by as much as 80%.
In the long term, crypto analyst Eco Nomad stated that the PEPE price will rally to $0.00001, which is the midpoint of the Gaussian channel. If the meme coin breaks that level, he is confident that it could trade within the 4 zeros, having deleted one zero in the process.
At the time of writing, the PEPE price is trading at around $0.000006670, up almost 14% in the last 24 hours, according to data from CoinMarketCap.
The broader crypto market is seeing an unexpected uptick, with the Bitcoin, Ethereum, and Dogecoin prices among the top coins recording gains. This sharp increase in value follows the release of US economic data, which indicates positive trends in unemployment and consumer spending. Additionally, potential regulatory changes stemming from a proposed bill are also fueling market momentum and boosting investor confidence across the sector.
Bitcoin, Ethereum, And Dogecoin Prices Rally Amid Positive Economic Data
After consolidating for days following their last rebounds, Bitcoin, Ethereum, and Dogecoin are surging again amid a series of recent US data reports. The US Bureau of Labor Statistics (BLS) released the Consumer Price Index (CPI) for all urban consumers earlier on Tuesday, January 13, covering December 2025.
The CPI report revealed that prices rose 0.3% on a seasonally adjusted basis last month, with the year-over-year all items index up 2.7% unadjustment. The shelter index increased 0.4% in December, making it the largest contributor to the overall rise. Meanwhile, food prices rose 0.7% both at home and away, and energy rose 0.3%. This increase in CPI data tends to affect cryptocurrency price movements, as moderate inflation often reduces fears of aggressive rate hikes by the US Federal Reserve (FED), encouraging investors to allocate funds to alternative stores of value like BTC and higher risk assets like ETH and DOGE.
In addition to the CPI data, the US jobs report, released on January 9, showed that 50,000 jobs were added in December 2025. Although this was below the revised 56,000 in November and lower than the initial forecast of 60,000, it was still a significant and positive result for investors. While changes in job reports do not directly affect cryptocurrency price action, they can influence investor sentiment by increasing the likelihood of an interest rate cut.
The crypto market has also been bullish ahead of the US Senate Banking Committee’s vote on the CLARITY Act on January 15, 2026. If passed, the bill is expected to provide clearer legal frameworks for digital assets in the US. Subsequently, the regulatory progress will reduce uncertainty and encourage more institutional participation in the crypto market.
Overall, the combination of the US CPI release, jobs report, and potential regulatory clarity is what’s driving the market. Traders are responding favorably to these developments, reflecting renewed optimism.
How Much BTC, ETH, And DOGE Rose Today
Fueled by positive economic data, Bitcoin’s price has increased by over 3% so far today, rising from around $91,000 to over $94,000 at the time of writing. CoinMarketCap data also shows that Ethereum has seen even stronger gains, surging more than 6% to trade above $3,300. Meanwhile, Dogecoin has risen by over 6%, reaching $0.148.