Reading view

There are new articles available, click to refresh the page.

Can Bitcoin Revisit $97,600? Glassnode Says Watch This

Bitcoin’s push to $97,600 last week drew a burst of bullish options activity, but Glassnode argues the derivatives tape looked more like short-dated positioning than broad-based conviction. In a Jan. 23 thread, the on-chain analytics firm pointed to a split between front-end call demand and longer-dated risk pricing that stayed anchored in downside protection.

“Let’s deep dive into options market behavior during last week’s move to 97.6K, and how options metrics help gauge conviction behind the move,” Glassnode wrote. The core takeaway: upside flow showed up, but it didn’t meaningfully change how the market priced risk further out the curve.

What Bitcoin Traders Can Learn From Last Week’s Rally

Glassnode first focused on near-term skew. Around mid-January, BTC rose roughly 8% over a few days, and the 1-week 25-delta skew moved sharply toward neutral from “deep put territory.” That kind of front-end shift can look like a market flipping bullish—until you check whether the same repricing is happening in longer expiries.

“Careful though,” Glassnode warned. “Near-dated call demand is often misread as directional conviction.” The thread paired that point with flow data: the options volume put/call ratio dropped from 1 to 0.4, signaling a surge in call activity. But, as Glassnode framed it, the question is not whether calls were bought, but how short-dated that demand actually was.

The longer-dated picture was notably less enthusiastic. Glassnode said the 1-month 25-delta skew “only moved from 7% to 4% at the low,” staying in put asymmetry even as the 1-week skew fell from 8% to 1%. On the 3-month 25-delta skew, the shift was even smaller (less than 1.5%) and it “stayed firmly in put territory,” continuing to price asymmetric downside.

For Glassnode, that divergence matters because it separates “flow” from “risk pricing.” Upside participation can be real, but if the market does not reprice skew across maturities, it suggests traders are not extending that optimism into a higher-conviction, longer-horizon view.

The volatility tape reinforced the same message. “Layering in ATM implied volatility, we see vol being sold as price moved higher,” Glassnode wrote. “Gamma sellers monetized the rally. This is not the volatility behavior typically associated with sustained breakouts.”

That combination: front-end call demand alongside vol supply can align with tactical positioning rather than a regime change. It can also leave spot moves more vulnerable if follow-through buying does not materialize once short-dated structures roll off.

Glassnode closed with a checklist for what a cleaner breakout would look like: “An ideal breakout setup combines spot pressing key levels, skew pointing higher with conviction across maturities, and volatility being bid. Last week’s move didn’t meet those conditions.”

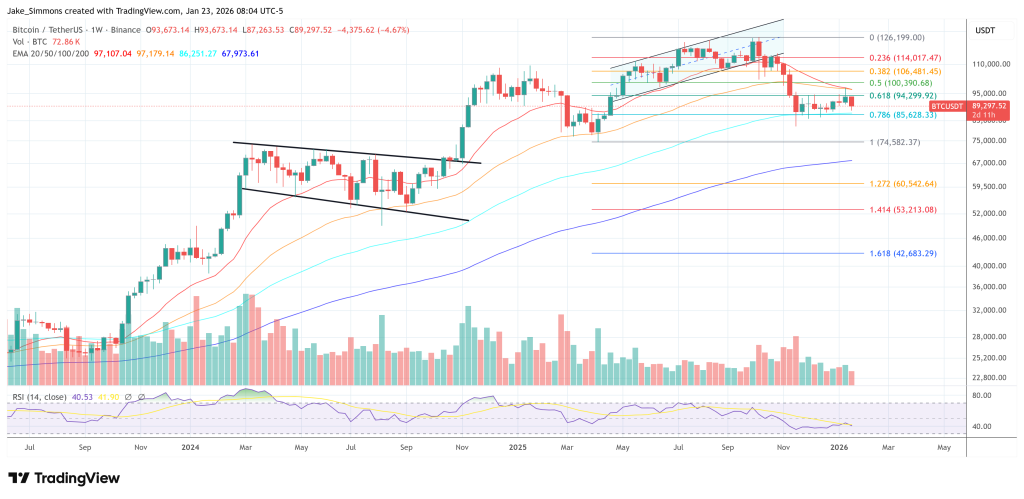
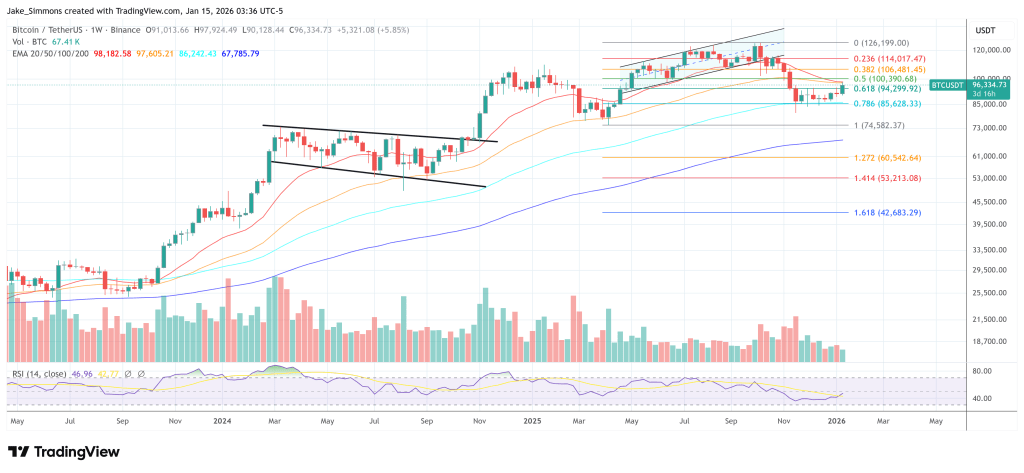
For traders watching whether BTC can revisit $97,600, the thread’s implication is straightforward: monitor whether longer-dated skew begins to lift out of put territory and whether implied volatility starts to get bid, not sold, as spot tests key levels again.

At press time, BTC traded at $89,297.

Bitcoin price chart

Here’s Why The Bitcoin, Ethereum, And Solana Prices Are Still Crashing Hard

Crypto researcher Axel has provided insights into why the Bitcoin, Ethereum, and Solana prices are still crashing. This comes as BTC continues to see a supply overhang, which threatens to put more downward pressure on crypto prices. 

Why The Bitcoin, Ethereum, and Solana Prices Are Still Crashing

In a research report, Axel noted that anomalous exchange inflows accompanied the BTC breakdown below the $90,000 zone as sellers prepared in advance. The market is also still at risk of further selling pressure as the 1.0 level of the short-term holders’ SOPR is now acting as a resistance rather than support. As such, there is a possibility that Bitcoin, Ethereum, and Solana prices will decline further. 

Further commenting on Bitcoin netflows into exchanges, Axel noted that between January 20 and 21, almost 17,000 BTC flowed into exchanges, coinciding with BTC dropping to as low as $87,000, while Ethereum and Solana prices also dropped. The crypto researcher explained that these anomalously high values followed a period of predominantly negative netflow in the first half of this month. 

Bitcoin

In the context of the falling Bitcoin price, Axel stated that such a spike is more likely to reflect supply preparation than neutral transfers. In other words, the breakdown below $90,000 appears to be structural rather than emotional. Meanwhile, Bitcoin netflow returned to neutral levels yesterday, but the accumulated inflow still creates a supply overhang, which could lead to further declines in the prices of Bitcoin, Ethereum, and Solana. 

Axel noted that a signal of improvement would be if netflow turns negative again amid rising prices, which could indicate that the overhang has cleared. However, with the short-term holders’ 7-day SMA SOPR below 0.996, the crypto researcher suggested that BTC faces increased selling pressure on every recovery as these holders look to sell at breakeven. He added that a reversal trigger could be confirmed if the SOPR breaks above 1.0 from below, with the 7-day SMA holding unity for three to five days to filter out false spikes after the selloff. 

Why A Break Above $100,000 Looks Unlikely For Now

In its latest research report, on-chain analytics platform Glassnode explained that a Bitcoin rally above $100,000 looks unlikely for now as the supply overhang persists. They noted how this overhang supply above $98,000 remains the dominant sell-side force capping short to mid-term rebounds. 

Alluding to the Unspent Realized Price Distribution metric, Glassnode noted that the recent BTC rally has partially filled the prior air gap between $93,000 and $98,000, driven by redistribution from top buyers into newer market participants. 

However, the unresolved supply overhang is expected to likely cap attempts above the $98,400 short-term holders’ cost basis and the $100,000 level. A meaningful and sustained acceleration in demand momentum is said to be required for a clean breakout above $100,000 to occur.

Bitcoin

Bitcoin Supply Overhang Likely To Cap Rallies Above $98,400, Glassnode Says

On-chain analytics firm Glassnode has pointed out in a new report how Bitcoin is facing supply overhang beyond the $98,000 region.

Bitcoin Could Find Resistance Beyond $98,000

In its latest weekly report, Glassnode has discussed about how the recent Bitcoin rally stalled near the Realized Price of the short-term holders (STHs). The “Realized Price” is an on-chain metric that tracks the cost basis of the average investor or address on the BTC network.

The STH Realized specifically measures the average acquisition level of traders who purchased within the past 155 days. As the below chart shows, this indicator is located at $98,400 right now.

Bitcoin STH Realized Price

This level is around where the recent recovery run hit an obstacle, potentially due to selling from underwater recent buyers who used the rally to exit near their break-even mark.

Glassnode explained:

The recent rejection near the Short-Term Holder cost basis at ~$98.4k mirrors the market structure observed in Q1 2022, where repeated failures to reclaim recent buyers’ cost basis prolonged consolidation.

The STH Realized Price provides a look at the average break-even level of a broad section of the market. For a more granular look, another indicator called the UTXO Realized Price Distribution (URPD) exists.

Bitcoin URPD

From the chart of the Bitcoin URPD, it’s visible that a notable amount of the STH supply has a cost basis between the current level and $98,000 (colored in blue). This supply represents the tokens that were redistributed by top buyers into newer market participants during the price rally.

Not all top buyers sold, however, as it’s apparent in the graph that at levels around and above $100,000, the long-term holder (LTH) supply is becoming a notable force (shaded in red).

Coins count under the LTH cohort once they mature past the 155-day age bracket. The fact that LTH supply is building up at these levels suggests some bull market entrants are willing to hold.

The analytics firm noted:

This unresolved supply overhang remains a persistent source of sell pressure, likely to cap attempts above the $98.4k STH cost basis and the $100k level. A clean breakout would therefore require a meaningful and sustained acceleration in demand momentum.

It now remains to be seen how Bitcoin’s upcoming price action would look, particularly in the context that major supply clusters are still sitting underwater.

BTC Price

Bitcoin has been following a downward trajectory since its rejection from the STH Realized Price as its value is now trading around $89,100.

Bitcoin Price Chart

Bitcoin Bottoming Phase Was Driven By Large Entities, Glassnode Data Shows

On-chain analytics firm Glassnode has pointed out how large entities drove Bitcoin accumulation during the November-December bottoming phase.

Large Entities Accumulated BTC, While Smaller Investors Sold

In a new post on X, Glassnode has talked about the recent Bitcoin investor behavior. “During the November–December bottoming phase, supply accumulation was primarily driven by larger entities, while smaller cohorts were distributing,” noted Glassnode.

To showcase the trend, the analytics firm has cited the Accumulation Trend Score, an on-chain indicator that tells us about whether BTC addresses are accumulating or distributing. The indicator uses two factors to calculate its value: the balance changes happening in the wallets of the investors and the size of the wallets themselves. This means that larger entities have a stronger influence on the metric.

When the value of the Accumulation Trend Score is greater than 0.5, it means large entities (or alternatively, a large number of small entities) are accumulating. The closer is the indicator to 1.0, the stronger is this behavior. On the other hand, the metric being under the threshold implies that distribution is the dominant behavior among investors. The zero level acts as the extreme point for this side of the scale.

The Accumulation Trend Score can also be separately calculated for specific Bitcoin segments to get a more granular view of behavior. Below is the chart shared by Glassnode, doing exactly this for the various BTC investor groups.

Bitcoin Accumulation Trend Score

As is visible in the graph, the Bitcoin Accumulation Trend Score was close to a value of 1.0 for 10,000+ BTC investors during the bottoming period that followed the price crash in November. The investors in this wallet range are often dubbed as “mega whales,” corresponding to the largest of entities on the network.

The normal whales, holding coins in the 1,000 to 10,000 BTC range, started accumulating a bit later, as their Accumulation Trend Score turned blue in December. The whales have since maintained net buying, but the mega whales switched to a neutral behavior around mid-December.

Interestingly, while the whales have been showing accumulation, the same hasn’t been true for the smaller investor groups. All cohorts carrying less than 1,000 BTC have displayed varying degrees of distribution during the last few weeks, with the 1 to 10 coins group in particular showing a near-perfect selling behavior.

“This divergence appears to be driven in part by exchange-related wallet reshuffling, and also by large holders buying the dip,” explained the analytics firm. It now remains to be seen how long the distribution from smaller Bitcoin entities will continue.

BTC Price

Bitcoin has been falling since the week started as its price is now trading around $88,900.

Bitcoin Price Chart

What the Triple-Tap At $1.80 Means For The XRP Price

Crypto analyst Dom has commented on the current XRP price action, revealing what the triple tap at $1.80 means for the altcoin. This comes as XRP sheds most of its gains from the start of the year amid the recent crypto market crash

XRP Price Reaches Major Support With Triple Tap At $1.80

In an X post, Dom stated that there is a triple tap in the $1.80 zone, which is the last possible expression of a bottoming structure for the XRP price. The analyst warned that any further moves to the downside are likely to trigger a breakdown for the altcoin. He added that regaining $2.05 is the goal for bulls to put the chart back in a “safe zone.”

This analyst comes amid the XRP price crash below the psychological $2 level. The altcoin has crashed alongside the broader crypto market, losing most of its yearly gains in the process. This comes on the back of the latest Trump tariffs on eight European nations, which have sparked bearish sentiment in the market. 

XRP

Commenting on the 30% rally for the XRP price earlier in the month, Dom reiterated that it was a weak move. He noted that the order flow analysis showed no strong buyer support and that the push was possible due to low liquidity. On-chain analytics platform Glassnode also recently commented on the current price action, noting that the current market structure for XRP closely resembles that of February 2022. 

Glassnode stated that investors active over the 1-week to 1-month window are now accumulating below the cost basis of the 6-month to 12-month cohort. They added that as this structure persists, psychological pressure on top buyers continues to build over time. 

XRP’s Structure Still Intact 

In an X post, crypto analyst Egrag Crypto stated that the XRP price structure remains intact, with the upper resistance at between $3.40 and $3.60. Meanwhile, the lower support is between $1.85 and $1.95, and the price is currently near the range lows. The analyst also noted that the 21 EMA is sloping down and acting as resistance, with the price still below it, suggesting weak short-term momentum. 

As for what could happen next, Egrag Crypto predicted a liquidity sweep rather than a confirmed breakdown in the XRP price. He explained that a wick below $1.85 is a normal liquidity behavior within a range. However, a weekly close below this level could signal structural failure and increase cycle risk. 

Until that happens, Egrag Crypto noted that the XRP price is still ranging, holding structure, not broken, and not in macro failure. He added that his stance remains unchanged as he is still bullish and holding as long as the structure remains valid. 

At the time of writing, the XRP price is trading at around $1.90, down over 3% in the last 24 hours, according to data from CoinMarketCap.

XRP

Bitcoin Shows Signs Of Internal Strength As Analysts Turn More Optimistic

Bitcoin has shown early signs of calm, but the mood is fragile. Prices pulled back from a weekend peak and trading has been choppy as investors weigh fresh tariff headlines and slowing growth in parts of Asia.

Spot Market Signals Ease

According to Glassnode, spot trading volume has picked up modestly while the net buy–sell imbalance moved above its usual upper band. That shift points to less sell-side pressure, even if demand is still patchy.

Reports note that markets are slowly rebuilding after late-2025 profit-taking, with long-term holders less willing to sell every rally. The result is a market that is consolidating rather than breaking down.

Derivatives Stress And A Sharp Retest

Over the weekend Bitcoin slid by 3.2% from its high, prompting a retest of the $92,000 level that surprised some bulls. That move wiped out about $215 million in leveraged futures longs, a large hit that raised alarms about deeper losses.

At the same time, weak activity in derivatives markets has flagged a cooling of speculative appetite, which makes it harder for Bitcoin to act as a reliable hedge right now.

Nasdaq futures fell after US President Donald Trump announced new tariff proposals aimed at several European countries, and such macro shocks often push traders out of riskier holds.

Liquidity Patterns Echo Past Cycles

Analysts at Swissblock pointed to a fall in network growth and liquidity that looks similar to conditions seen in 2022. Back then, low liquidity and a pause in growth led to a long consolidation, only for both indicators to surge later and fuel a big price run.

Based on reports, the current setup could be the prelude to a similar rebuild if network activity recovers and buy-side momentum strengthens.

Network growth has hit lows not seen since 2022, while liquidity continues to drain. Back in 2022, similar network levels triggered a $BTC consolidation phase as network growth began to recover, even while liquidity remained weak and bottoming out.

History shows that the… pic.twitter.com/24sC3aoyAD

— Swissblock (@swissblock__) January 19, 2026

Institutional Flows And Hedge Narratives

Analysts said that ETF flows show institutions buying on pullbacks and that long-term holders are not rushing to sell.

Gold has climbed past $4,650, and that safe-haven move, together with softer growth data in China, is nudging some investors to treat Bitcoin as a portfolio hedge rather than a quick trade.

A Cautious Outlook

Overall, signs point to a slow rebuild rather than a fresh breakout. Buy-side dynamics have improved, but they are not yet strong or broad enough to call a new uptrend. Volatility remains a feature, and geopolitical or policy shocks could push price swings wider.

For the time being, the market is steadying while staying watchful — more recovery in liquidity and clearer institutional conviction would be needed to turn this consolidation into a lasting advance.

Featured image from Gemini, chart from TradingView

XRP Market Structure Resembles That Of February 2022, Glassnode Warns

Glassnode says XRP is slipping back into a cost-basis configuration last seen in February 2022, with newer buyers accumulating at levels that leave a prior cohort “top” increasingly underwater, an on-chain setup that can shape sell pressure around key price zones.

In a note shared Monday via X, the analytics firm pointed to a rotation in realized prices by age band. “The current market structure for XRP closely resembles February 2022,” Glassnode wrote. It added that “psychological pressure on top buyers builds over time,” framing the current tape as one where patience is being tested rather than rewarded.

What This Means For XRP Price

The firm’s core observation is that wallets active in the short-term window, roughly the 1-week to 1-month cohort, are accumulating below the cost basis of holders in the 6-month to 12-month band. In practice, that means newer demand is stepping in at prices that are cheaper than what a meaningful slice of mid-term holders paid.

That relationship matters because cohorts tend to behave differently when price revisits their cost basis. When spot trades below a cohort’s realized price, that cohort is, on average, underwater. If the market rallies back toward that level, some of that supply can become eager to de-risk into breakeven, creating overhead liquidity that can cap upside until it is absorbed.

Glassnode’s “Realized Price by Age” chart (7-day moving average) visualizes this dynamic by plotting cohort realized prices against spot. The standout feature is the gap between shorter-term and 6–12 month cost bases during the most recent consolidation, echoing the firm’s February 2022 comparison.

XRP Realized Price by Age (7-day MA)

With XRP price again trading slightly below the $2 mark, a post by Glassnode from Nov. 24 2025 also comes back into focus. Glassnode quoted this old X post in which it singled out $2 as the level where this cohort stress has been most visible in flows. “The $2.0 level remains a major psychological zone for Ripple holders,” the firm said. “Since early 2025, each retest of $2 saw $0.5B–$1.2B per week in losses,” a reminder that many holders have been exiting at a loss as price revisits that handle.

Those realized loss estimates are a key qualifier: they suggest that $2 is not just a chart level, but a behavior level, where spending decisions change and where capitulation (or forced de-risking) can cluster.

Notably, in February 2022, XRP put in a sharp round-trip: after slipping to about $0.6034 on Feb. 2, it ripped higher to the month’s peak near $0.8758 on Feb. 8, then rolled over into the back half of the month as macro risk accelerated. Then, XRP was back around $0.70 by Feb. 23–24 (roughly 20% off the Feb. 8 high), before bouncing into month-end near $0.7856 on Feb. 28.

The late-month downdraft coincided with the Russia–Ukraine escalation and the Feb. 24 invasion, which hit risk assets broadly and pushed major crypto lower intraday, consistent with the risk-off impulse seen across the entire crypto market.

At press time, XRP traded at $1.9294.

XRP price chart

Bitcoin Charts Bullish Path Toward ATH, But Needs To Clear This Major Supply Cluster

The crypto market was left in awe as the price of Bitcoin experienced a sudden surge, bringing the flagship asset dangerously close to the $100,000 mark. With the recent bounce, hopes for a retest of the current all-time high and beyond have reemerged. However, a crucial supply cluster continues to stand in the way.

A Fresh All-Time High Beckons For Bitcoin

Bitcoin’s price is gaining sharp upward traction as it retests the $98,000 price mark on Wednesday, a level last seen in November 2025. On-chain data shows that the crypto king is once again edging toward uncharted territory, with market structure pointing to a clear path toward a new all-time high.

However, there is a significant barrier between present levels and price discovery: a dense supply cluster created by investors who have previously made purchases in the same range. This range was highlighted by Glassnode, a leading on-chain data platform, after examining the BTC Long-Term Holder Cost Basis Distribution Heatmap.

Data from the key metric shows a dense cost-basis cluster between the $93,000 and $109,000 price range, which is forming a substantial overhead supply zone. The supply zone serves as a technical and psychological barrier where a large number of holders may be waiting to take profits or quit at breakeven, resulting in concentrated resistance.

Bitcoin

At this level, any sustained push higher must first absorb this supply, with a decisive breakout above the range. If Bitcoin is able to absorb this overhead supply and push through it decisively, momentum could pick up pace quickly. Glassnode noted that this crucial range is usually expected to reopen the path toward a new all-time high for Bitcoin over the longer term.

According to Glassnode in another post, BTC has ushered in the new year with constructive momentum, printing two higher highs and extending its value toward the $98,000 price level. However, the platform stated that the leg up currently runs directly into a historically supply zone.

BTC Market Is Displaying Deleveraging Signals

Looking at Bitcoin’s current action from an on-chain perspective, the flagship asset is starting to show signs of deleveraging. This deleveraging indicates that excess speculation is being removed from the market after a period of high leverage and aggressive positioning.

Coin Bureau’s report shared on X points to a sharp decline in BTC Open Interest (OI) from $15 billion in October to $10 billion today, as leveraged traders get flushed out. The drop represents an over 30% decrease within the period. 

Interestingly, these deleveraging phases have often preceded major market bottoms, making this a critical moment for BTC. Nonetheless, should BTC continue to fall, more leverage is expected to still get wiped out.

At the time of writing, the Bitcoin price was trading at $96,247, demonstrating a 1.29% increase in the last 24 hours. Data from CoinMarketCap shows that trading volume is down despite the bullish price action, dropping by more than 3% in the past day.

Bitcoin

Glassnode: Bitcoin Is Back At $96K, Hitting The Same Sell Ceiling Again

Bitcoin’s early-2026 bounce has pushed back into a familiar problem area: a dense pocket of overhead supply that Glassnode says has repeatedly capped rallies since November. In its latest Week On-chain report, the analytics firm frames the move above $96,000 as constructive on the surface, but still largely dependent on derivatives positioning and liquidity conditions rather than persistent spot accumulation.

Glassnode’s central argument is that Bitcoin has rallied straight into a historically significant band of long-term holder (LTH) cost basis, built during April to July 2025 and associated with sustained distribution near cycle highs. The report describes a “dense cluster” spanning roughly $93K to $110K, with rebounds since November repeatedly stalling near the lower boundary.

“This region has consistently acted as a transition barrier, separating corrective phases from durable bull regimes,” Glassnode wrote. “With price once again pressing into this overhead supply, the market now faces a familiar test of resilience, where absorbing long-term holder distribution remains a prerequisite for any broader trend reversal.” The firm’s framing is blunt: the market is back at the same sell ceiling, and clearing it requires real absorption, not just price probing.

Bitcoin long-term holder cost basis distribution heatmap

The next level the report highlights is the short-term holder (STH) cost basis at $98.3K, which it treats as a confidence gauge for newer buyers. Sustained trading above it would indicate that recent demand is strong enough to keep late entrants in profit while soaking up overhead supply.

Bitcoin short-term holder cost basis

On-chain, Glassnode notes long-term holders remain net sellers, with total LTH supply still trending lower. The key change is speed. The report says the rate of decline has “slowed materially” versus the aggressive distribution seen in Q3 and Q4 2025, suggesting profit-taking is continuing but with less intensity.

“What follows will depend primarily on the demand side’s ability to absorb this supply, particularly from investors accumulated over Q2 2025,” the report said. “Failure to hold above the True Market Mean at ~$81k, in the long term, would significantly increase the risk of a deeper capitulation phase, reminiscent of the April 2022 to April 2023 period.” It is one of the clearest downside conditionals in the note: if the market loses the long-run mean, the probability distribution shifts toward a more severe unwind.

A related signal is the Net Realized Profit and Loss of Long-Term Holders, which Glassnode says reflects a “markedly cooler distribution regime.” Long-term holders are realizing roughly 12.8K BTC per week in net profit, a sharp slowdown from cycle peaks above 100K BTC per week. That moderation does not imply capitulation risk is gone, but it does suggest the heaviest phase of profit-taking has eased.

Bitcoin Demand Remains Uneven

Off-chain indicators lean more constructive. Glassnode argues institutional balance-sheet flows have “gone through a full reset” after months of heavy outflows across spot ETFs, corporates, and sovereign entities, with net flows stabilizing as sell-side pressure appears exhausted. Spot ETFs are described as the first cohort to turn positive again, re-establishing themselves as the primary marginal buyer.

Corporate and sovereign treasury flows, by contrast, are portrayed as sporadic and event-driven rather than consistent. The upshot is a market where balance-sheet demand can help stabilize price, but may not yet function as a sustained growth engine, leaving short-term direction more sensitive to derivatives positioning and liquidity conditions.

DAT netflows

At the venue level, Glassnode points to improving spot behavior. Binance and aggregate exchange flow measures have shifted back into buy-dominant regimes, and Coinbase, described as a consistent source of sell-side aggression during the consolidation, has “meaningfully slowed its selling activity.” The report calls this a constructive structural shift, while stressing it still falls short of the persistent, aggressive accumulation typically associated with full trend expansions.

The most pointed caution in the report is that the move into the $96K region was “mechanically reinforced” by short liquidations in a relatively thin liquidity environment. Futures turnover remains well below the elevated activity seen across most of 2025, implying it took comparatively little capital to force shorts out and push price through resistance.

“This indicates that the breakout occurred in a comparatively light liquidity environment, where modest positioning shifts were able to drive disproportionately large price responses,” Glassnode said. “In practical terms, it did not take significant new capital to force shorts out of the market and lift price through resistance.” The implication is that continuation now depends on whether spot demand and sustained volume can replace forced covering once the squeeze impulse fades.

Options markets add a second layer of tension. Glassnode describes implied volatility as low but “deferred,” while skew continues to price downside asymmetry, with 25-delta skew biased toward puts in mid and longer maturities. In short: participants appear comfortable holding exposure, but remain unwilling to do so without insurance.

Cumulative Volume Delta Bias

Positioning also matters at the microstructure level. The report flags dealers as short gamma around spot, with a zone roughly from $94K to $104K. In that setup, hedging flows can amplify moves rather than dampen them, buying into rallies and selling into dips, raising the odds of faster travel toward high-interest strikes such as $100K if momentum takes hold.

At press time, BTC traded at $96,334.

Bitcoin price chart

XRP Analyst Says This Is What They Aren’t Showing You, ‘Don’t Get Shaken Out’

XRP has broken above the $2.10 price level, but on the surface, the chart is not comfortable. Red candles, falling sentiment, and growing chatter about weakness are still dominating conversation. 

According to a crypto analyst on X, that reaction may be exactly what larger players are counting on, especially because a closer look at on-chain data shows a very different story is quietly unfolding below the price action.

Price Weakness And Retail Capitulation On Center Stage

XRP started the year on a good note, with a break above $2 and then pushing as high as $2.41 before facing rejection. This rejection, in turn, caused the altcoin to fall to as low as $2.05. The analyst pointed to the loss of the $2.23 level during the breakdown as the moment retail confidence began to crack. 

As XRP’s price action trended lower to $2.05, fear-based selling increased, and this was shown on the charts that appeared increasingly bearish. From a short-term perspective, the move looked like confirmation that sellers quickly took control from buyers. 

XRP

Behind that visible decline, there are activities from institutional participants that do not show up on standard price charts. When retail participants were selling, XRP-related ETFs recorded a net inflow of $4.9 million in a single day. 

The lower panel of the chart below shows this divergence, showing total holdings of Spot XRP ETFs climbing steadily even as the price moved lower. This contrast can be described as a transfer of wealth in plain sight, showing how institutional buyers were using the pullback to add exposure when retail traders were selling.

Supply Shock Shows Quiet Accumulation

The message is that what looks like weakness on the surface may be setting the stage for a very different outcome once selling pressure from retail participants fades. 

However, another detail raised by the analyst is the movement of the token off exchanges. Roughly $22 million worth of tokens reportedly left trading platforms in the past 24 hours, reducing readily available supply. 

The pattern extends back to late 2025, when balances held on crypto exchanges began a steady decline. Data from Glassnode shows that total exchange-held XRP has now fallen below 2 billion tokens, which is a notable decline from levels above 4 billion XRP recorded around January 2025.

This reduction in exchange supply has not yet translated into an extended upside move in the altcoin’s price since it started correcting from its July all-time high, but it does point to quiet accumulation taking place below the surface. 

As some holders sell into weakness, a smaller group of market participants appears willing to absorb supply. That divergence is why several analysts have cautioned the XRP community against panic selling and getting shaken out.

XRP

❌