Reading view

There are new articles available, click to refresh the page.

Solana Will Become A ‘Decentralized Nasdaq’ In 2026, Delphi Digital Predicts

Delphi Digital is betting that Solana’s next major upgrade cycle will reposition the network as an “exchange grade” environment capable of supporting onchain order books that can realistically contend with centralized venues on latency, liquidity depth, and market structure. In a Jan. 20 post on X titled “2026 is the Year of Solana”, the research firm argued Solana’s 2026 roadmap is its “most aggressive upgrade cycle” yet, one that “overhaul[s] everything from consensus to infrastructure to become the decentralized Nasdaq.”

Why Delphi Digital Calls 2026 “The Year Of Solana”

Delphi framed the roadmap less as a grab bag of performance enhancements and more as a capital-markets push: “Solana’s roadmap is about transforming it into an exchange grade environment where a native onchain CLOB can viably compete with CEX latency, liquidity depth, and fairness. Here are all the upgrades making this possible.” In that view, shaving milliseconds matters only insofar as it produces predictable, enforceable execution outcomes for applications like high-frequency trading and central limit order books.

The centerpiece, Delphi wrote, is Alpenglow, a consensus redesign it called “the most significant protocol level change in Solana’s history.” The firm said Alpenglow introduces a new architecture built around Votor and Rotor, with Votor changing how validators reach agreement. Rather than “chaining multiple voting rounds together,” validators would aggregate votes offchain and “commit to finality in one or two rounds,” producing “theoretical finality in the 100-150 millisecond range, down from the original 12.8 seconds.”

Delphi emphasized Votor’s parallel finalization paths as a resilience feature, not just a speed play. If a block gets “overwhelming support (80%+ stake)” it finalizes immediately; if support is between 60% and 80%, a second round triggers, and finality follows if that also clears 60%. The goal, Delphi argued, is to preserve finality even with unresponsive segments of the network.

Alpenglow also introduces what Delphi called a “20+20” resilience model: safety holds as long as no more than 20% of stake is malicious, while liveness persists even if another 20% is offline, “tolerat[ing] up to 40% of the network being either malicious or inactive while still maintaining finality.” Under this design, Proof of History is “effectively deprecated,” replaced by deterministic slot scheduling and local timers. Delphi said the upgrade is expected to roll out in early to mid 2026.

Delphi also pointed to Firedancer, Jump’s C++ validator client, as a structural upgrade aimed at reducing a long-standing operational risk. Solana has historically relied on a single client, now known as Agave, and Delphi described that “monoculture” as a central weakness because client-level faults can cascade into broader network halts.

Firedancer’s objective, Delphi said, is a deterministic, high-throughput engine that can process “millions of TPS with minimal latency variance.” Ahead of full readiness, Delphi highlighted “Frankendancer,” a transitional build that combines Firedancer’s networking and block production modules with Agave’s runtime and consensus components, as a bridge to “substantially” increased client diversity.

On infrastructure, Delphi spotlighted DoubleZero as a private fiber overlay for validators, likening its transmission profile to traditional exchange connectivity: “the same infrastructure traditional exchanges like Nasdaq and CME rely on for microsecond level transmission.” The argument is that as validator sets expand, propagation variance becomes the enemy of tight finality windows. By routing messages along “optimal paths” and supporting multicast delivery, Delphi said DoubleZero can narrow latency gaps across validators—an enabler for both Votor’s quorum formation and Rotor’s propagation design.

Delphi also framed Solana’s block-building roadmap as a market-structure project. It described Jito’s BAM (Block Assembly Marketplace) as separating ordering from execution via a marketplace and privacy layer, with transactions ingested into TEEs so “neither validators nor builders can see raw transaction content before ordering takes effect,” reducing pre-execution behavior like frontrunning.

Harmonic, meanwhile, targets builder competition by introducing an open aggregation layer so validators can accept proposals from “multiple competing builders in real time,” with Delphi summarizing: “Think of Harmonic as a meta-market and BAM as a micro-market.”

Raiku rounds out the thesis by adding deterministic latency and programmable execution guarantees adjacent to Solana’s validator set, using Ahead-of-Time (AOT) transactions for pre-committed workflows and Just-in-Time (JIT) transactions for real-time needs—without modifying L1 consensus.

Delphi ultimately tied the technical roadmap to market demand: Solana’s spot trading gravity, the consolidation of onchain perps toward a handful of venues, and the need to reach performance parity with centralized platforms. It cited expectations for “new Solana native perps like Bulk Trade coming early next year,” and pointed to products like xStocks bringing “onchain equities directly to Solana,” arguing that liquidity and attention are consolidating toward a chain with faster settlement, better UX, and denser capital.

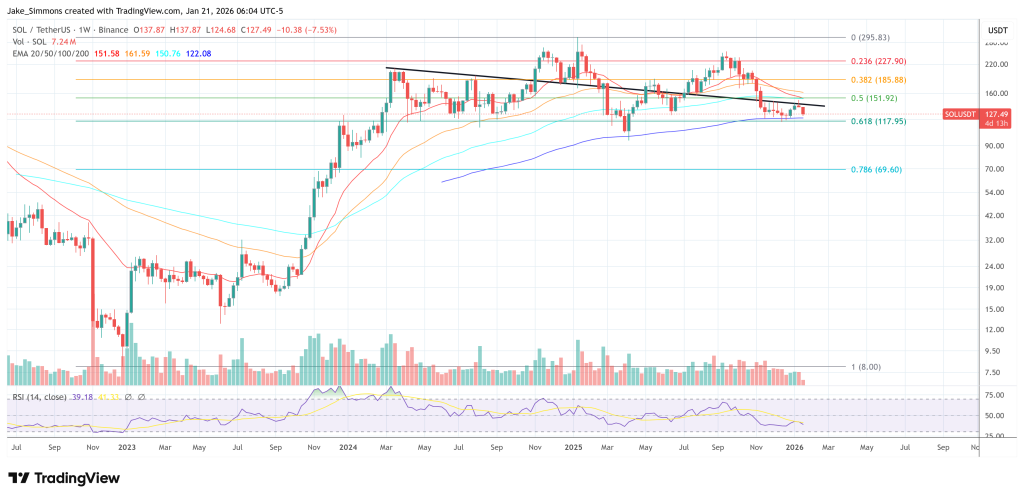
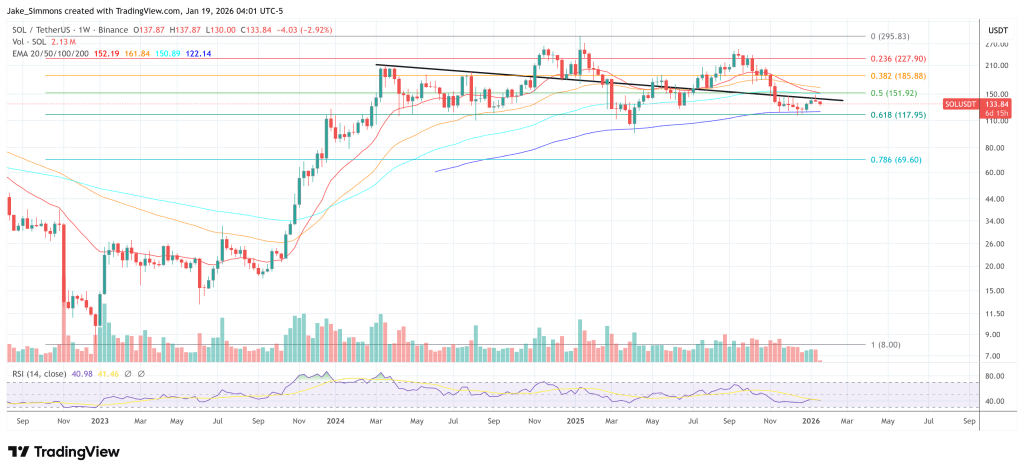
At press time, SOL traded at $127.

Solana price chart

Solana risks plunge to under $120 as sellers dominate

  • Solana traded to lows of $128 as the price broke down from above $135.
  • The technical outlook suggests bears could eye a dip to $120 or lower.
  • Bitcoin’s trajectory will also dictate broader sentiment.

Solana (SOL) price declined by about 4% in the past 24 hours to trade below $130 as of writing on January 20, 2026.

The altcoin’s value slipped amid heightened selling pressure across the broader market, with corrections sending Bitcoin to around $90,600.

For Solana, derivatives metrics hint at a potential bearish tilt, with further downside action toward sub-$120 levels likely.

​Solana dips below $130

Top altcoins continue to see notable traction, as shown by the $1 billion real-world assets milestone for Solana.

However, while this points to long-term potential, in the short term, it appears bullish sentiment is waning.

Escalating global economic uncertainties and cryptocurrency sector volatility signal this outlook, with long liquidations in SOL derivatives surpassing $20 million in the past 24 hours.

The imbalance in liquidations, with longs comprising over 95% of total wipeouts, points to overcrowded bullish bets.

Notably, this shows how vulnerable bulls are to cascading sell-offs.

In this case, the aggressive unwinding by leveraged bulls has open interest in SOL futures contracting to roughly $8.2 billion amid diminished risk appetite.

​Meanwhile, funding rates hover at a mildly 0.0070%, but seller dominance has SOL prices down 8% this past week.

The monthly action has seen shorts shrink the altcoin’s value to just +2.4%.

A look at institutional flows does present a mixed picture. US spot Solana ETFs registered over $47 million in net inflows last week.

SoSoValue data shows that net inflows were up from about $41 million and $20 million over the previous two weeks.

However, spot-driven selling could erode this support, potentially triggering outflows.

​​SOL price forecast – Is $120 next?

As highlighted, Solana traded below the key support at $130, having slipped under the 20-day and 50-day exponential moving averages.

The EMAs are clustered at $137 and $159, respectively, hinting at a short-term bearish structure.

Charts also show the daily MACD line has crossed below its signal, with histogram bars expanding negatively.

Meanwhile, RSI hovers at 41 and is drifting toward oversold territory to suggest more room for downward momentum.

Solana Price Chart
Solana price chart by TradingView

​If support at $125-$126 fails, it will open a path for a revisit of the $120 mark.

Bears could target lows of $116 reached on December 18, 2025.

On the other hand, upside resistance looms at the $137 level, and notable supply zones also await around $145 and $160.

A decisive move in either direction will be key to bears or bulls. Market sentiment will also hinge on Bitcoin’s trajectory, with fresh tumbles amplifying SOL’s downside vulnerability.

The post Solana risks plunge to under $120 as sellers dominate appeared first on CoinJournal.

Solana Labs CEO Says Ethereum-Style ‘Walkaway’ Thinking Is a Death Wish

Over the weekend, Solana Labs CEO Anatoly Yakovenko pushed back on Vitalik Buterin’s latest case for Ethereum “ossification,” arguing that for Solana, continuous protocol iteration is not optional, it is survival.

The exchange was sparked by a Jan. 12 post in which Buterin said “Ethereum itself must pass the walkaway test,” framing Ethereum as a base layer that should remain usable even if the community largely stops making substantive protocol changes.

“It must support applications that are more like tools […] than like services that lose all functionality once the vendor loses interest in maintaining them,” Buterin wrote. “But building such applications is not possible on a base layer which itself depends on ongoing updates from a vendor in order to continue being usable […] Hence, Ethereum itself must pass the walkaway test.”

Why Solana Can’t Afford To Ossify

Yakovenko replied that he “actually think[s] fairly differently on this,” laying out a philosophy that treats adaptability as core to Solana’s value proposition. “Solana needs to never stop iterating,” he wrote. “It shouldn’t depend on any single group or individual to do so, but if it ever stops changing to fit the needs of its devs and users, it will die.” In Yakovenko’s framing, the risk is not merely technical stagnation; it is a network losing relevance to the people building and transacting on it.

Buterin’s “walkaway test” rests on the idea that Ethereum should reach a point where its usefulness does not “strictly depend on any features that are not in the protocol already,” even if the ecosystem continues improving via client optimizations and limited parameter changes. He also sketched a set of medium-term protocol objectives, ranging from quantum resistance and scalable architecture to long-lived state design and decentralization safeguards, aimed at making Ethereum robust “for decades” and reducing the need for frequent disruptive upgrades.

Yakovenko’s critique is less about those specific goals than the premise that a base layer should aspire to being able to “ossify if we want to.” In his view, ossification is not a neutral milestone; it risks locking in a protocol that can’t keep pace with developer and user demands. “To not die requires to always be useful,” he wrote. “So the primary goal of protocol changes should be to solve a dev or user problem.” At the same time, he emphasized prioritization over maximalism: “That doesn’t mean solve every problem, in fact, saying no to most problems is necessary.”

A key overlap in both positions is a skepticism toward dependence on a single “vendor,” though they operationalize it differently. Buterin wants Ethereum’s base layer to become sufficiently complete that it can remain dependable even if the upgrade cadence slows dramatically. Yakovenko, by contrast, argues that Solana should assume upgrades will keep coming, but not necessarily from any one core team.

“You should always count on there being a next version of solana, just not necessarily from Anza or Labs or fd,” he wrote, referencing major entities in Solana’s development orbit. He then pointed to a future where governance and funding mechanisms could directly underwrite that work, suggesting “we are likely to end up in a world where a SIMD vote pays for the GPUs that write the code,” a nod to both on-chain coordination and the growing role of AI-assisted development.

At press time, SOL traded at $133.84.

Solana price chart

Money Flows Out From Bitcoin And Ethereum Into Solana And XRP, Here Are The Numbers

Bitcoin, Ethereum, Solana, and XRP are at the center of a clear capital rotation unfolding across the crypto market, as investors scale back exposure to the largest assets while reallocating capital into selective alternatives. The latest CoinShares Digital Asset Fund Flows Weekly Report (Volume 268) captures this shift through hard fund-flow data, highlighting deliberate institutional repositioning.

Bitcoin And Ethereum See Heavy Withdrawals As Capital Rotates

Digital asset investment products recorded $454 million in net outflows over the latest reporting week, a move linked to weakening expectations for near-term US Federal Reserve rate cuts. As macro conditions tightened, capital moved defensively, pressuring risk assets across the board.

Bitcoin accounted for the overwhelming share of redemptions. BTC investment products saw $405 million in outflows, reinforcing the idea that investors are reducing exposure where liquidity is deepest and allocations are largest. Ethereum followed with $116 million in outflows, confirming that selling pressure remains concentrated in core holdings rather than across the entire asset class.

The regional breakdown sharpens this picture. The United States recorded $569 million in outflows, making it the dominant source of capital withdrawal during the week. In contrast, other regions remained selectively constructive. Germany posted $58.9 million in inflows, while Canada added $24.5 million and Switzerland recorded $21 million, pointing to regional divergence rather than a synchronized global retreat.

Flows by product and provider further reinforce this trend. Multi-asset investment products saw $21 million in outflows, indicating reduced appetite for broad crypto exposure. Binance-linked products lost $3.7 million, while Aave-related products recorded $1.7 million in outflows, showing that pressure extended beyond just Bitcoin and Ethereum-linked vehicles.

Solana And XRP Capture Inflows Amid Market Repositioning

While headline flows were negative, capital did not exit crypto entirely. Instead, it rotated. XRP led alternative asset inflows with $45.8 million, standing out as the strongest performer during the week. Solana followed closely with $32.8 million in inflows, continuing a pattern of steady institutional accumulation.

These inflows are notable because they occurred during a week of broad net outflows, suggesting intentional reallocation rather than indiscriminate risk-off behavior. Investors appeared willing to maintain crypto exposure, but only where they perceived stronger relative upside or differentiated fundamentals. Solana’s inflows reflect confidence in its ecosystem growth and transaction throughput, while XRP’s gains point to improving sentiment around its positioning and use-case clarity.

Smaller assets also saw selective interest. Sui recorded $7.6 million in inflows, reinforcing the theme that capital is being redeployed with precision rather than withdrawn wholesale.

The numbers draw a clear conclusion. Bitcoin and Ethereum are increasingly treated as macro-sensitive anchors within crypto portfolios, absorbing most of the downside when conditions tighten. Solana and XRP, by contrast, are emerging as tactical allocation targets. If this rotation persists, market leadership could shift away from incumbents toward assets perceived to offer better capital efficiency, reshaping short-term market structure without undermining crypto’s broader institutional footprint.

Solana price chart from Tradingview.com (Bitcoin, Ethereum, XRP)

Solana’s Price Next Move Tied To Its On-Chain Strength: Can The Network Deliver?

Solana’s price has delivered a slight rebound as the broader crypto market gradually shifts towards a bullish outlook. Although the price of SOL may be demonstrating strength once again, its future trajectory is largely tied to the performance of the leading network in the days ahead.

Network Performance Becomes The Key Catalyst For Solana’s Price

Following a slight bounce on Monday, Solana is back above the $140 price mark. However, on-chain data suggests that the altcoin is nearing a turning point where its next significant price change may depend more on how well its network functions going forward than on market sentiment.

This thesis was outlined by Santiment, a leading market intelligence and on-chain data platform, after examining the correlation between SOL’s current price movement and its network activity. With price spikes coinciding with reduced network activity, the focus is now on the blockchain’s ability to maintain that momentum.

Santiment highlighted that as ongoing market volatility cools off, the price of SOL experienced a leg up as high as $144, drawing dangerously close to breaking past its $145 resistance level. While the price remains below the key resistance level, the altcoin awaits its next major catalyst in order to clear this level.

Solana

According to the on-chain platform, this will mostly depend on whether SOL network growth can start to increase once more, drawing attention to its fading new wallet creation. Data shows that the number of new wallet addresses created in a weekly timeframe has dropped significantly over the last few weeks.

In contrast to the prior optimistic moments, when new addresses were generated at record rates, accompanied by soaring trading and meme-coin activity, the slowdown represents a significant change.

As of November 2024, the number of weekly wallet addresses created was approximately 30.2 million. Fast forward to today, and the figure has fallen sharply, sitting at about 7.3 million. This massive drop in wallet creation signals a growing cooling phase in user onboarding across the SOL network

SOL Maintaining Large Daily Transactions

New wallet addresses may have reduced significantly, but Solana’s transaction scale remains robust. Despite fluctuations in the overall market momentum, SOL maintains a remarkably high level of daily transactions, demonstrating the power of its network.

In a recent report from Solana Daily on the X platform, it was revealed that the network has persistently carried out more than 60 million transactions every day for the past 750 days. This consistency demonstrates the chain’s widespread use in Decentralized Finance (DeFi), Non-Fungible Tokens (NFTs), payments, and high-throughput applications that depend on its affordability and speed.

An interesting aspect of this growth is that the network has maintained zero uptime within the timeframe, reinforcing its position as a reliable hub for on-chain activity. Currently, Solana is supported by real usage rather than just speculative spikes, which increases network efficiency.

Solana

Solana Price Jumps, But Network Adoption Remains Weak

On-chain data shows the Network Growth indicator has continued to fall for Solana recently, a sign that adoption of the asset has remained weak.

Solana Network Growth Has Been Declining

According to data from on-chain analytics firm Santiment, SOL’s recent price recovery has come despite a drop in the Network Growth. This metric measures the weekly total number of addresses that are coming online on the blockchain for the first time. A wallet comes “online” on the network when it participates in some kind of transfer activity. Thus, the wallets that the Network Growth is counting are the ones that are making their first transaction on the network.

When the value of the Network Growth is high, it means that a large number of addresses are being created on the blockchain. Such a trend can be a sign that an influx of users is occurring. On the other hand, the indicator being low suggests that there isn’t much new address generation taking place on the network, which can be a potential indication that the chain isn’t attracting fresh investors.

Now, here is the chart shared by Santiment that shows the trend in the Solana Network Growth over the last couple of years:

Solana Network Growth

As displayed in the above graph, the Solana Network Growth has witnessed a drawdown recently, despite the fact that the SOL price has made some recovery since its December low. This suggests that the bullish price action has been unable to bring fresh attention to the cryptocurrency.

Historically, rallies have generally needed the incoming of new investors to be sustainable, as it’s the increased trading activity that provides them with the fuel to go on.

In the chart, Santiment has highlighted the case of a rally where this requirement wasn’t met. The Network Growth was initially at a significant level, but as this price surge from 2025 played out, the metric’s value plummeted. This could be a potential factor behind the rally eventually running out of momentum.

In late 2024, the opposite conditions were present, as the Network Growth shot up alongside the Solana bull run, implying adoption backed the price appreciation. Considering these past cases, it’s possible that the indicator might have to reverse its trajectory if SOL’s recovery has to last.

The latest downward move in the Network Growth is also not the only development SOL is dealing with right now. From the graph, it’s visible that the indicator has gone through a long-term downtrend since its high in November 2024.

Back then, the metric had a value of 30.2 million, but today, the figure has dropped to just 7.3 million. It now remains to be seen whether the long decline in the adoption of Solana will continue or if a turnaround will appear.

SOL Price

Solana recovered back to $144 on Sunday, but the coin has retraced to open the week as its price is back at $139.

Solana Price Chart

Solana Structure Suggests One Final Test Before Bulls Can Step In

Solana’s price action is sending a clear message: the correction may not be finished yet. While buyers continue to show up at key levels, the broader structure still points to the possibility of one final downside test before a sustainable move higher can take shape. 

Wave IV Still Unfinished As C-Wave Pressure Persists

Crypto analyst More Crypto Online, in a recent update, explained that Solana’s chart structure still points to the possibility of another downside move before the ongoing correction is fully completed. Within the orange scenario, price action continues to align with a C-wave decline in a broader wave IV correction, keeping the corrective outlook valid as long as the structure remains non-impulsive.

Even when viewed through the alternative white scenario, the current pullback can still be classified as an A-wave, which leaves room for another low before a B-wave recovery begins or before a potential fifth wave to the upside develops. In both interpretations, the analyst noted that the correction may not yet be finished.

Solana

From a short-term perspective, the chart suggests that Solana could drift lower into the $81 to $90 region. Currently, there are no clear structural signals indicating an immediate bullish continuation, as the absence of impulsive upside movement keeps downside scenarios firmly in play.

However, if prices were to turn higher from current levels without setting a new low, the broader structure since January 2025 would start to resemble a triangular consolidation rather than a completed wave IV. This alternative setup would imply extended sideways movement instead of a rapid trend resumption. Until stronger upside momentum appears, the focus remains on the risk of one more corrective low.

Controlled Reaction At The 50% Fibonacci Signals Solana Buyer Strength

AltCoin Việt Nam stated that Solana’s current price action is showing a strong and reassuring reaction around the 50% Fibonacci level. Instead of breaking down aggressively, the price has been rebounding in a controlled manner, suggesting that buyers are still maintaining influence. From a wave-structure perspective, wave IV does not appear to be rushing toward completion, leaving room for wave C to extend further if the market continues to move in line with the broader rhythm.

Adding to the bullish bias is the ongoing ETF narrative surrounding Solana. Spot SOL inflows are not arriving in a FOMO-driven manner, but rather through steady accumulation across several sessions. This type of capital flow often reflects longer-term positioning rather than short-term speculation, which explains why the price tends to rebound quickly whenever it revisits key support zones.

That said, the outlook is not without invalidation. A sustained move below the 50% Fibonacci level would signal that the current structure has broken down. However, the analyst views the recent pauses as temporary breathers within a broader upward structure, rather than the beginning of a meaningful downtrend.

Solana

Solana price forecast: is $100 next as SOL extends downturn?

  • Solana (SOL) price traded to around $122 on December 24, 2025.
  • Fresh losses pushed SOL near the critical $120 mark.
  • Waning investor confidence and macroeconomic headwinds see the altcoin at risk of further declines.

Solana has extended its downturn in the final weeks of 2025, dipping below the $130 mark and testing levels around $120.

On Wednesday, prices fell to these lows across major exchanges, and more declines could allow bears to test recent lows of $116.

The $120 zone has acted as intermittent support throughout the year.

But as this decline aligns with a wider cryptocurrency market retracement amid reduced liquidity and profit-taking, SOL looks set for more pain.

In the past year, Solana has underperformed both Bitcoin and Ethereum, with SOL down 38% in the period compared to 11% and 16% for BTC and ETH.

Solana price prediction: is $100 next?

Technical analysis suggests that Solana faces a critical juncture.

Charts show mounting evidence of a bearish breakdown that could propel prices toward $100 or lower in the near term.

A key concern is SOL’s position relative to its 50-day exponential moving average (EMA), currently estimated around $160-$165 based on recent data.

The price trading well below this level signals a loss of short-term momentum and reinforces a downtrend, as the 50-day EMA has acted as dynamic resistance in recent months.

Further supporting the bearish outlook are momentum indicators.

Solana Price Chart
Solana price chart by TradingView

The Relative Strength Index (RSI) hovers in the low 30s to upper 30s across daily and weekly timeframes, approaching oversold territory but not yet indicating a definitive reversal.

In technical analysis, this suggests room for additional downside before exhaustion sets in.

Meanwhile, the Moving Average Convergence Divergence (MACD) histogram shows negative values, with the MACD line below its signal line, confirming weakening bullish momentum and persistent selling dominance.

Chart patterns add to the cautionary narrative.

Solana is testing a weekly neckline support around $120. A decisive break below this could accelerate declines toward deeper supports in $100-$90 region.

What’s bullish for Solana?

Despite these challenges, Solana’s ecosystem fundamentals remain robust.

The network has processed billions of transactions in 2025, maintaining its reputation for high throughput and low fees.

Institutional milestones, including the launch of US spot SOL ETFs and integrations with traditional finance platforms, have provided some counterbalance.

Solana spot ETFs recorded inflows on December 23, even as Bitcoin and Ethereum continued outflow streaks.

While volumes are modest compared to earlier in the month, cumulative net inflows have climbed to over $754 million. That’s bullish for SOL.

However, if institutional interest wavers further, short-term technical indicators align with a broader downtrend.

The post Solana price forecast: is $100 next as SOL extends downturn? appeared first on CoinJournal.

❌