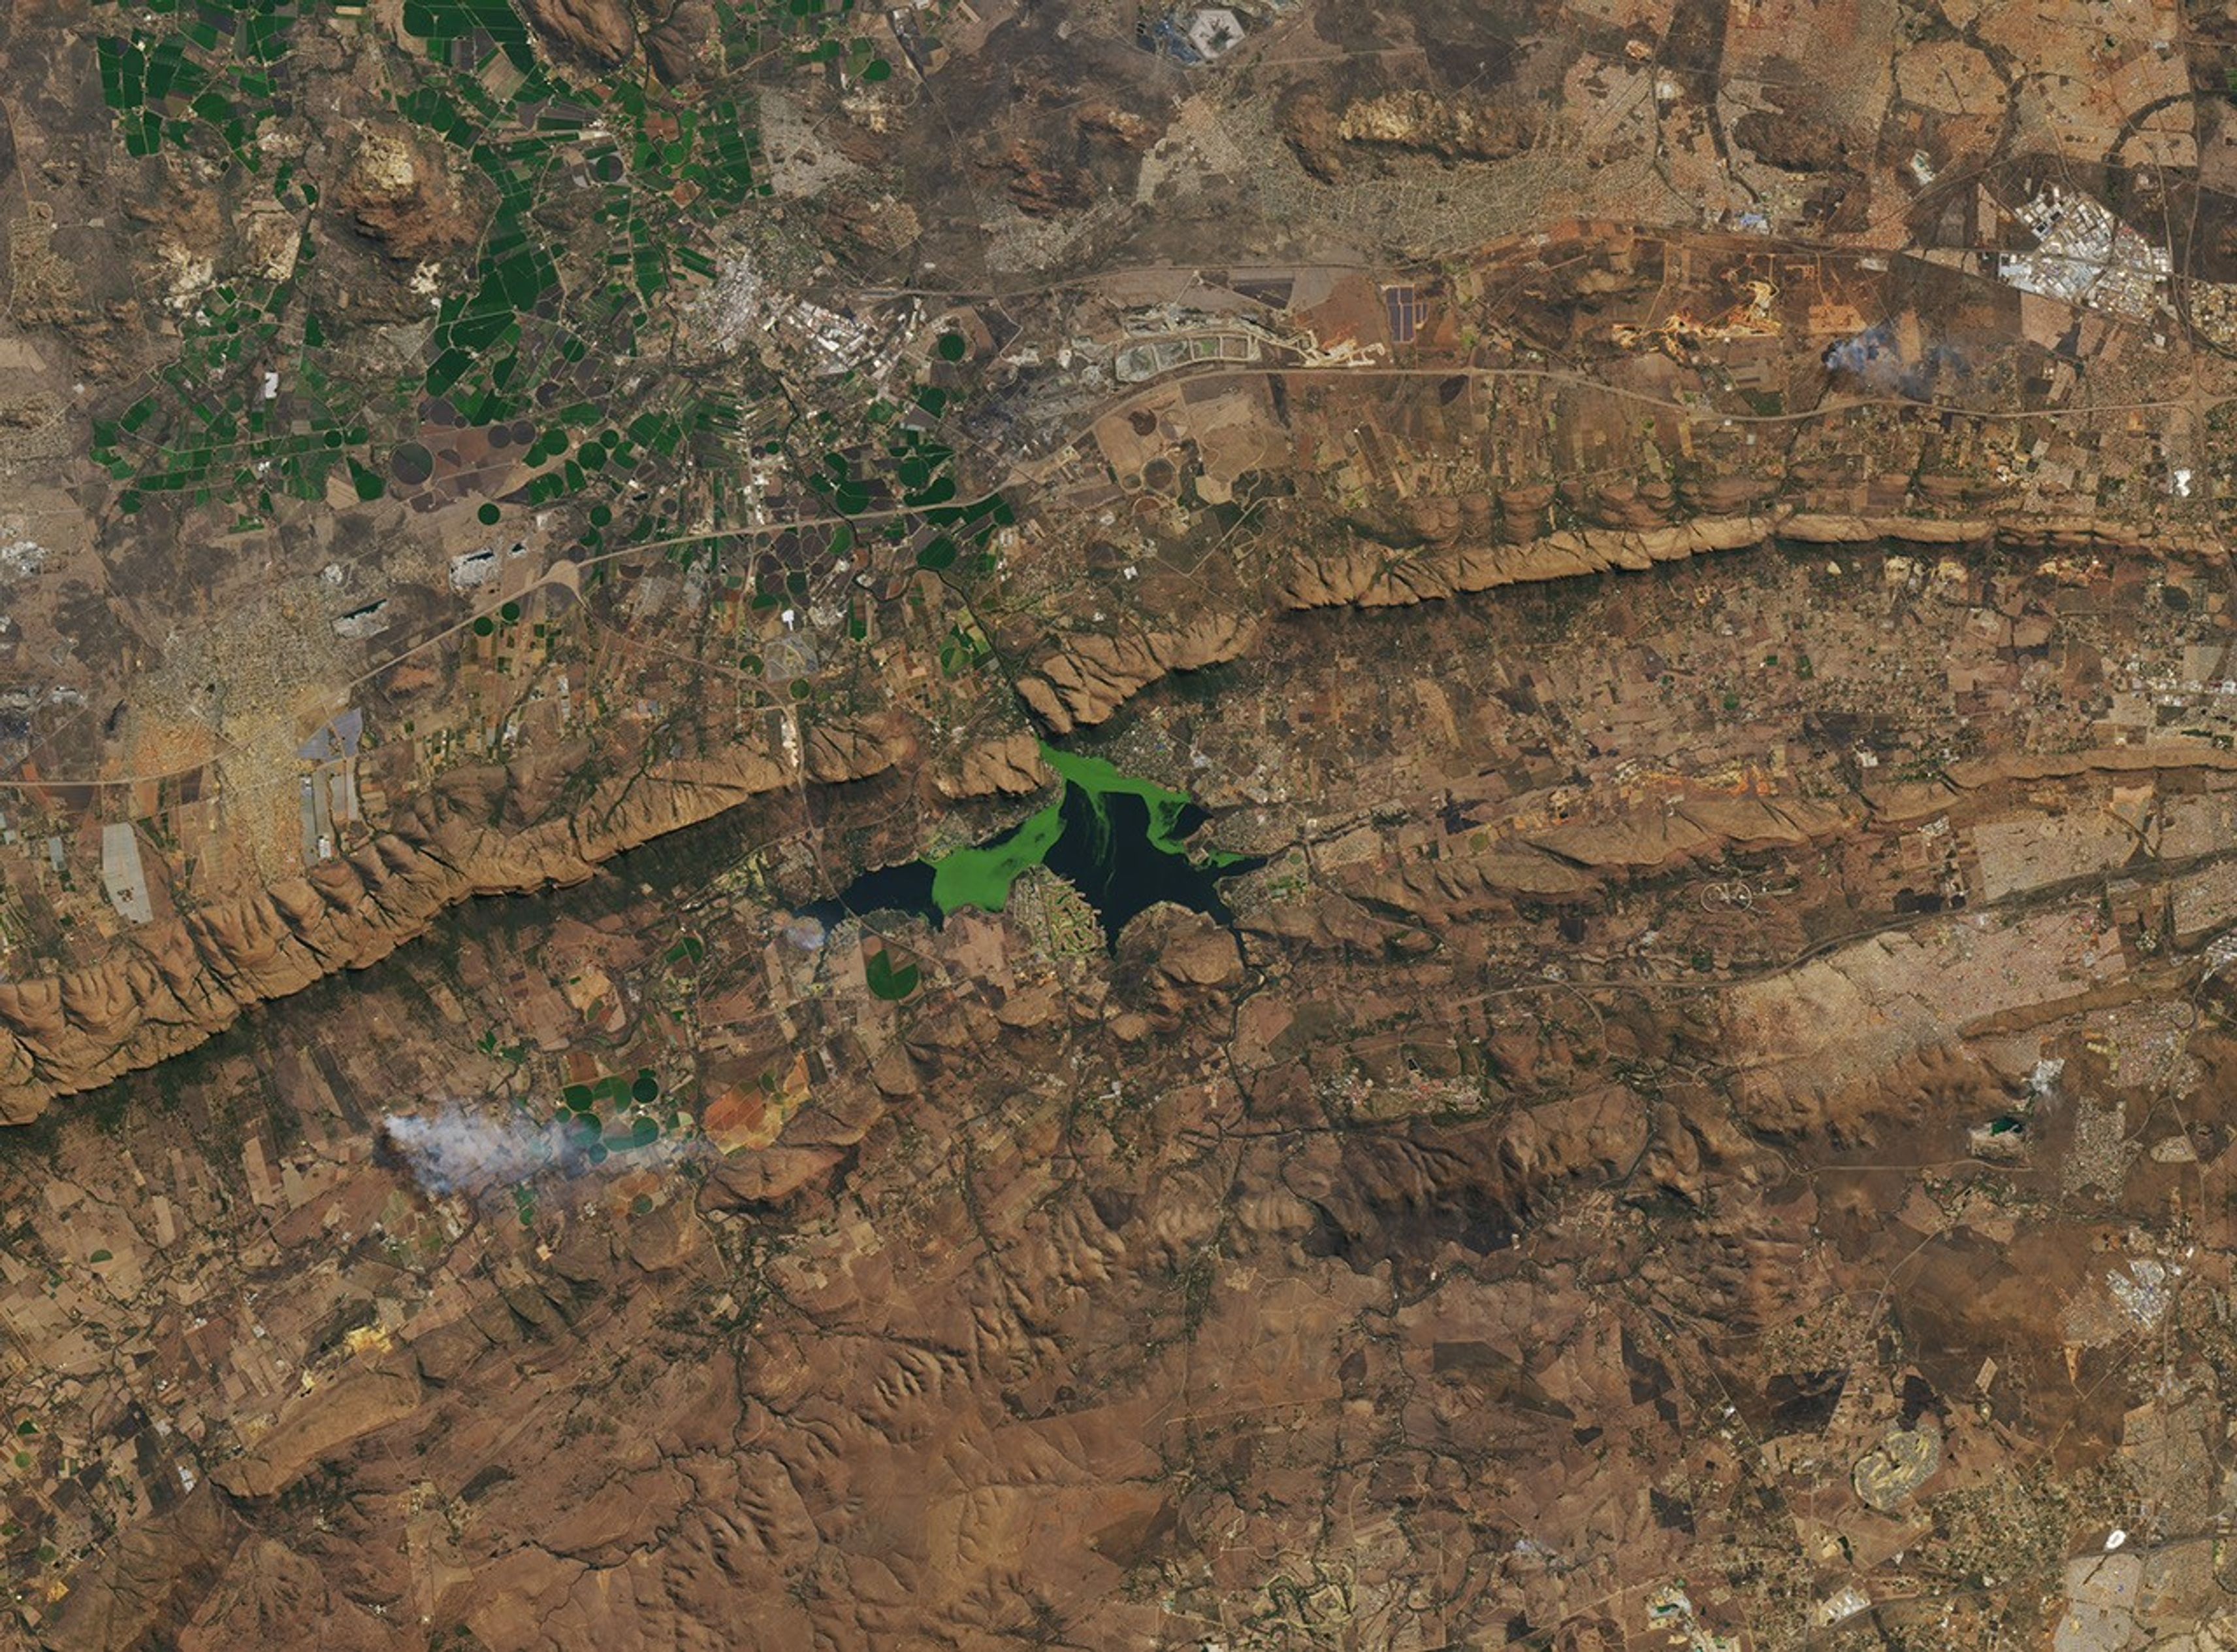
Algae Swirls Across a South African Reservoir
On clear days in Hartbeespoort, South Africa, satellite images often reveal a reservoir with shades of deep blue interrupted by drifting patches of vivid green. These shifting features indicate algae blooms, which can affect water quality, ecosystems, and nearby human communities.
In this animation, from June 2022 to July 2023, an algal bloom grows, moves around the reservoir, and then fades. The animation is composed of images from Harmonized Landsat and Sentinel-2 (HLS), a NASA product that combines imagery from the NASA/USGS Landsat 8 and Landsat 9 satellites and the European Space Agency’s Sentinel-2A, 2B, and 2C satellites.
Algae is an umbrella term for photosynthetic organisms that live in water, encompassing everything from single-celled cyanobacteria to seaweed. They play a vital role in maintaining healthy ecosystems. But when colonies of algae spread too widely or release harmful toxins, they can threaten the very environments they support. These colonies are known as harmful algal blooms, or HABs.
Some HABs are toxic and often are part of a process called eutrophication. Eutrophication begins when there are too many nutrients in an ecosystem—because of agricultural runoff and other inputs—leading to a rapid growth of algae.
“It’s like having a garden,” said Bridget Seegers, a NASA scientist who studies cyanobacteria in freshwater ecosystems. “If you add a lot of nutrients, you’re going to have a lot of growth.”
Eventually, the algae die off. As decomposers break down the dead algae, they consume oxygen, which can lead to hypoxia and the formation of dead zones.
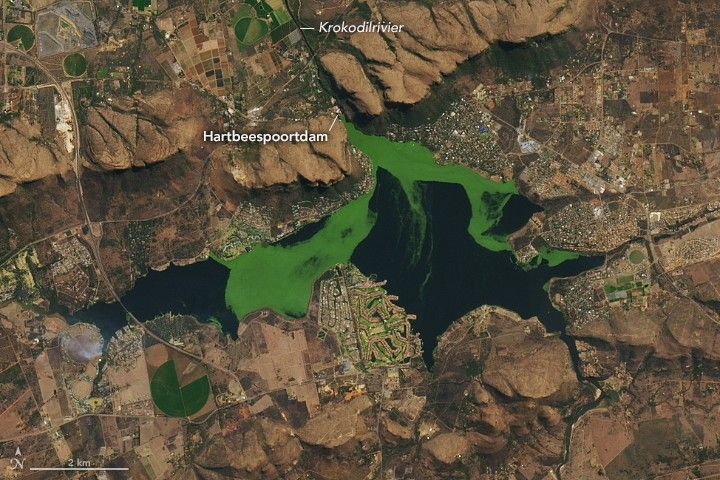
Such conditions have been documented at the Hartbeespoortdam (Hartbeespoort Dam) reservoir, located about 25 kilometers (16 miles) west of Pretoria and used primarily for recreation and irrigation. The reservoir is home to regular harmful algal blooms containing cyanobacteria. It also hosts large mats of invasive water hyacinths. While hyacinths do not produce toxins, they do contribute to eutrophication when they die and decompose.
Harmful algal blooms can affect ecosystem health and human lives and livelihoods. In April 2023, South African authorities linked a large fish kill in Hartbeespoort to low oxygen levels caused by excessive algal growth. More broadly, HABs in drinking water reservoirs can reduce water availability and raise water treatment costs, while swimming in HAB-infested waters can cause rashes, and pets or livestock that drink it may fall ill or die.
One 2022 paper published in Remote Sensing examined algae in the reservoir from 1980 to 2020 using Landsat data. “This is a reservoir that has always been monitored heavily by the local department of water resources,” said Adam Ali, the lead author of the paper. The research used satellite data to provide a big-picture view of conditions across the entire reservoir over long time scales. Using 40 years of Landsat data, the researchers found that the biggest drivers of algal growth were total phosphorus content—a nutrient found in runoff—and water temperature, with blooms typically expanding in the warm summer months and subsiding in the winter.
They also identified key trends over space and time. Algal productivity was higher near Krokodilrivier (Crocodile River) inflows and in the western part of the reservoir due to golf course runoff and restricted water circulation, demonstrating how HABs are influenced by runoff and river inputs. Large blooms occurred between 1982 and 1986, when total phosphorus levels were high. A bioremediation program in the late 1980s succeeded in limiting algae growth, but after funding ended in the late 1990s, harmful algal blooms spiked again in the early 2000s.
To track algae from space, the researchers analyzed the water’s color by measuring different wavelengths of light. From this, they estimated the concentration of chlorophyll-a, a common pigment in algae, and used these values to approximate algae biomass over time. Although water samples remain necessary to confirm that a bloom is harmful, satellite data can help scientists understand the drivers of harmful algal blooms, especially in remote regions where regular ground monitoring is expensive and time intensive.
New and forthcoming NASA missions promise to advance space-based water quality monitoring. The next Landsat satellite is expected to measure wavelengths specifically designed to detect HABs. NASA’s PACE (Plankton, Aerosol, Cloud, ocean Ecosystem) mission, launched in 2024, collects data in hundreds of precise wavelength bands in the visible spectrum, which can help scientists identify the type of algae that comprise a certain bloom—a key factor in determining toxicity. Given PACE’s spatial resolution, the data is most useful in coastal areas or larger inland water bodies. Ali is working with researchers at NASA Ames to integrate PACE into future studies.
Animation by Ross Walter/Landsat Science Office Support, using data from the Harmonized Landsat and Sentinel-2 (HLS) product. HLS is funded by NASA and is a deliverable of the Satellite Needs Working Group (SNWG), an interagency effort of the U.S. Government dedicated to identifying and addressing Earth observation needs across U.S. civilian federal agencies. Still image by Lauren Dauphin/NASA Earth Observatory using Landsat data from the U.S. Geological Survey. Story by Madeleine Gregory/Landsat Science Office Support.
References & Resources
- Ali, K., et al. (2022) Integrating In Situ and Current Generation Satellite Data for Temporal and Spatial Analysis of Harmful Algal Blooms in the Hartbeespoort Dam, Crocodile River Basin, South Africa. Remote Sensing, 14(17), 4277.
- NOAA (2016, April 27) What is a harmful algal bloom? Accessed January 6, 2026.
- South African Government (2023, April 26) Water and Sanitation releases investigation report on cause of fish-kill at Hartbeespoort Dam. Accessed January 6, 2026.
You may also be interested in:
Stay up-to-date with the latest content from NASA as we explore the universe and discover more about our home planet.

A multi-year drought has put extra strain on farmers and water managers in the Middle Eastern country.

Forests play a key role in filtering the waters of a reservoir in central Massachusetts that’s home to submerged towns…

Drought in the Nueces River basin is reducing reservoir levels, leaving residents and industry in the Corpus Christi area facing…