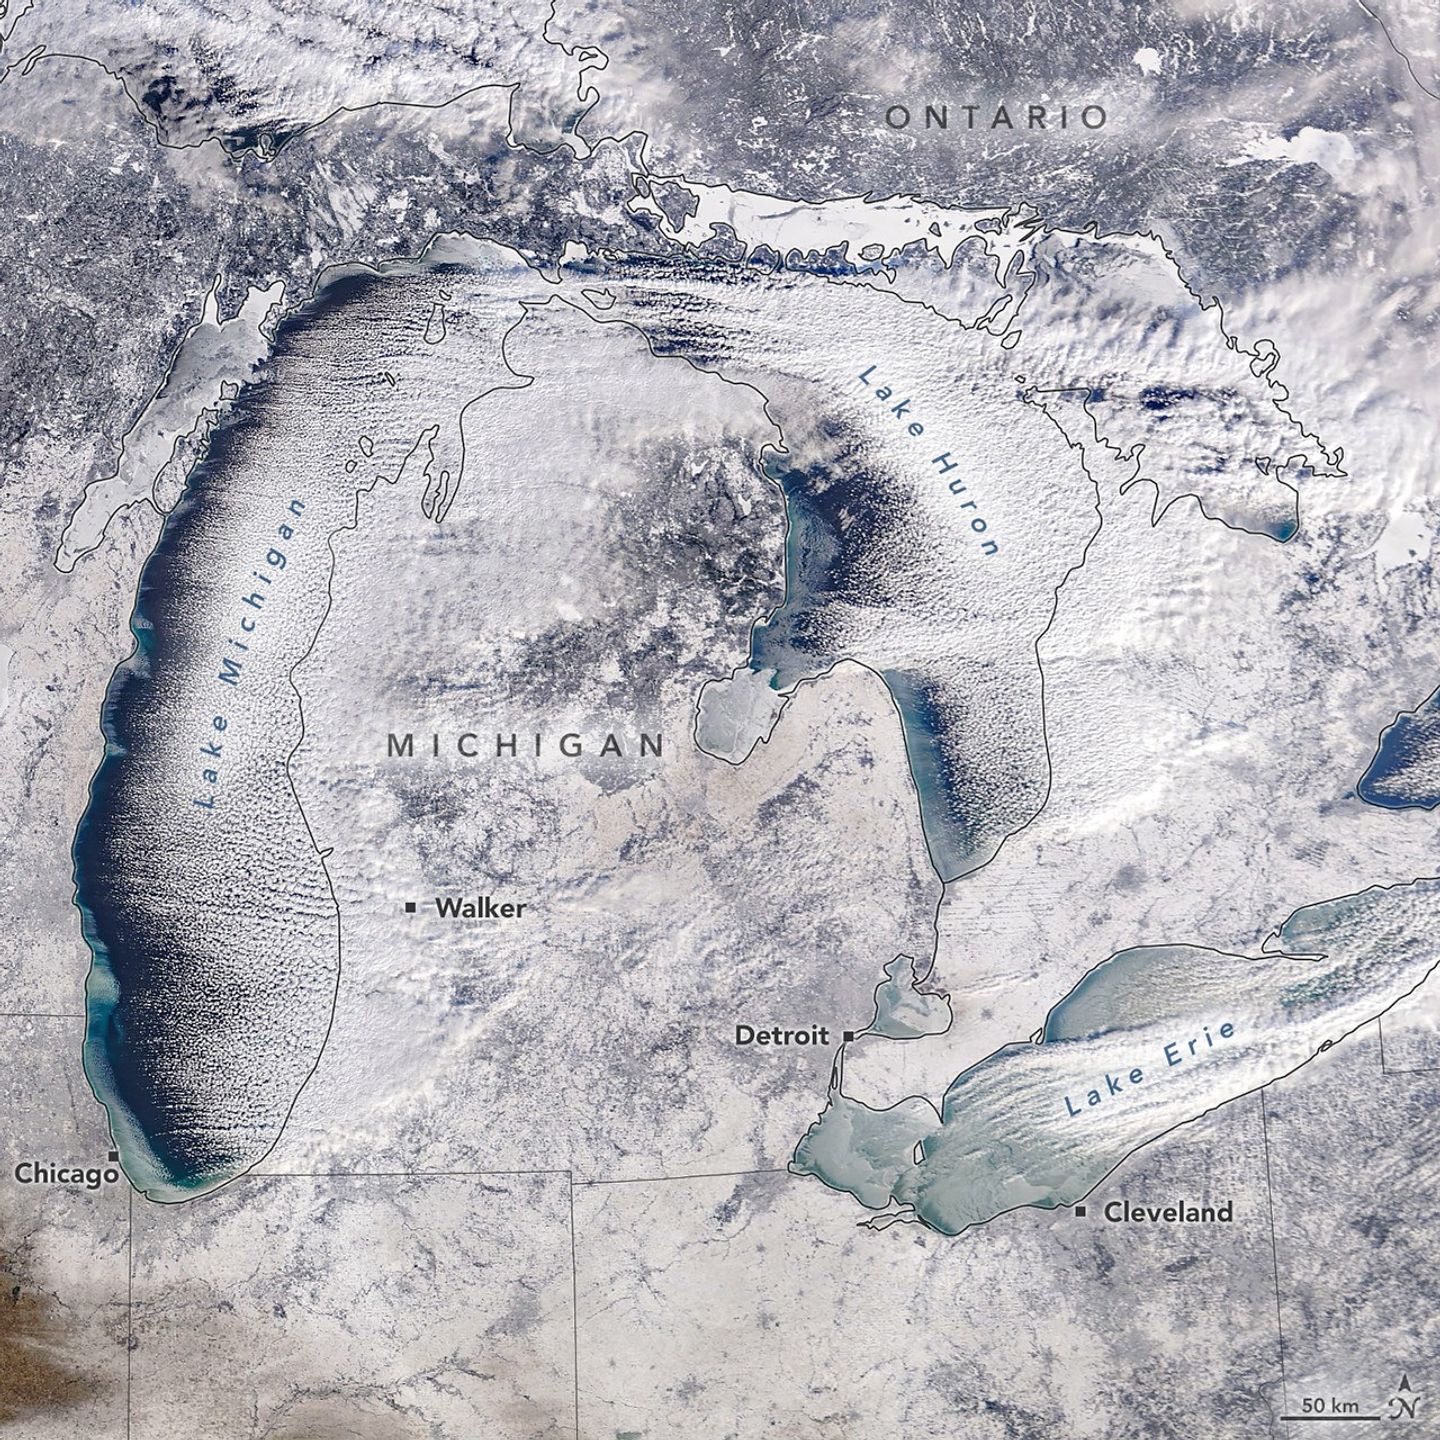
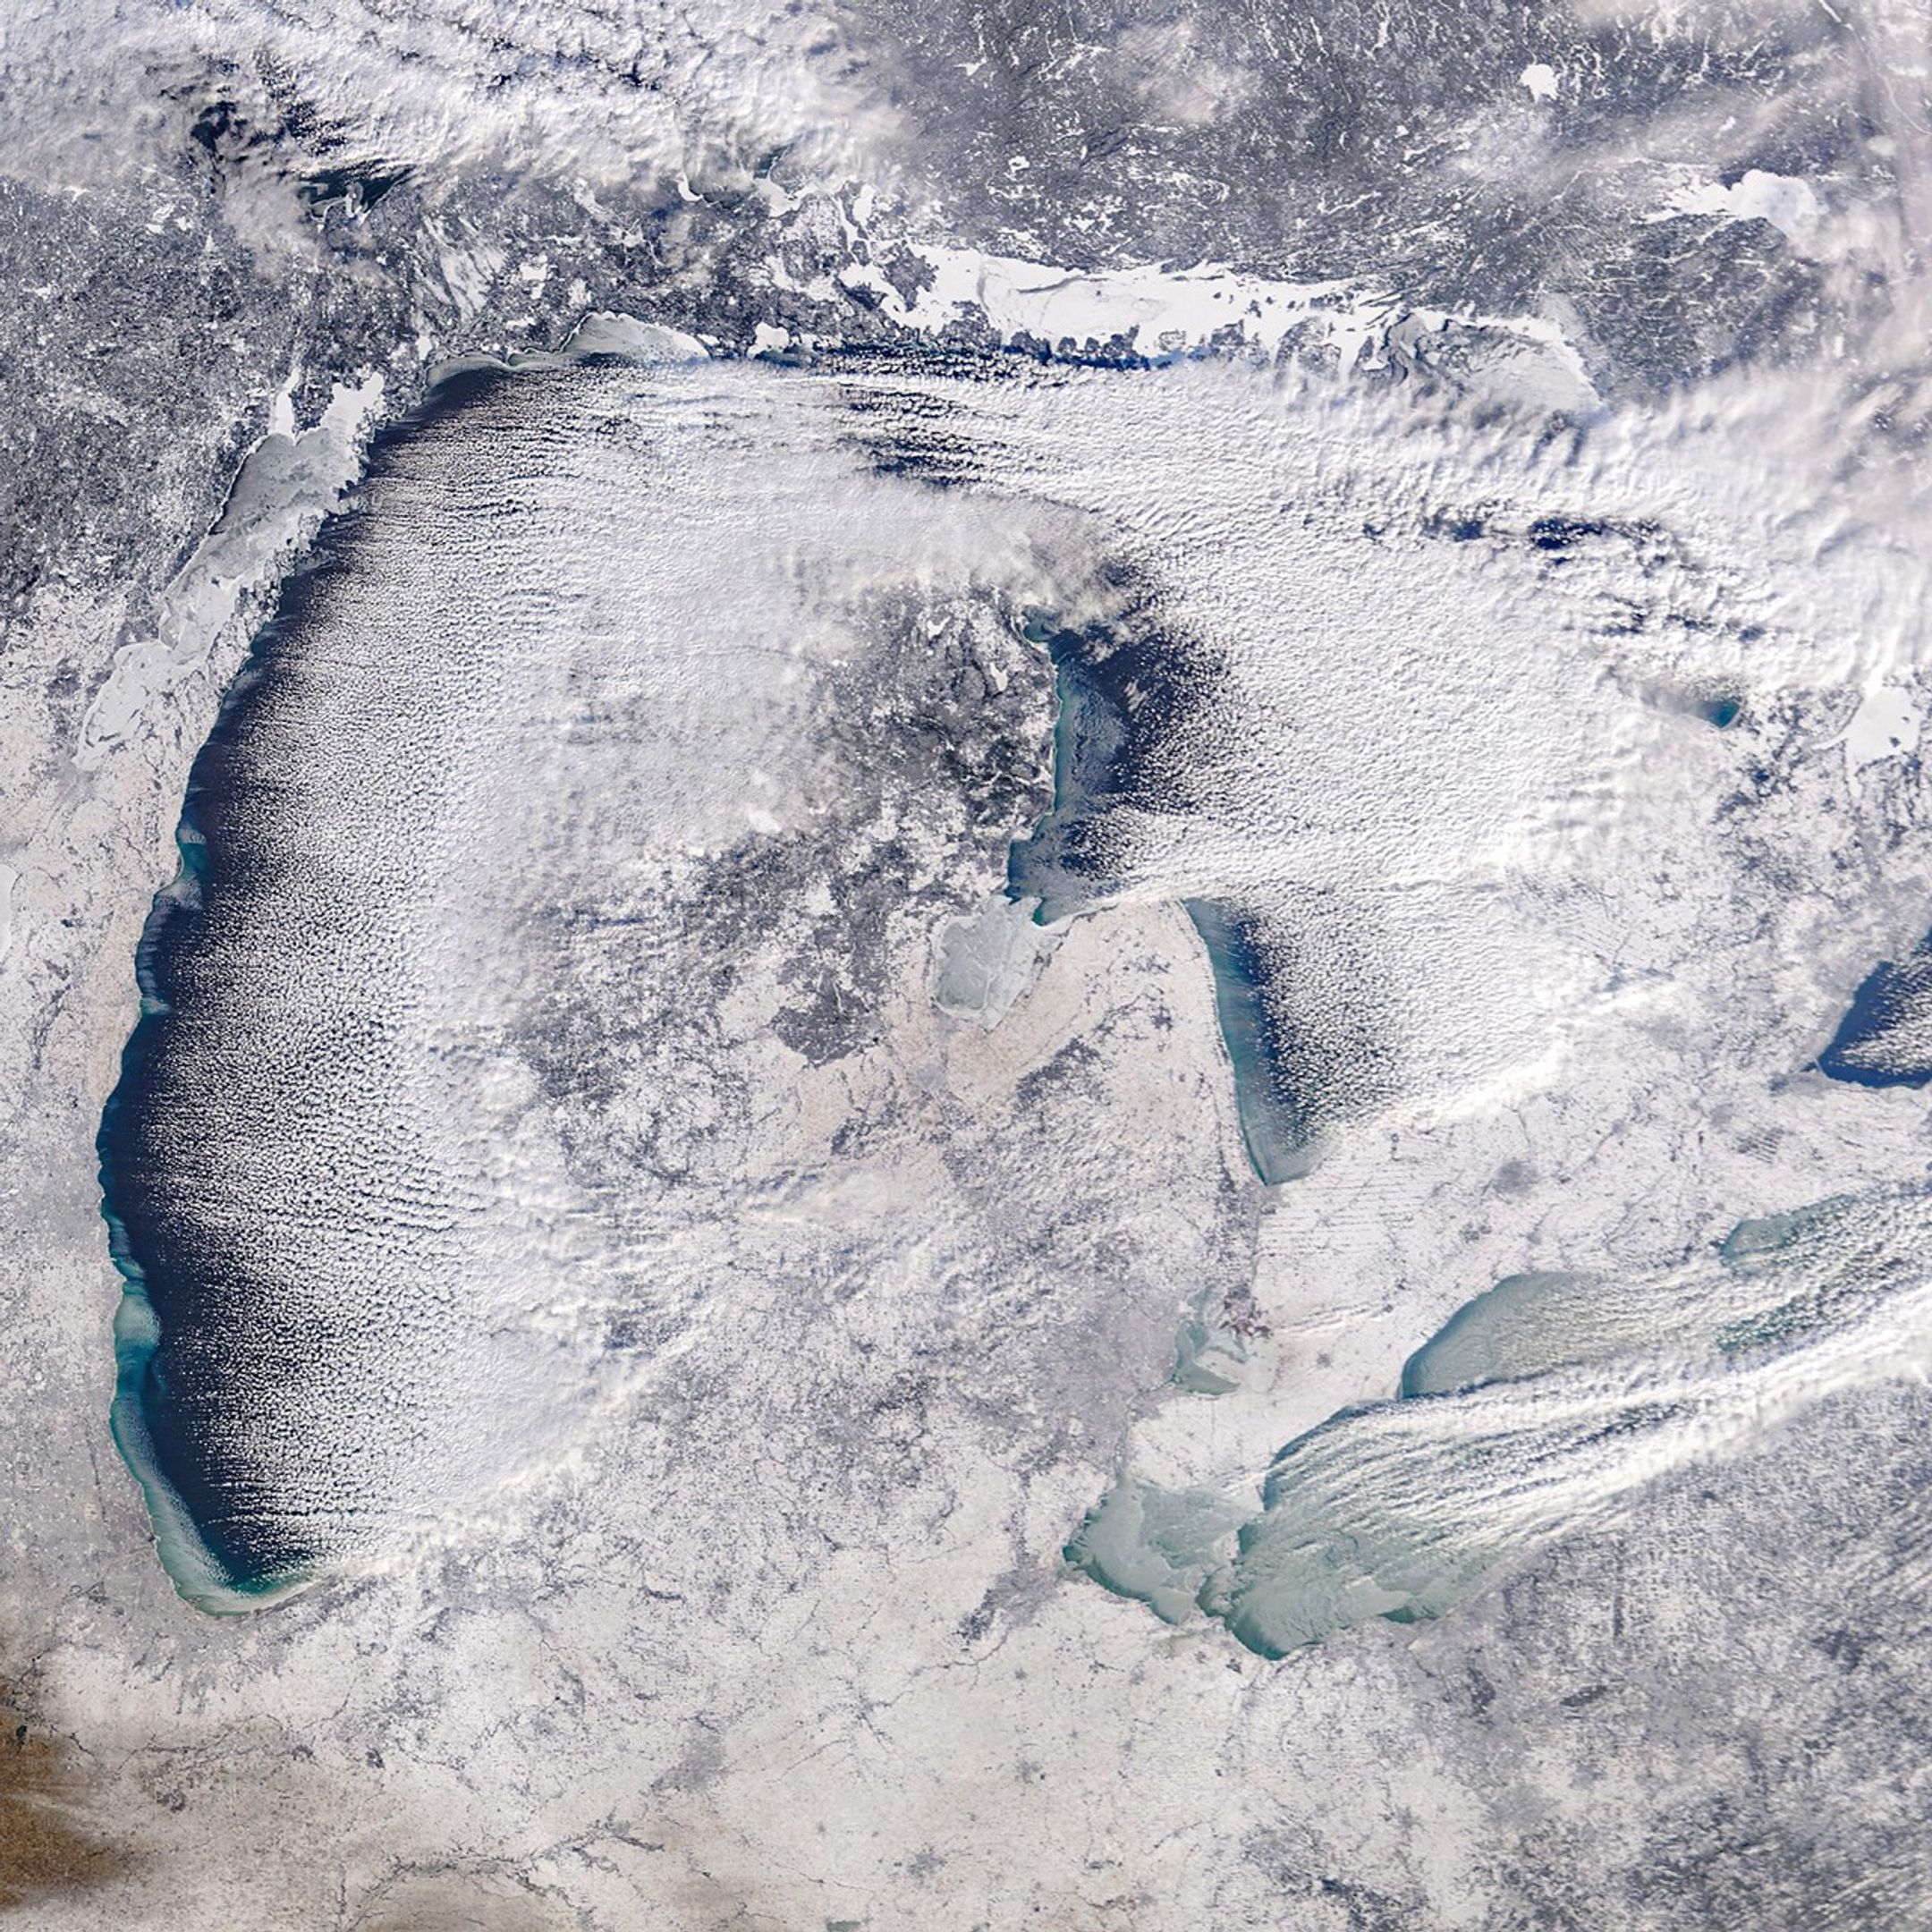
A winter chill descended on the Great Lakes region of North America in January 2026. Some of the effects were apparent in this satellite image as newly formed lake ice and a fresh layer of snow. The image, acquired by the MODIS (Moderate Resolution Imaging Spectroradiometer) instrument on NASA’s Terra satellite, shows the region on the morning of January 20, 2026.
In the days prior, a winter storm blanketed many parts of western Michigan near the lake with nearly a foot of snow, according to the National Weather Service. West of Walker, snowfall totals surpassed that amount, reaching nearly 14 inches (36 centimeters). The storm’s effects extended beyond Michigan as well, including blizzard conditions in parts of Ontario east of Lake Huron.
Lake effect snow is common in the Great Lakes area during late fall and winter, occurring when cold air moves over relatively warm, unfrozen water. As the air picks up heat and moisture, it rises to form narrow cloud bands that can produce heavy snowfall.
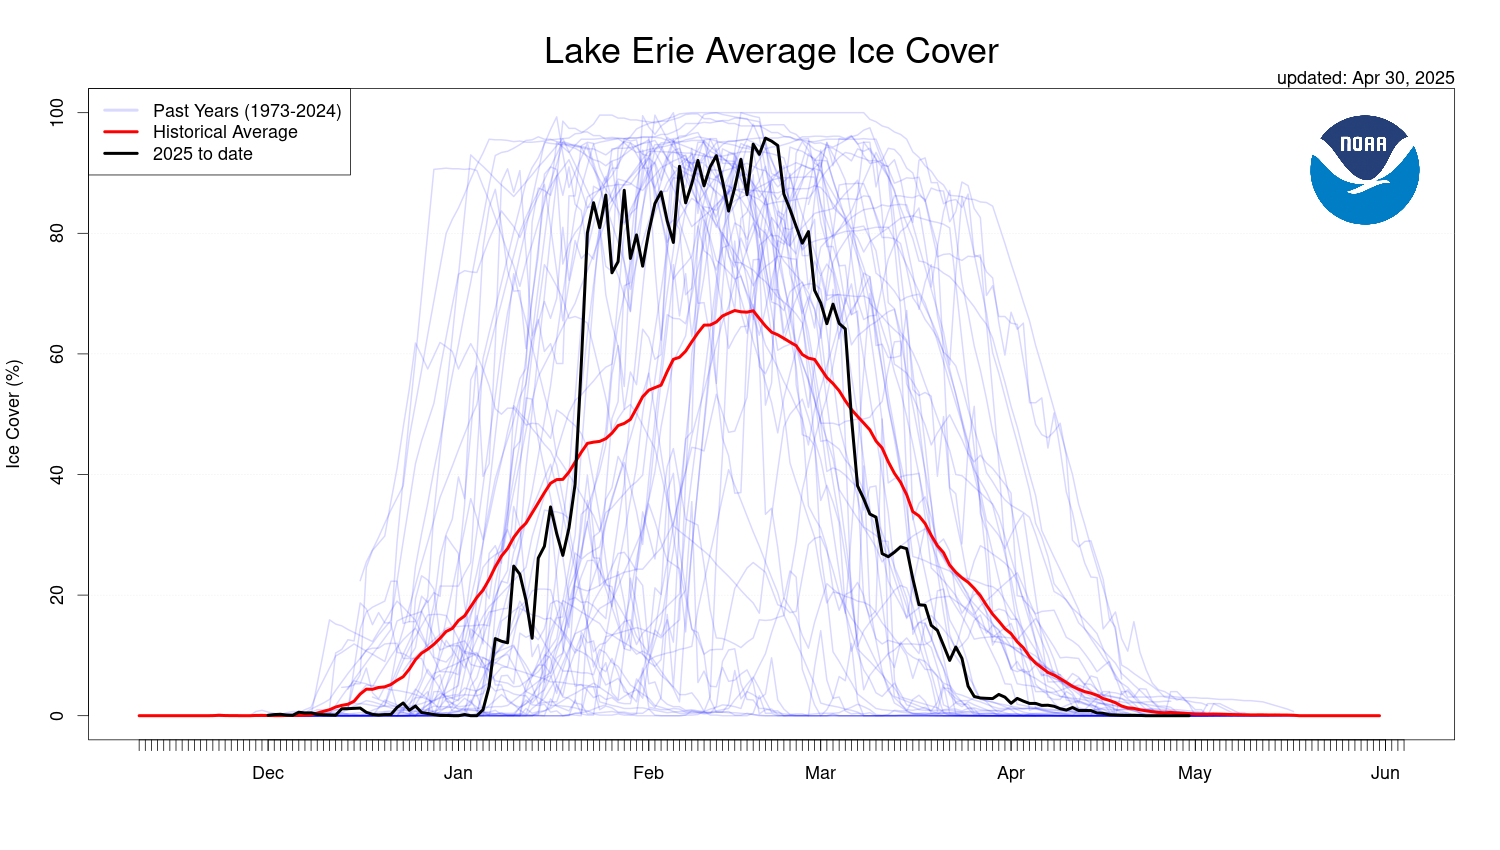
The air over Lake Erie was still moist enough for clouds to form, though the amount of open water on this lake has decreased sharply in recent days. Around mid-month, during a period of unseasonably warm air temperatures, ice coverage dropped to cover about 2 percent of the lake, according to the NOAA Great Lakes Environmental Research Laboratory. It then spiked to nearly 85 percent on January 21 after temperatures plummeted.
The frigid temperatures were brought about by an Arctic cold front that moved across the region. In Cleveland, for instance, the weather service issued a cold weather advisory on January 19 for wind chills as low as minus 15 to 20 degrees Fahrenheit. On that day, even colder wind chills were reported in the area around Chicago. Forecasts called for another round of cold Arctic air to spill over the Great Plains and Eastern U.S. over the coming weekend, accompanied by heavy snow.
NASA Earth Observatory image by Michala Garrison, using MODIS data from NASA EOSDIS LANCE and GIBS/Worldview. Story by Kathryn Hansen.
It has been an eventful few months for the Northern Hemisphere atmosphere. An unusually early sudden stratospheric warming episode in late November appears to have factored into a weakened and distorted polar vortex at times in December, likely causing extra waviness in the polar jet stream. This helped fuel extensive intrusions of frigid air into the mid-latitudes, contributing to cold snaps in North America, Europe, and Asia, and priming the atmosphere for disruptive winter storms in January.
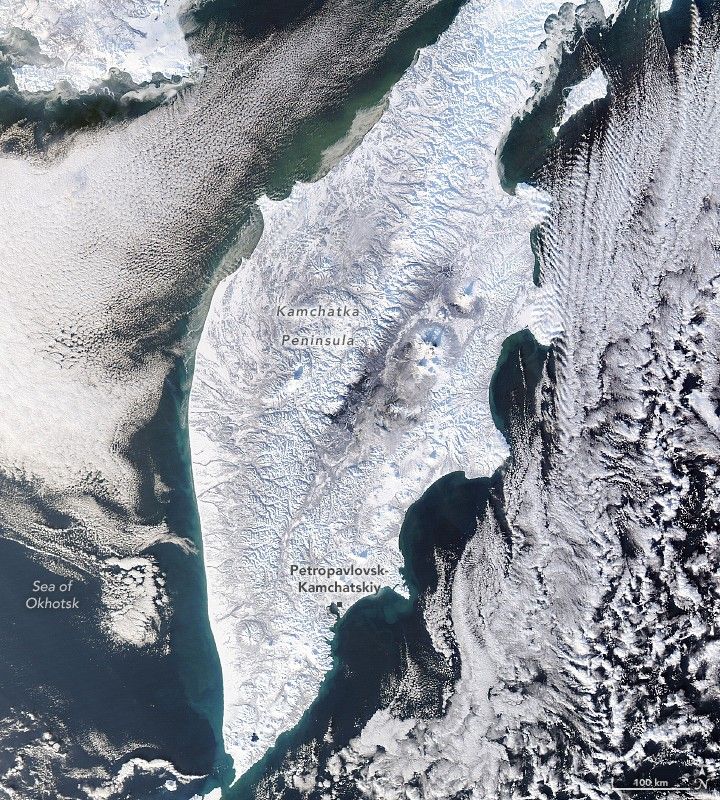
Russia’s Kamchatka Peninsula has been among the areas hit hard by cold and snowy weather in December and January. More than 2 meters (7 feet) of snow fell in the first two weeks of January, following 3.7 meters in December, according to news reports. Together, these totals make it one of the snowiest periods the peninsula has seen since the 1970s, according to Kamchatka’s Hydrometeorology Center. The onslaught brought Petropavlovsk-Kamchatsky, the regional capital, to a standstill, with reports of large snowdrifts burying cars and blocking access to buildings and infrastructure.
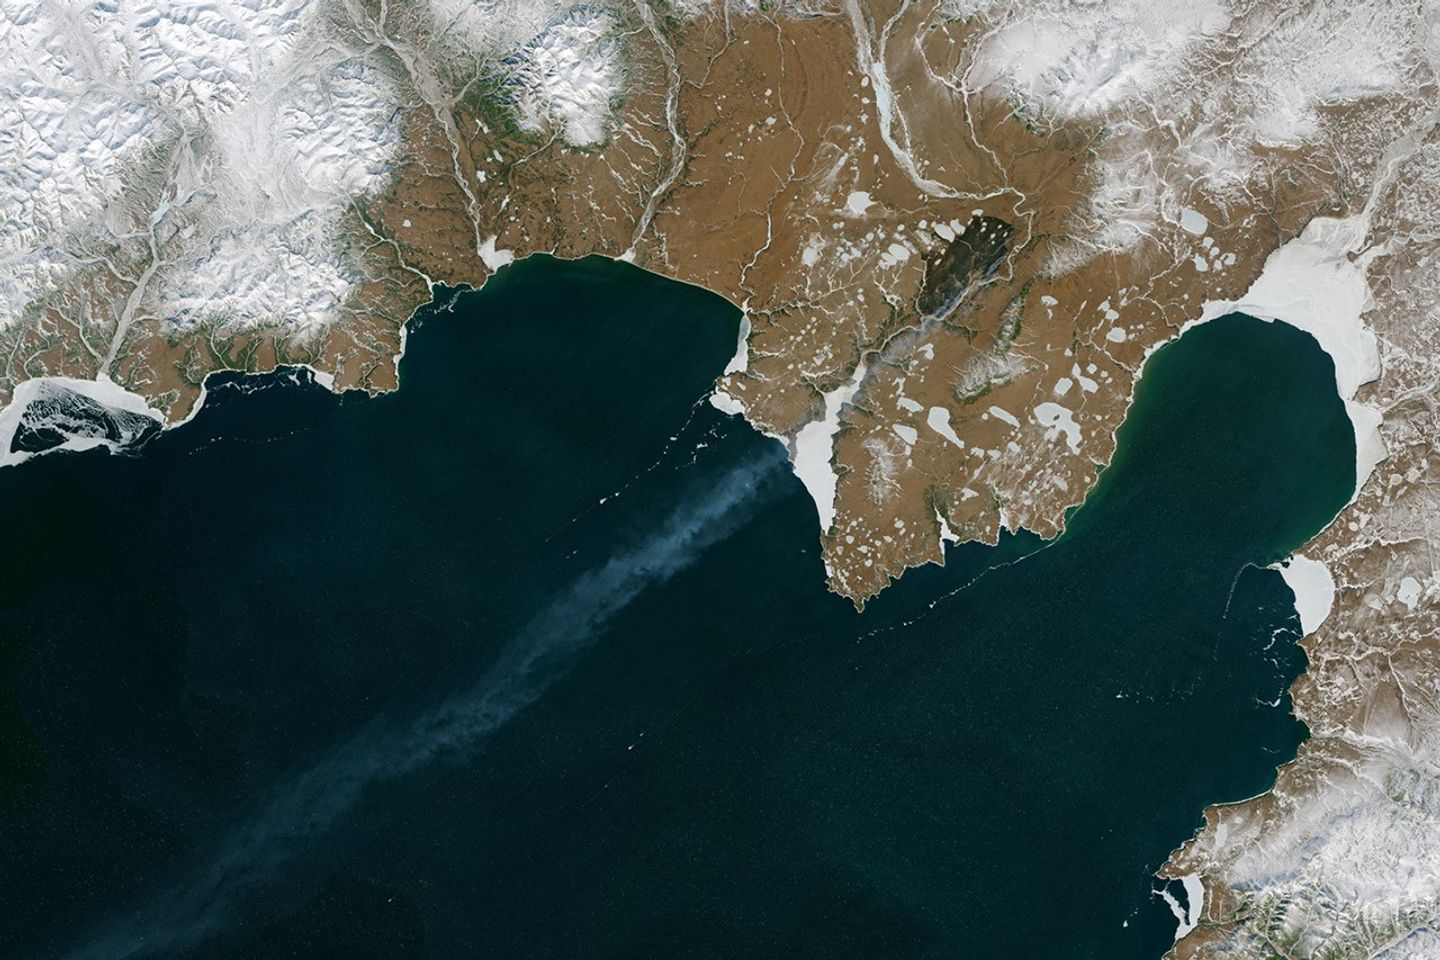
This image, acquired by the MODIS (Moderate Resolution Imaging Spectroradiometer) instrument on NASA’s Aqua satellite, shows fresh snow blanketing the peninsula’s rugged terrain on January 17, 2026. Several circular, snow-covered volcanic peaks are visible across the peninsula, one of the most volcanically active areas in the world. Petropavlovsk-Kamchatsky, home to more than 160,000 people, sits along Avacha Bay—a deep, sheltered bay formed by a combination of tectonic, volcanic, and glacial activity.
NASA Earth Observatory image by Lauren Dauphin, using MODIS data from NASA EOSDIS LANCE and GIBS/Worldview. Story by Adam Voiland.
The peninsula in eastern Siberia features rugged terrain with towering, snow-covered peaks and cloud-filled valleys stretching between the Pacific Ocean…
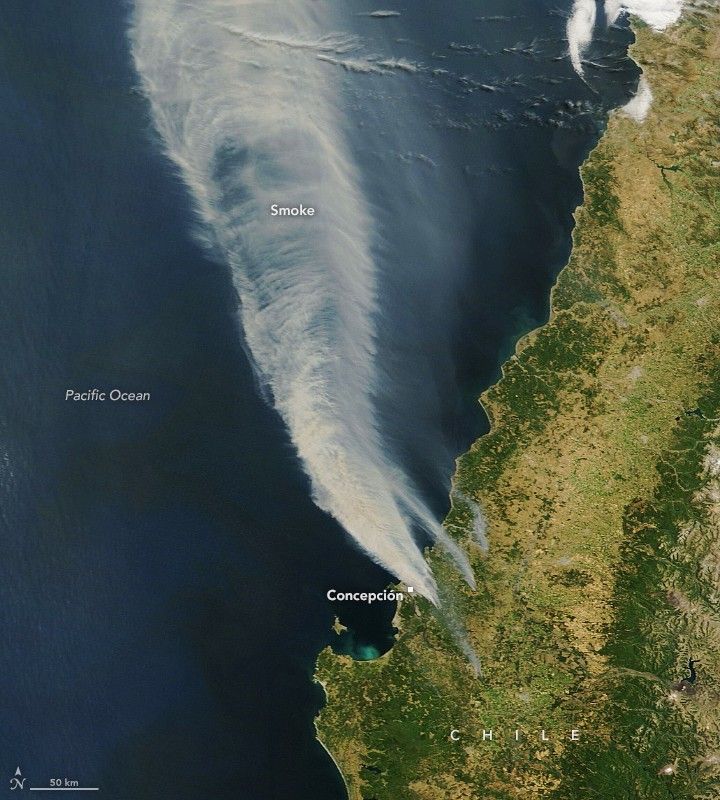
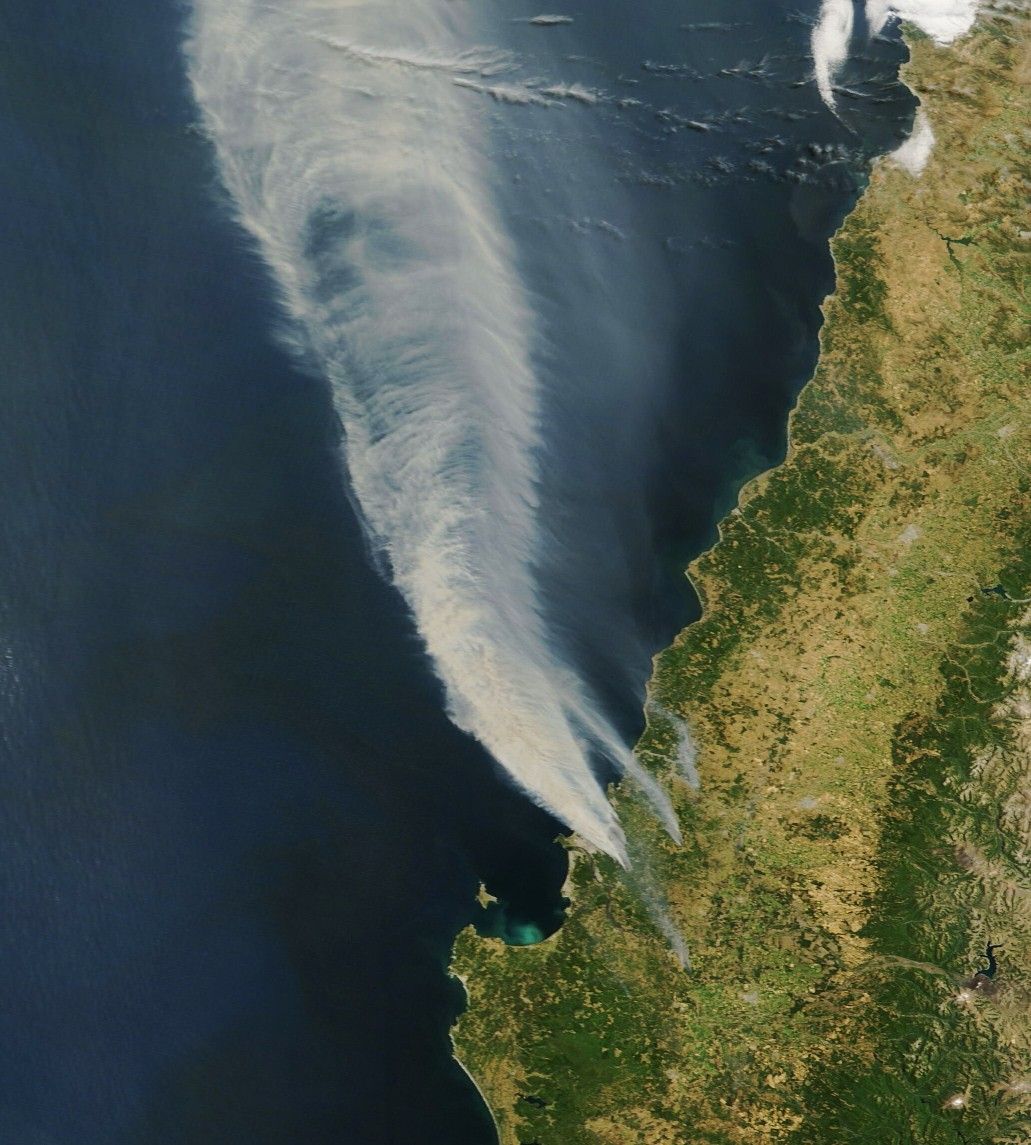
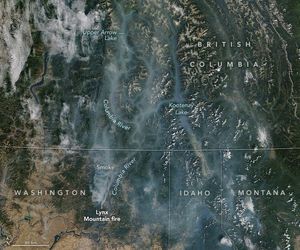
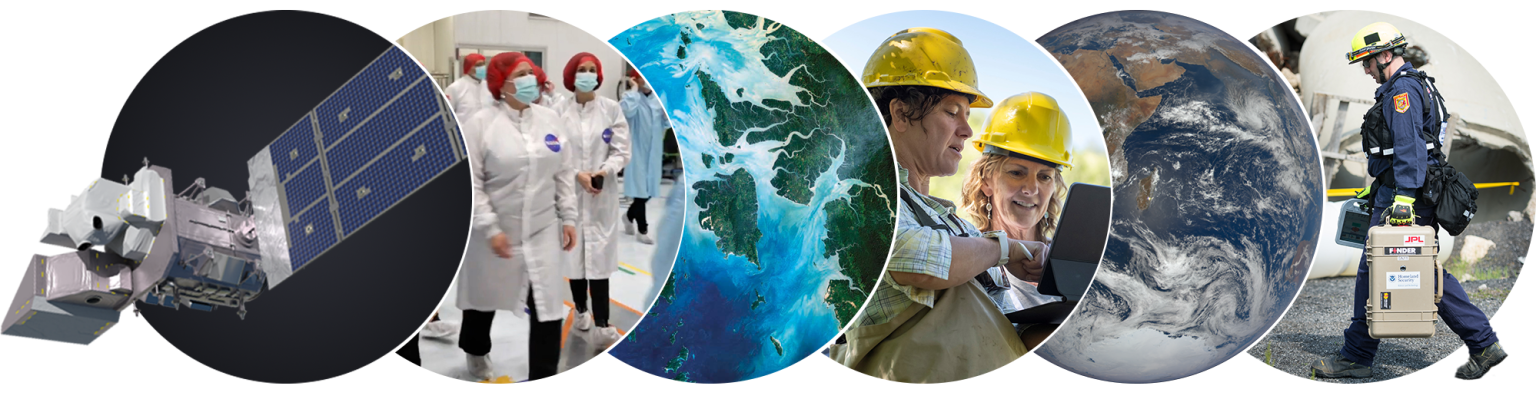
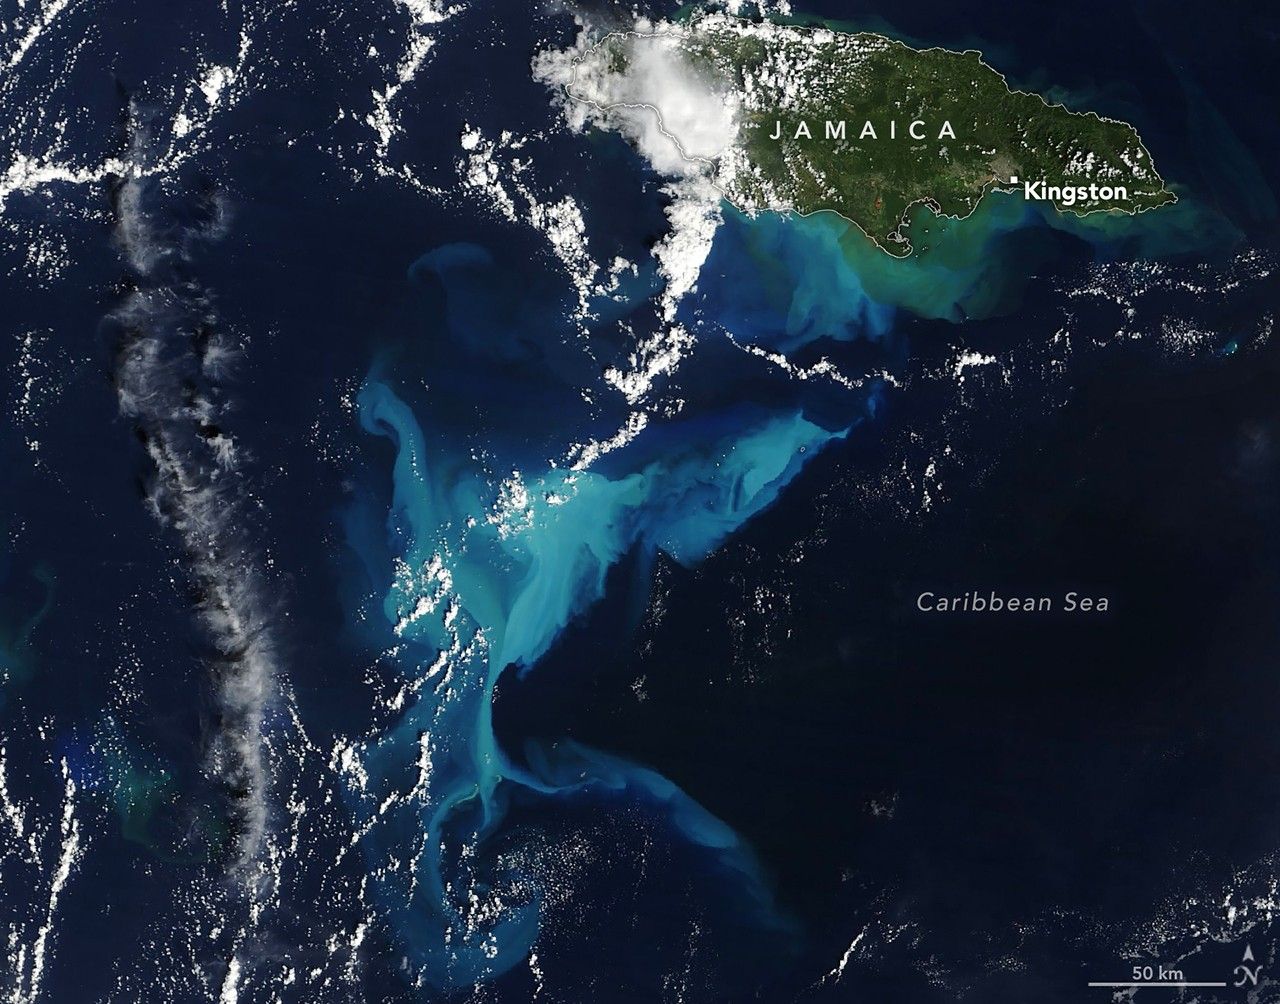
Wildland fires broke out amid hot and dry conditions in south-central Chile in mid-January 2026, prompting evacuations and causing extensive damage to infrastructure. As of January 20, the spate of deadly fires had burned more than 30,000 hectares (74,000 acres) in the country’s Biobío and Ñuble regions, according to Chile’s National Forestry Corporation.
The MODIS (Moderate Resolution Imaging Spectroradiometer) instrument on NASA’s Terra satellite captured this image of smoke billowing from multiple fires on January 18. Dozens of active fires in the area prompted the evacuation of 50,000 people and destroyed more than 300 homes, according to a January 19 report from Chile’s U.N. Resident Coordinator’s Office. Aerial and ground-based photographs showed neighborhoods in Concepción charred in the aftermath.
Gusty winds, along with temperatures that exceeded 38 degrees Celsius (100 degrees Fahrenheit) in places, fanned the flames and hampered firefighting efforts, according to news reports. Chile’s president declared a state of catastrophe in the Biobío and Ñuble regions, allowing more resources to go toward battling the blazes and assisting affected communities.
Other parts of South America also faced hot and dry conditions during the 2025–2026 summer, likely priming vegetation to burn. About 650 kilometers (400 miles) south of Concepción, firefighters in Argentina battled wildfires in and around Los Alerces National Park, home to rare stands of long-lived cypress trees.
NASA Earth Observatory image by Lauren Dauphin, using MODIS data from NASA EOSDIS LANCE and GIBS/Worldview. Story by Lindsey Doermann.
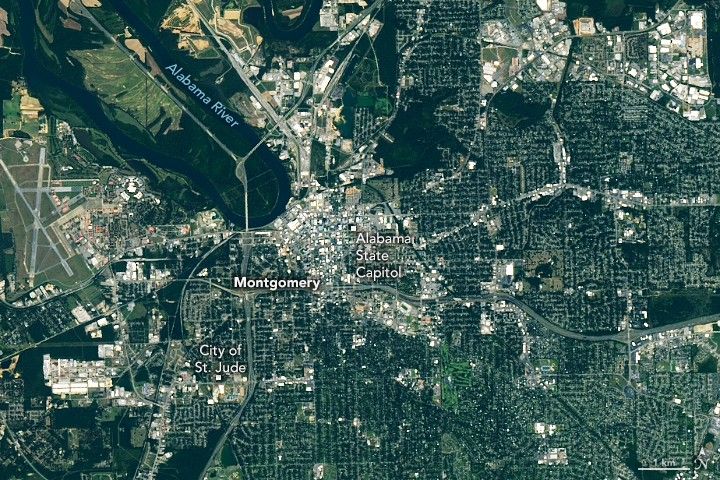
On March 24, 1965, a march from the campus of City of St. Jude to the Alabama state capitol building in Montgomery marked the culmination of a campaign that transformed voting rights in the United States.
The historic event included more than 25,000 civil rights activists—including more than 3,000 people who had walked from Selma—who gathered and camped at the Catholic social service complex during the final leg of the third and final Selma-to-Montgomery march. On that last night of the multi-day protest, marchers camped on a rain-soaked field at St. Jude and drank in the music of some of the day’s biggest stars, including Harry Belafonte, Joan Baez, Sam Cooke, Billy Eckstine, Tony Bennett, Leonard Bernstein, Odetta Holmes, Nina Simone, Sammy Davis Jr., and Peter, Paul and Mary.
Early the next morning, Dr. Martin Luther King Jr. led the procession of marchers on a five-mile route to the state capitol. Decades later, on September 16, 2025, the OLI (Operational Land Imager) on Landsat 8 captured this image of Montgomery, showing the ground the marchers covered. As documented in a series of aerial photographs, marchers departed from St. Jude in a long line, headed north toward downtown, turned east onto Dexter Avenue, passed the Baptist church where King was once a pastor, and concluded on the steps of the state capitol building (below).
March 25, 1965
From there, King gave his “How Long, Not Long” speech (also called Our God is Marching On), which many historians consider among his most consequential. On that warm, sunny day, he called out to the crowd assembled before him:
“I know you are asking today, ‘How long will it take?‘
Somebody’s asking, ‘How long will prejudice blind the visions of men, darken their understanding, and drive bright-eyed wisdom from her sacred throne?‘
Somebody’s asking, ‘When will wounded justice, lying prostrate on the streets of Selma and Birmingham and communities all over the South, be lifted from this dust of shame to reign supreme among the children of men?‘”
Then came his answer:
“I come to say to you this afternoon, however difficult the moment, however frustrating the hour, it will not be long, because ‘truth crushed to earth will rise again.‘”
Then, a bit later, he delivered a line that would become one of his most famous and enduring:
“How long? Not long, because the arc of the moral universe is long, but it bends toward justice.“
The Selma to Montgomery march proved to be a turning point in the Civil Rights Movement, helping galvanize public support for the passage of the Voting Rights Act of 1965 later that year, a law that prohibited racial discrimination in voting.
NASA Earth Observatory image by Lauren Dauphin, using Landsat data from the U.S. Geological Survey. Photograph by the Department of Defense via the Digital Public Library of America. Story by Adam Voiland.
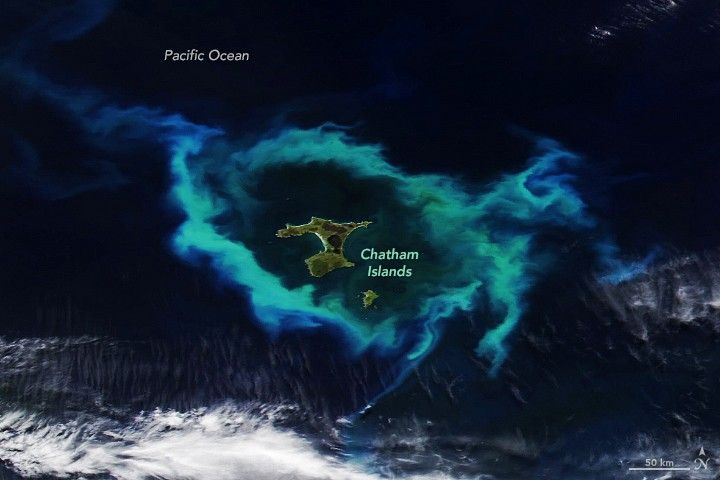
At about 800 kilometers (500 miles) east of New Zealand’s South Island, the sparsely populated Chatham Islands are rugged, remote, and often inconspicuous. In January 2026, however, a ring of bright green and blue swirls in the ocean put a natural spotlight on the far-flung specks of land.
A bloom of phytoplankton—tiny photosynthetic organisms that become visible to satellites when their numbers explode—encircled the Chatham Islands in austral summer. Surface currents and eddies carried the floating organisms into intricate wisps and swirls. The VIIRS (Visible Infrared Imaging Radiometer Suite) on the NOAA-20 satellite captured this image of the display on January 10, 2026.
The Chatham Islands sit on the Chatham Rise, an underwater plateau that extends eastward from the South Island of New Zealand. The top of the rise is relatively shallow and separates areas of deeper water to the north and south. These seafloor contours make blooms common along the Chatham Rise, where cold, nutrient-rich currents from the Antarctic and warm, nutrient-poor water from the subtropics converge. The well-mixed water, coupled with long daylight hours, can boost phytoplankton populations.
With phytoplankton at the base of the food web, the waters around the Chatham Islands support productive fisheries, with valuable species such as pāua, rock lobster, and blue cod. The region is also home to an array of marine mammals, including five seal species and 25 whale and dolphin species. Amid this abundance, however, the islands are a hotspot for whale and dolphin strandings, in which hundreds of animals are sometimes beached.
NASA Earth Observatory image by Lauren Dauphin, using VIIRS data from NASA EOSDIS LANCE, GIBS/Worldview, and the Joint Polar Satellite System (JPSS). Story by Lindsey Doermann.
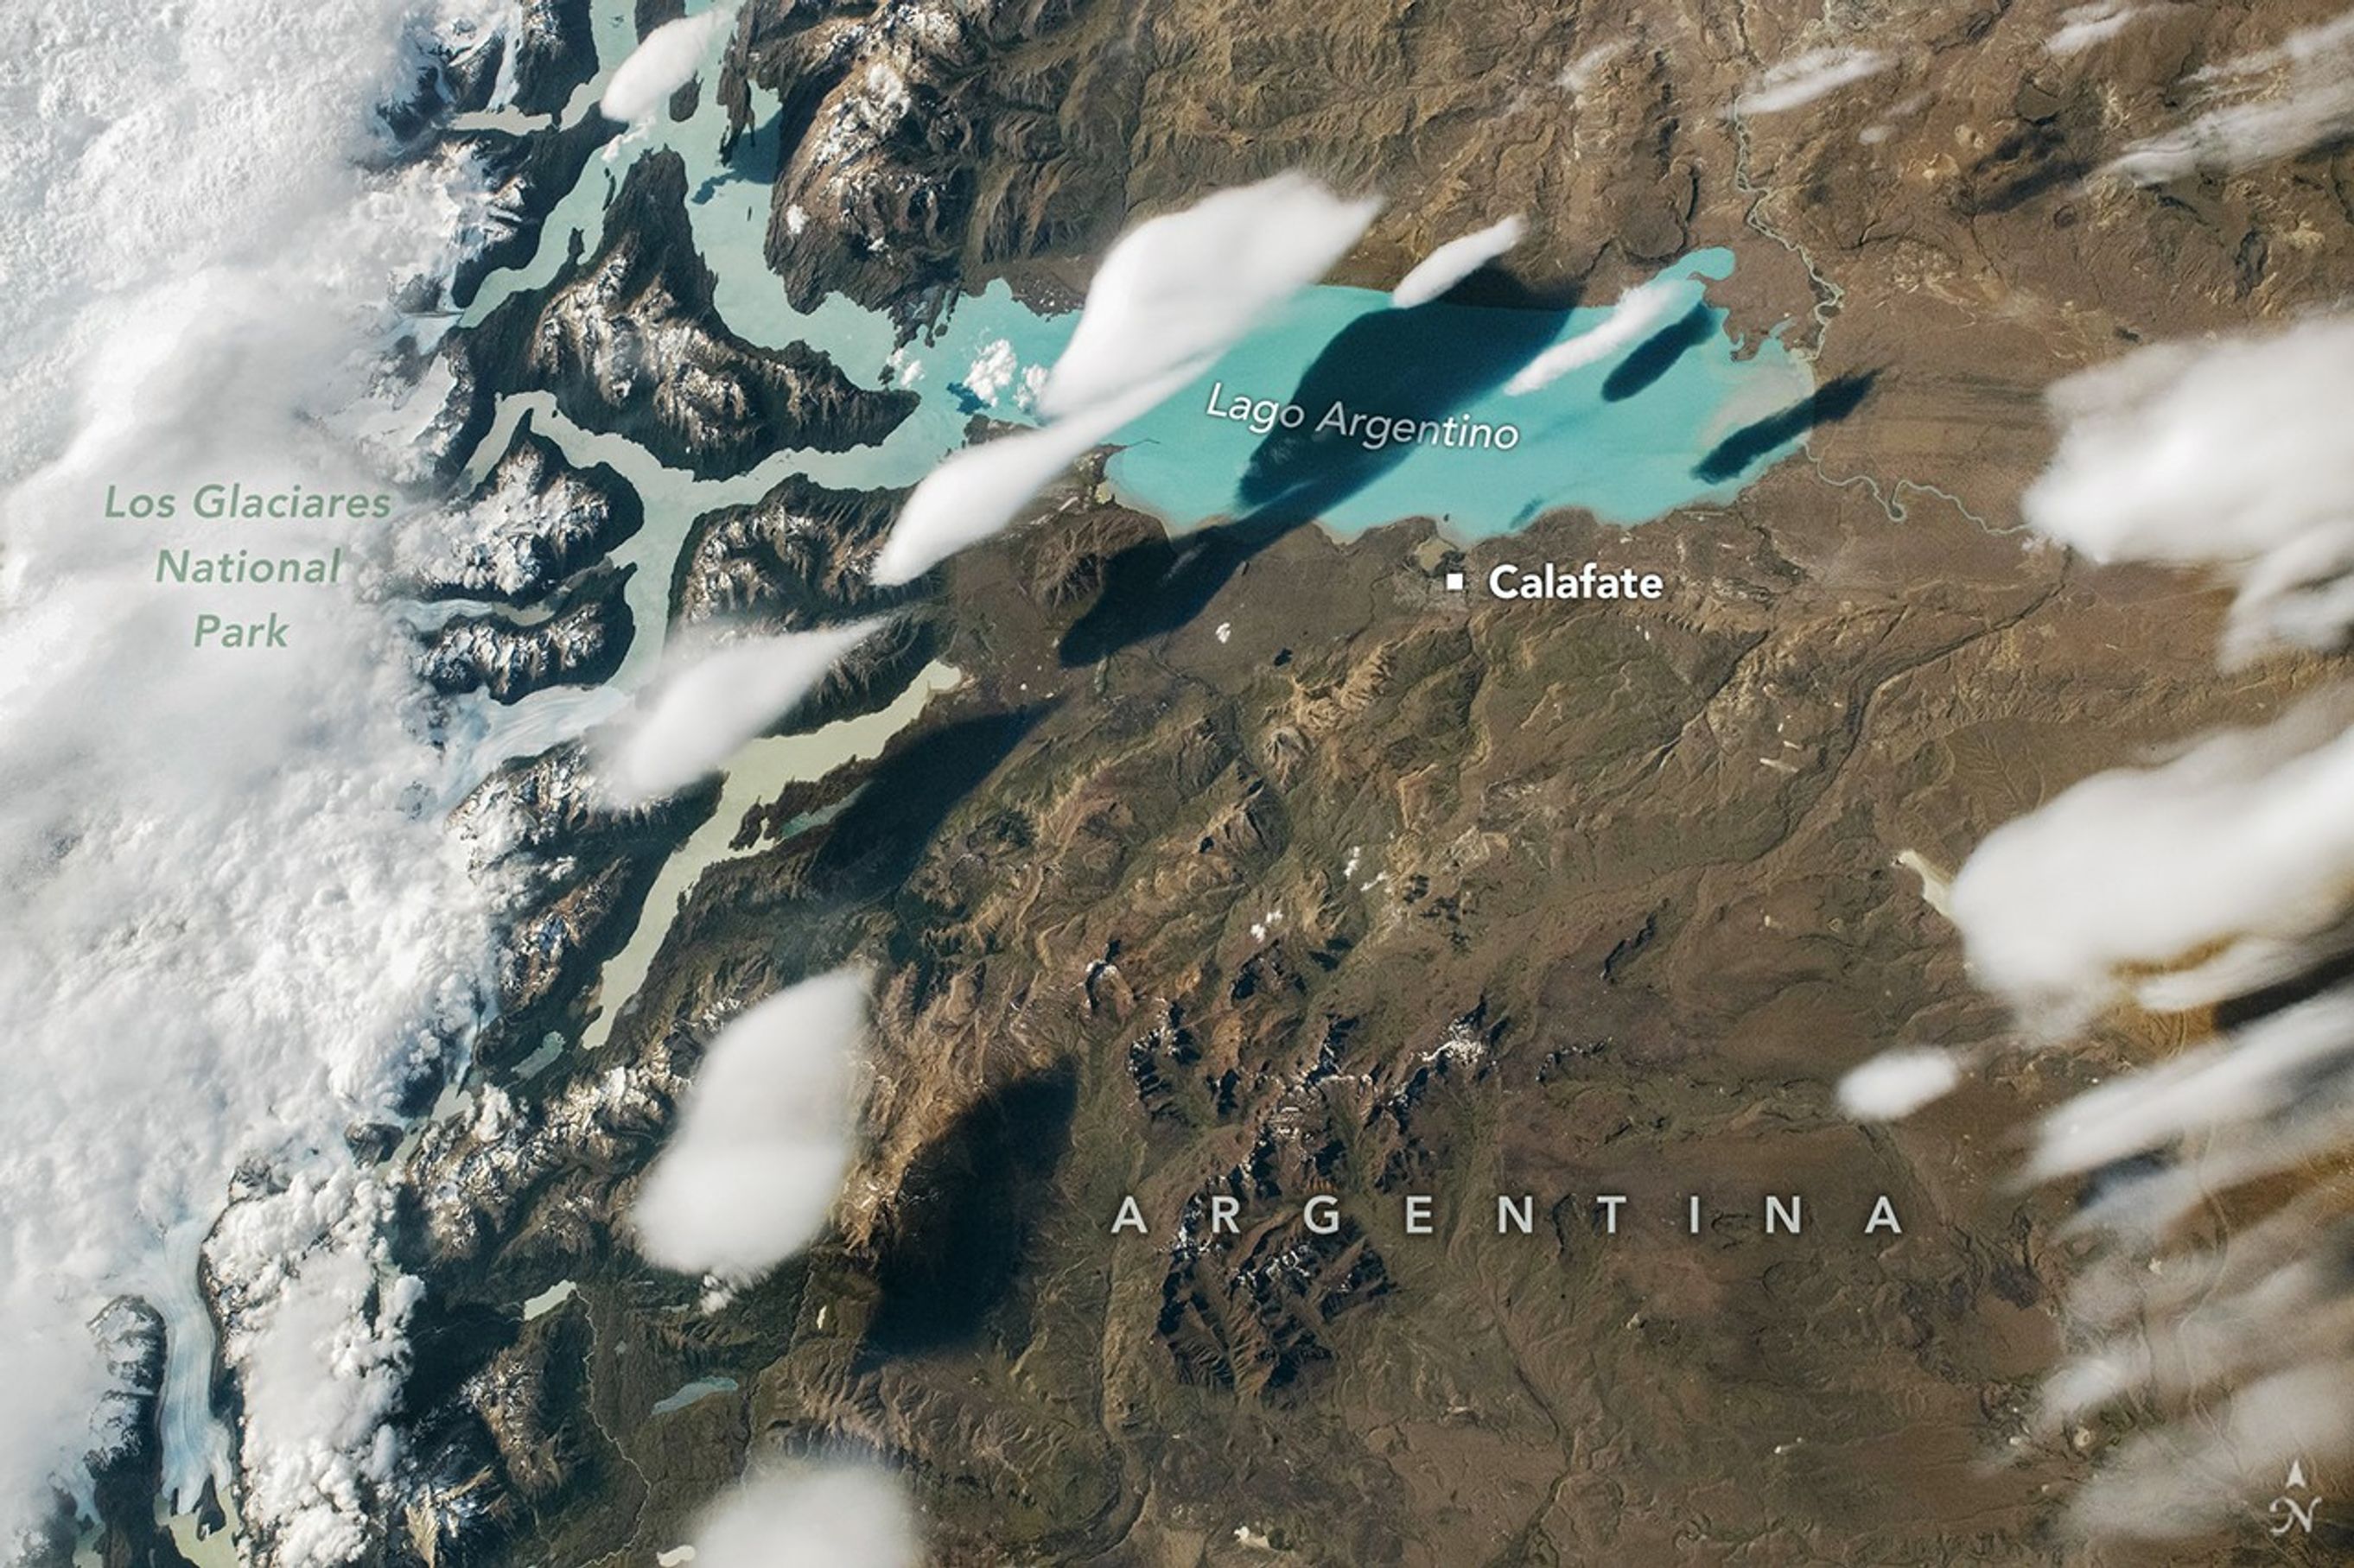
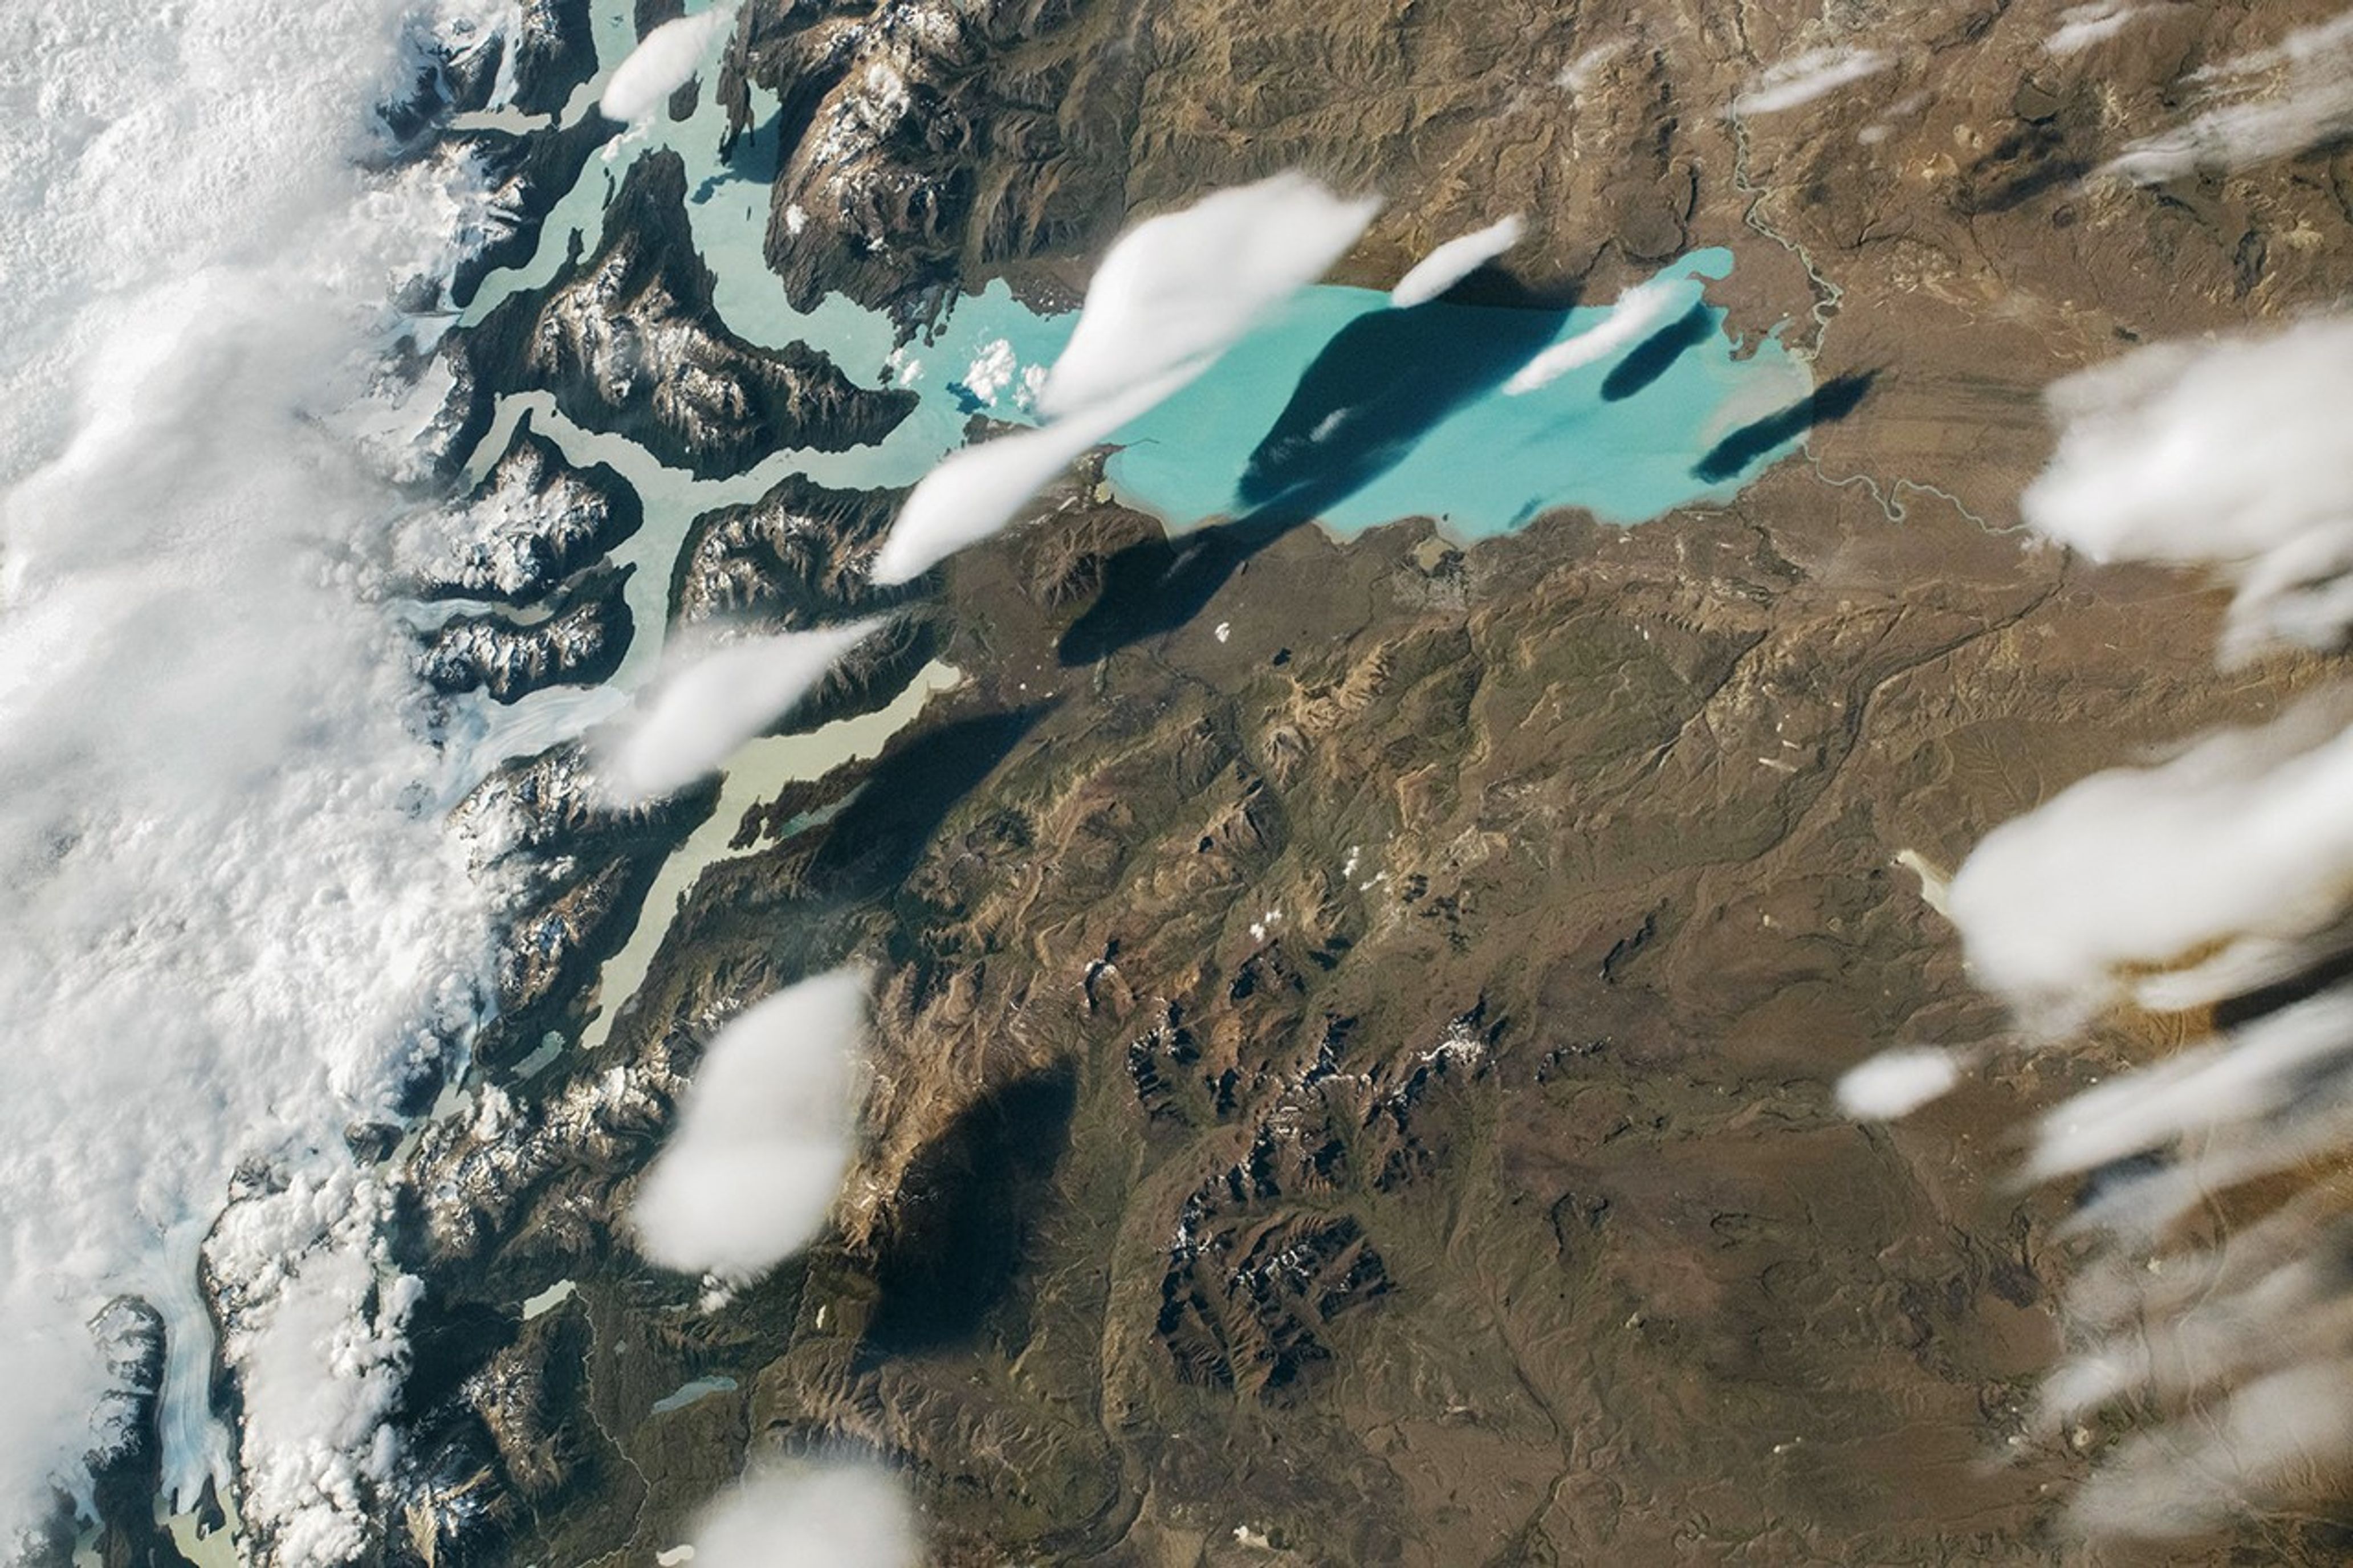
When an astronaut aboard the International Space Station snapped this photograph of Lago Argentino in Patagonia on December 27, 2025, a school of fish-shaped clouds lingered over the glacial lake’s teal waters. Determining the clouds’ type and origin from the photograph alone is challenging, but several NASA scientists and university researchers offered a theory after reviewing the image.
“The lens shape reminds me of lenticular clouds, which usually form near or over mountains,” said Maria Hakuba, a research scientist in the aerosols and clouds group at NASA’s Jet Propulsion Laboratory. “The edges of the cloud also look quite smooth rather than ‘fuzzy,’ which suggests they’re ice clouds that are relatively high up.”
Lenticular clouds form as a result of lee waves, which develop when prevailing winds are forced up and over a topographic barrier, often a mountain range, and when the overlying air is stable. Air expands and cools at the crest of the waves, causing vapor to condense and form cloud droplets. Conversely, air on the other side of the waves descends, warming the air and causing the cloud to evaporate. The result is a set of seemingly stationary clouds that hover in place downwind of mountains. Lenticular clouds are often eye-catching, sometimes described as having shapes like almonds, upside-down dinner plates, lentils, flying saucers, or stacks of pancakes.
Hazem Mahmoud, a data science lead at NASA’s Langley Research Center, agreed that the clouds were likely lenticular and offered additional insight. MODIS (Moderate Resolution Spectroradiometer) data suggest cloud-top altitudes near 9,200 meters (30,000 feet) and cloud-top temperatures around 220 Kelvin, along with relatively large particle sizes consistent with the presence of ice crystals, he said. “The high altitude and microphysical properties suggest Cirrocumulus lenticularis,” he said.
Strong surface-level winds common in Patagonia likely swept across the glacial lakes of Los Glaciares National Park, forcing unusually moist air over the Andes, producing the lens-shaped clouds. Sublimation—the conversion of ice directly into water vapor—of glacial ice likely contributed to their formation by adding extra moisture into the air, he added.
Wind shear and turbulence may have caused the elongated, trailing appearance that made the clouds resemble a school of fish, Mahmoud explained. These forces stretched and organized the clouds horizontally above the lake, while shadows cast onto the landscape accentuated their forms. “Together these clouds tell a remarkable story of interaction between the lake’s moisture source, the Andes’ dynamic topography, and atmospheric circulation,” he said.
Santiago Gassó, an atmospheric scientist at NASA’s Goddard Space Flight Center, agreed they were likely lenticular clouds, citing the environmental context and Patagonia’s reputation as a hotspot for lenticular cloud formation.
“Very often the clouds here are stationary and trapped by lee waves on the downwind side of the mountains,” Gassó said. “They often don’t precipitate because most of the moisture gets left on the west side of the mountain.” The stereotypical image of lenticular clouds is that they sit stationary at the top of mountains, but in reality, they tend to drift away “depending on the turbulence and flow,” he added.
All three scientists agreed that without analyzing more data, it’s hard to say definitively whether the cloud is lenticular or a type of cumulus. The challenge with a single astronaut photograph or satellite image is that we largely see the cloud-top properties, Mahmoud said. “If we also had lidar or cloud radar data, we could measure the vertical structure and thickness and more confidently differentiate a thin lenticular layer from a deep cumulonimbus column,” he said.
Whether cumulus or lenticular, it’s a coincidence that “fish” is the name atmospheric scientists sometimes use to describe formations of a type of shallow convective cloud found over the ocean. It was one of the patterns, along with “sugar,” “gravel,” and “flowers,” identified by a team of researchers who analyzed decades of MODIS cloud observations.
Readers with a penchant for cloud classification can participate in GLOBE Clouds, a GLOBE citizen science project that makes it possible for students and members of the public to contribute to NASA research projects. As part of the project, participants have the opportunity to use Clouds Wizard, a feature that guides users through cloud identification with a series of interactive questions, animations, and photos.
Astronaut photograph ISS074-E-8940 was acquired on December 27, 2025, with a Nikon Z9 digital camera using a focal length of 116 millimeters. It is provided by the ISS Crew Earth Observations Facility and the Earth Science and Remote Sensing Unit at NASA Johnson Space Center. The image was taken by a member of the Expedition 74 crew. The image has been cropped and enhanced to improve contrast, and lens artifacts have been removed. The International Space Station Program supports the laboratory as part of the ISS National Lab to help astronauts take pictures of Earth that will be of the greatest value to scientists and the public, and to make those images freely available on the Internet. Additional images taken by astronauts and cosmonauts can be viewed at the NASA/JSC Gateway to Astronaut Photography of Earth.Story by Adam Voiland.
The peninsula in eastern Siberia features rugged terrain with towering, snow-covered peaks and cloud-filled valleys stretching between the Pacific Ocean…
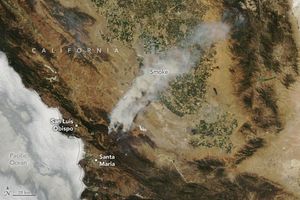
The Operational Land Imager (OLI) on Landsat 8 captured this image of a fire burning in the Magadan Oblast district of Siberia on April 8, 2019.
NASA Earth Observatory image by Joshua Stevens, using Landsat data from the U.S. Geological Survey.
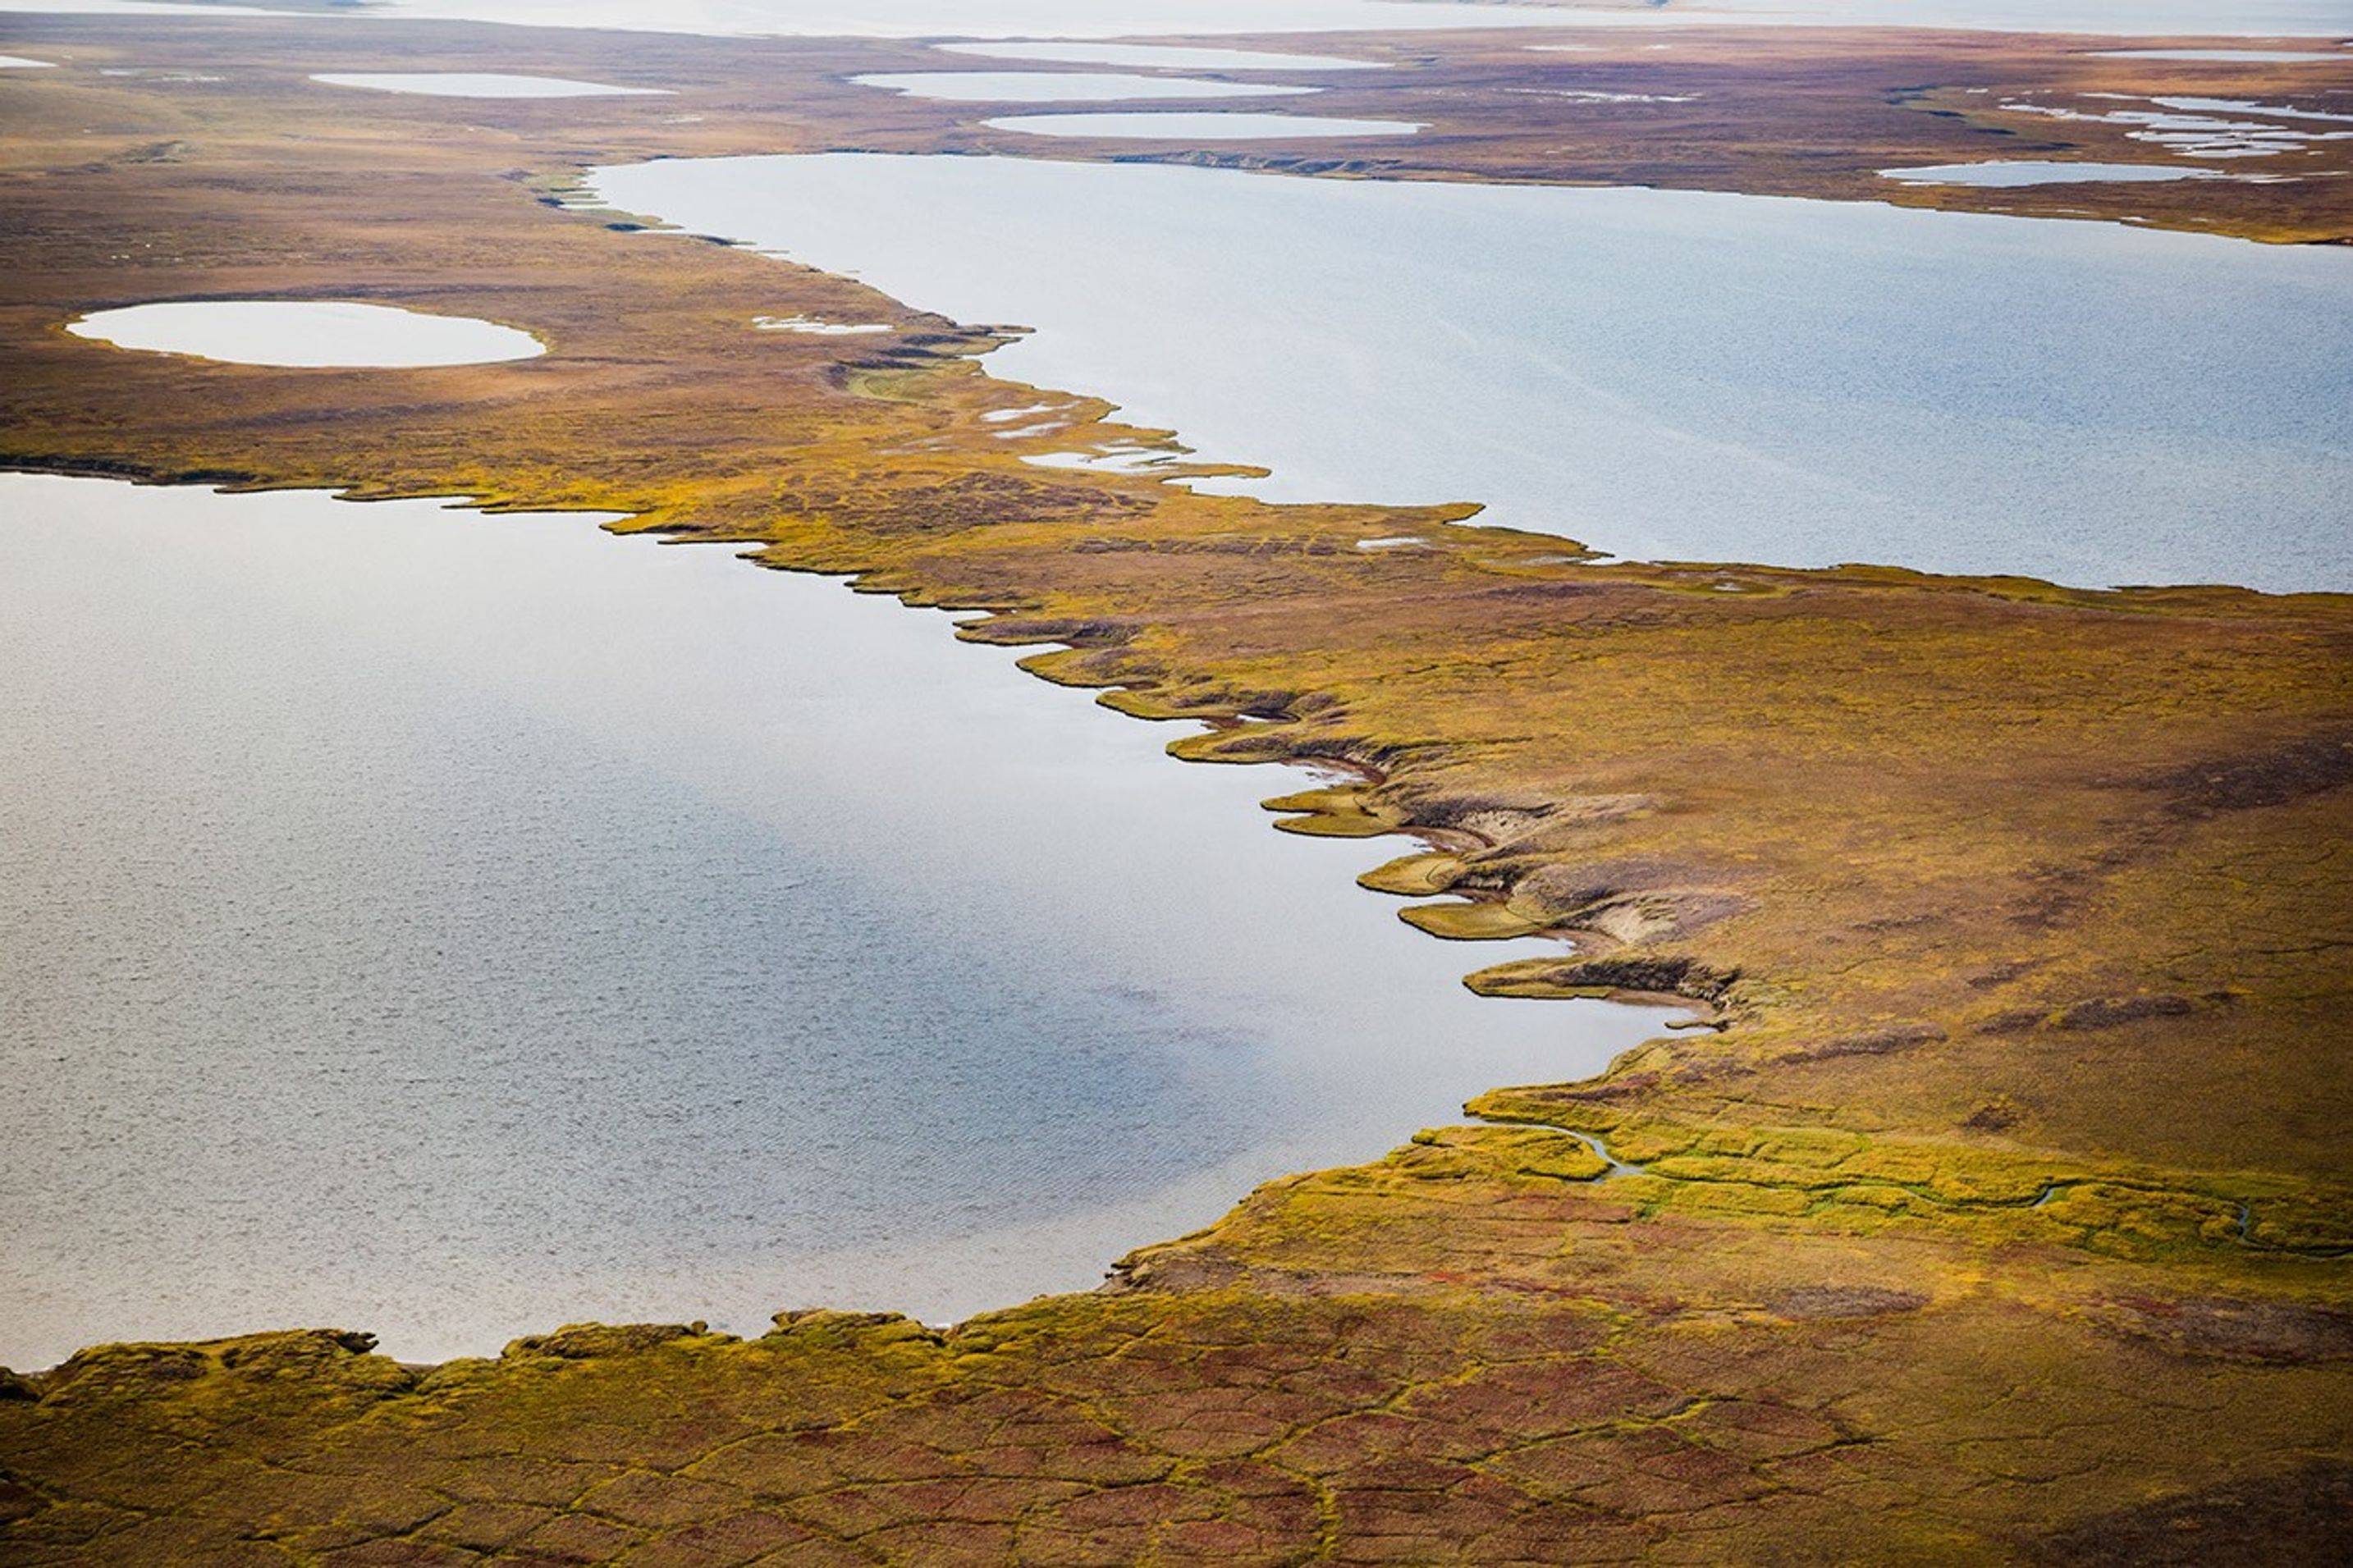
The number of wildland fires burning in the Arctic is on the rise, according to NASA researchers. Moreover, these blazes are burning larger, hotter, and longer than they did in previous decades.
These trends are closely tied to the region’s rapidly changing climate. The Arctic is warming nearly four times faster than the global average, a shift that directly impacts rain and snow in the region and decreases soil moisture, both of which make the landscape more flammable. Lightning, the primary ignition source of Arctic fires, is also occurring farther north. These findings are detailed in a report published in 2025 by the Arctic Monitoring and Assessment Programme (AMAP), a working group of the Arctic Council.
“Fire has always been a part of boreal and Arctic landscapes, but now it’s starting to act in more extreme ways that mimic what we’ve seen in the temperate and the tropical areas,” said Jessica McCarty, Deputy Earth Science Division Chief at NASA’s Ames Research Center and an Arctic fire specialist. McCarty, the report’s lead author, worked as part of an international team for AMAP.
But it’s not just the number of fires that concerns scientists; it’s how hot they burn.
“It’s the intensity that worries us the most because it has the most profound impact on how ecosystems are changing,” said Tatiana Loboda, chair of the Department of Geographical Sciences at the University of Maryland.
2002-2012
2012-2024
NASA Earth Observatory
NASA Earth Observatory
NASA Earth Observatory
NASA Earth Observatory
2002-2012
2012-2024
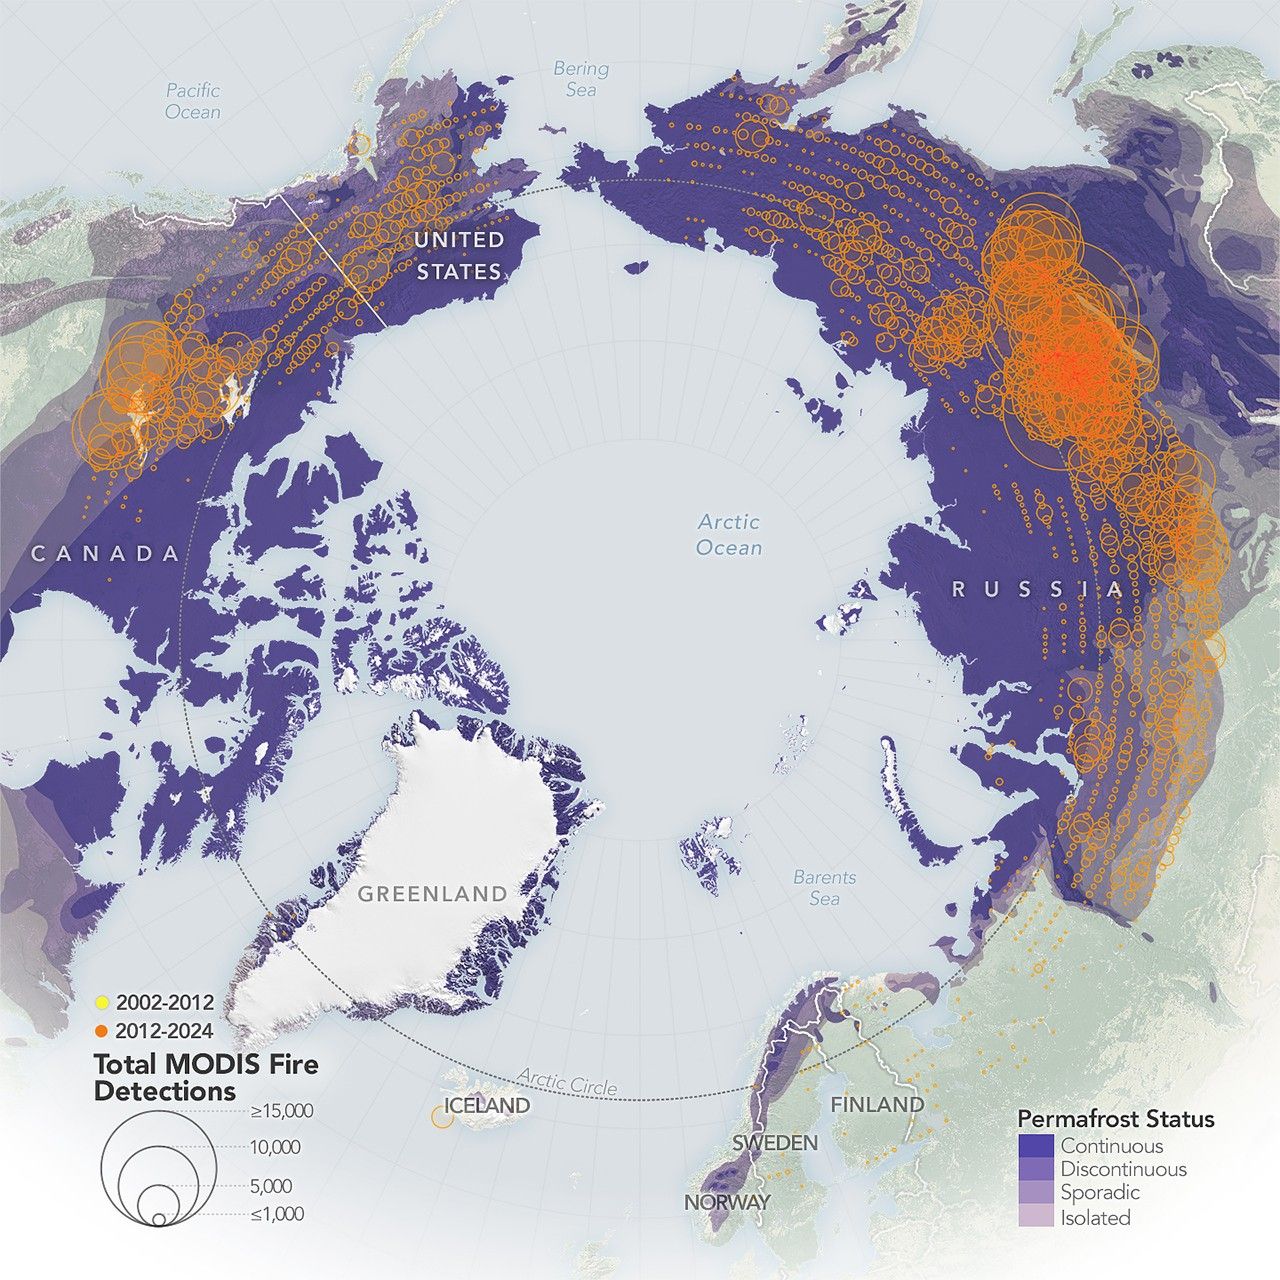
These maps show the number of fires detected by NASA’s MODIS instrument on the Terra and Aqua satellites from 2002 to 2012 (yellow) and 2012 to 2025 (orange), highlighting an increase in fire activity and a poleward shift over time.NASA Earth Observatory maps by Michala Garrison using data from NASA’s Fire Information for Resource Management System (FIRMS).
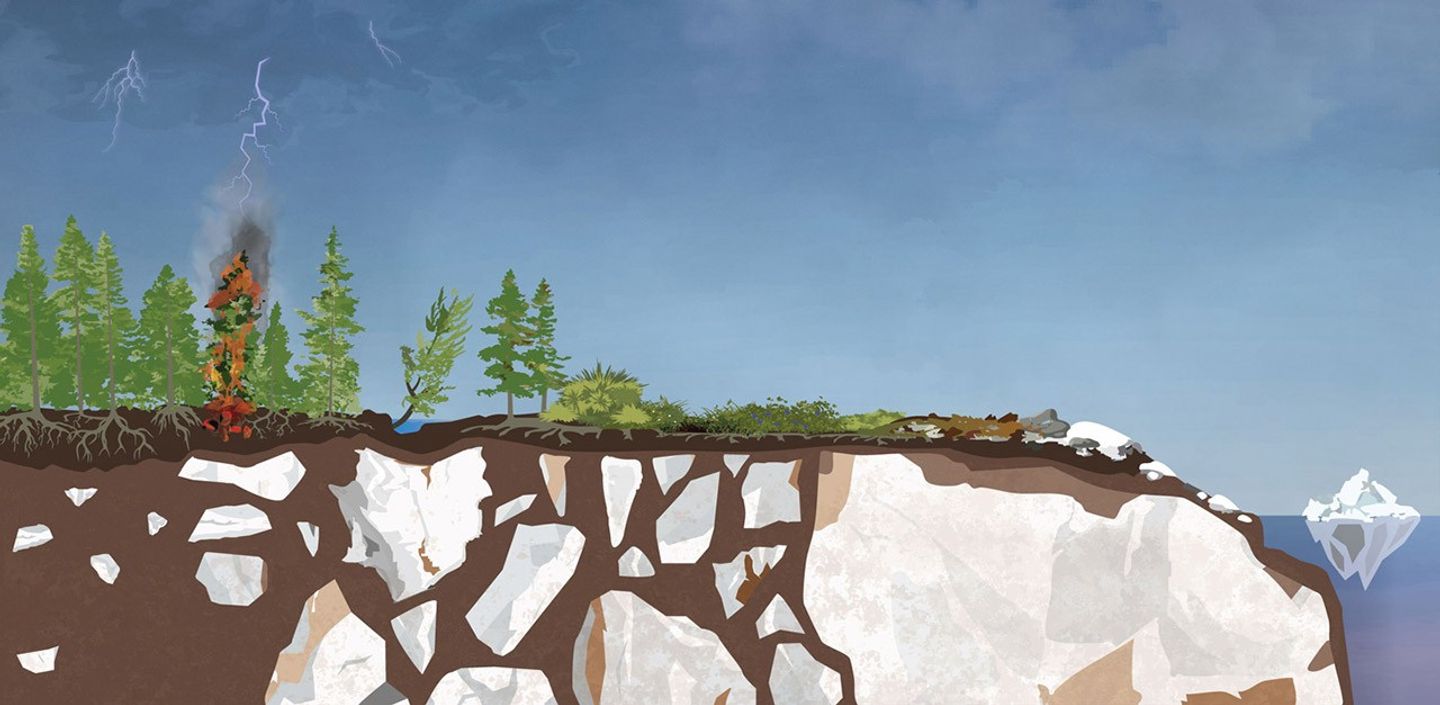
Arctic ecosystems: How are there fires in the Arctic?
The word ‘Arctic’ often conjures images of glaciers, snow, and a frozen ocean. So how can such a place catch fire?
Officially, the Arctic refers to the region north of 66.5 degrees north, though many Arctic researchers study 60 degrees north and above. While much of the area is covered in snow and ice, the Arctic also boasts a diverse range of ecosystems that change as they extend toward the pole.
It begins with boreal forests, which are primarily made up of coniferous trees like spruce, fir, and pine. As these forests thin to the north, they give way to shrublands, then to grassland tundra, and eventually to rock, ice, and polar bears.
Illustration by Esther Suh, NASA’s Ames Research Center.
Much of the vegetation is covered in snow during the winter, which thaws in the spring. Exposed, the vegetation dries out in the sunlight. When given an ignition source like a lightning strike, it can quickly become fuel for a fire.
What is changing?
According to the 2025 AMAP report, an increasingly flammable landscape combined with more lightning strikes is leading to larger, more frequent, and more intense fires than the landscape is adapted for.
“There is variability year to year, but across the decades we are averaging about double the burned area in the North American Arctic compared to the mid-20th century,” said Brendan Rogers, senior scientist at the Woodwell Climate Research Center.
Low-intensity fires, which the Arctic is accustomed to, leave most of the forest standing, which allows the understory and upper soil layers to recover quickly.
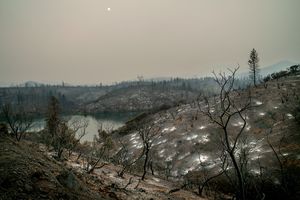
In contrast, intense fires kill off trees and can trigger a process known as secondary succession, in which new species replace those that died. These fires also burn deep into the carbon-rich soil, change the area’s hydrology, and accelerate snowmelt. In addition, the smoke and habitat damage from massive, hot fires pose significant health risks to human communities and local wildlife.
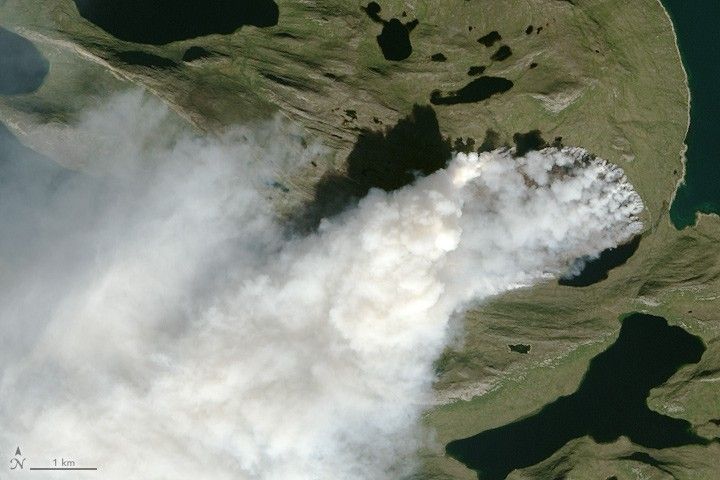
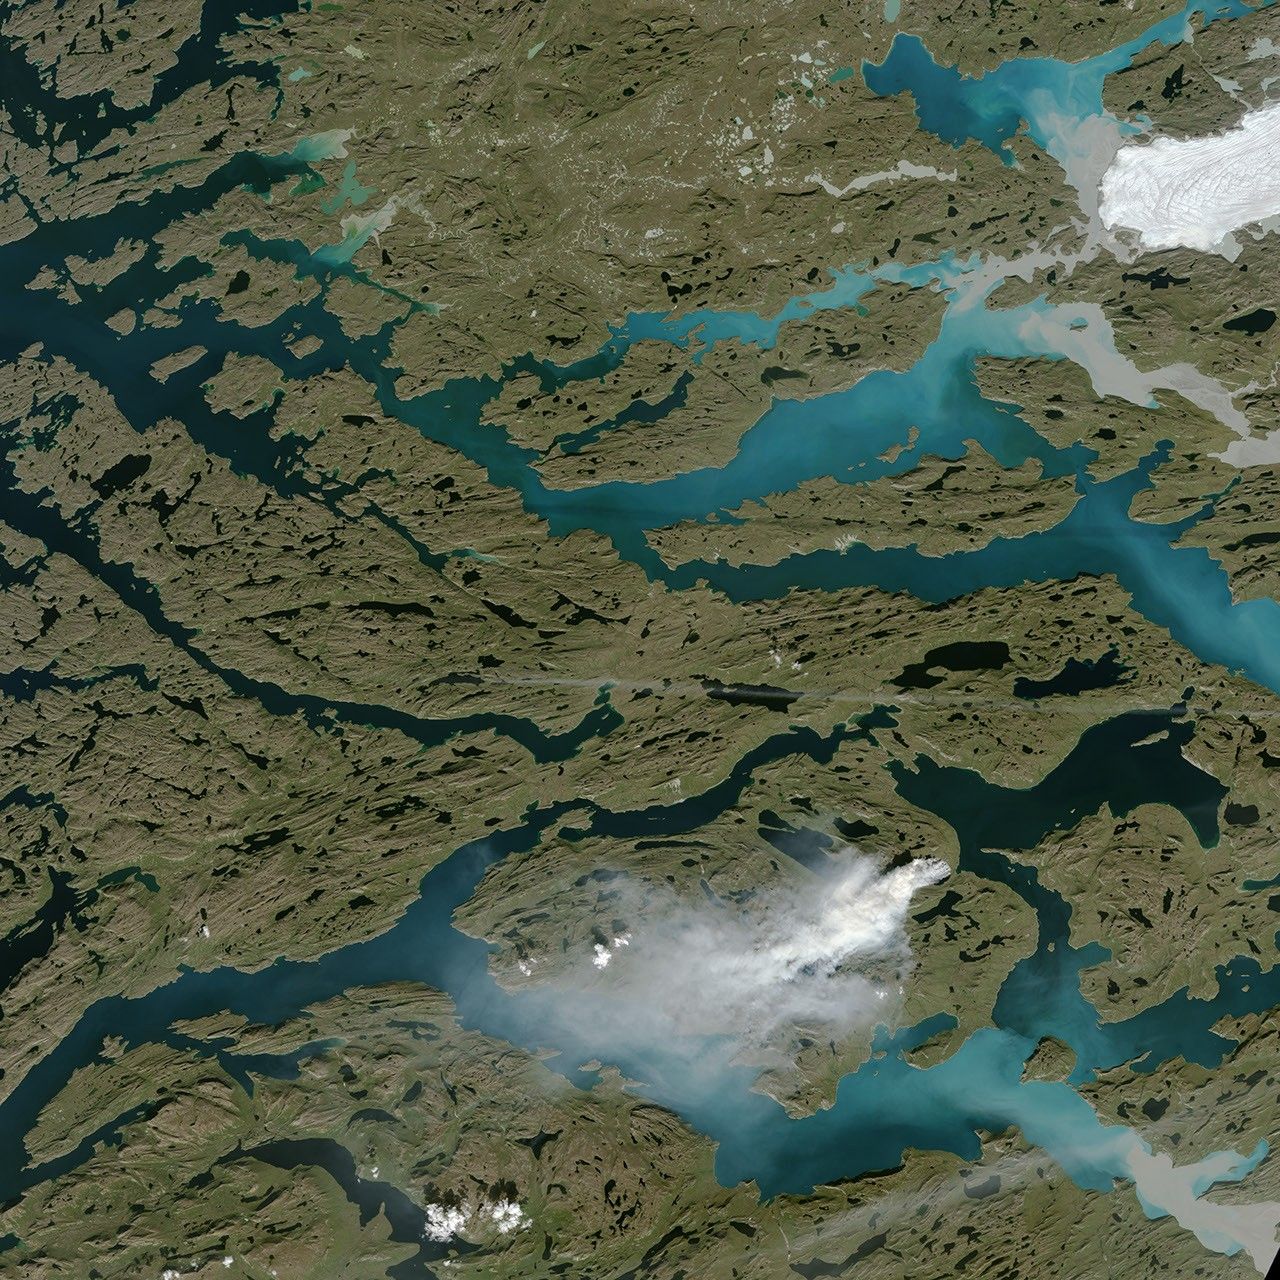
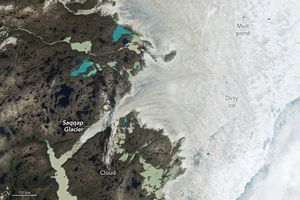
The Operational Land Imager (OLI) on Landsat 8 captured this image of a large wildfire in western Greenland on August 3, 2017. Satellites first detected evidence of the fire on July 31, 2017.
NASA Earth Observatory image by Jesse Allen using Landsat data from the U.S. Geological Survey.
The mid-2010s ushered in a novel fire regime. For instance, Greenland saw significant wildfires in 2015, 2017, and in 2019. Researchers also began observing fires consistently springing up in the Arctic as early as late March, much earlier in the year than historical records show, and burning well after the first snow. “It’s concerning how frequently these fires burn the same place,” Loboda said. “A lot of areas now burn two, three, or even five times during a very short period. It’s an immense impact: It’s happening across the tundra and the boreal regions, and these areas can’t recover.”
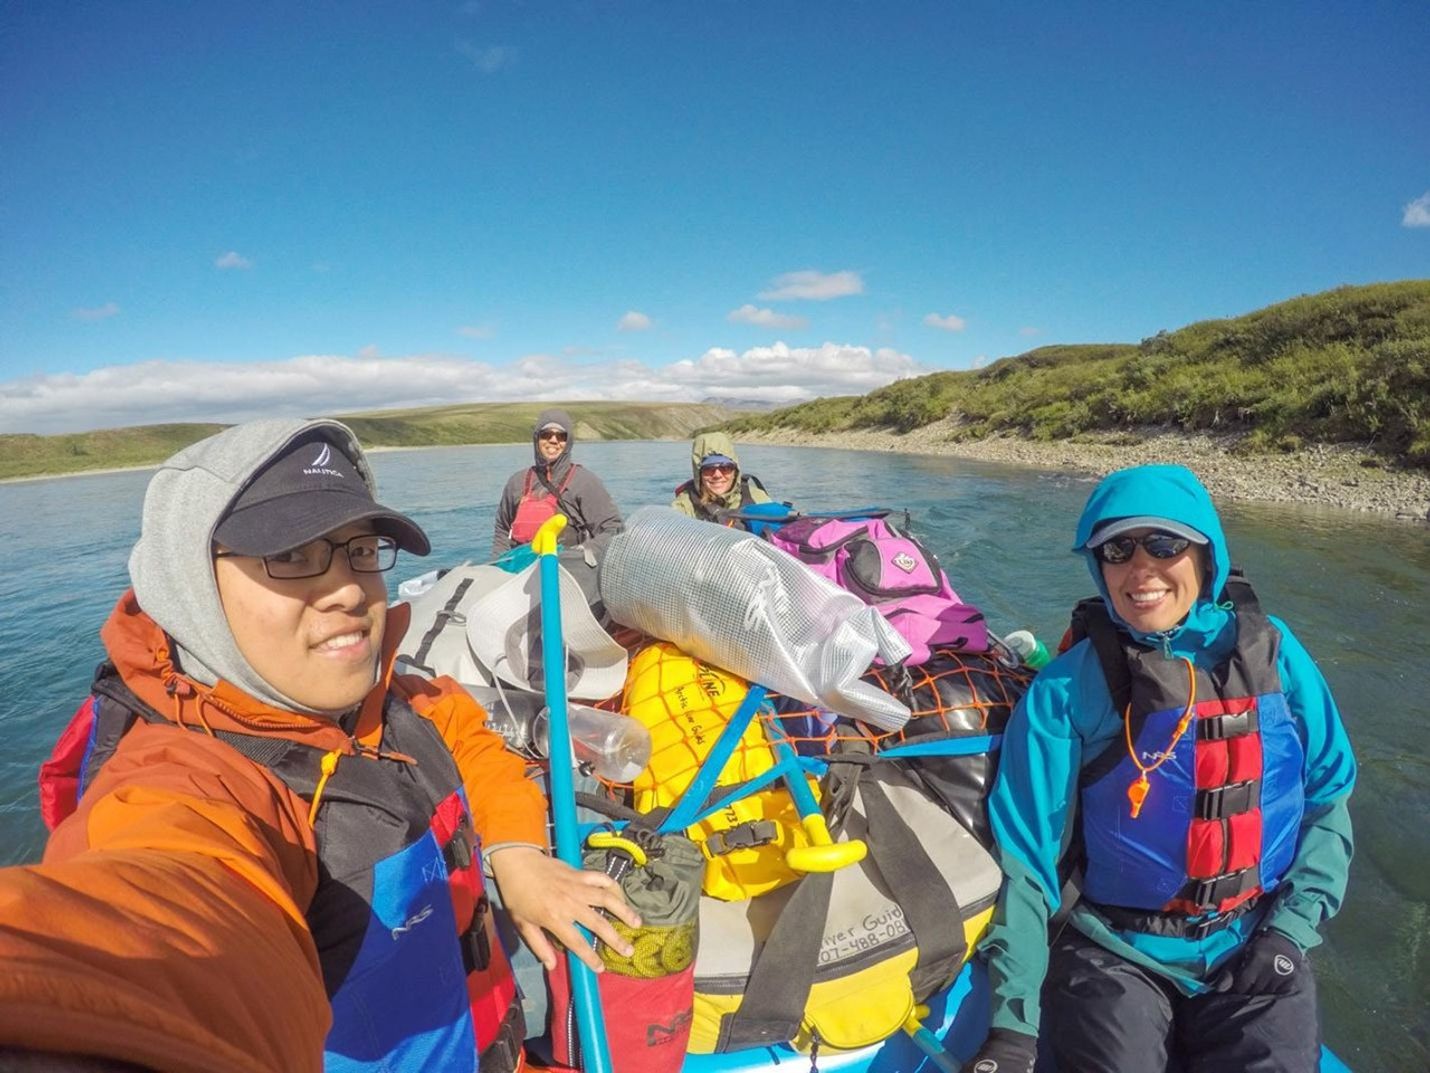
In summer 2016, Tatiana Loboda (right) rafted through the North American Arctic to collect samples across tundra sites. The work, part of NASA’s Arctic-Boreal Vulnerability Experiment (ABoVE), investigates how repeat fires impact the ecosystem over short and long timescales.
Photo by Dong Chen (left), University of Maryland.
Peat, permafrost, and zombie fires
What makes Arctic ecosystems, and by extension Arctic fire, unique compared to much of the world is what is happening below ground: specifically in the peat and permafrost.
Peat is old—thousands and thousands of years old.
When glaciers retreated at the end of the last ice age, they left behind deposits of old trees, grasses, and other organic matter that have partially decomposed to form carbon-rich soil. Over time, layers of deposits built up into peat, which is now a primary ingredient in soil across the Arctic.
When intense fires burn into deep peat deposits, they can create a phenomenon called a holdover fire, more commonly known as a zombie fire, in which remnants of fire stay alive throughout the winter. These fires appear extinguished on the surface but continue to smolder underground through the winter, bursting back to life when spring brings drier conditions.
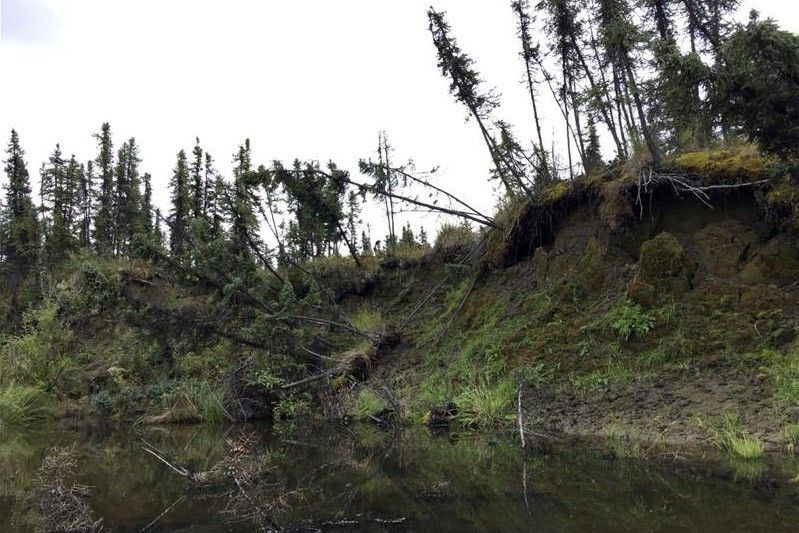
Thawing permafrost reshapes the surface across ecosystems. Top: Thawing permafrost in a boreal forest causes the surface to cave in, tilting and toppling trees into a “drunken forest.” Bottom: Thawing permafrost in the tundra creates scalloped pond edges, as pockets of ice melt and water moves through the soil to pool on the surface.
Photos by Clayton Elder, NASA’s Ames Research Center.
Permafrost—ground that remains frozen year-round—can be even older. Some permafrost predates the human species, Homo sapiens, remaining continuously frozen for more than 400,000 years. This age is what makes these frozen layers so significant: They’ve been storing ancient organic matter, and the carbon within it, for millennia.
When organisms die and decompose, that process naturally releases carbon dioxide and methane. In the Arctic, permafrost keeps these organisms literally frozen, which effectively freezes them in time.
NASA scientist and permafrost expert Clayton Elder describes seeing this effect in the Permafrost Tunnel in Fairbanks, Alaska. “You can walk into the tunnel and see grass embedded in the wall,” Elder said. “It’s still green, but when you carbon date it, it’s 40,000 years old.”
But as the Arctic warms, thaws, and burns, the carbon stored in peat and permafrost releases into the atmosphere. That matters, because what’s locked below the surface is enormous. Together, Arctic peat and permafrost store twice as much carbon as the entirety of Earth’s atmosphere.
According to McCarty, this thawing will lead to global change.
“This is old ice— ice that is part of our hydrologic system and formed a homeostasis of climate that we as a species grew up in,” McCarty said. “There will be changes that we can’t predict: humanity has not experienced the climate the planet is heading towards. It will be interesting to model; there are so many different ways it could go.”
What’s next?
To address the challenges of the Arctic, scientists are finding new applications of existing data and developing new technologies.
“NASA satellites form the real backbone of what we understand,” said Rogers. “These satellites have given us a 25-year record of wildfire data, which is invaluable. They are critical for our understanding of how these fire regimes are changing and for thinking through anything in the solution space.”
New satellites and artificial intelligence developments are advancing understanding of ignition sources, fuel availability and flammability, and fire behavior. All of these data are important for monitoring fires and modeling future fire behavior, as well as evaluating the vulnerability of boreal and Arctic ecosystems to increasing levels of fire.
“One of our conclusions is that the observations need to be more targeted,” McCarty said. “We know some of what is happening, but we need to better understand why, and how to monitor these isolated areas. This means we’ll need satellites and field campaigns that are thinking about this more complex fire landscape. What happens in the Arctic will impact the rest of the planet.”
Story by Milan Loiacono, NASA’s Ames Research Center.
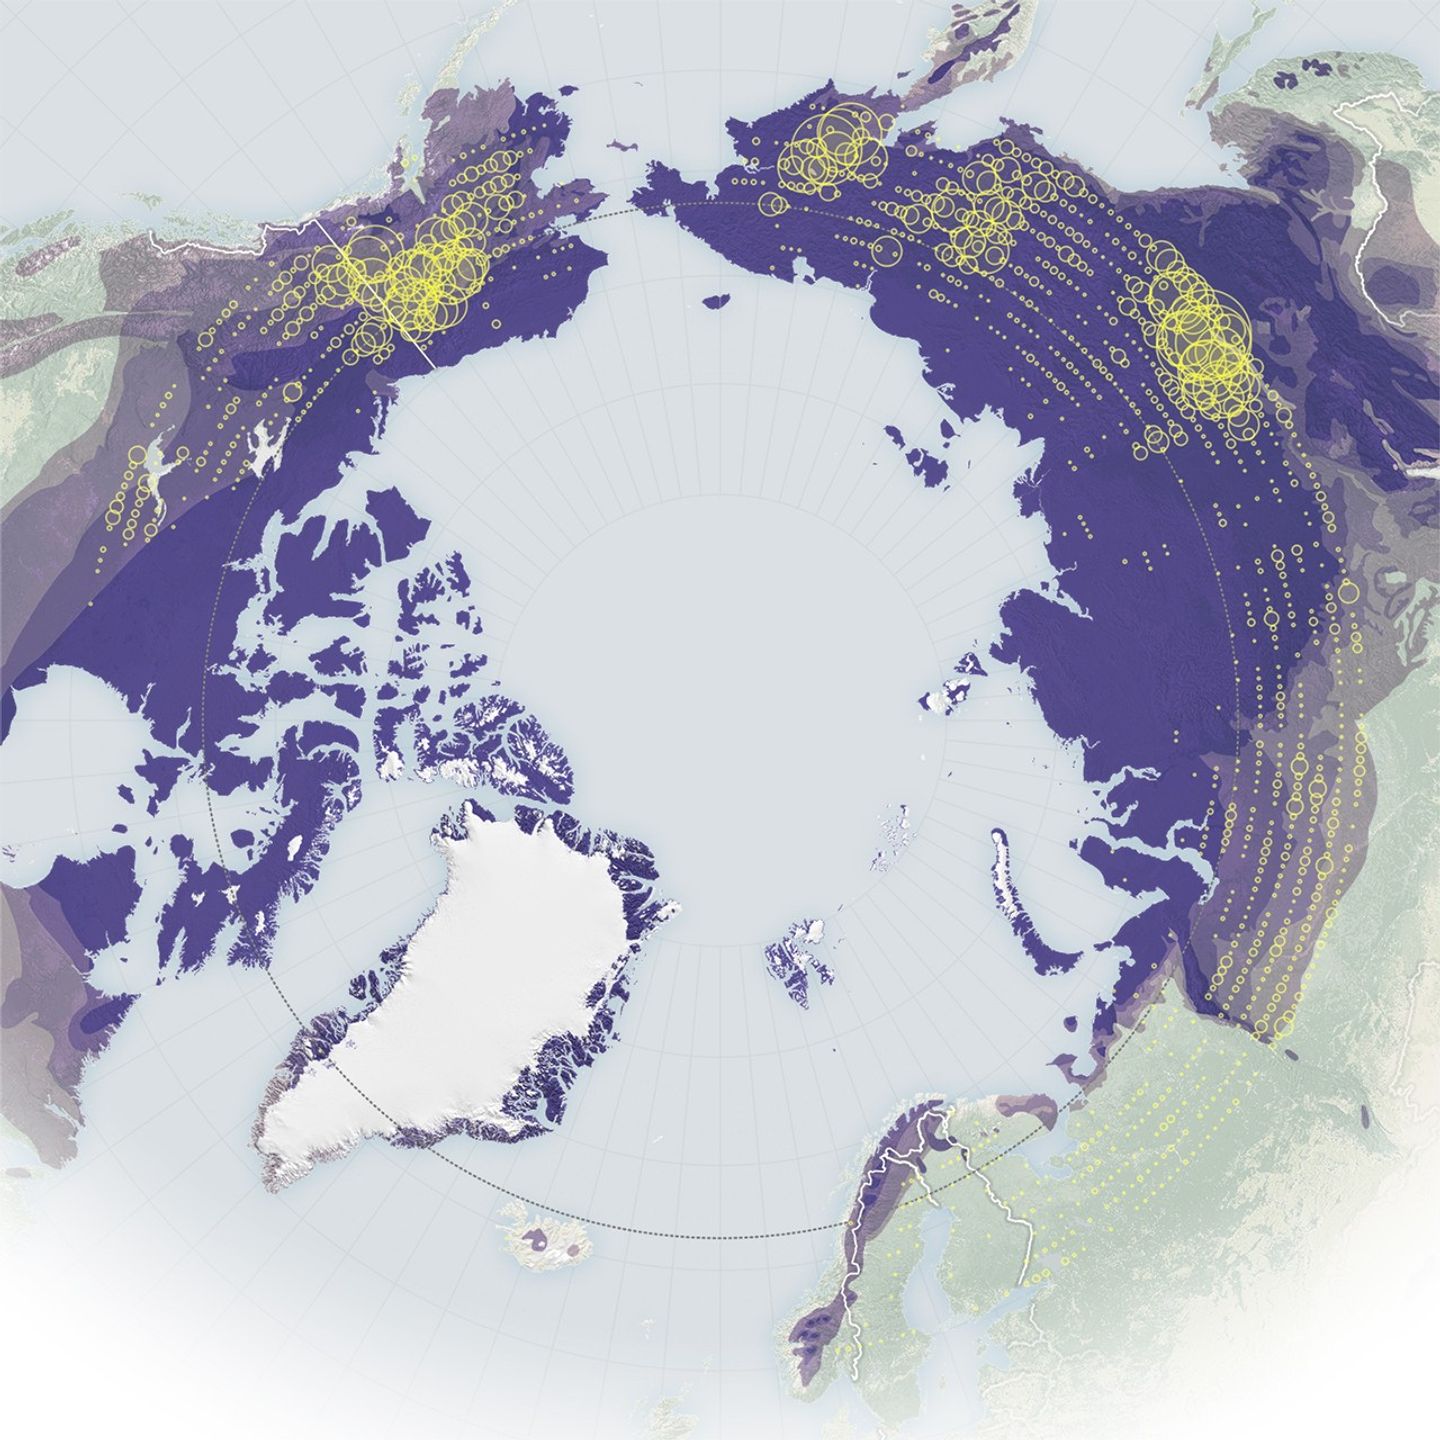
In the far north, wildfires are breaking old patterns. Satellite data show that wildland fires once scattered across the Arctic are now surging in numbers—particularly in northern Eurasia—and many are burning more intensely than before.
These maps show the number of fires detected by the MODIS (Moderate Resolution Imaging Spectroradiometer) sensors on NASA’s Aqua and Terra satellites. The map on the left shows fire detections from 2002 to 2012 (yellow), while the map on the right shows detections from 2012 to 2024 (orange). The largest circles indicate areas with 15,000 or more detected fires, while the smallest circles represent areas with 1,000 or fewer. Fire detection data are from NASA’s Fire Information for Resource Management System (FIRMS).
Although the geographical distribution of high-latitude wildfires varies from year to year, the maps reveal some clear long-term patterns. In the 2000s, fires north of 60 degrees latitude appeared across both North America and Eurasia, but starting in the early 2010s, their numbers skyrocketed, most dramatically in Eurasia. Even the icy island of Greenland entered a new fire regime during this period, experiencing more large fires, though still too few to be visible on these maps.
Researchers attribute these trends to rising temperatures, which have made northern landscapes more flammable, along with a poleward expansion of lightning—the primary ignition source for these fires. The findings are detailed in a report published in 2025 by the Arctic Monitoring and Assessment Programme (AMAP), a working group of the Arctic Council.
The number of fire detections and their distribution, however, is just one metric of the Arctic’s changing fire regime. According to NASA researchers, fires in this region are also burning larger, hotter, and longer than they did in previous decades.
“Fire has always been a part of the boreal and the Arctic landscape,” said Jessica McCarty, Deputy Earth Science Division Chief at NASA’s Ames Research Center and lead author of the report. “But now it’s starting to act in more extreme ways that mimic what we’ve seen in the temperate and the tropical areas.”
NASA Earth Observatory maps by Michala Garrison, using the MODIS Collection 6.1 Active Fire Product from NASA’s Fire Information for Resource Management System (FIRMS). Story by Milan Loiacono.
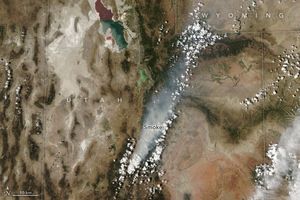
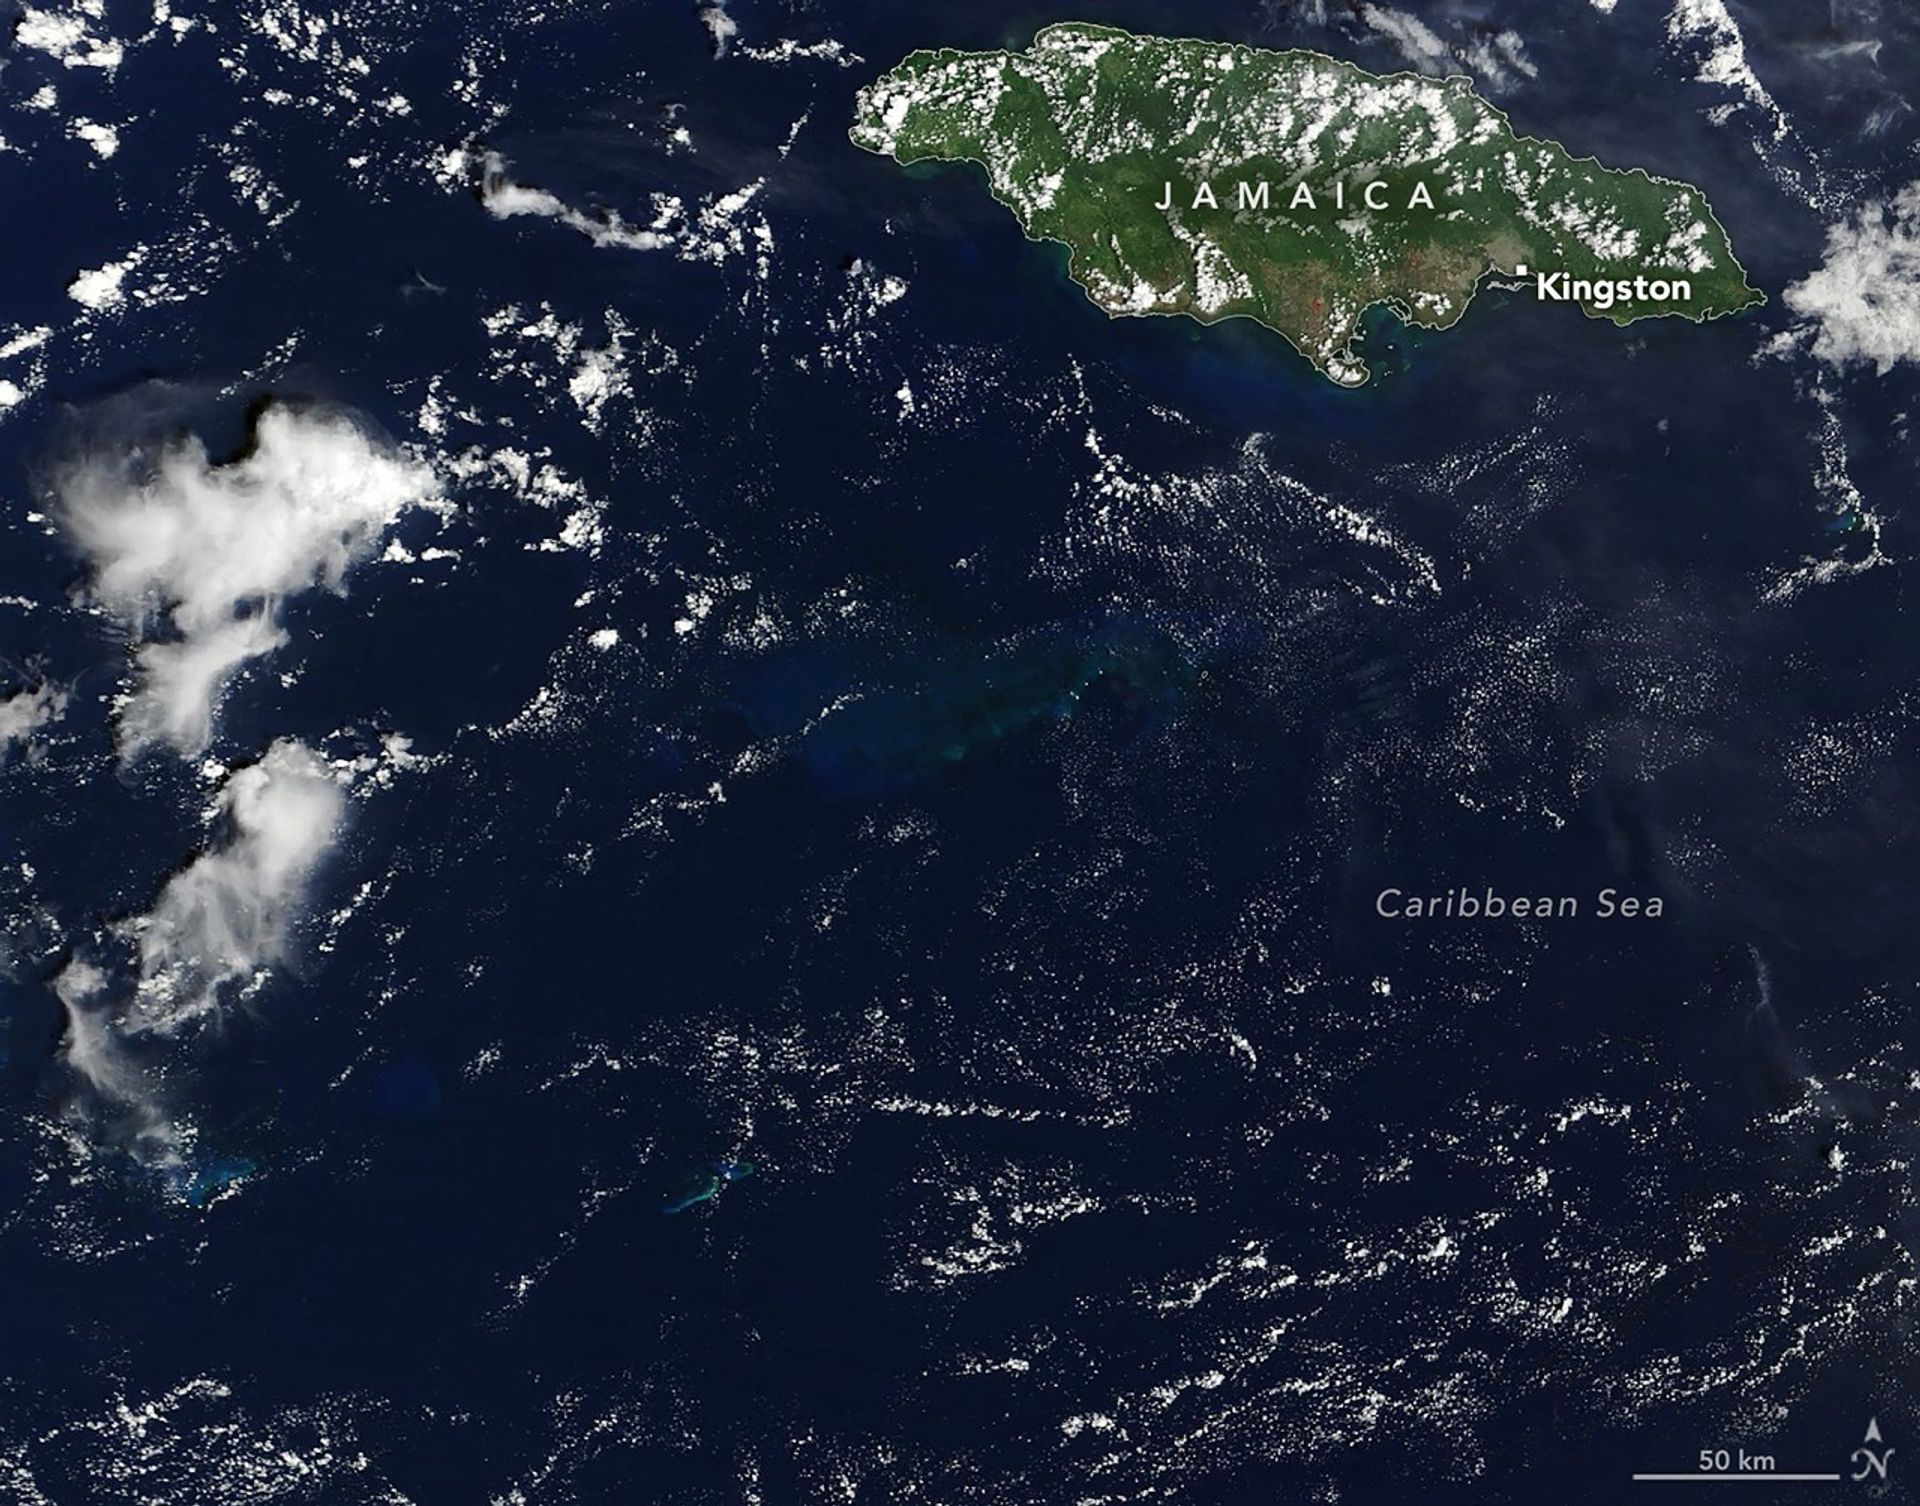
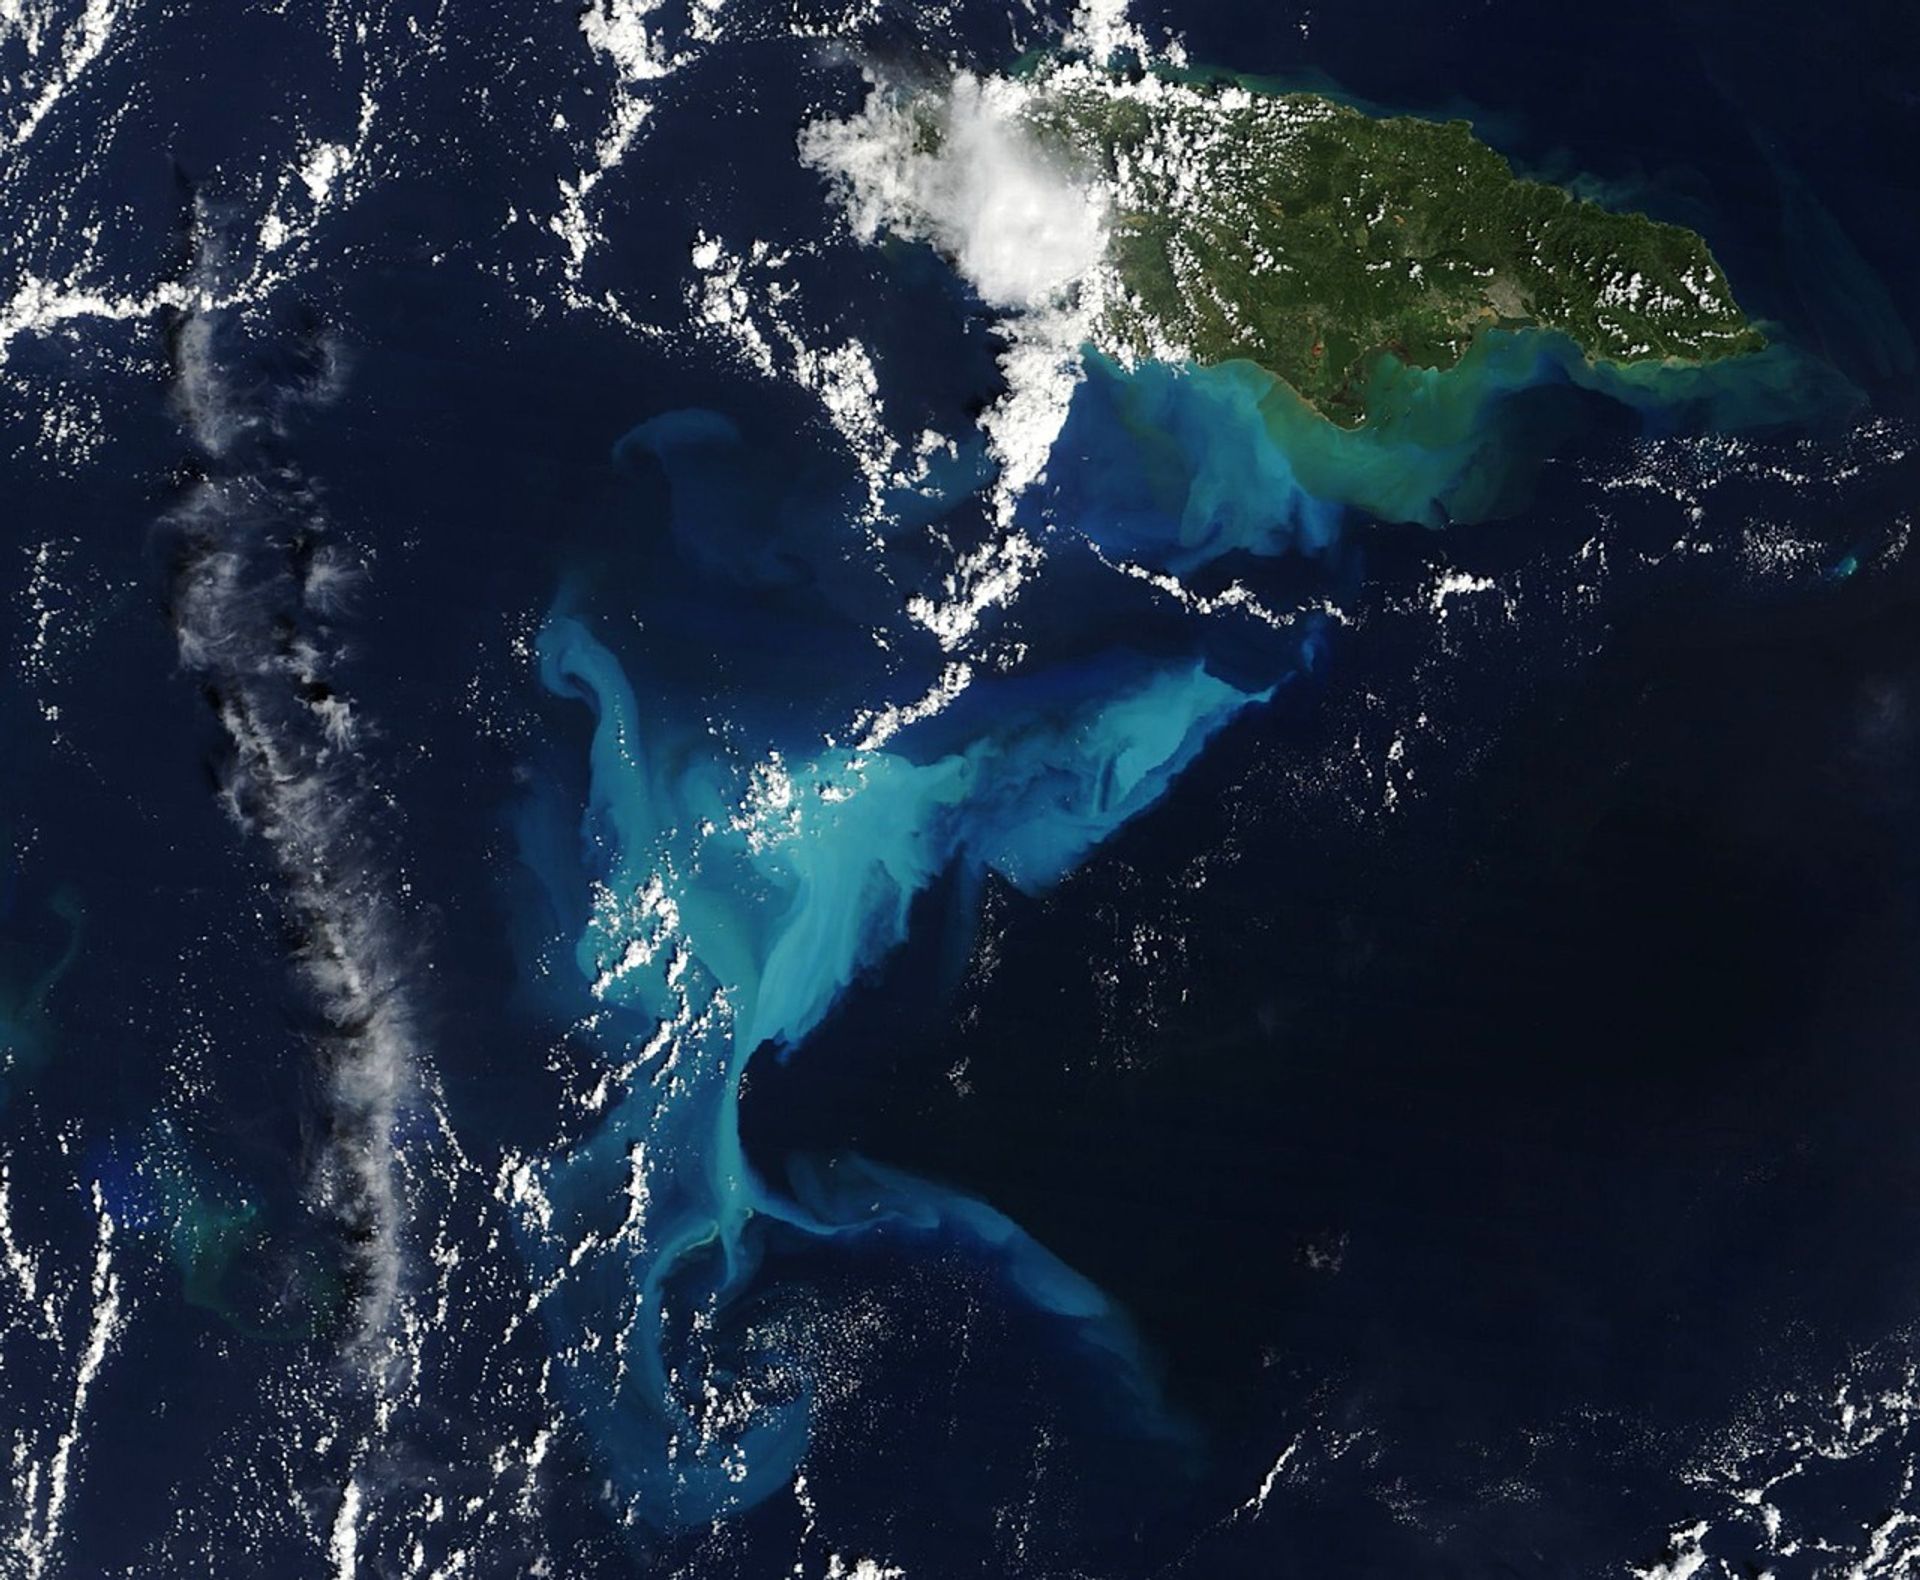
A satellite image shows a portion of the dark blue Caribbean Sea near Jamaica. A submerged carbonate platform appears as a slightly brighter blue area of water in the center. The mostly green island of Jamaica is in the upper right, and scattered clouds are present throughout.
NASA Earth Observatory
A satellite image shows a portion of the Caribbean Sea near Jamaica. Much of the water in the middle third of the image is bright blue due to suspended sediment. The mostly green island of Jamaica is in the upper right, and scattered clouds are present throughout.
NASA Earth Observatory
September 20, 2025
October 30, 2025
Before and After
Hurricane Melissa made landfall in Jamaica on October 28, 2025, as a category 5 storm, bringing sustained winds of 295 kilometers (185 miles) per hour and leaving a broad path of destruction on the island. The storm displaced tens of thousands of people, damaged or destroyed more than 100,000 structures, inflicted costly damage on farmland, and left the nation’s forests brown and battered.
Prior to landfall, in the waters south of the island, the hurricane created a large-scale natural oceanography experiment. Before encountering land and proceeding north, the monster storm crawled over the Caribbean Sea, churning up the water below. A couple of days later, a break in the clouds revealed what researchers believe could be a once-in-a-century event.
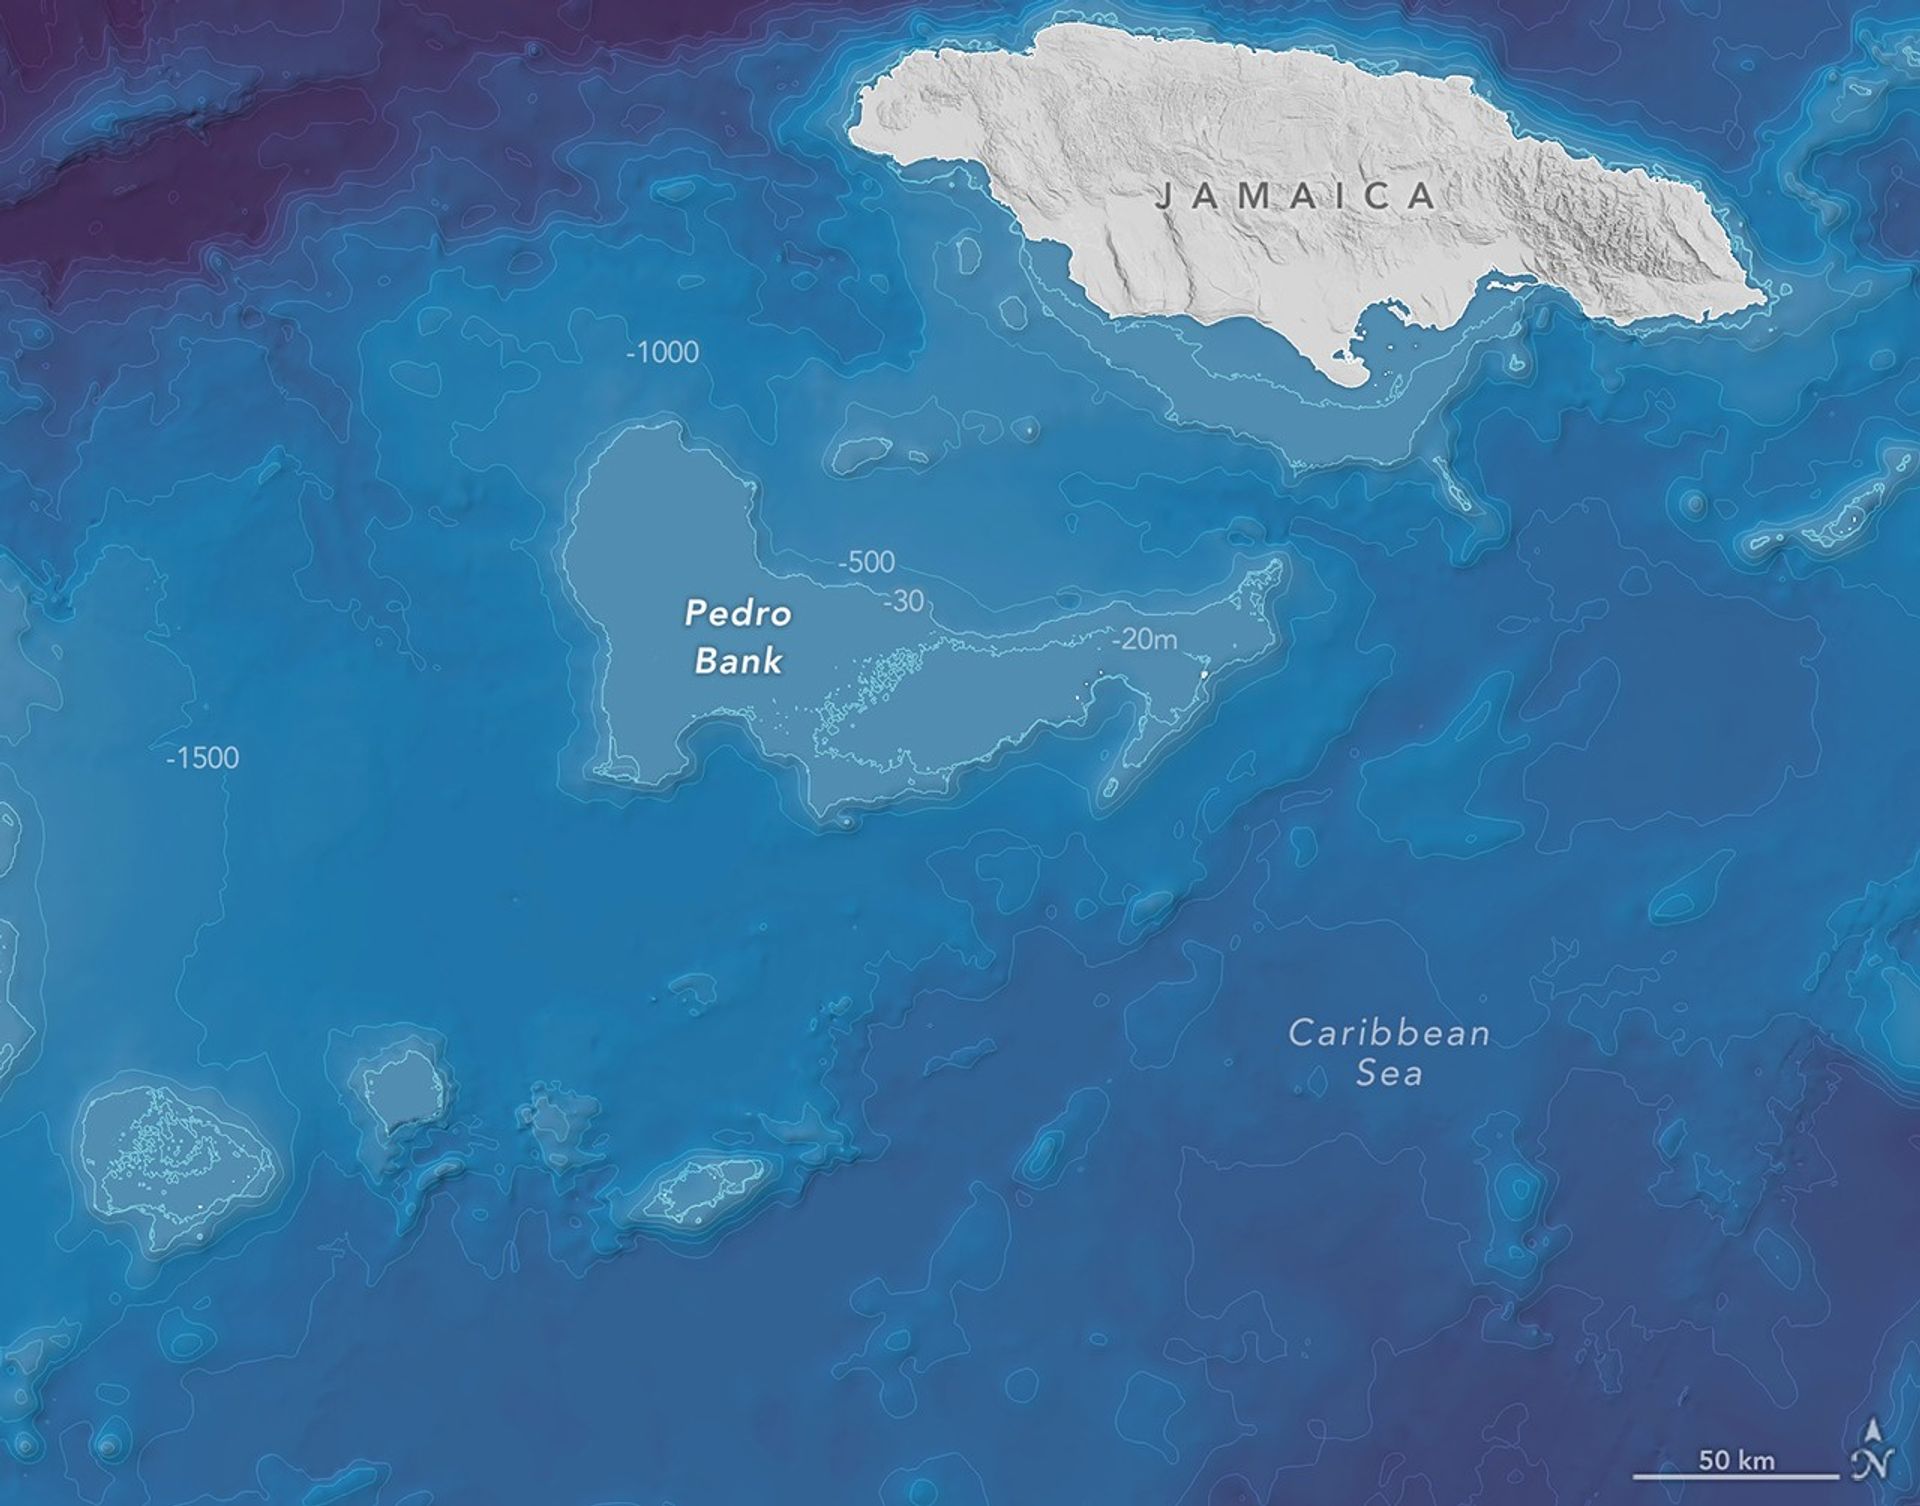
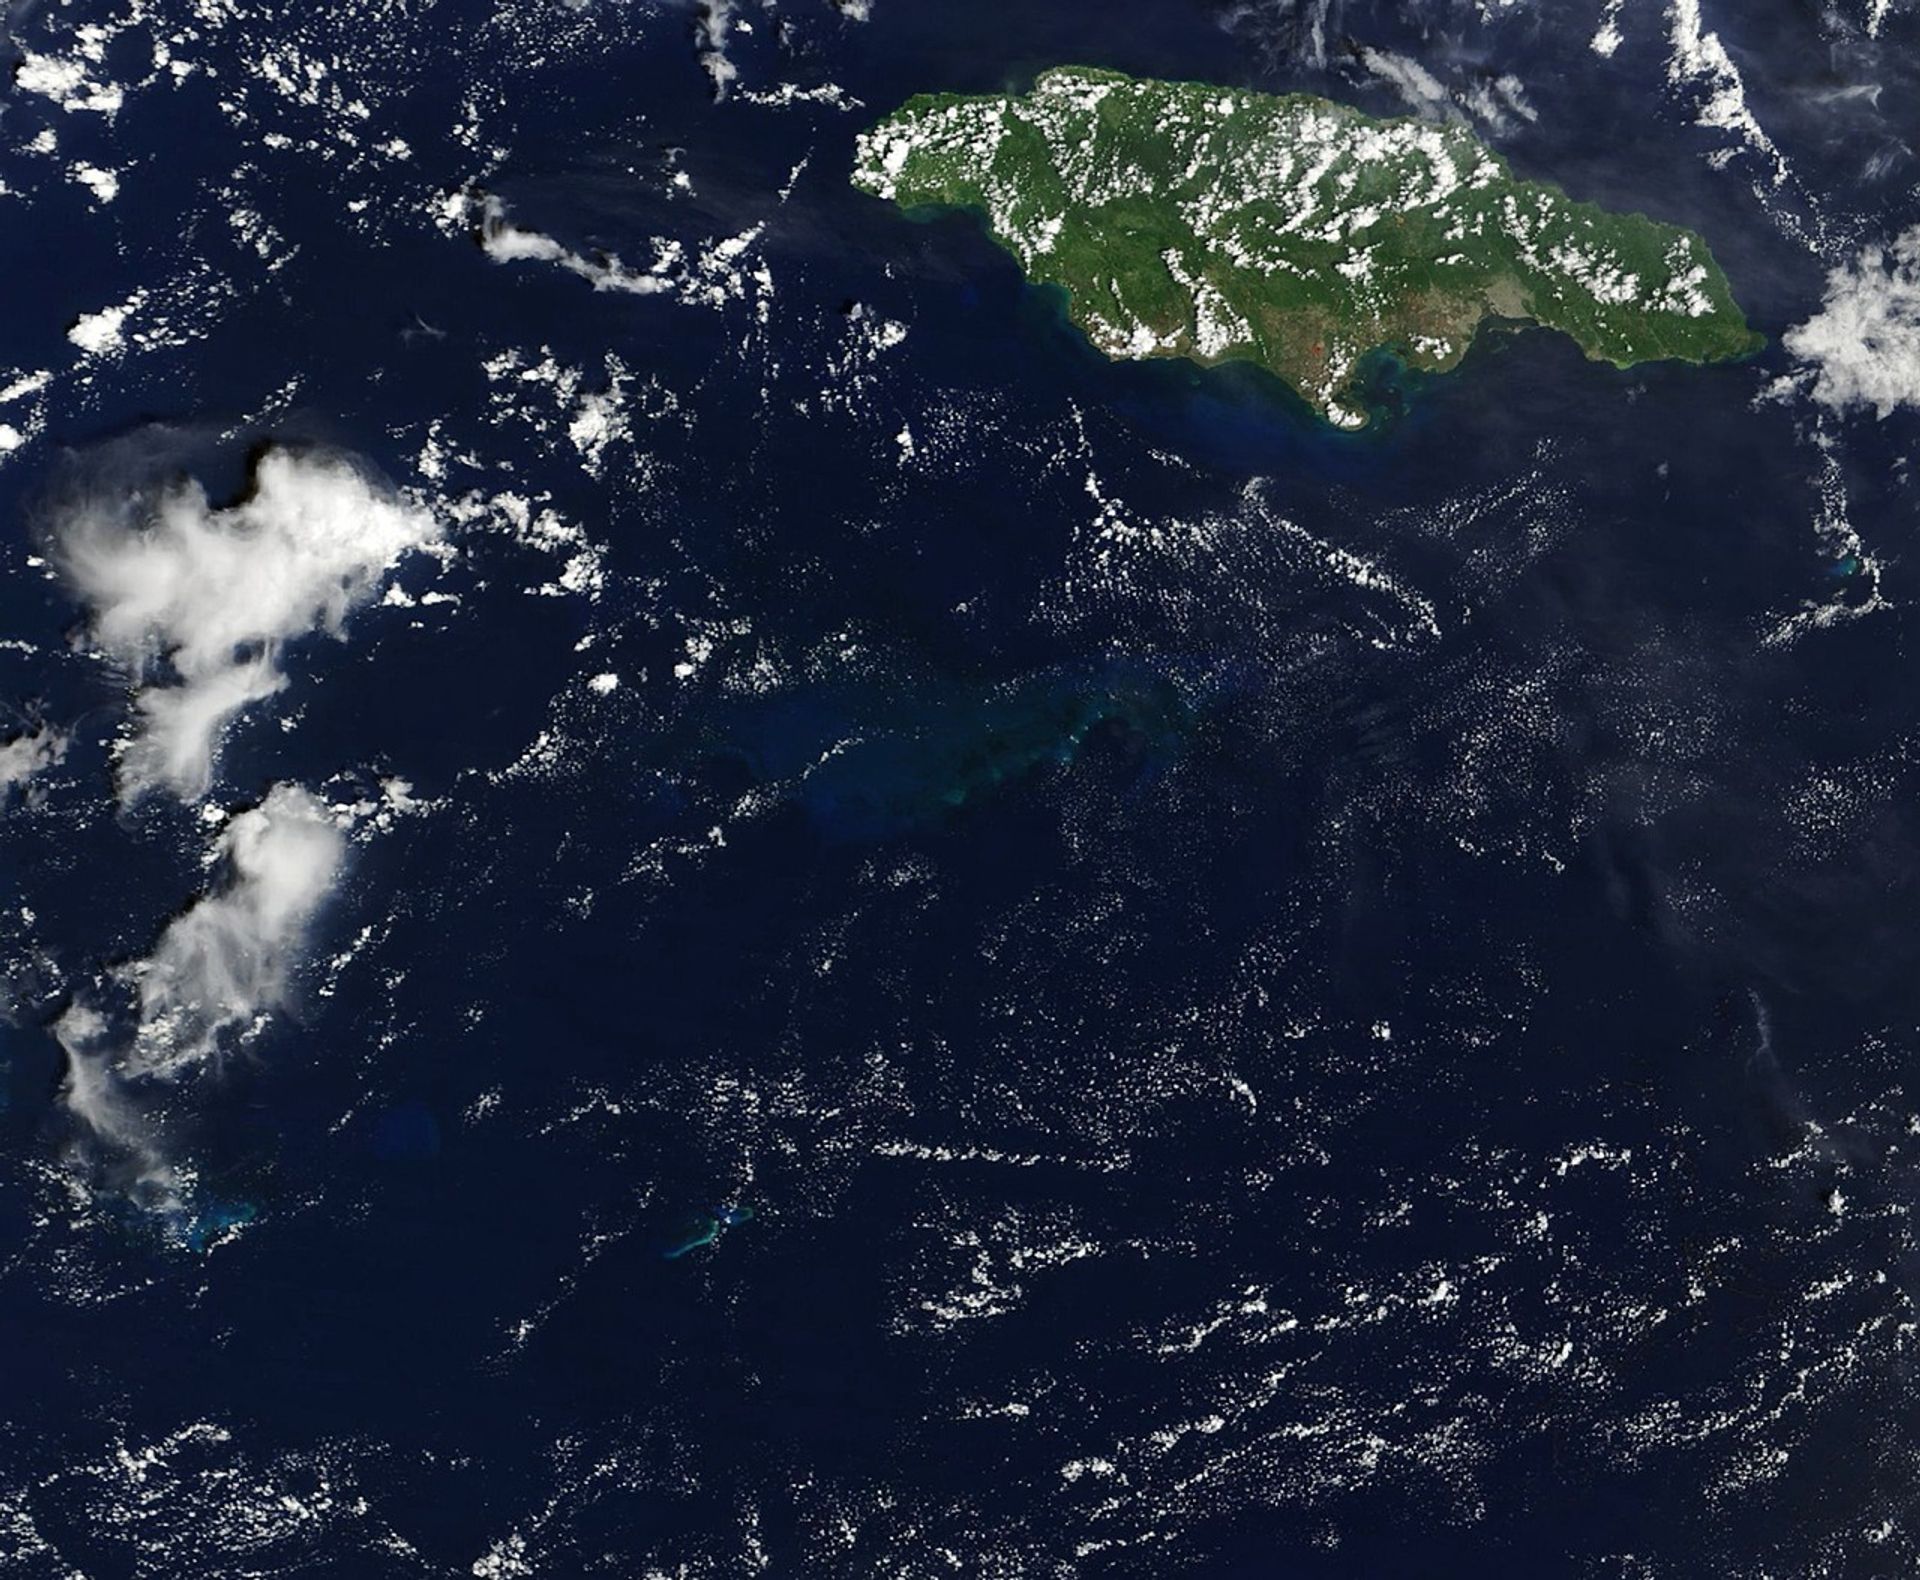
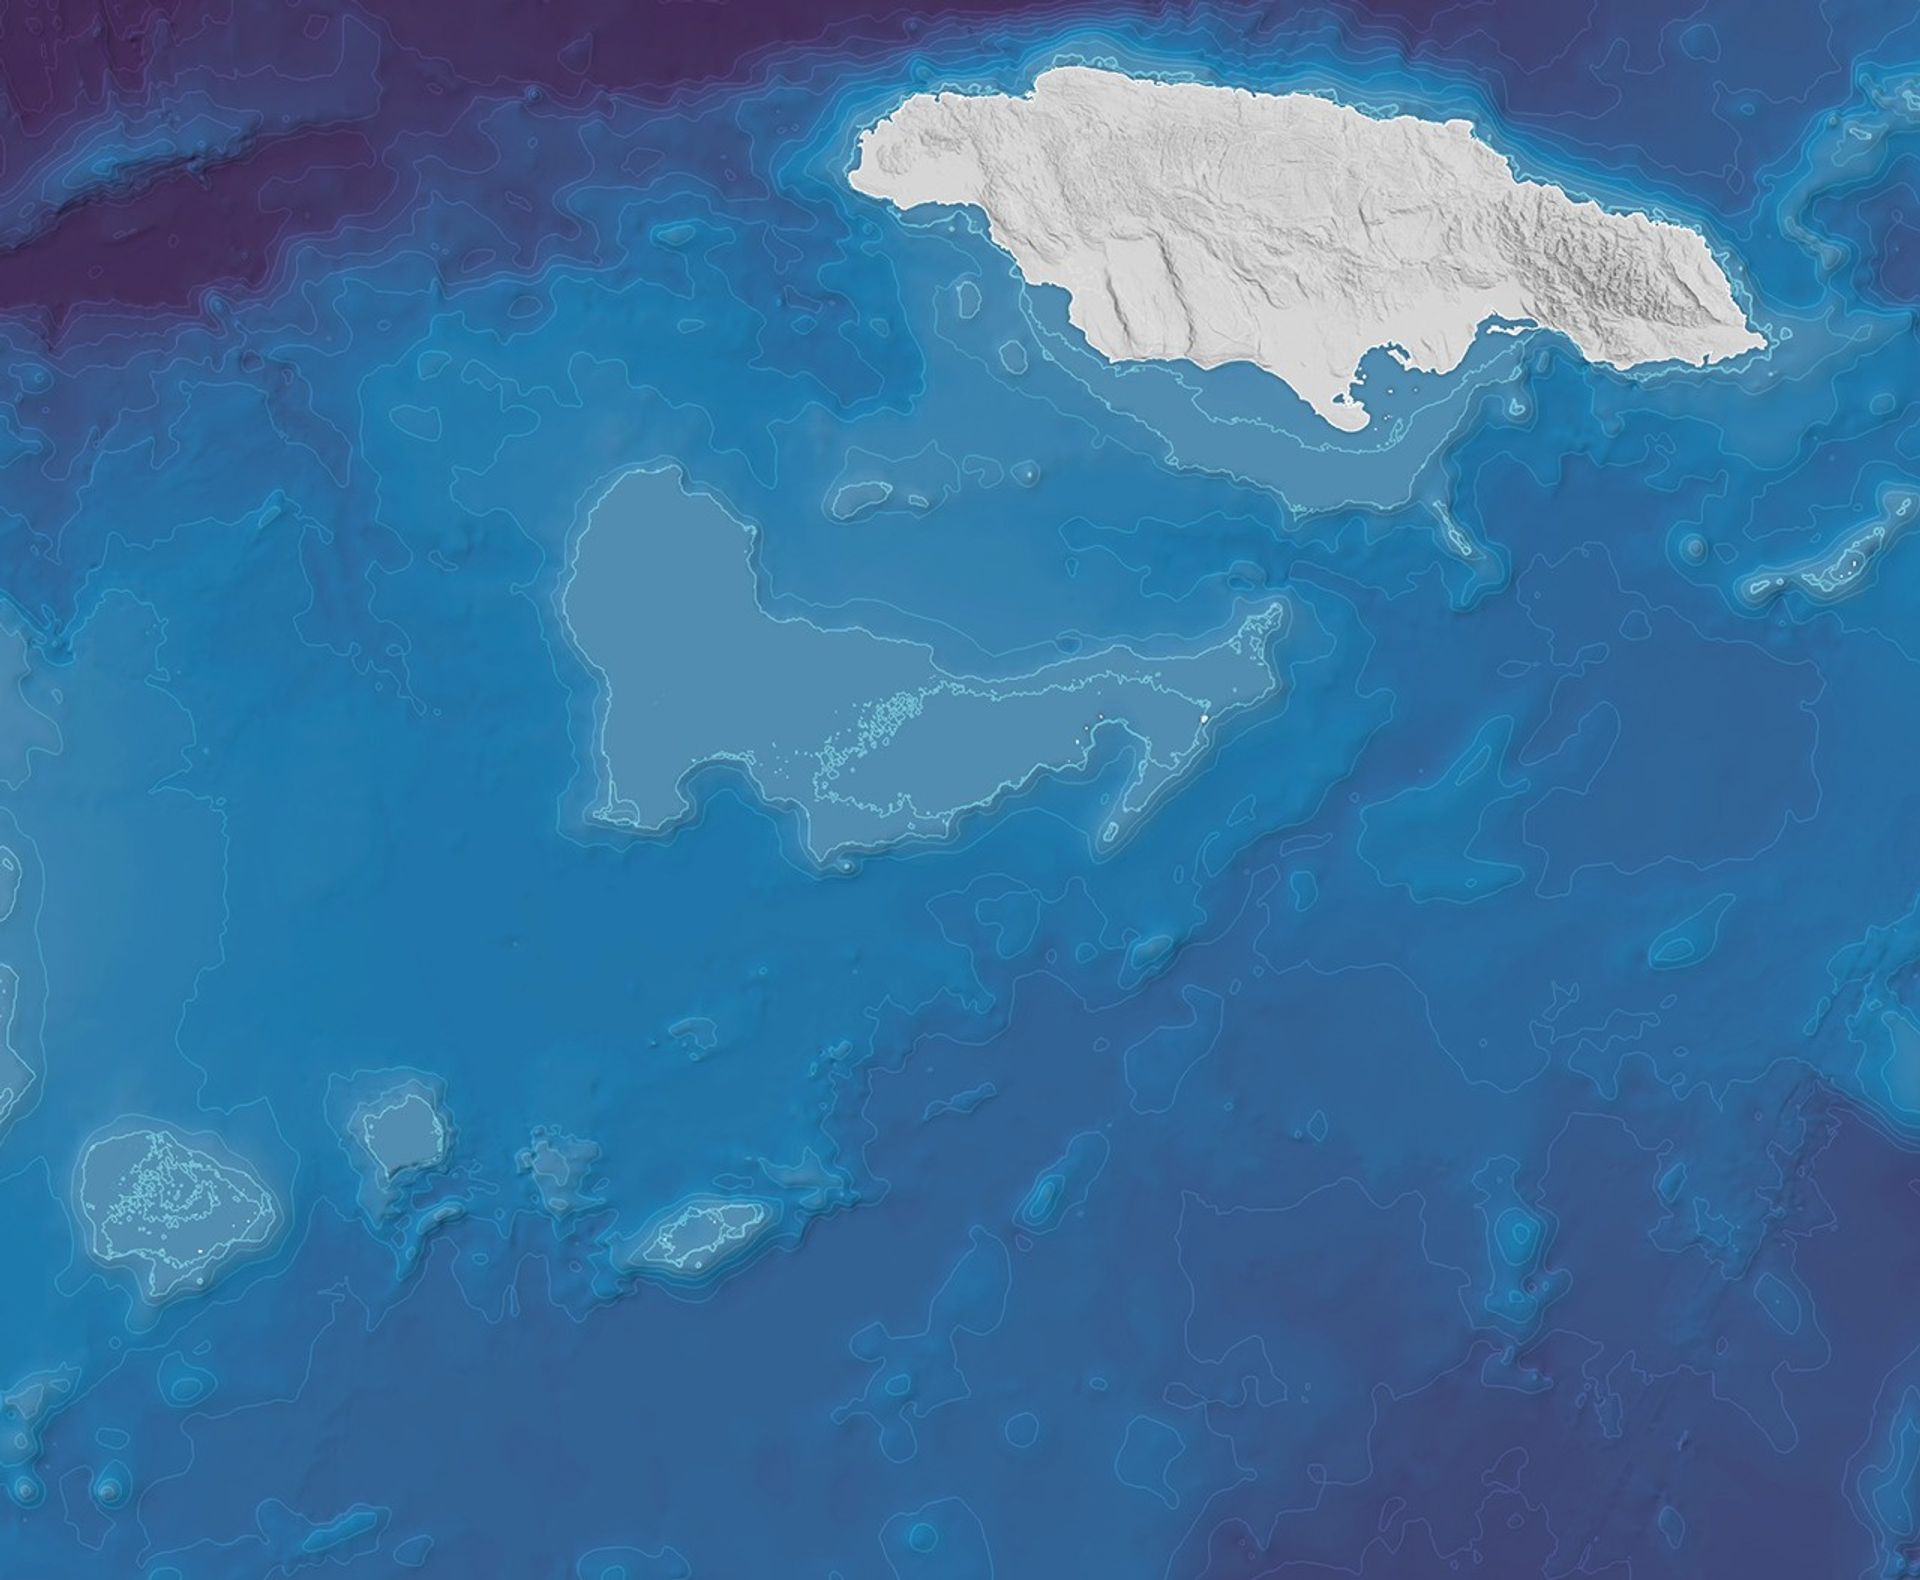
On October 30, 2025, the MODIS (Moderate Resolution Imaging Spectroradiometer) instrument on NASA’s Terra satellite acquired this image (right) of the waters south of Jamaica. Vast areas are colored bright blue by sediment stirred up from a carbonate platform called Pedro Bank. This plateau, submerged under about 25 meters (80 feet) of water, is slightly larger in area than the state of Delaware. For comparison, the left image was acquired by the same sensor on September 20, before the storm.
Pedro Bank is deep enough that it is only faintly visible in natural color satellite images most of the time. However, with enough disruption from hurricanes or strong cold fronts, its existence becomes more evident to satellites. Suspended calcium carbonate (CaCO3) mud, consisting primarily of remnants of marine organisms that live on the plateau, turns the water a Maya blue color. The appearance of this type of material contrasts with the greenish-brown color of sediment carried out to sea by swollen rivers on Jamaica’s southern coast.
As an intense storm that lingered in the vicinity of the bank, Hurricane Melissa generated “tremendous stirring power” in the water column, said James Acker, a data support scientist at the NASA Goddard Earth Sciences Data and Information Services Center with a particular interest in these events. Hurricane Beryl caused some brightening around Pedro Bank in July 2024, “but nothing like this,” he said. “While we always have to acknowledge the human cost of a disaster, this is an extraordinary geophysical image.”
Sediment suspension was visible on Pedro and other nearby shallow banks, indicating that Melissa affected a total area of about 37,500 square kilometers—more than three times the area of Jamaica—on October 30, said sedimentologist Jude Wilber, who tracked the plume’s progression using multiple satellite sensors. Having studied carbonate sediment transport for decades, he believes the Pedro Bank event was the largest observed in the satellite era. “It was extraordinary to see the sediment dispersed over such a large area,” he said.
The sediment acted as a tracer, illuminating currents and eddies near the surface. Some extended into the flow field of the Caribbean Current heading west and north, while other patterns suggested the influence of Ekman transport, Wilber said. The scientists also noted complexities in the south-flowing plume, which divided into three parts after encountering several small reefs. Sinking sediment in the easternmost arm exhibited a cascading stair-step pattern.
Like in other resuspension events, the temporary coloration of the water faded after about seven days as sediment settled. But changes to Pedro Bank itself may be more long-lasting. “I suspect this hurricane was so strong that it produced what I would call a ‘wipe’ of the benthic ecosystem,” Wilber said. Seagrasses, algae, and other organisms living on and around the bank were likely decimated, and it is unknown how repopulation of the area will unfold.
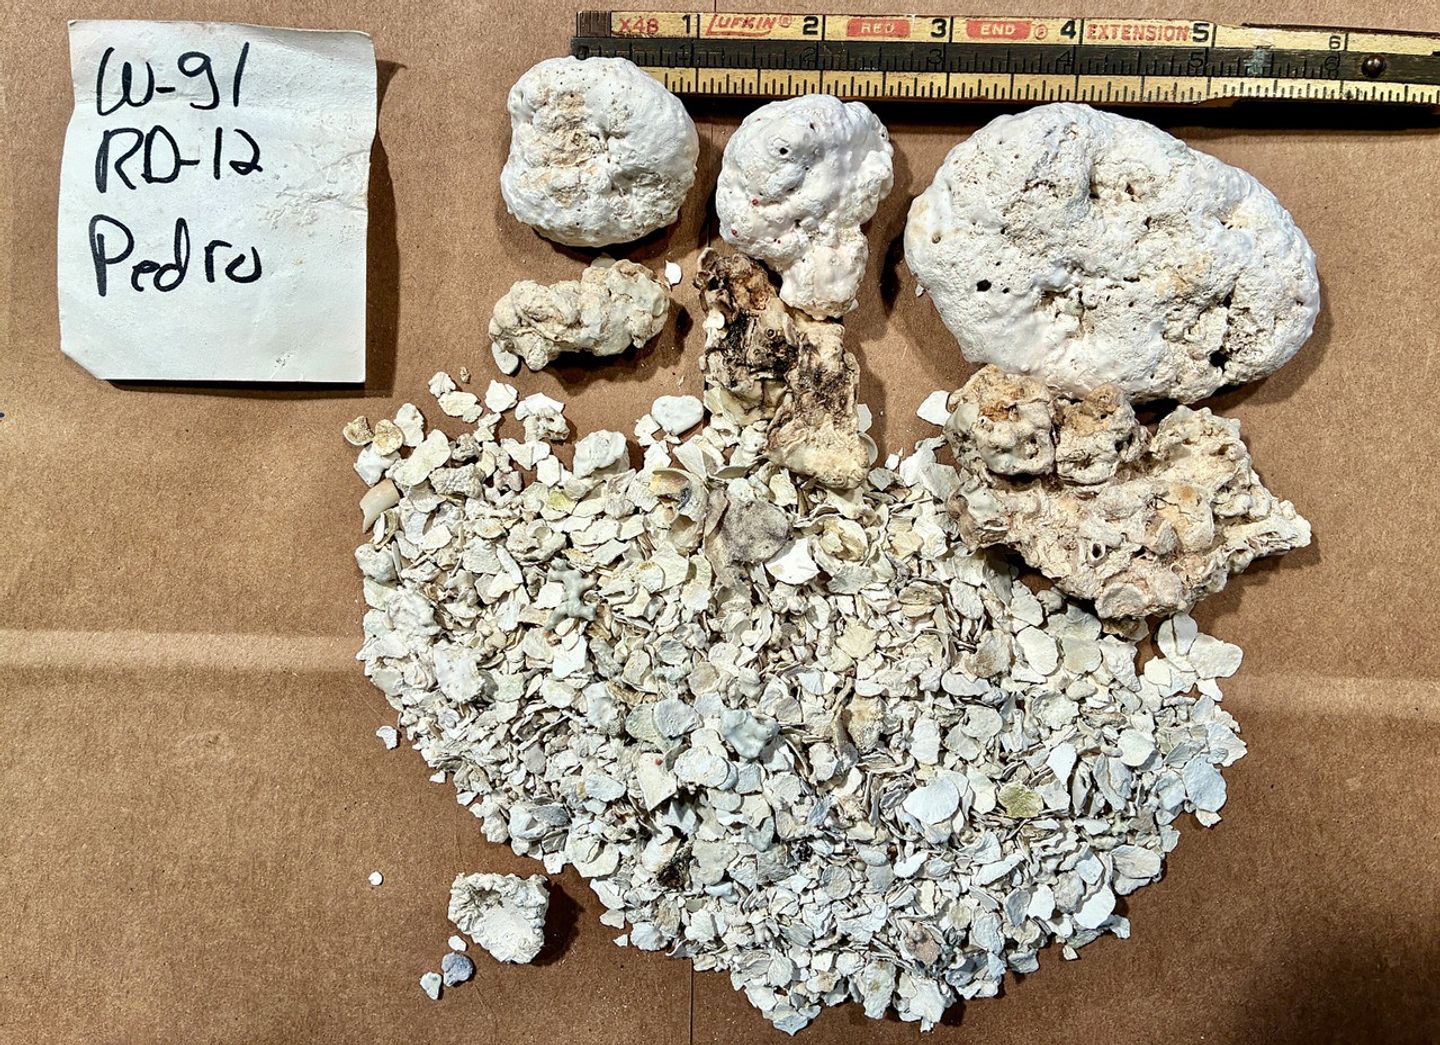
Sediments from the top of Pedro Bank contain masses of calcified red algae, flaky sands made of Halimeda macroalgae remnants, and carbonate mud. The wing-like shape of Halimeda sand allows it to be lifted and transported while waters are turbulent, and finer mud remains suspended longer. These samples were acquired during a research expedition in the winter of 1987-1988 and are archived at the Woods Hole Oceanographic Institution.
Photo by Jude Wilber, January 8, 2026.
Perhaps most consequentially for Earth’s oceans, however, is the effect of the sediment suspension event on the planet’s carbon cycle. Tropical cyclones are an important way for carbon in shallow-water marine sediments to reach deeper waters, where it can remain sequestered for the long term. At depth, carbonate sediments will also dissolve, another important process in the oceanic carbon system.
Near-continuous ocean observations by satellites have enabled greater understanding of these events and their carbon cycling. Acker and Wilber have worked on remote-sensing methods to quantify how much sediment reaches the deep ocean following the turbulence of tropical cyclones, including recently with Hurricane Ian over the West Florida Shelf. Now, hyperspectral observations from NASA’s PACE (Plankton, Aerosol, Cloud, ocean Ecosystem) mission, launched in February 2024, are poised to build on that progress, Acker said.
The phenomenon at Pedro Bank following Hurricane Melissa provided a singular opportunity to study this and other complex ocean processes—a large natural experiment that could not be accomplished any other way. Researchers will be further investigating a range of physical, geochemical, and biological aspects illuminated by this occurrence. As Wilber put it: “This event is a whole course in oceanography.”
NASA Earth Observatory images by Michala Garrison, using MODIS data from NASA EOSDIS LANCE and GIBS/Worldview, and ocean bathymetry data from the British Oceanographic Data Center’s General Bathymetric Chart of the Oceans (GEBCO). Photo by Jude Wilber. Story by Lindsey Doermann.
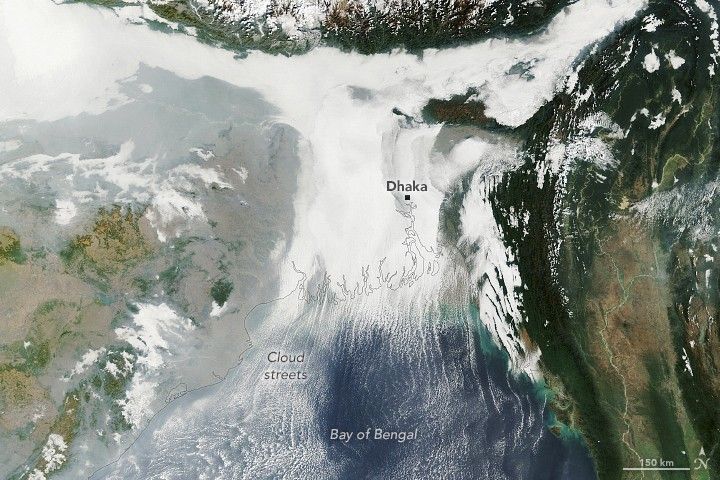
Winter weather took hold across the Indo-Gangetic Plain in early January 2026, bringing dense fog and cold temperatures to much of the flat, fertile lands that span from Pakistan and northern India to Bangladesh.
This image shows low-lying clouds over the delta on the morning of January 6, captured by the MODIS (Moderate Resolution Imaging Spectroradiometer) on NASA’s Terra satellite. Dense fog, particularly radiation fog, is common this time of year, forming when ground temperatures are cool, winds are light, and moisture is abundant near the surface. The meteorological departments of both Bangladesh and India called for moderate to very dense fog over the region that day amid an ongoing cold wave.
Other relatively low-level clouds extend from the land areas and over the Bay of Bengal. These long, parallel bands of clouds, known as cloud streets, can form when cold air passes over warmer open water, gaining heat and moisture. Rising thermals ascend until they reach a temperature inversion that acts like a lid, forcing the air to roll into long, parallel rotating cylinders. Clouds develop where the air rises, while clear skies appear where the air sinks.
While it appears scenic from above, foggy conditions can pose hazards and snarl daily life for people on the ground. For instance, dense fog early in the month caused major disruptions at the international airport in Dhaka, according to local news reports. Similar disruptions, along with travel delays on roads and railways, were reported in parts of northern, central, and eastern India.
NASA Earth Observatory image by Lauren Dauphin, using MODIS data from NASA EOSDIS LANCE and GIBS/Worldview. Story by Kathryn Hansen.
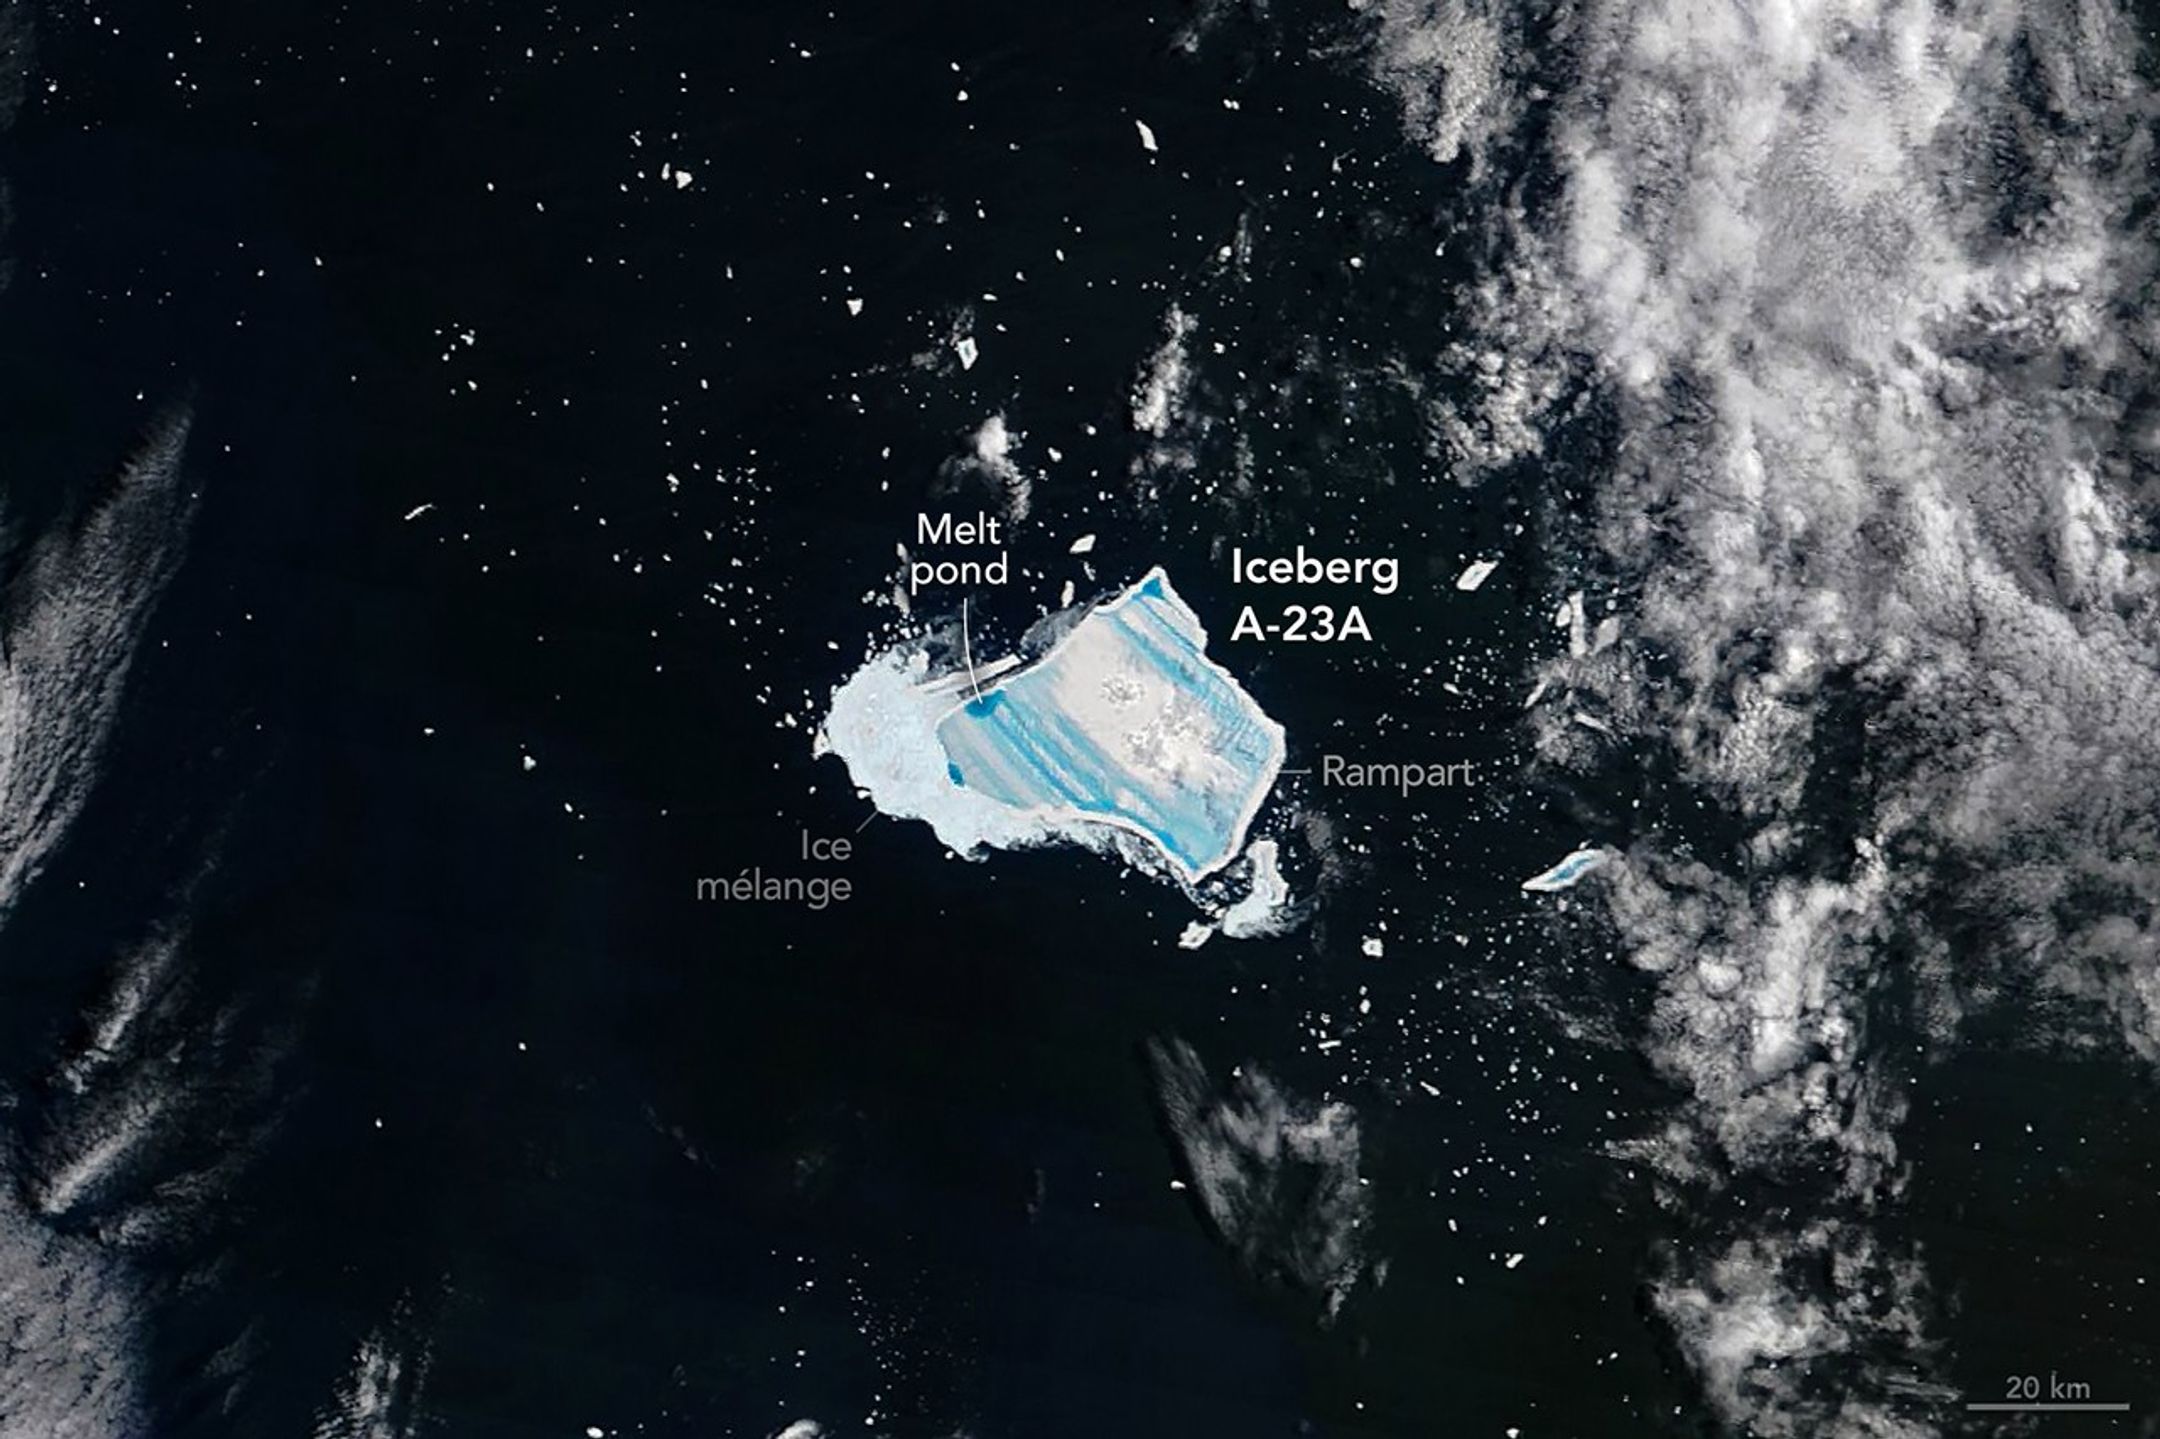
The year that iceberg A-23A first broke away from Antarctica’s Filchner Ice Shelf, Ronald Reagan was president of the United States, and the movie Top Gun was setting box office records. Forty years later, the massive tabular berg—one of the largest and longest-lived bergs ever tracked by scientists—is sopping with blue meltwater and on the verge of complete disintegration as it drifts in the South Atlantic between the eastern tip of South America and South Georgia island.
When it first detached from Antarctica in 1986, the berg was nearly twice the size of Rhode Island—about 4,000 square kilometers. Estimates from the U.S. National Ice Center put the berg’s area at 1,182 square kilometers (456 square miles) in early January 2026, following the breakup of several sizable pieces in July, August, and September of 2025 as it moved into relatively warm summer conditions by December.
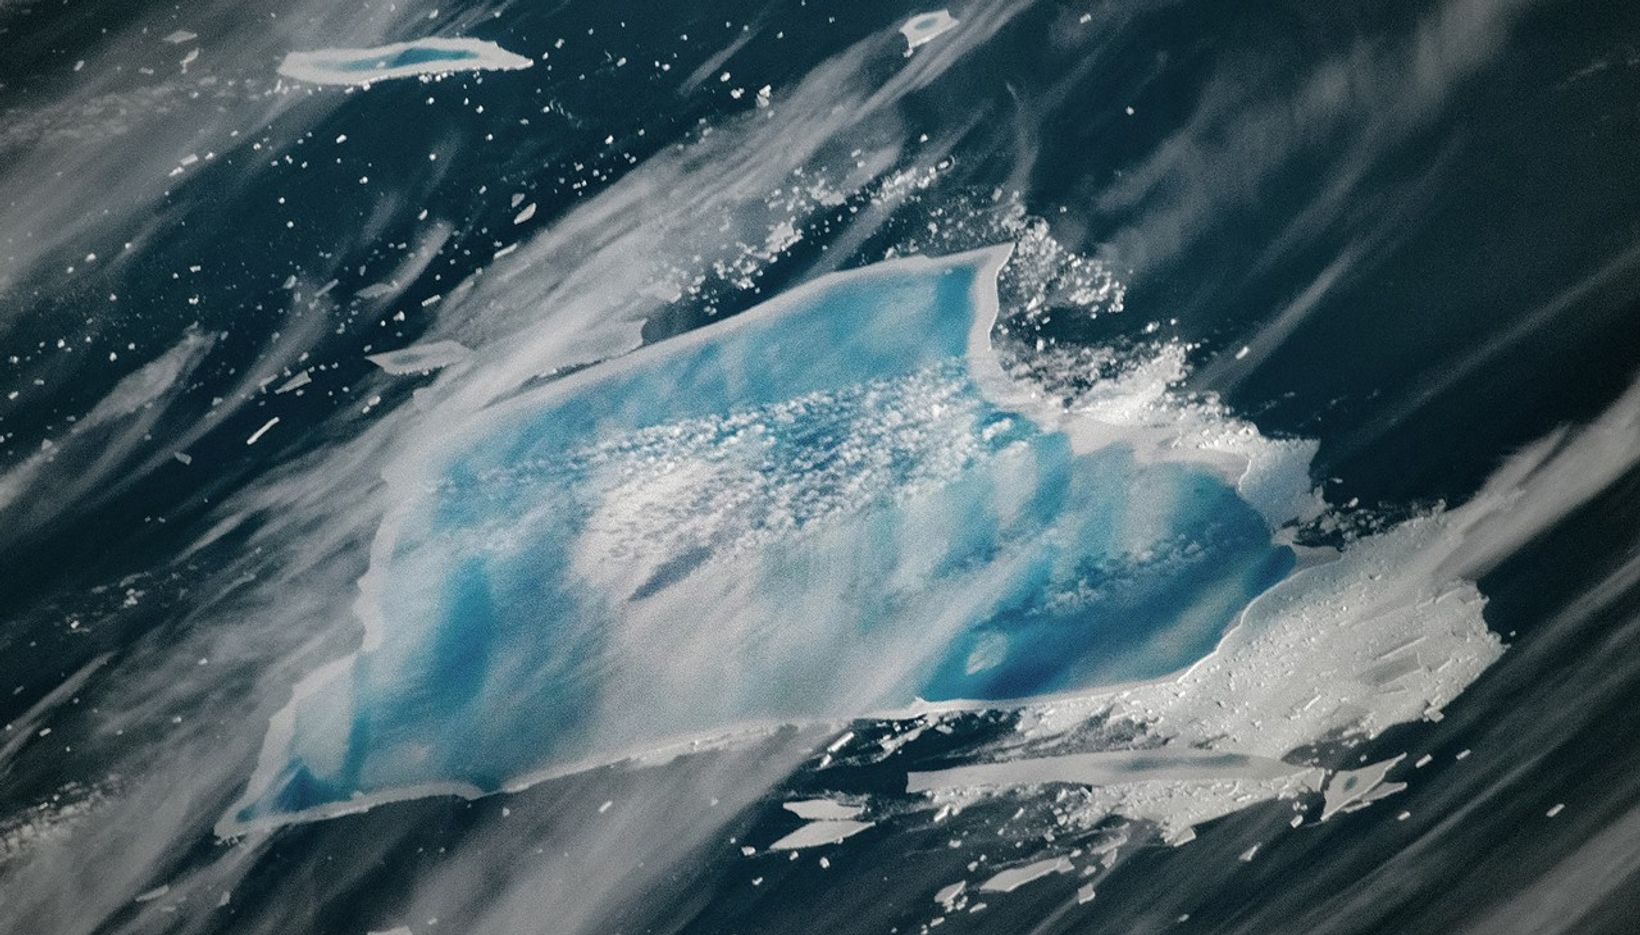
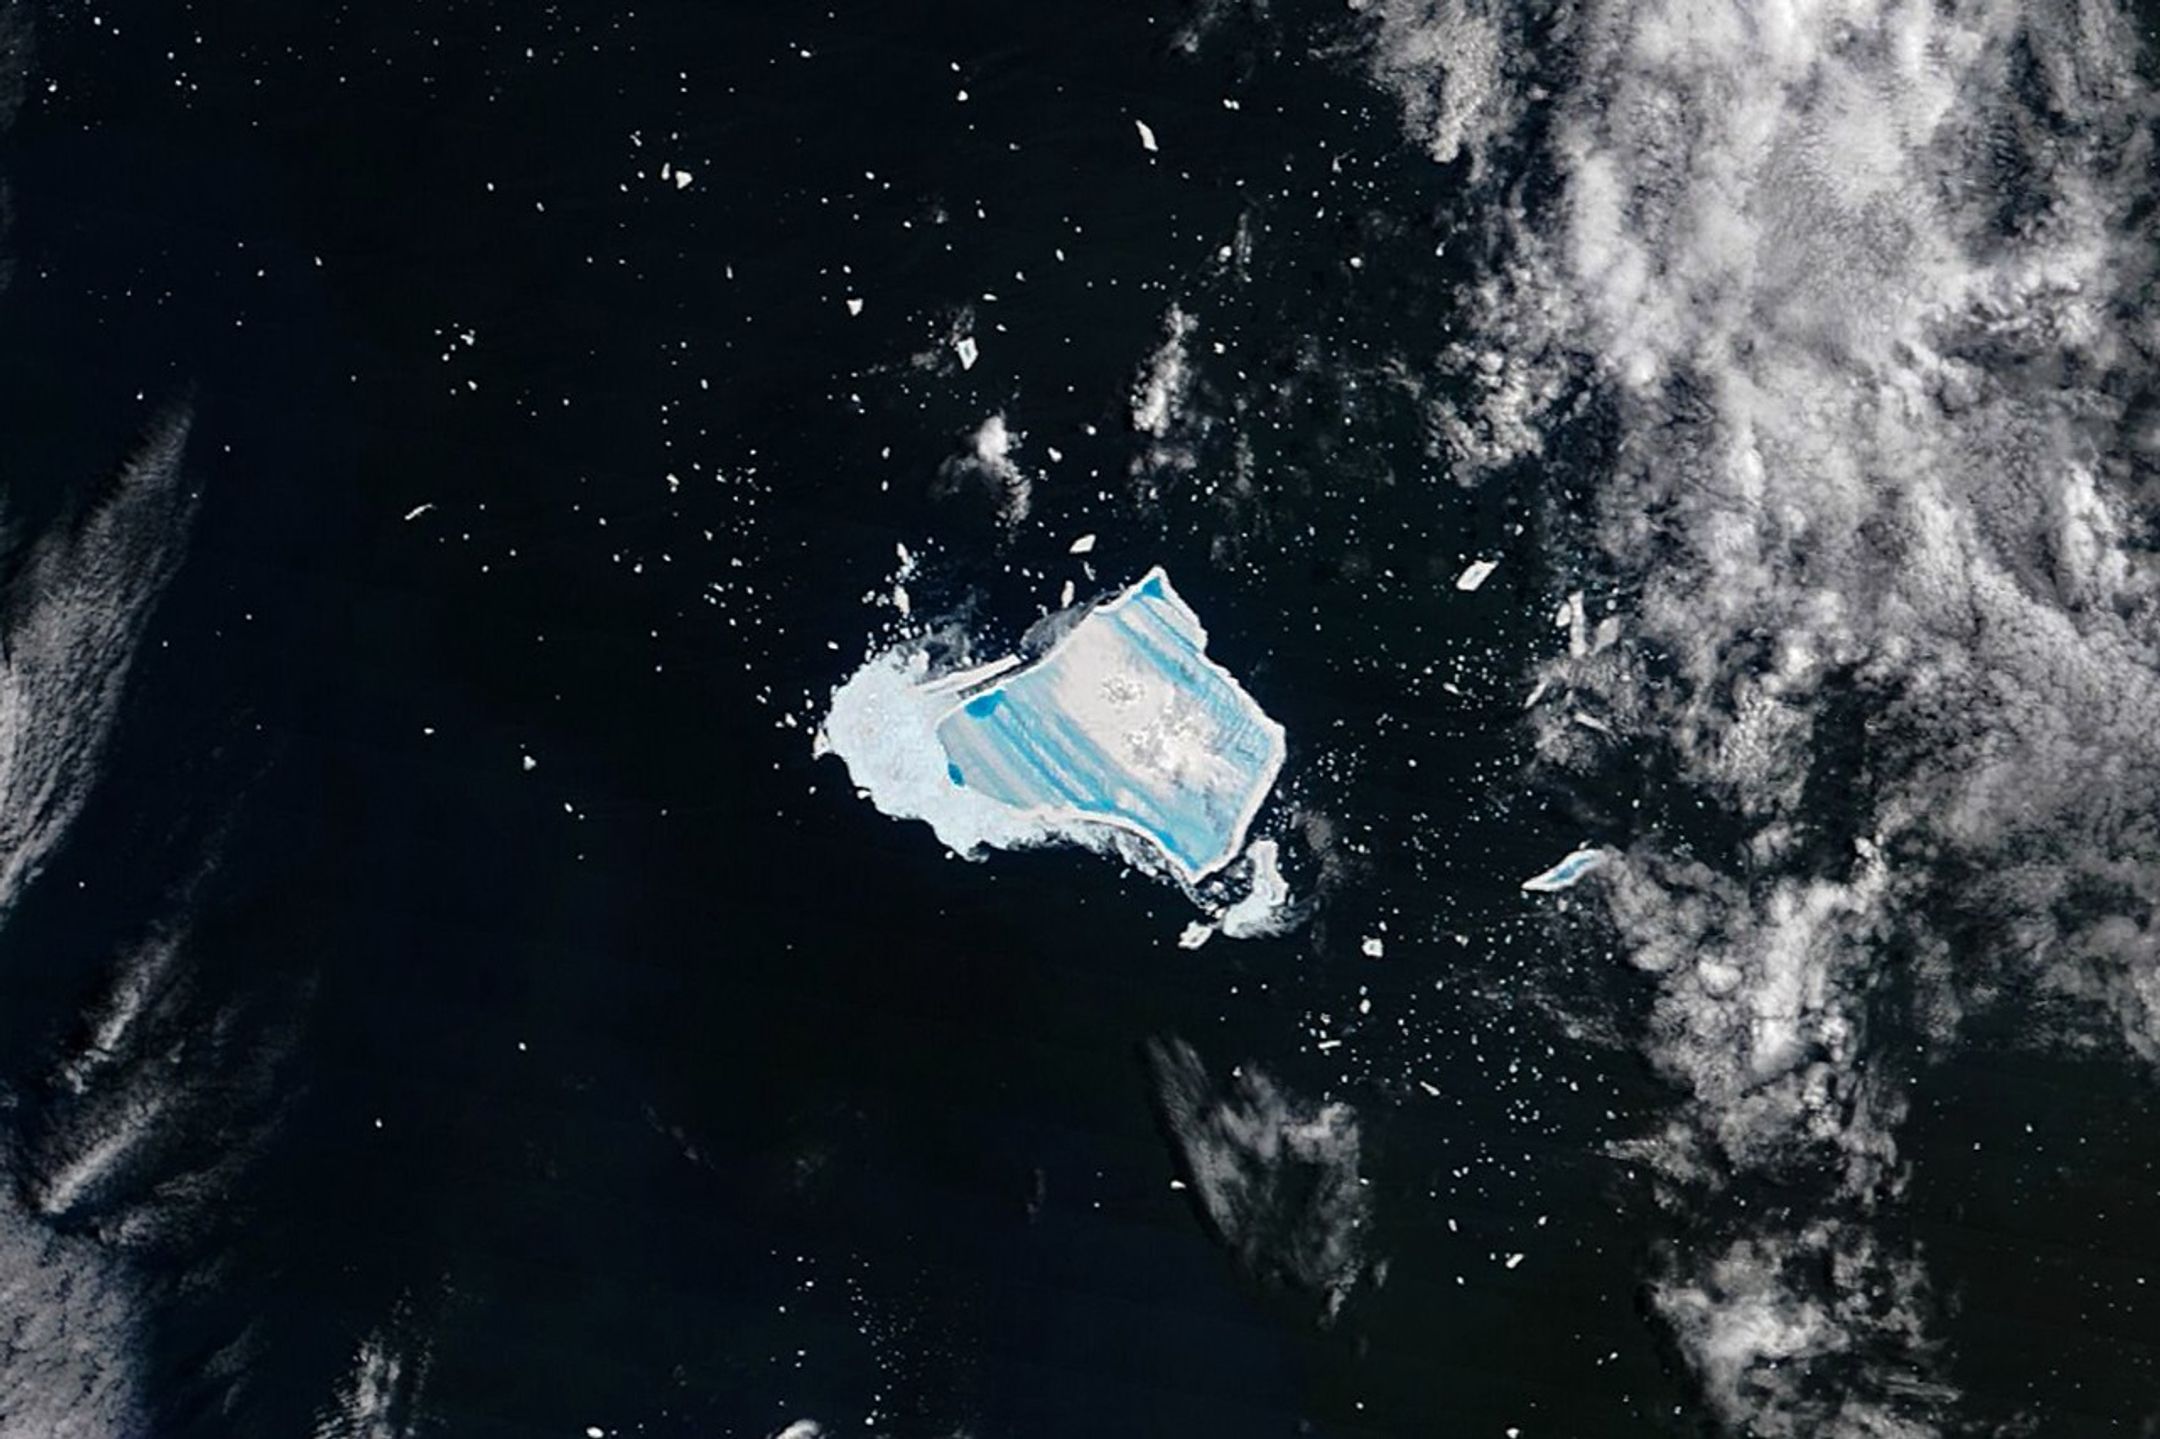
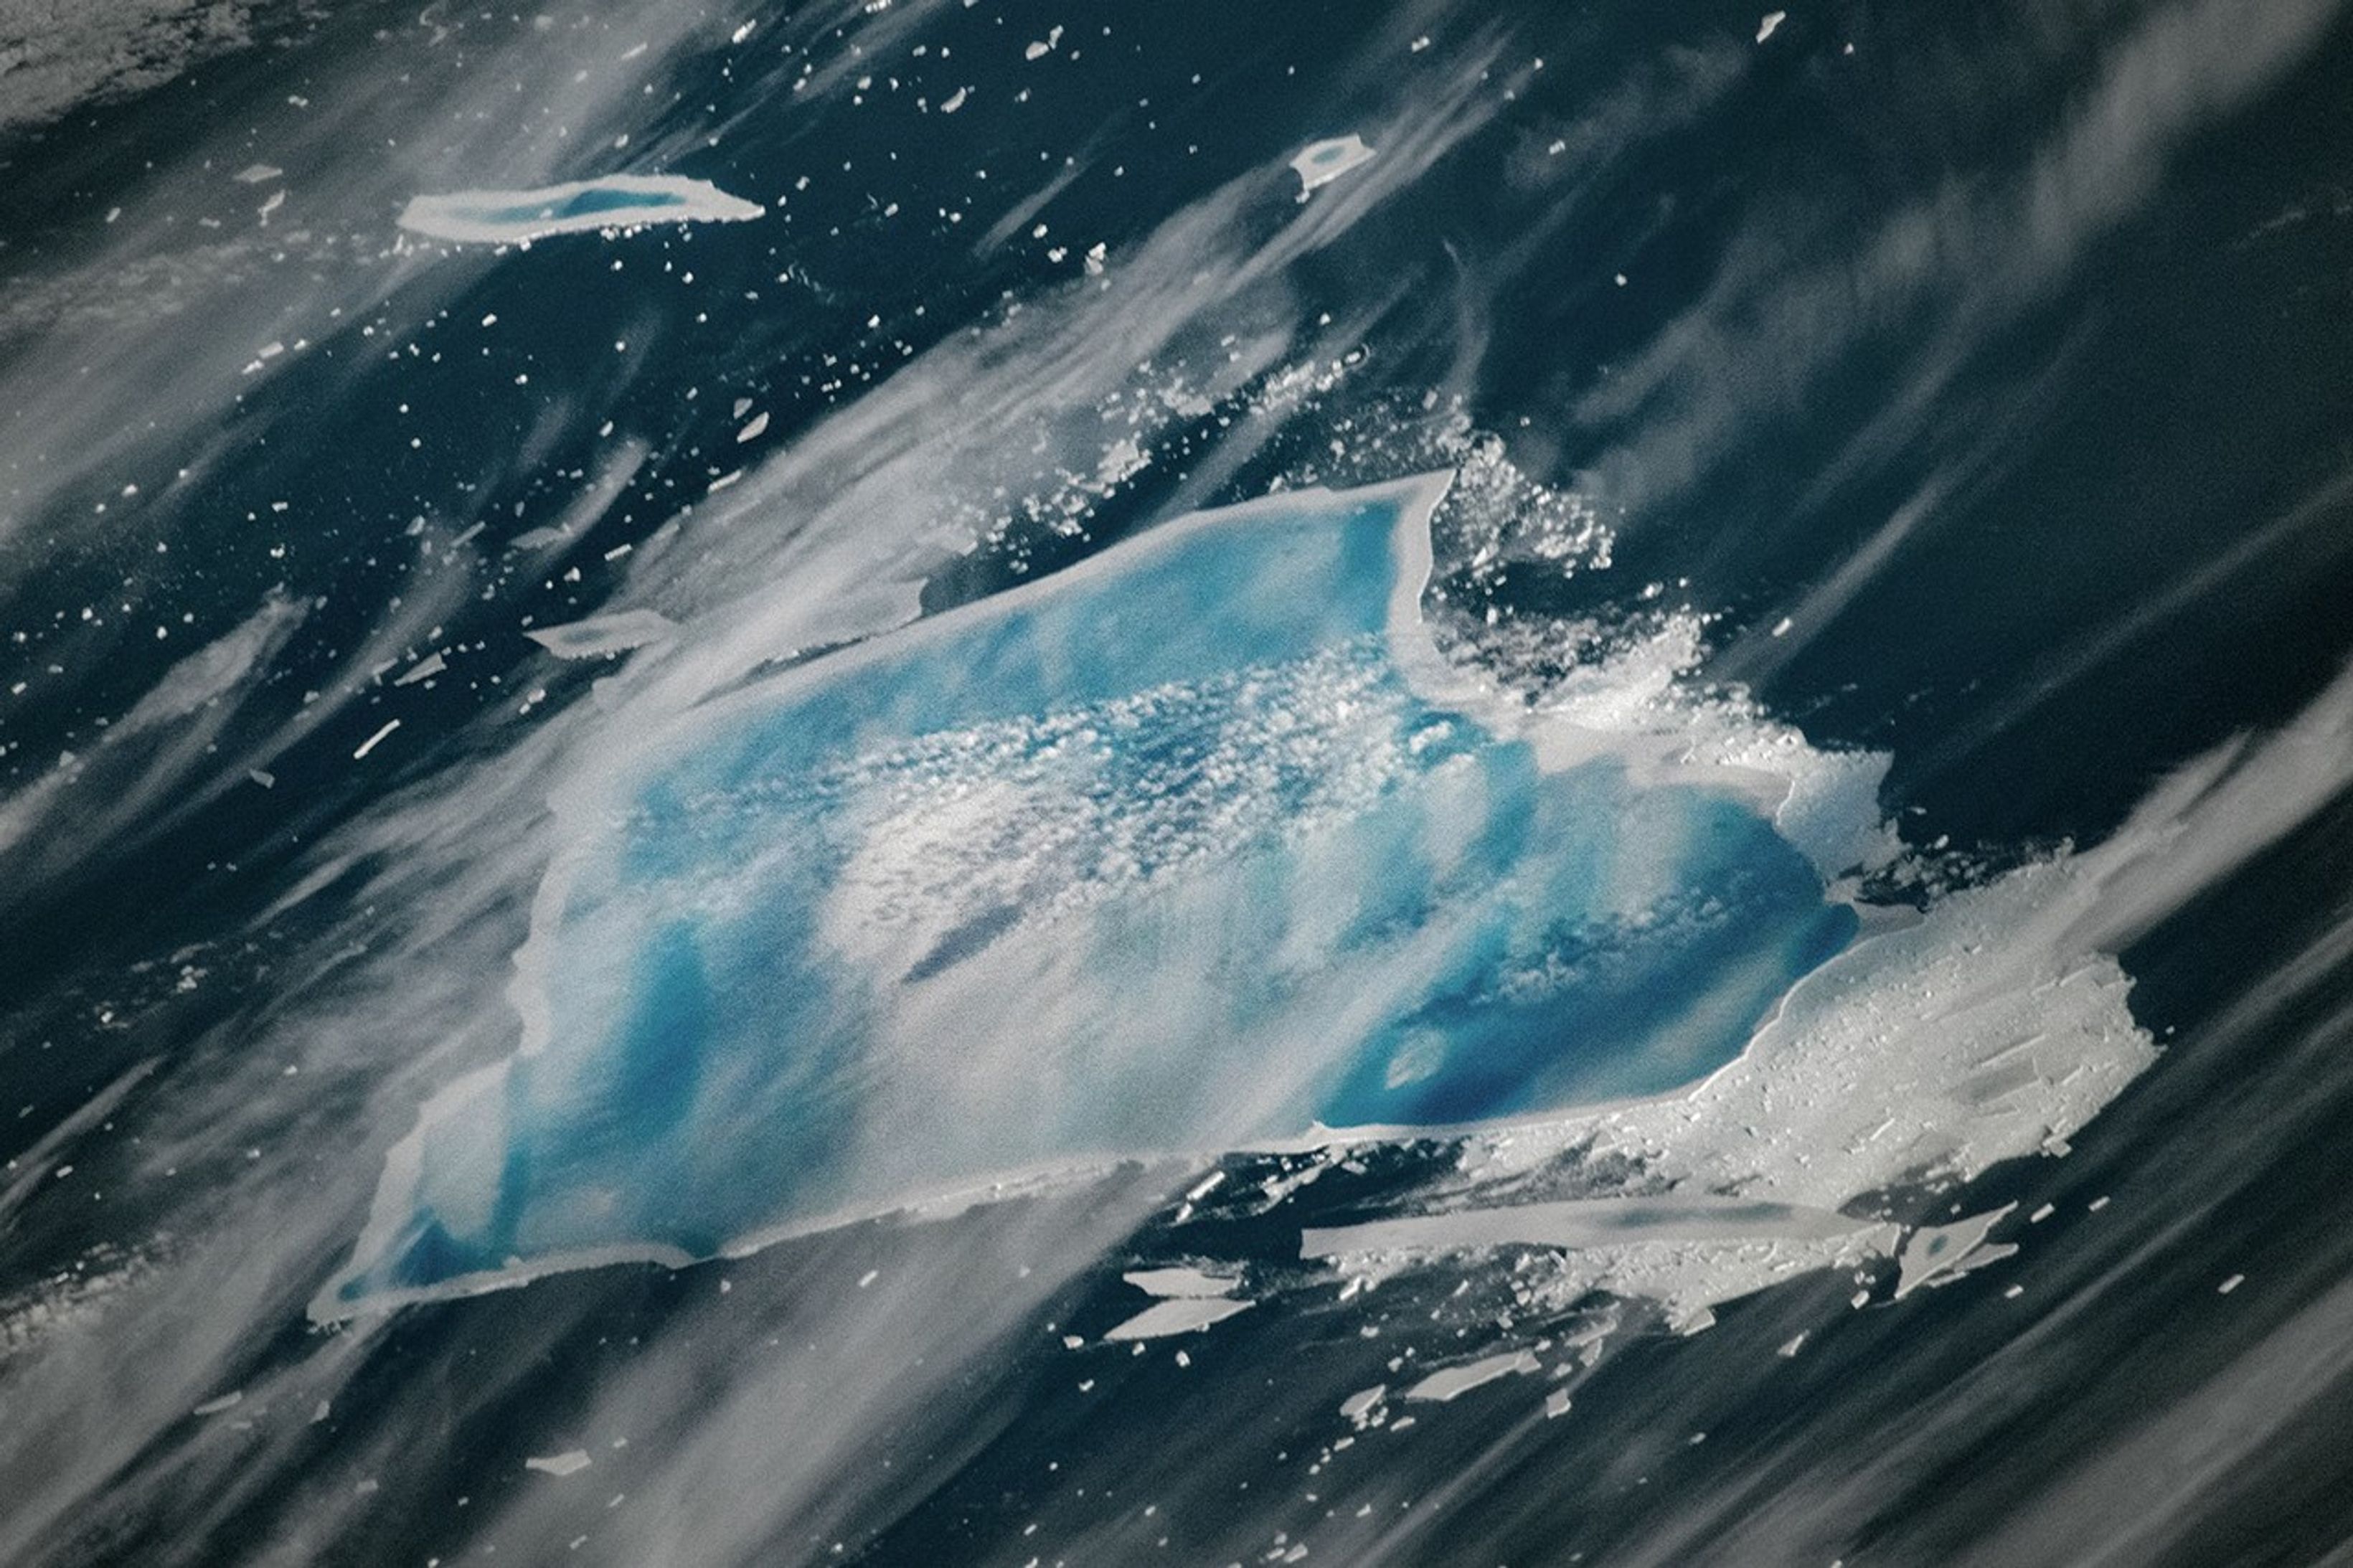
When the MODIS (Moderate Resolution Imaging Spectroradiometer) on NASA’s Terra satellite captured this image of what remained of the waterlogged berg on December 26, 2025, extensive pools of blue meltwater were visible on its surface. Though much smaller than it once was, what remains is still among the largest icebergs in the ocean, covering an area larger than New York City. An astronaut aboard the International Space Station captured a photograph showing a closer view (below) of the iceberg a day later, with an even more extensive melt pool.
The “blue-mush” areas are likely the result of ongoing disintegration events, explained Ted Scambos, a senior research scientist at the University of Colorado Boulder. “You have the weight of the water sitting inside cracks in the ice and forcing them open,” he said. Note also the thin white line around the outer edge of the iceberg seemingly holding in blue meltwater—a “rampart-moat” pattern caused by an upward bending of the iceberg plate as its edges melt at the waterline.
December 27, 2025
The striking linear patterns of blue and white across the berg are likely related to striations that were scoured hundreds of years ago when the ice was part of a glacier dragging across Antarctic bedrock.
“The striations formed parallel to the direction of flow, which ultimately created subtle ridges and valleys on the top of the iceberg that now direct the flow of meltwater,” explained Walt Meier, a senior research scientist at the National Snow & Ice Data Center. “It’s impressive that these striations still show up after so much time has passed, massive amounts of snow have fallen, and a great deal of melting has occurred from below,” added retired University of Maryland Baltimore County scientist Chris Shuman.
The MODIS image suggests that the ailing iceberg has also sprung a leak. The white area to its left may be the result of what Shuman described as a “blowout.” The weight of the water pooling at the top of the towering iceberg would have created enough pressure at the edges to punch through. The blowout may have allowed meltwater to spill tens of meters down to the ocean surface in what researchers call a “freshwater discharge plume,” where it mixed with the mélange of ice bits floating next to the iceberg.
Scientists say these signs indicate the iceberg could be just days or weeks from disintegrating completely. “I certainly don’t expect A-23A to last through the austral summer,” said Shuman, noting that the season typically brings clearer skies and warmer air and water temperatures—factors that accelerate the disintegration process in an area known among ice experts as a “graveyard” for icebergs. It’s already in water that’s about 3 degrees Celsius and riding currents that are pushing it toward even warmer waters that will eat away at it quickly, added Meier.
Even by Antarctic standards, A-23A has had a long, winding journey full of unexpected chapters that have improved scientists’ understanding of the “megabergs” occasionally released into the Southern Ocean. After grounding in the shallow waters of the Weddell Sea for more than 30 years, A-23A broke free in 2020, then spent several months in a twirling ocean vortex called a Taylor column. It eventually spun away and headed north, nearly colliding with South Georgia island and lodging in shallow waters for several months before escaping into the open ocean, where it has been rapidly breaking apart throughout 2025.
Scientists who have been tracking the berg for their entire careers see its imminent demise as a bittersweet moment. “I’m incredibly grateful that we’ve had the satellite resources in place that have allowed us to track it and document its evolution so closely,” said Shuman. “A-23A faces the same fate as other Antarctic bergs, but its path has been remarkably long and eventful. It’s hard to believe it won’t be with us much longer.”
Even as A-23A fades, other massive bergs are parked or drifting along the Antarctic shoreline. Several, including A-81, B22A, and D15A, are each larger than 1,500 square kilometers and sit waiting for their moment to break free and begin their journey north.
NASA Earth Observatory image by Michala Garrison, using MODIS data from NASA EOSDIS LANCE and GIBS/Worldview. ISS Astronaut photograph ISS074-E-8943 was acquired on December 27, 2025, with a Nikon Z 9 digital camera using a focal length of 500 millimeters. It is provided by the ISS Crew Earth Observations Facility and the Earth Science and Remote Sensing Unit at NASA Johnson Space Center. The image was taken by a member of the Expedition 74 crew. The image has been cropped and enhanced to improve contrast, and lens artifacts have been removed. The International Space Station Program supports the laboratory as part of the ISS National Lab to help astronauts take pictures of Earth that will be of the greatest value to scientists and the public, and to make those images freely available on the Internet. Additional images taken by astronauts and cosmonauts can be viewed at the NASA/JSC Gateway to Astronaut Photography of Earth. Story by Adam Voiland.
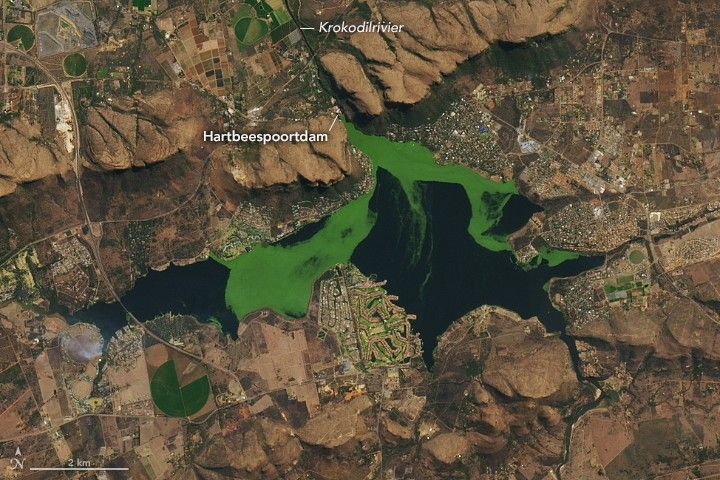
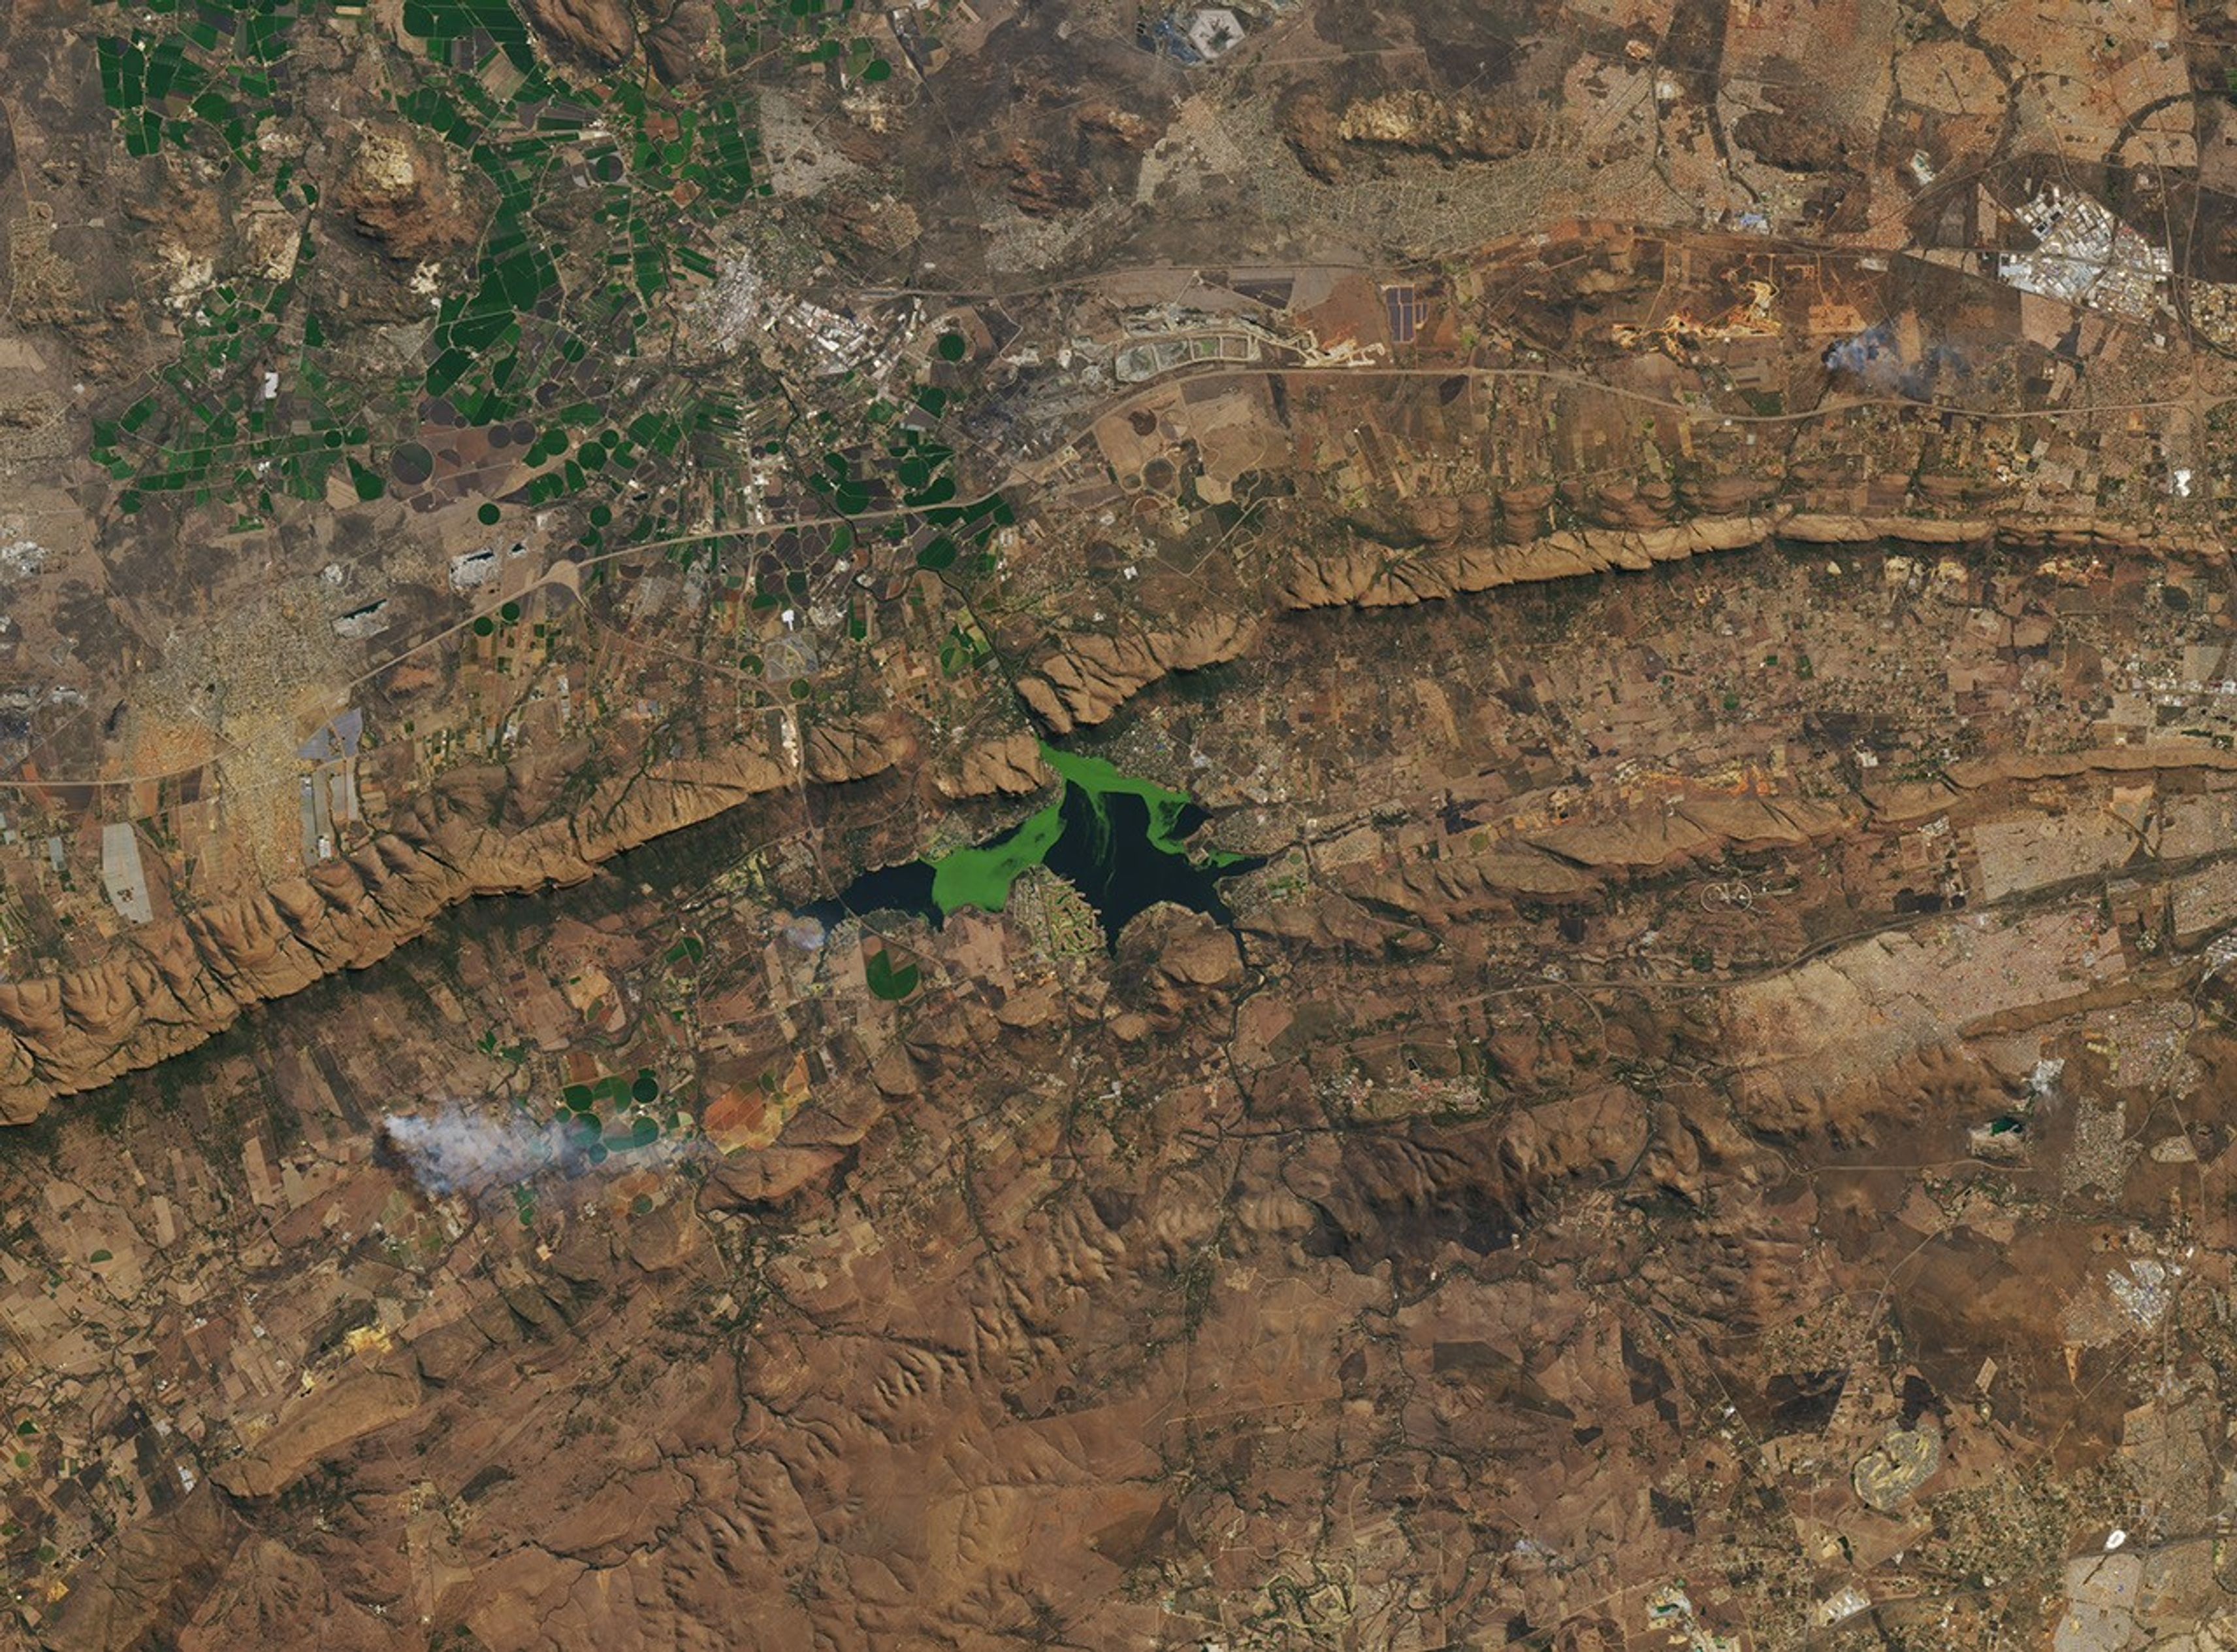
On clear days in Hartbeespoort, South Africa, satellite images often reveal a reservoir with shades of deep blue interrupted by drifting patches of vivid green. These shifting features indicate algae blooms, which can affect water quality, ecosystems, and nearby human communities.
In this animation, from June 2022 to July 2023, an algal bloom grows, moves around the reservoir, and then fades. The animation is composed of images from Harmonized Landsat and Sentinel-2 (HLS), a NASA product that combines imagery from the NASA/USGS Landsat 8 and Landsat 9 satellites and the European Space Agency’s Sentinel-2A, 2B, and 2C satellites.
Algae is an umbrella term for photosynthetic organisms that live in water, encompassing everything from single-celled cyanobacteria to seaweed. They play a vital role in maintaining healthy ecosystems. But when colonies of algae spread too widely or release harmful toxins, they can threaten the very environments they support. These colonies are known as harmful algal blooms, or HABs.
Some HABs are toxic and often are part of a process called eutrophication. Eutrophication begins when there are too many nutrients in an ecosystem—because of agricultural runoff and other inputs—leading to a rapid growth of algae.
“It’s like having a garden,” said Bridget Seegers, a NASA scientist who studies cyanobacteria in freshwater ecosystems. “If you add a lot of nutrients, you’re going to have a lot of growth.”
Eventually, the algae die off. As decomposers break down the dead algae, they consume oxygen, which can lead to hypoxia and the formation of dead zones.
August 10, 2022
Such conditions have been documented at the Hartbeespoortdam (Hartbeespoort Dam) reservoir, located about 25 kilometers (16 miles) west of Pretoria and used primarily for recreation and irrigation. The reservoir is home to regular harmful algal blooms containing cyanobacteria. It also hosts large mats of invasive water hyacinths. While hyacinths do not produce toxins, they do contribute to eutrophication when they die and decompose.
Harmful algal blooms can affect ecosystem health and human lives and livelihoods. In April 2023, South African authorities linked a large fish kill in Hartbeespoort to low oxygen levels caused by excessive algal growth. More broadly, HABs in drinking water reservoirs can reduce water availability and raise water treatment costs, while swimming in HAB-infested waters can cause rashes, and pets or livestock that drink it may fall ill or die.
One 2022 paper published in Remote Sensing examined algae in the reservoir from 1980 to 2020 using Landsat data. “This is a reservoir that has always been monitored heavily by the local department of water resources,” said Adam Ali, the lead author of the paper. The research used satellite data to provide a big-picture view of conditions across the entire reservoir over long time scales. Using 40 years of Landsat data, the researchers found that the biggest drivers of algal growth were total phosphorus content—a nutrient found in runoff—and water temperature, with blooms typically expanding in the warm summer months and subsiding in the winter.
They also identified key trends over space and time. Algal productivity was higher near Krokodilrivier (Crocodile River) inflows and in the western part of the reservoir due to golf course runoff and restricted water circulation, demonstrating how HABs are influenced by runoff and river inputs. Large blooms occurred between 1982 and 1986, when total phosphorus levels were high. A bioremediation program in the late 1980s succeeded in limiting algae growth, but after funding ended in the late 1990s, harmful algal blooms spiked again in the early 2000s.
To track algae from space, the researchers analyzed the water’s color by measuring different wavelengths of light. From this, they estimated the concentration of chlorophyll-a, a common pigment in algae, and used these values to approximate algae biomass over time. Although water samples remain necessary to confirm that a bloom is harmful, satellite data can help scientists understand the drivers of harmful algal blooms, especially in remote regions where regular ground monitoring is expensive and time intensive.
New and forthcoming NASA missions promise to advance space-based water quality monitoring. The next Landsat satellite is expected to measure wavelengths specifically designed to detect HABs. NASA’s PACE (Plankton, Aerosol, Cloud, ocean Ecosystem) mission, launched in 2024, collects data in hundreds of precise wavelength bands in the visible spectrum, which can help scientists identify the type of algae that comprise a certain bloom—a key factor in determining toxicity. Given PACE’s spatial resolution, the data is most useful in coastal areas or larger inland water bodies. Ali is working with researchers at NASA Ames to integrate PACE into future studies.
Animation by Ross Walter/Landsat Science Office Support, using data from the Harmonized Landsat and Sentinel-2 (HLS) product. HLS is funded by NASA and is a deliverable of the Satellite Needs Working Group (SNWG), an interagency effort of the U.S. Government dedicated to identifying and addressing Earth observation needs across U.S. civilian federal agencies.Still image by Lauren Dauphin/NASA Earth Observatory using Landsat data from the U.S. Geological Survey. Story by Madeleine Gregory/Landsat Science Office Support.
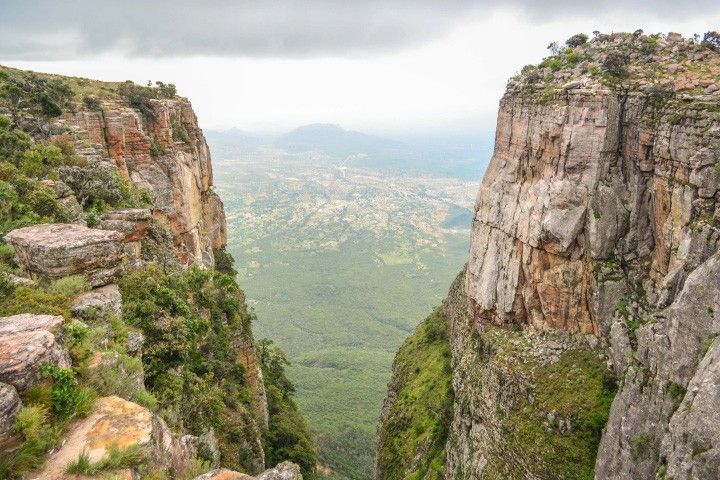
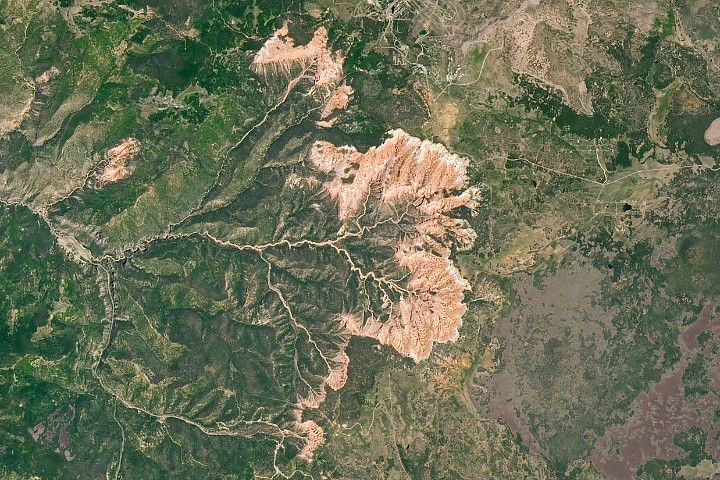
In southwestern Angola, an expanse of coastal plains comes to an abrupt end at a natural barrier. The Huíla plateau soars above the lowlands to elevations of around 2,300 meters (7,500 feet). The sharp transition results in dramatic landscapes and a sudden change from an arid environment to more-temperate climes.
The serrated edge of the Huíla plateau zigzags through this image, which is a mosaic of scenes acquired on June 19 and 20, 2025, with the OLI-2 (Operational Land Imager-2) and OLI on the Landsat 9 and Landsat 8 satellites, respectively. Areas around the plateau’s edges appear green with vegetation. But the landscape tends to look much browner by late September, at the end of the region’s dry season, during which almost no rain falls.
This topography is part of the Great Escarpment of southern Africa, a 5,000-kilometer-long feature running roughly parallel to the continent’s edge. From Angola, it extends south through Namibia, across South Africa, and then northeast into Zimbabwe and Mozambique. The image below, acquired with the VIIRS (Visible Infrared Imaging Radiometer Suite) on the Suomi NPP satellite, shows a longer segment of the escarpment in Angola.
June 20, 2025
Scientists believe the escarpment formed after the breakup of the supercontinent Gondwana in the Jurassic period. Since then, erosion has worn away at the continental margin such that the escarpment now sits 50 to 200 kilometers (30 to 120 miles) back from the coast.
This Angolan section of the escarpment features dizzying, yet beautiful, landscapes. Tundavala Gap, a gouge eroded into the cliff line (below), is one of the most iconic with its well-framed view of the plains below. The precipice also presents a substantial obstacle to transportation. A stretch of the Namibe-Lubango Road overcomes this challenge with a series of scenic hairpin turns climbing to Serra da Leba pass near the town of Leba.
March 11, 2014
Lubango, one of Angola’s largest cities, occupies a valley on the Huíla plateau. In addition to its remarkable natural surroundings, the city boasts a diverse mix of cultures, striking architecture, and a wide variety of locally produced foods.
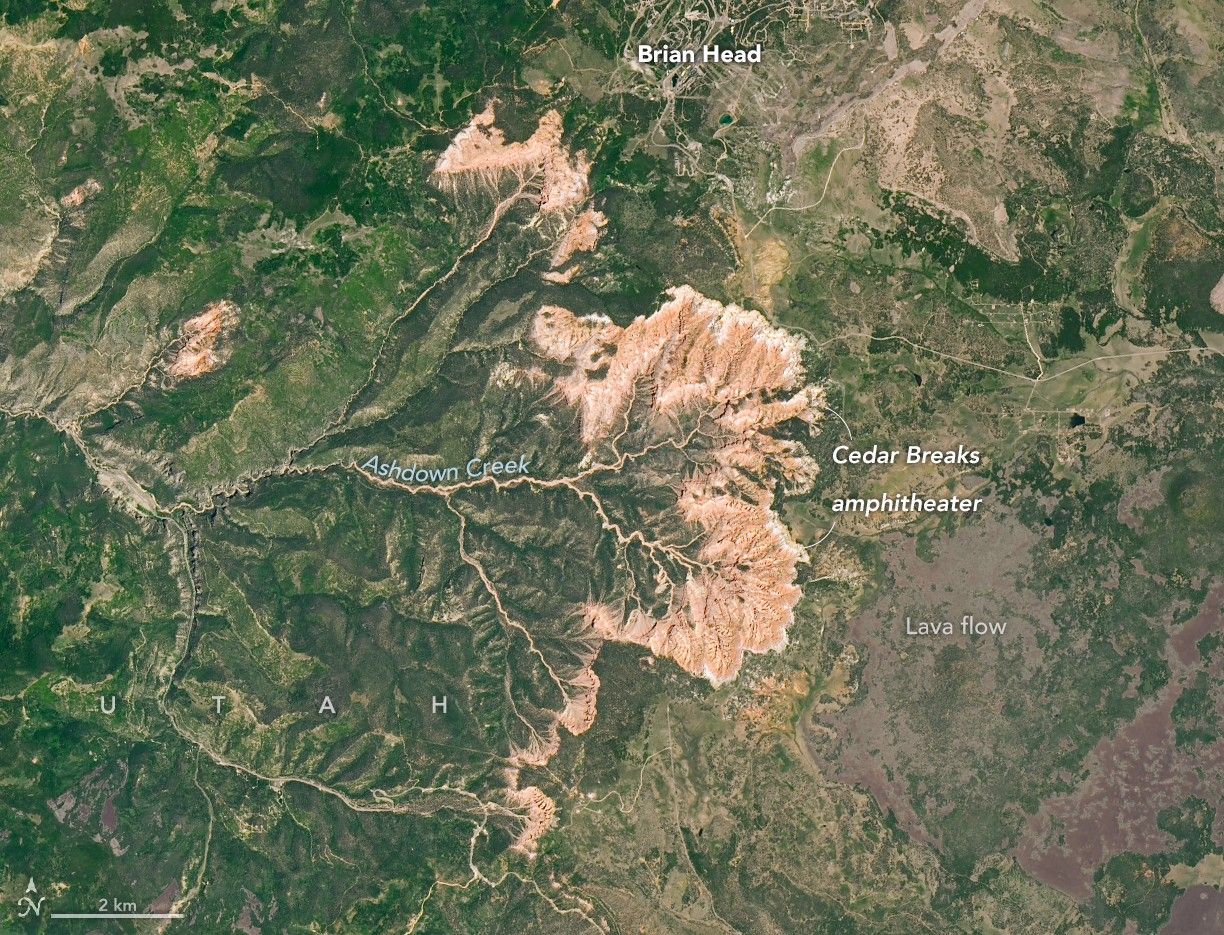
When people stand at the rim of the amphitheater in Utah’s Cedar Breaks National Monument and look down on an otherworldly landscape of multicolored rock spires, pinnacles, and other geologic oddities, they’re looking across tens of millions of years of Earth’s history. The same can be said when viewing the bowl-shaped escarpment from space.
The OLI-2 (Operational Land Imager-2) on Landsat 9 captured this view of the amphitheater’s semicircular rim and deeply eroded drainages on June 18, 2025. The erosive power of water from Ashdown Creek and several tributaries, along with relentless physical and chemical weathering, is evident in the many channels, cliffs, and canyons that radiate outward from the rim and define the escarpment and amphitheater.
The feature’s striking rock formations are composed of sedimentary rock layers laid down roughly 50 to 25 million years ago within a basin that, at times, held a large body of water called Lake Claron. Many of the amphitheater’s limestone layers began as sediments that settled on its lakebed as carbonate-rich muds.
Differences in rock type and color, evident in the layering seen in ground photographs and to a degree in Landsat images, reflect differences in environmental conditions during deposition. Lake Claron, for instance, was sometimes quite deep, but during dry periods it was shallow or nonexistent. In wet conditions, iron in muddy sediments was scarce or had too little exposure to oxygen to oxidize, or rust, leaving the resulting rock white or gray. During drier periods, iron in sediments had greater exposure to oxygen, forming minerals that turned layers red and orange.
The rim at Cedar Breaks, the top of the staircase, sits about 10,000 feet (3,000 meters) above sea level, roughly 7,000 feet above the Colorado River in the Grand Canyon. The high elevation influences everything from the weather to the plants and animals that live there. Winters are long, cold, and snowy, with nearby Brian Head seeing 30 feet (10 meters) of snowfall each year on average.
While the cool temperatures and short growing season are an impediment to many types of vegetation, the slow-growing and notoriously long-lived bristlecone pines found along the escarpment’s rim use the harsh conditions to their advantage. Slow growth makes their wood unusually dense, which protects the trees from disease and insects. Likewise, their ability to survive in thin soils, on mostly barren limestone outcrops where little else can grow, protects them from wildfires. Some of the oldest bristlecones in the monument are more than 1,700 years old.
Sitting atop the sedimentary layers, signs of a more volcanically active period also appear in the image. The dark basaltic lava flows visible to the east of the amphitheater formed between 5 million and 10,000 years ago, when several volcanoes on the Markagunt Plateau erupted regularly. Areas of soft, gray rock around the summit of Brian Head—now the site of a ski resort—formed when pyroclastic flows left deposits of tuff strewn across the landscape.
NASA Earth Observatory images by Michala Garrison, using Landsat data from the U.S. Geological Survey. Story by Adam Voiland.
References & Resources
Cedar Breaks National Monument Bristlecone Pines. Accessed December 18, 2025.
Global Volcanism Program (2013) Markagunt Plateau. Accessed December 18, 2025.
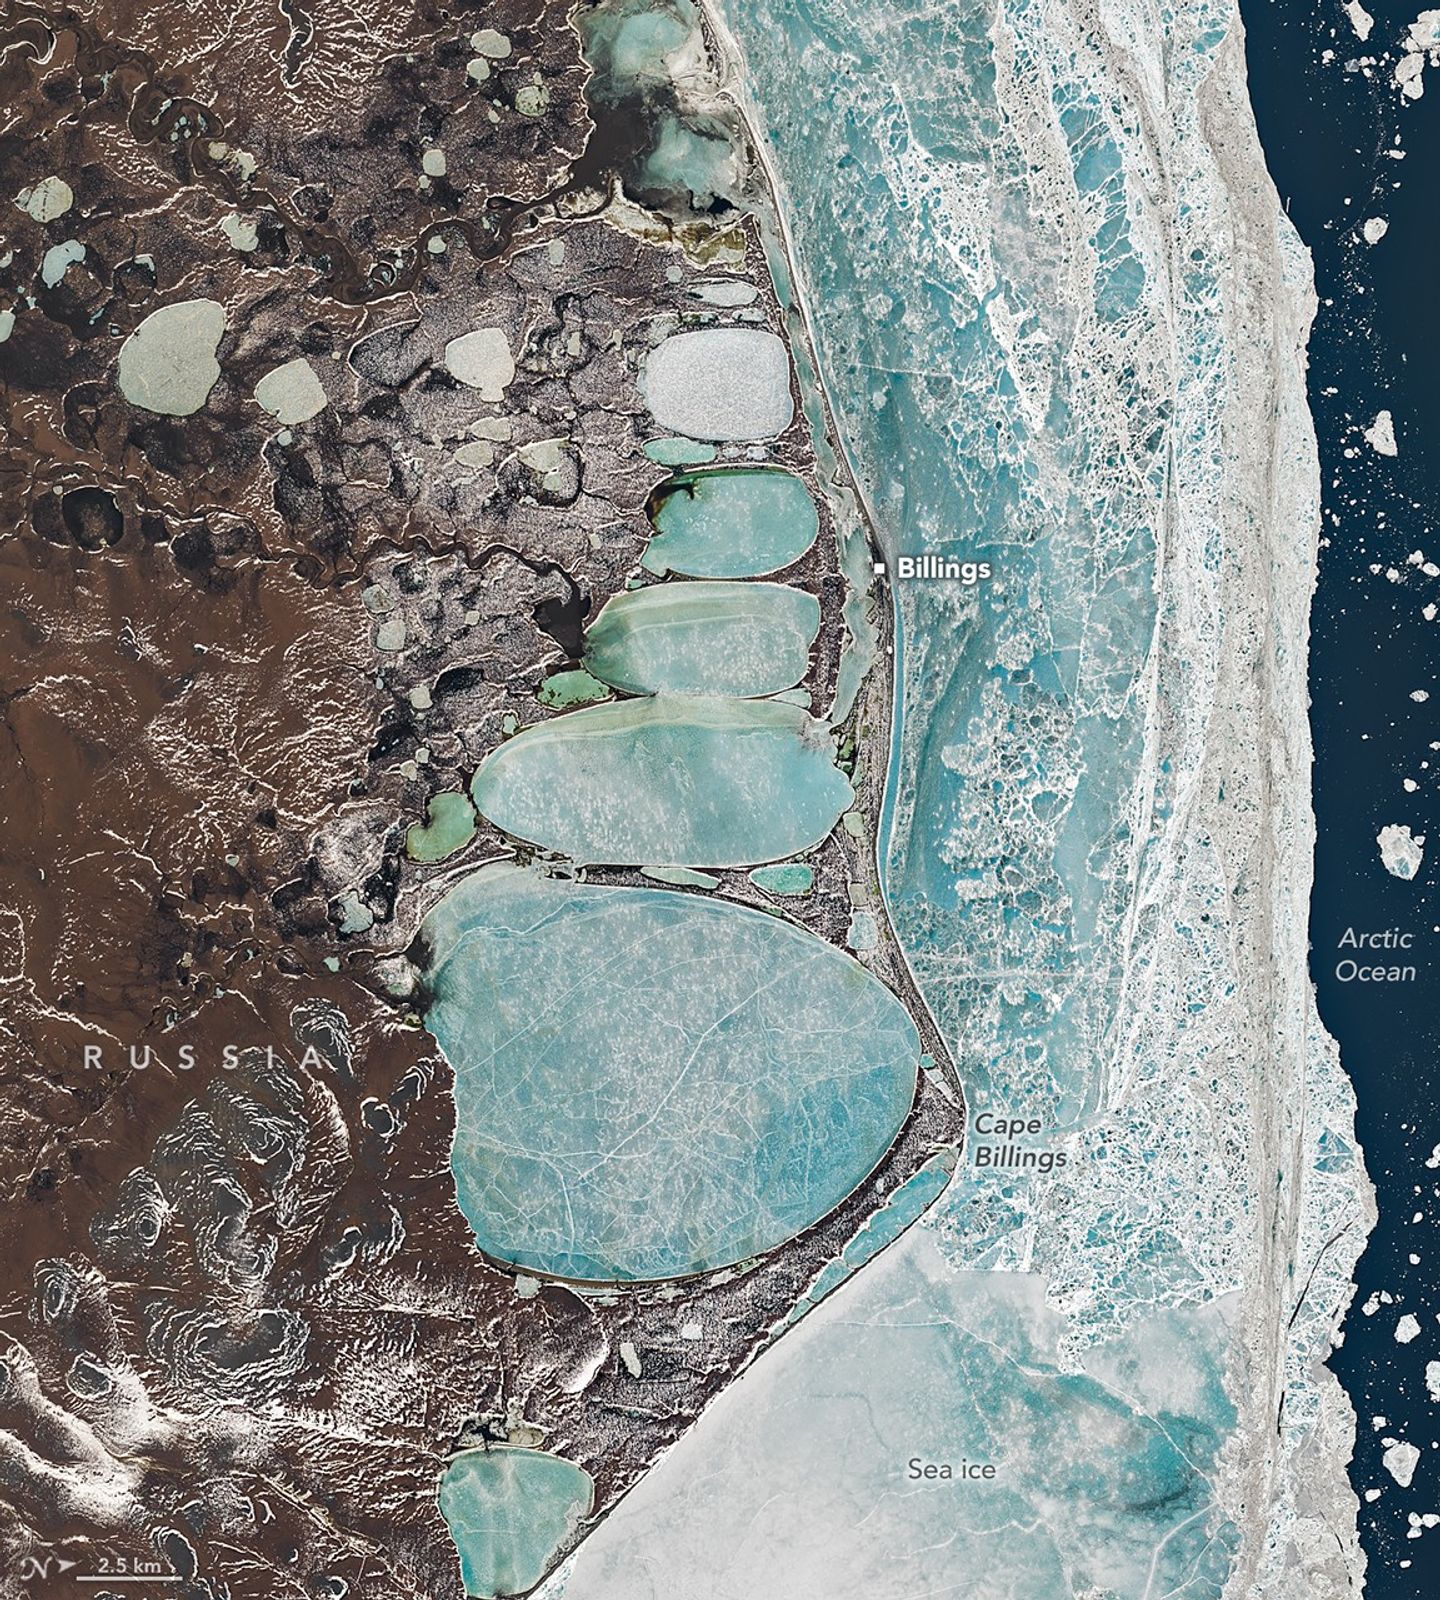
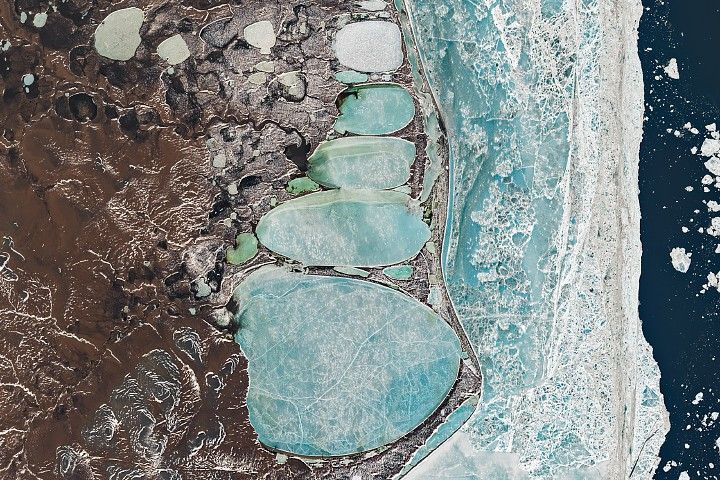
Icons of winter are sometimes found in unexpected places. In one striking example, a series of oval lagoons in a remote part of Siberia forms the shape of a towering snowman when viewed from above.
This image, centered on the remote village of Billings and nearby Cape Billings on Russia’s Chukchi Peninsula, was captured by the OLI (Operational Land Imager) aboard Landsat 8 on June 16, 2025. Established in the 1930s as a port and supply point for the Soviet Union, the village sits on a narrow sandspit that separates the Arctic Ocean from a series of connected coastal inshore lagoons.
The elongated, oval lagoons are frozen over and flanked by sea ice. Though June is one of the warmest months in Billings, ice cover is routine even then. Mean daily minimum temperatures are just minus 0.6 degrees Celsius (30.9 degrees Fahrenheit) in June, according to meteorological data.
Though the shape may seem engineered, it is natural and the product of geological processes common in the far north. The ground in this part of Siberia is frozen most of the year and pockmarked with spear-shaped ice wedges buried under the surface. Summer melting causes overlying soil to slump, leaving shallow depressions that fill with meltwater and form thermokarst lakes. Once created, consistency in the direction of the winds and waves likely aligned and elongated the lakes into the shapes seen in the image. The thin ridges separating the lakes may represent the edges of different ice wedges below the surface.
The first reference to humans building snowmen dates back to the Middle Ages, according to the book The History of the Snowman. While three spherical segments are the most common form, other variants dominate in certain areas. In Japan, snowmen typically have just two segments and are rarely given arms. This five-segmented snowman-shaped series of lakes spans about 22 kilometers (14 miles) from top to bottom, making it roughly 600 times longer than the actual snowwoman that held the Guinness record for being the world’s tallest snowperson in 2025.
Snowmen are not the only winter icons tied to this remote landscape. For early expeditions to the Russian Arctic, reindeer offered one of the most reliable modes of transportation. That includes expeditions by the town’s namesake, Commodore Joseph Billings, a British-born naval officer who enlisted in the Russian navy and led a surveying expedition to find a Northeast Passage between 1790 and 1794.
Although the hundred-plus members of the expedition did not reach Cape Billings, they explored much of the Chukchi Peninsula, producing some of the first accurate maps and further confirming that Asia and North America were separated by a strait. In the winter months, when their ships were beset by ice, the explorers moved to temporary camps on land and instead surveyed the region with reindeer-drawn wooden sleds, according to historical accounts. Winters, in fact, offered the best conditions for exploration because the peninsula’s many rivers and lakes turned into solid surfaces that were easy to traverse in comparison to the muddy bogs that open up in the summer.
Indigenous Chukchi people living on the peninsula at the time routinely used reindeer to haul both people and cargo. A pair of reindeer can comfortably haul hundreds of pounds for several hours a day. In addition to their impressive endurance in cold temperatures, reindeer largely feed themselves by digging through snow and grazing on lichens, something that neither sled dogs nor horses can do.
Historical documents indicate that the Billings expedition enlisted Chukchi people to manage and care for the reindeer they used, with some accounts suggesting that the explorers used dozens of reindeer at times. While reindeer were mainly used to haul sleds, Chukchi people likely rode them as well.
Non-Chukchi members of the expedition reportedly experimented with riding reindeer, though their experiments did not always go smoothly. Billings’ secretary and translator Martin Sauer reported using a saddle without stirrups or a bridle and falling “nearly 20 times” after about three hours of travel in his account of the expedition. Not only that, he added, but the saddle “at first, causes astonishing pain to the thighs.”
NASA Earth Observatory image by Michala Garrison, using Landsat data from the U.S. Geological Survey. Story by Adam Voiland.
References & Resources
Alekseev, A.I. (1966) Joseph Billings. The Geographical Journal, 132(2), 233-238.
Arctic Portal Chukchi. Accessed December 16, 2025.


