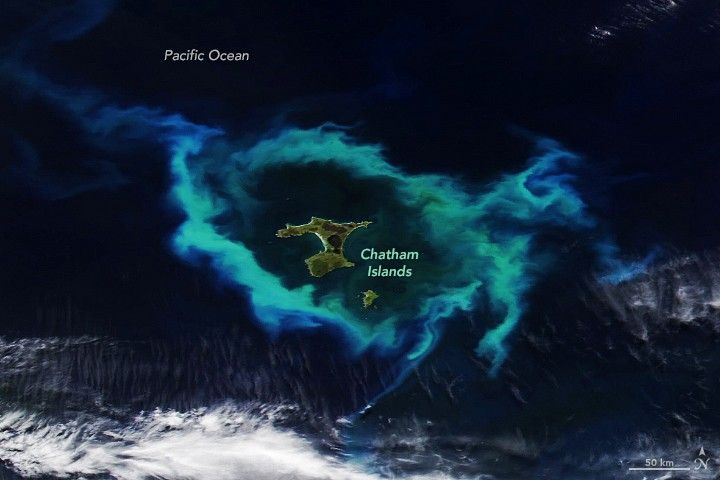
At about 800 kilometers (500 miles) east of New Zealand’s South Island, the sparsely populated Chatham Islands are rugged, remote, and often inconspicuous. In January 2026, however, a ring of bright green and blue swirls in the ocean put a natural spotlight on the far-flung specks of land.
A bloom of phytoplankton—tiny photosynthetic organisms that become visible to satellites when their numbers explode—encircled the Chatham Islands in austral summer. Surface currents and eddies carried the floating organisms into intricate wisps and swirls. The VIIRS (Visible Infrared Imaging Radiometer Suite) on the NOAA-20 satellite captured this image of the display on January 10, 2026.
The Chatham Islands sit on the Chatham Rise, an underwater plateau that extends eastward from the South Island of New Zealand. The top of the rise is relatively shallow and separates areas of deeper water to the north and south. These seafloor contours make blooms common along the Chatham Rise, where cold, nutrient-rich currents from the Antarctic and warm, nutrient-poor water from the subtropics converge. The well-mixed water, coupled with long daylight hours, can boost phytoplankton populations.
With phytoplankton at the base of the food web, the waters around the Chatham Islands support productive fisheries, with valuable species such as pāua, rock lobster, and blue cod. The region is also home to an array of marine mammals, including five seal species and 25 whale and dolphin species. Amid this abundance, however, the islands are a hotspot for whale and dolphin strandings, in which hundreds of animals are sometimes beached.
NASA Earth Observatory image by Lauren Dauphin, using VIIRS data from NASA EOSDIS LANCE, GIBS/Worldview, and the Joint Polar Satellite System (JPSS). Story by Lindsey Doermann.
NASA Data Helps Maine Oyster Farmers Choose Where to Grow
The Landsat satellites are helping oyster farmers in Maine see which coves run warmer or cooler from space.
Credits: NASA/Ross Walter and Allison Nussbaum
When oyster farmer Luke Saindon went looking for a place to grow shellfish in Maine, he knew that picking the wrong patch of water could sink the farm before it began. So Saindon did something oyster farmers couldn’t have done a generation ago: He used NASA satellite data to view the coastline from space.
“Starting a farm is a big venture,” said Saindon, the director for The World Is Your Oyster farm in Wiscasset, Maine. “If you choose the wrong spot, you can blow through a lot of money without ever bringing oysters to market.”
NASA satellites had been passing over these waters for years, recording temperatures and other conditions. Using a site-selection tool created by University of Maine researchers, Saindon examined satellite maps showing where water temperatures and food levels might be best for growing oysters. The maps pointed him toward a wide, shallow bay near his home. Four years later, the farm is still there — and the oysters are thriving.
Luke Saindon, director of The World Is Your Oyster farm in Wiscasset, Maine, checks oyster cages on the farm’s floating platform.
Saindon believes that using the satellite data to select his oyster farm site resulted in faster-than-average growth rates.
“This is an example of how NASA’s Earth science program supports our nation,” said Chris Neigh, the Landsat 8 and 9 project scientist at NASA’s Goddard Space Flight Center in Greenbelt, Maryland. “We collect global data, but its value grows when it’s used locally to help communities work smarter and make their livelihoods more sustainable.”
From orbit to oyster
That same satellite-based approach is now the foundation of a study published Jan. 15 in the journal Aquaculture. Led by University of Maine scientists Thomas Kiffney and Damian Brady, the research demonstrates how temperature data from Landsat — the joint NASA and U.S. Geological Survey mission — combined with European Sentinel-2 satellite estimates of oyster food availability, namely plankton, can predict how quickly eastern oysters (Crassostrea virginica) reach market size.
The team built a satellite data–driven model of how oysters divide their energy among growth, survival, and reproduction. Feed the model sea surface temperature and satellite estimates of chlorophyll and particulate organic matter — signals of how much plankton and other edible particles are in the water — and it predicts how fast oysters will grow, a big step beyond just spotting good or bad sites for farms.
“By showing where oysters grow faster, the model can help farmers plan ahead,” Kiffney said. “That could mean better decisions about when to seed, when to harvest, and how much product to expect, all of which reduces financial risk.”
That kind of insight is increasingly valuable in Maine, where oyster farming has grown rapidly over the last decade. From 2011 to 2021, the industry’s value increased 78%, rising from about $2.5 million to more than $10 million. As the sector scales up, understanding the finer details of Maine’s coastal waters has become essential — and that’s where NASA satellites come in.
The stakes are considerable. “It takes two to three years of scoping in order to get your permit to grow, and then it can take two years for those oysters to reach market,” Brady said. “So if you’ve chosen the wrong site, you’re four years in the hole right off the bat.”
Sharper eyes on coast
Maine’s coastline measures about 3,400 miles (5,500 kilometers) if you follow the tide line. It is a coast of drowned valleys and glacier-scoured granite. Water depth, temperature, and circulation can shift dramatically within a few miles. This complexity makes oyster site selection notoriously difficult, and some satellites that see the coast in broad strokes miss the small, patchy places where oysters live.
“What makes Landsat so powerful for aquaculture is its ability to see finer-scale patterns along the coast,” where farmers put oyster cages in the water, Neigh said.
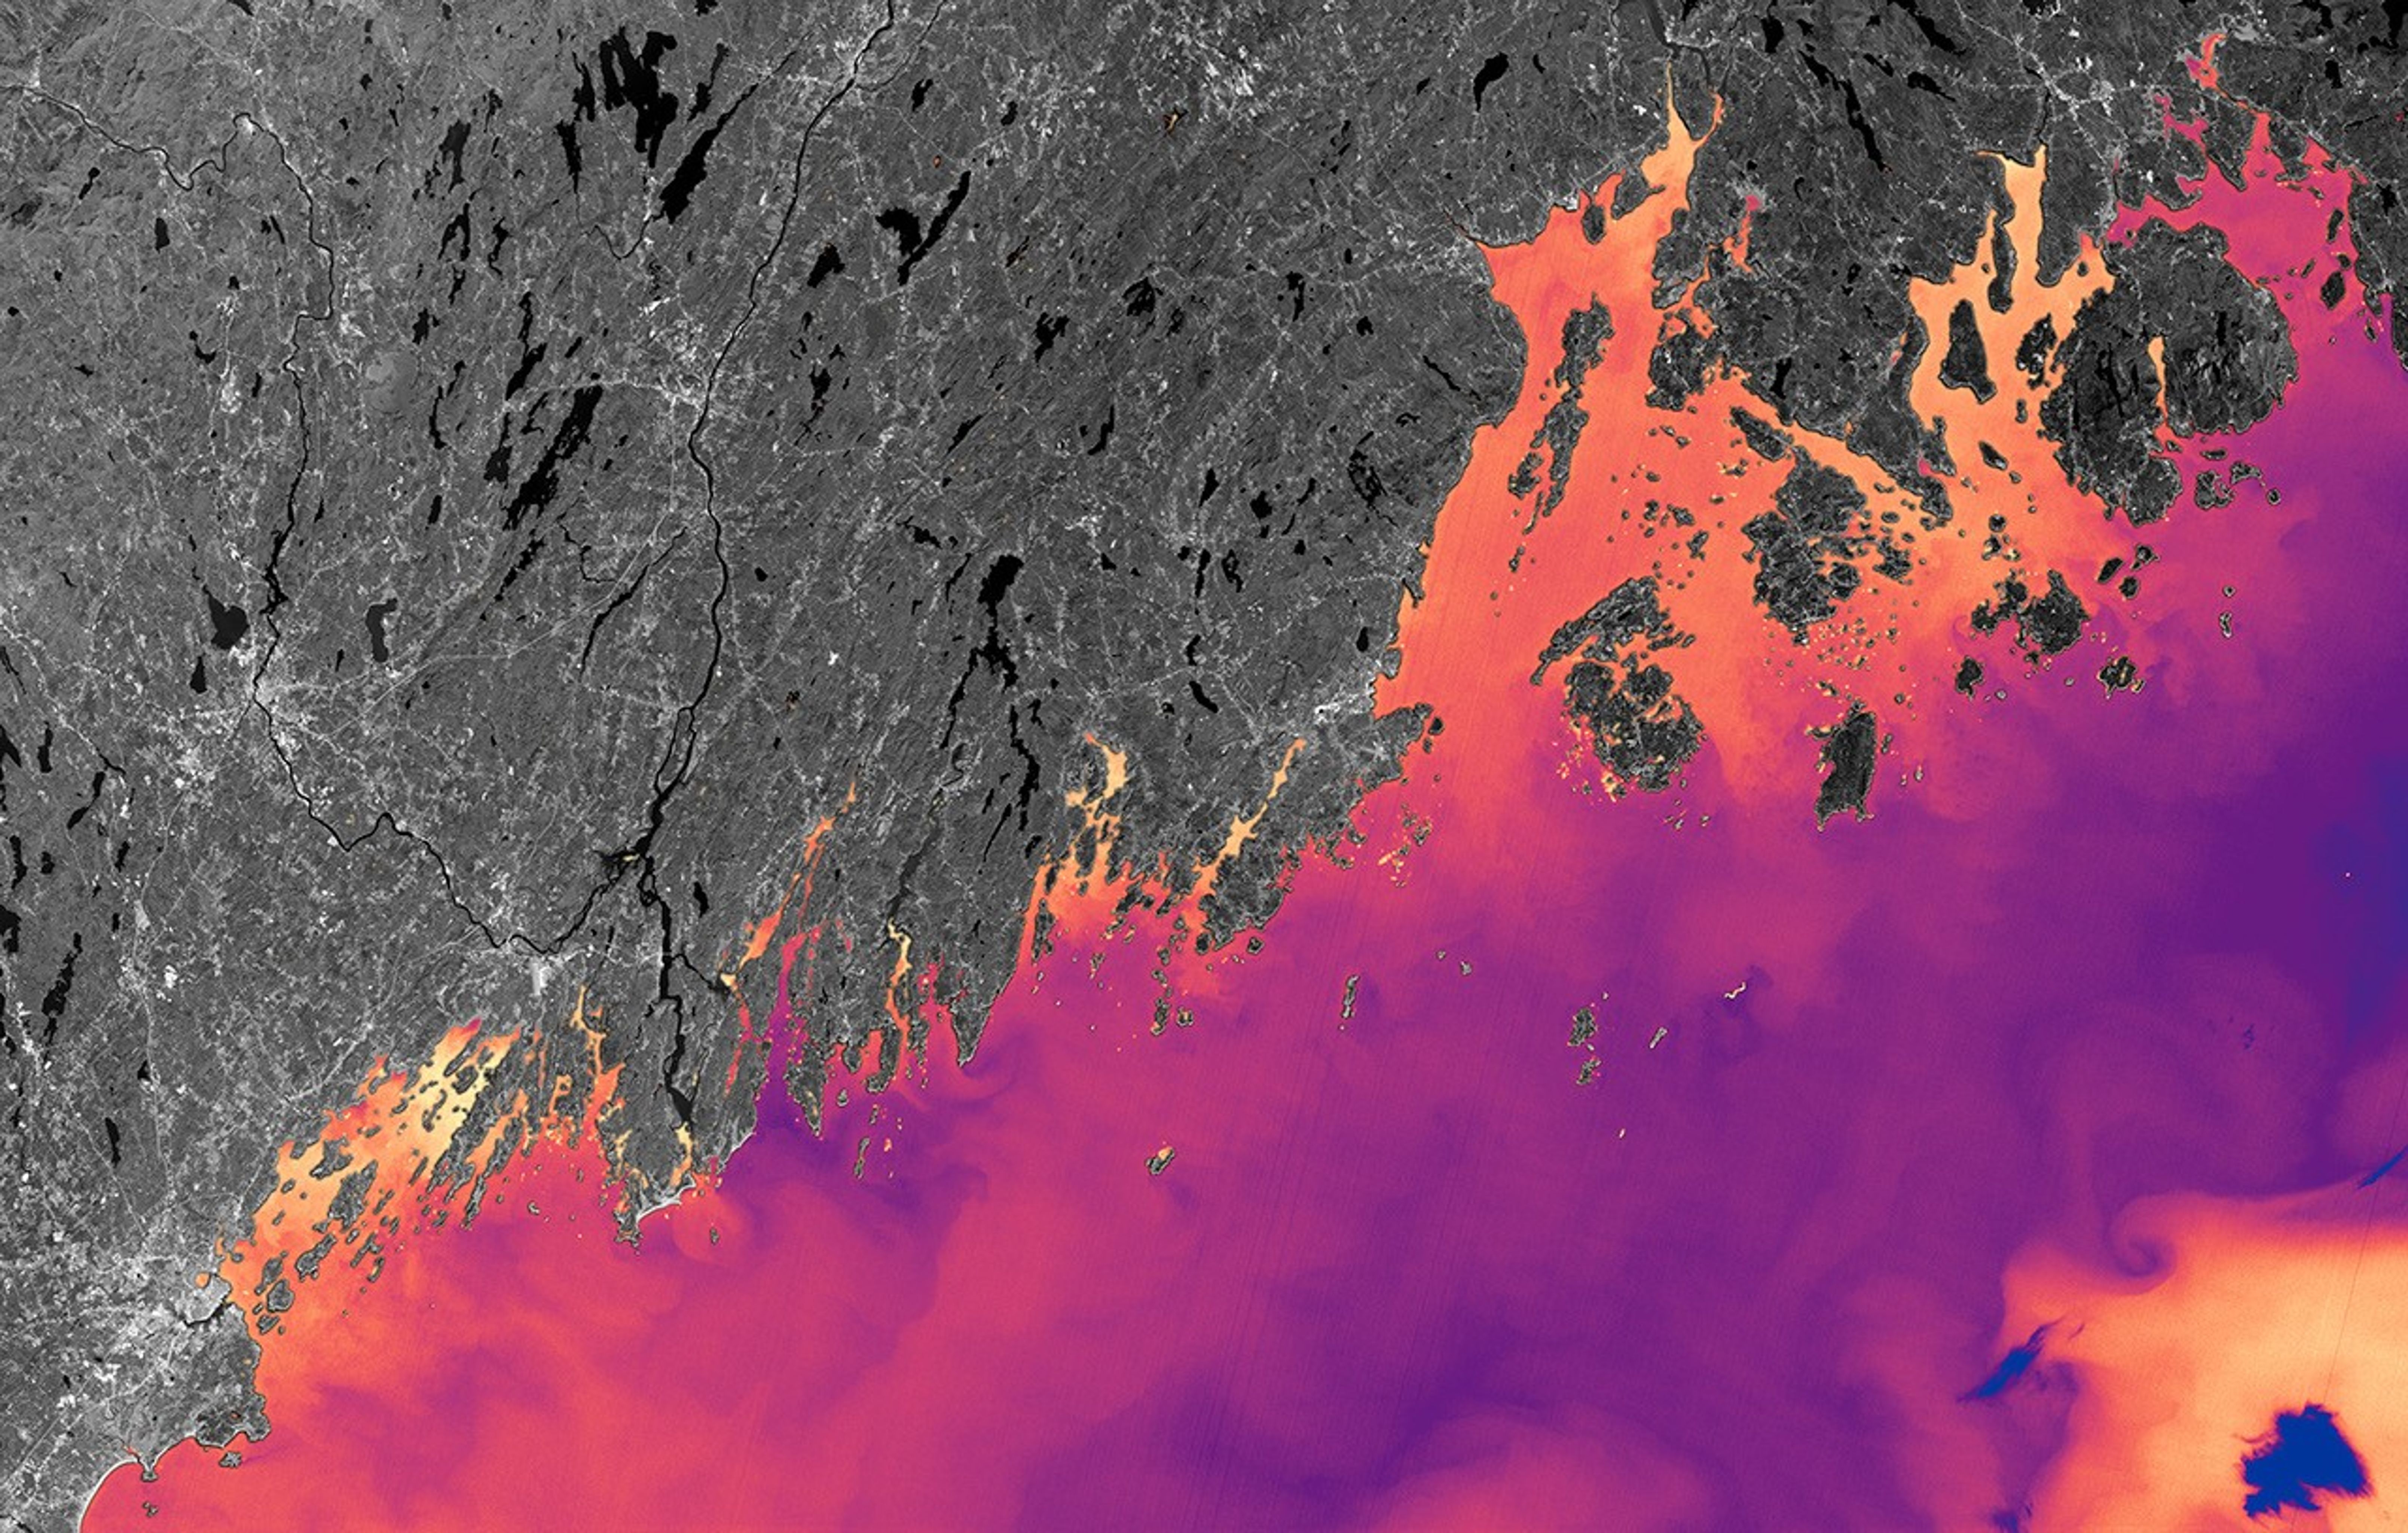
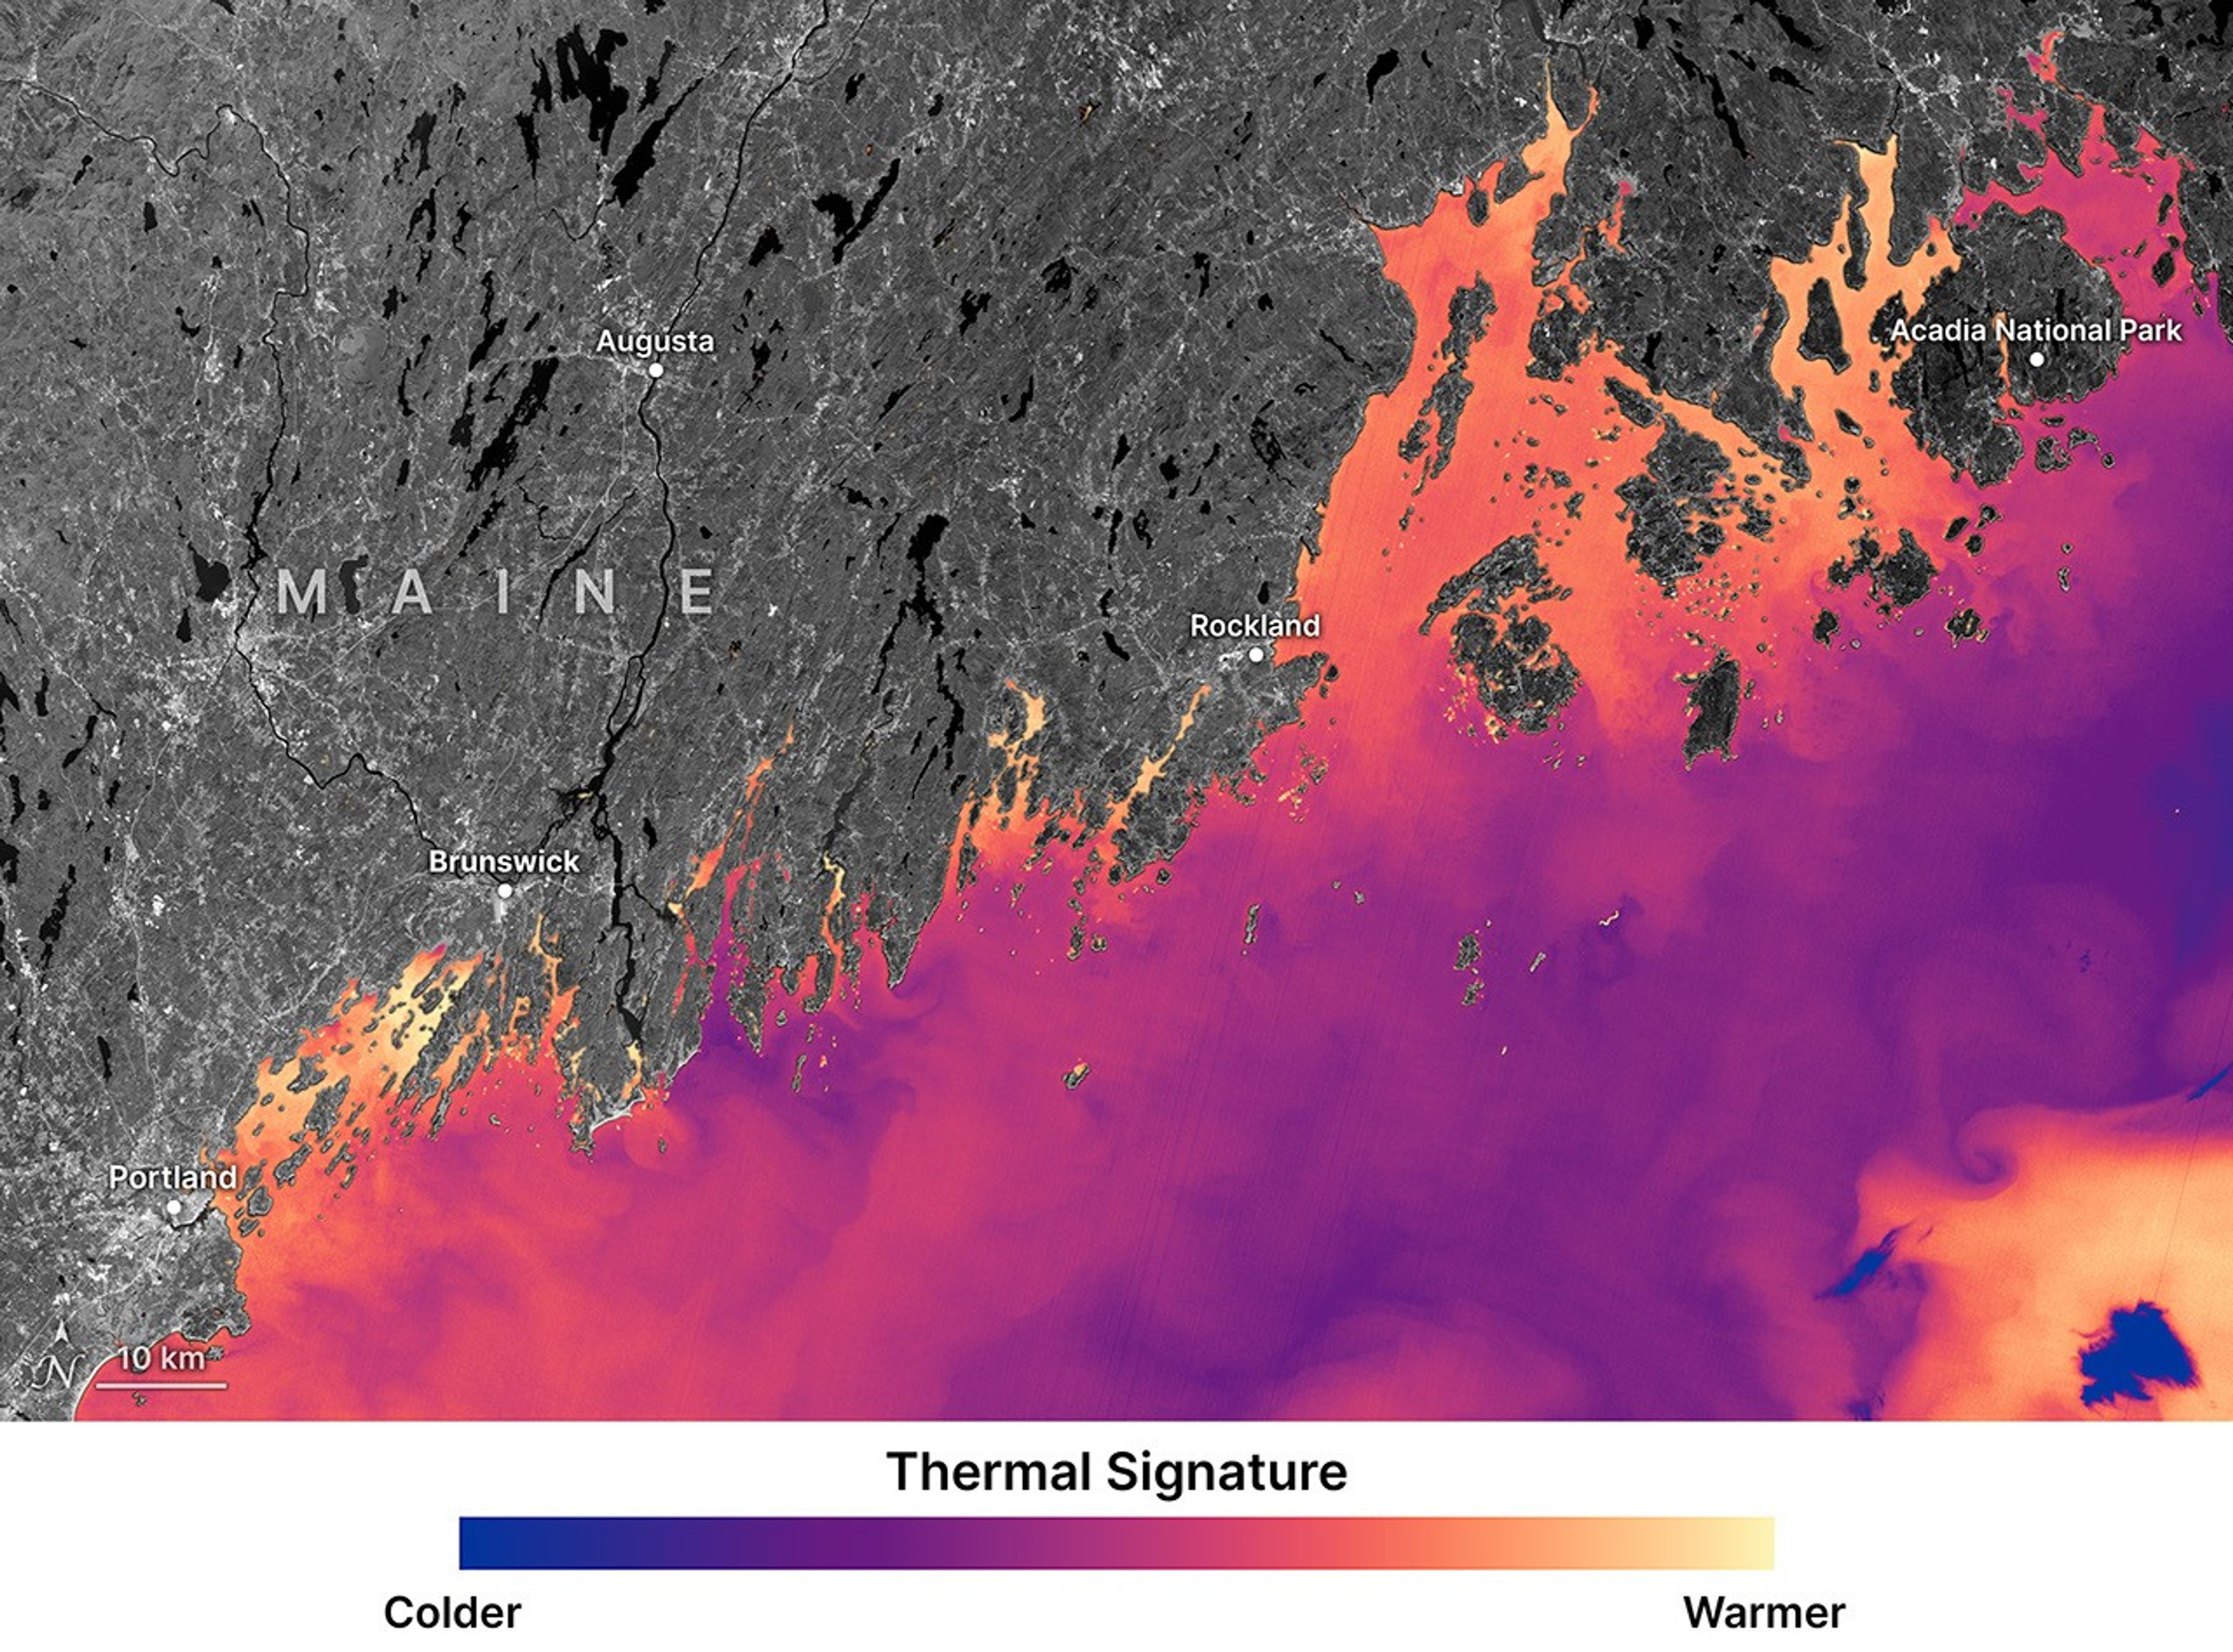
This false-color image from Landsat 9’s Thermal Infrared Sensor, acquired Oct. 11, 2025, shows the thermal signature of waters off the coast of Maine — revealing finer-scale temperature differences between neighboring coves. Cooler waters appear purple and blue, while warmer water shows up in orange and yellow.
NASA/Ross Walter and Allison Nussbaum
Landsat 8 and 9’s pixels — 98 to 328 feet (30 to 100 meters) across — are able to distinguish more subtle temperature differences between neighboring coves. For a cold-blooded oyster, those distinctions can translate into months of growth. Warm water accelerates feeding and shell development. Cold water slows both.
A challenge for satellites is clouds. Maine’s sky is frequently overcast, and together Landsat 8 and 9 pass over any given point only every eight days. To work around this, the research team analyzed 10 years of Landsat data (2013–2023) and built seasonal “climatologies,” or average temperature patterns for every 98-foot (30-meter) pixel along the coast. Sentinel-2 imagery added estimates of chlorophyll and particulate organic matter, the drifting microscopic food that oysters pull from the water column with rhythmic contractions of their gills.
Field tests at multiple sites showed the technique’s accuracy. “We validated the model against seven years of field data,” Brady said. “It’s a strong indication that these remotely sensed products can inform not just where to grow, but how long it will take to harvest.”
Turning satellite science into tools for growers
The University of Maine team is now developing an online tool to put this model into practice. A grower will be able to click on a coastal location and receive an estimate for time-to-market.
The researchers also assist with workshops through Maine’s Aquaculture in Shared Waters program, teaching farmers how to interpret temperature and water clarity data and apply them to their own sites.
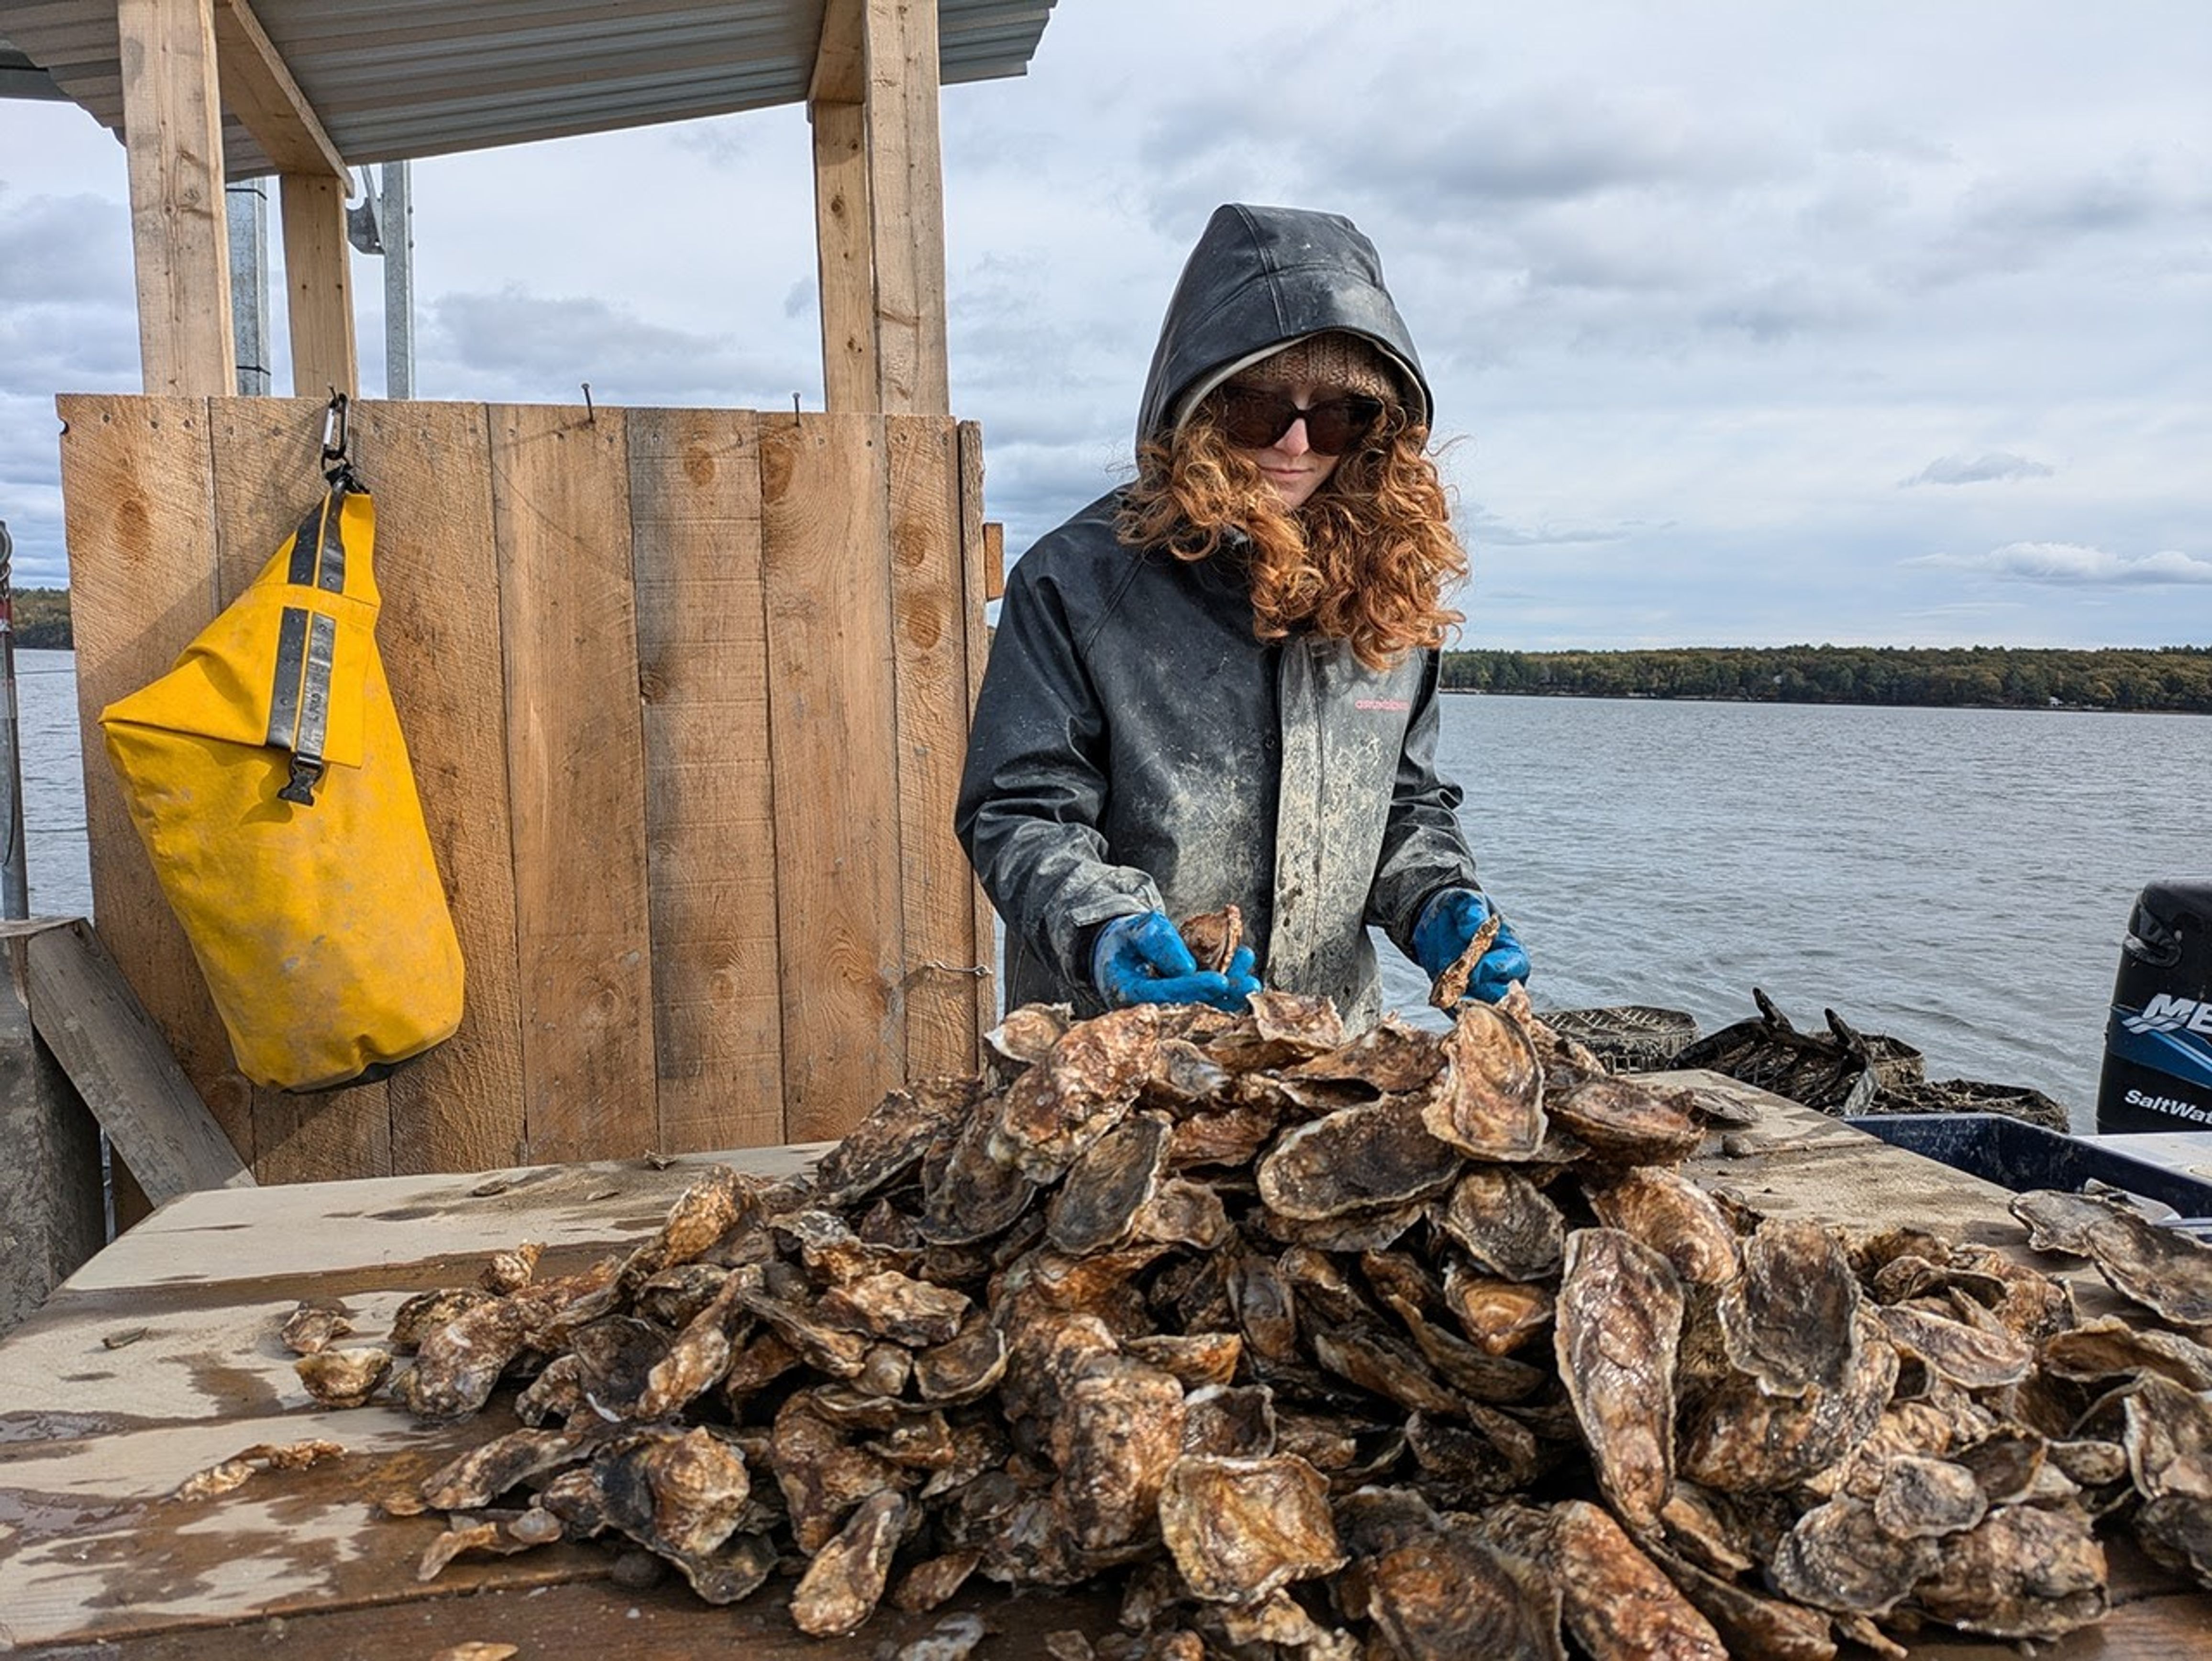
Monique Boutin, an aquaculture technician with The World Is Your Oyster farm, sorts oysters during harvest work on the water in Maine.
For farmers like Saindon, that translates into something simpler: confidence and efficiency. “Having these kinds of tools lowers the barrier for new people to get into aquaculture,” he said. “It gives you peace of mind that you’re not just guessing.”
The Maine project is helping pave the way for other NASA missions. The PACE satellite (Plankton, Aerosol, Cloud, ocean Ecosystem) launched in 2024 and is now delivering hyperspectral observations of coastal waters. Where earlier sensors could estimate how much plankton was present, PACE can begin to identify the different plankton species themselves. For oysters, mussels, and other filter feeders, that specificity matters. Not all plankton are equal food: Different kinds offer different nutrition, and some plankton are harmful to oysters.
A next step will be turning that richer picture of coastal life into forecasts people working on the water can use, helping farmers trade some of the coast’s mystery for evidence they can apply to their harvest.
By Emily DeMarco
NASA’s Goddard Space Flight Center, Greenbelt, Md.
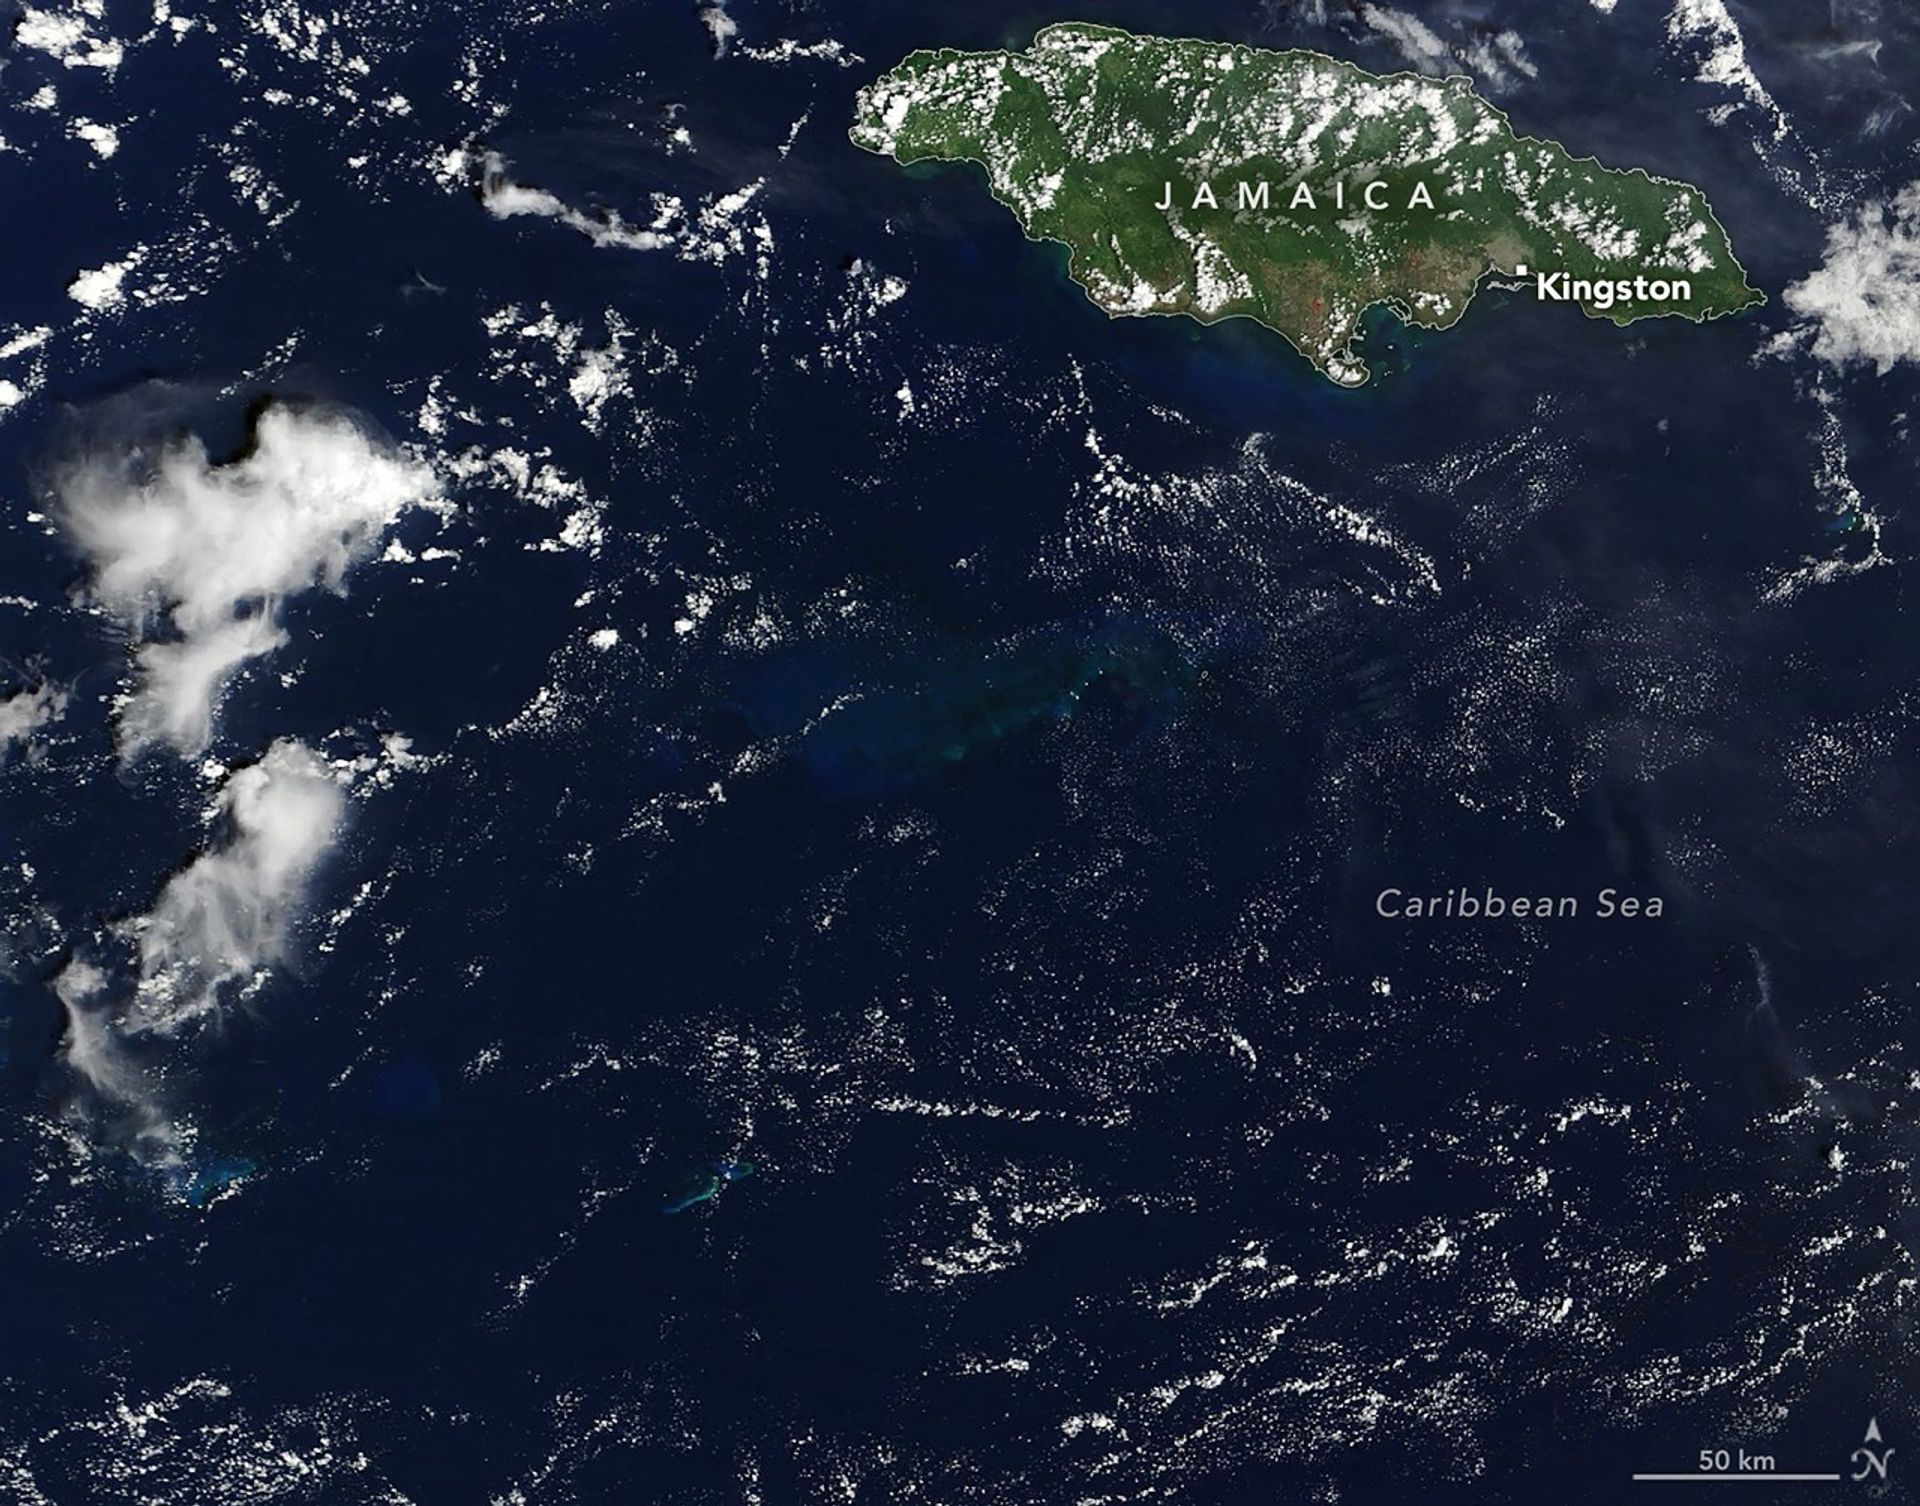
A satellite image shows a portion of the dark blue Caribbean Sea near Jamaica. A submerged carbonate platform appears as a slightly brighter blue area of water in the center. The mostly green island of Jamaica is in the upper right, and scattered clouds are present throughout.
NASA Earth Observatory
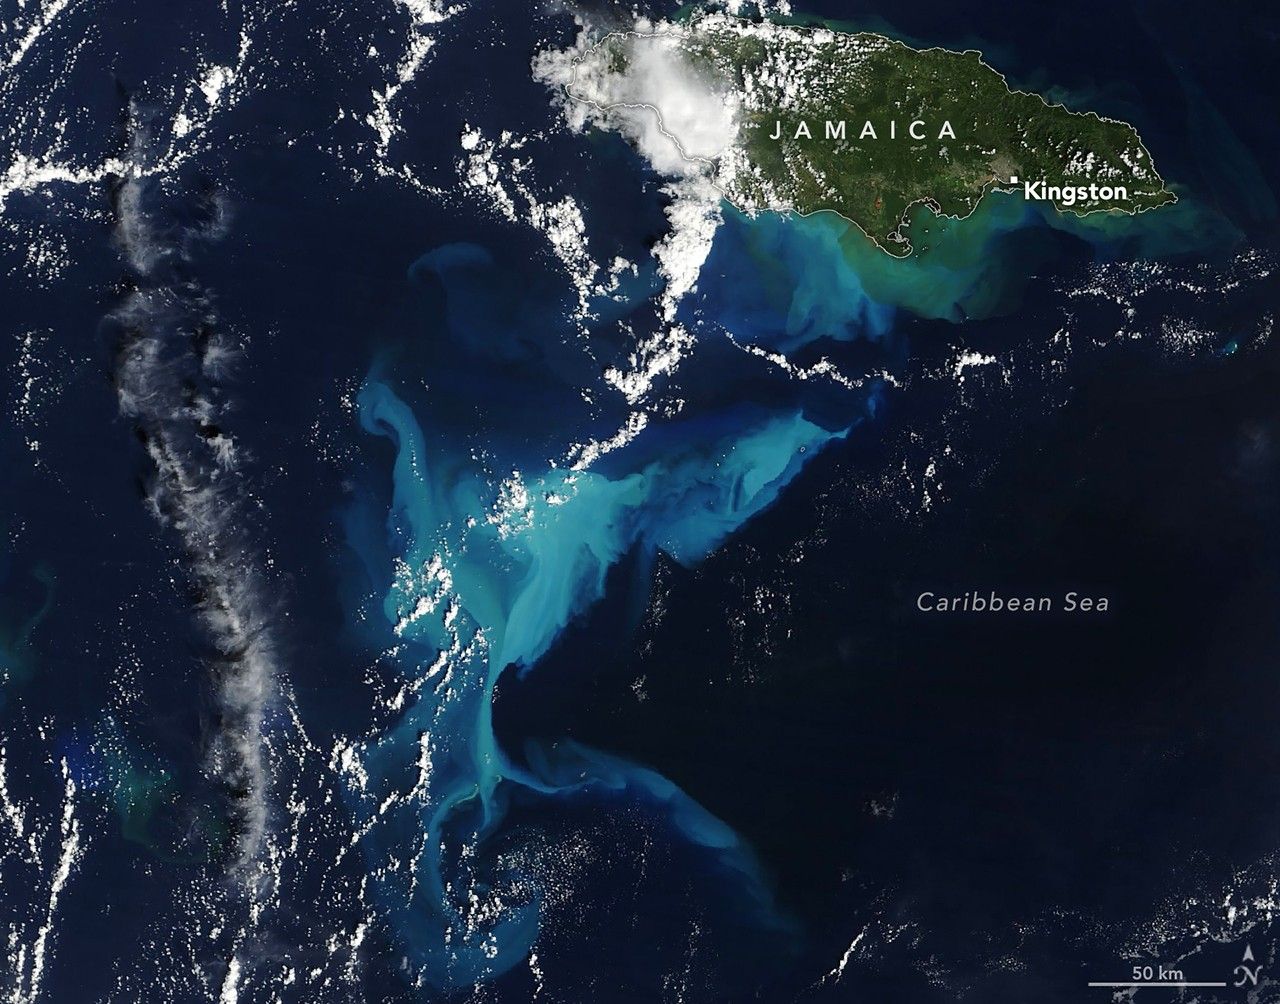
A satellite image shows a portion of the Caribbean Sea near Jamaica. Much of the water in the middle third of the image is bright blue due to suspended sediment. The mostly green island of Jamaica is in the upper right, and scattered clouds are present throughout.
NASA Earth Observatory
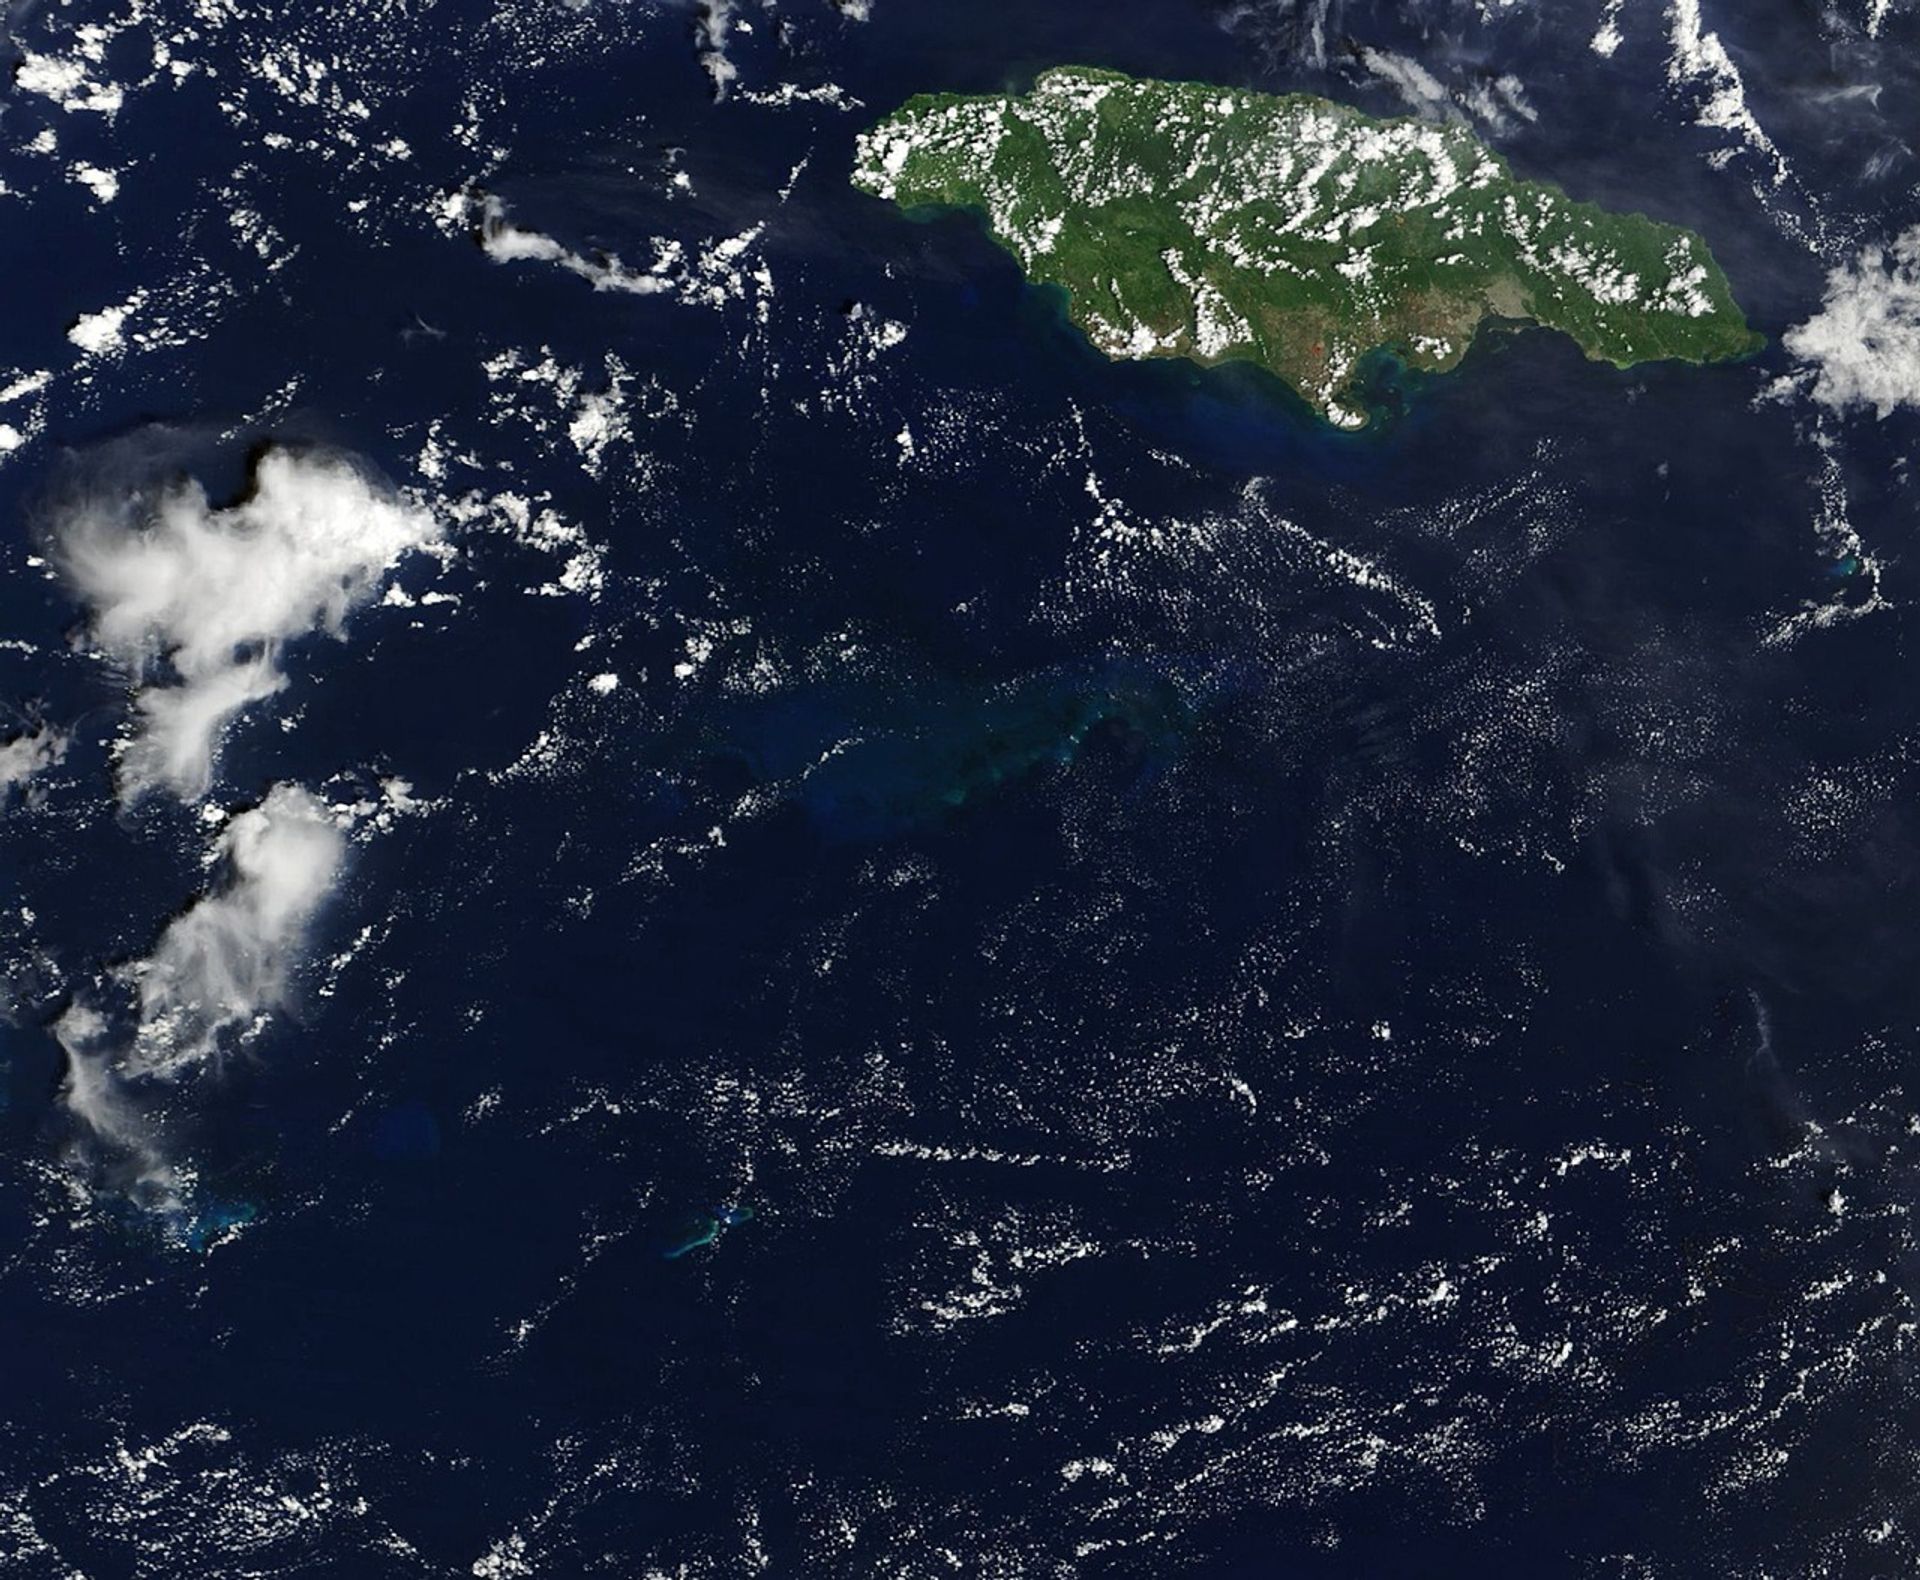
A satellite image shows a portion of the dark blue Caribbean Sea near Jamaica. A submerged carbonate platform appears as a slightly brighter blue area of water in the center. The mostly green island of Jamaica is in the upper right, and scattered clouds are present throughout.
NASA Earth Observatory
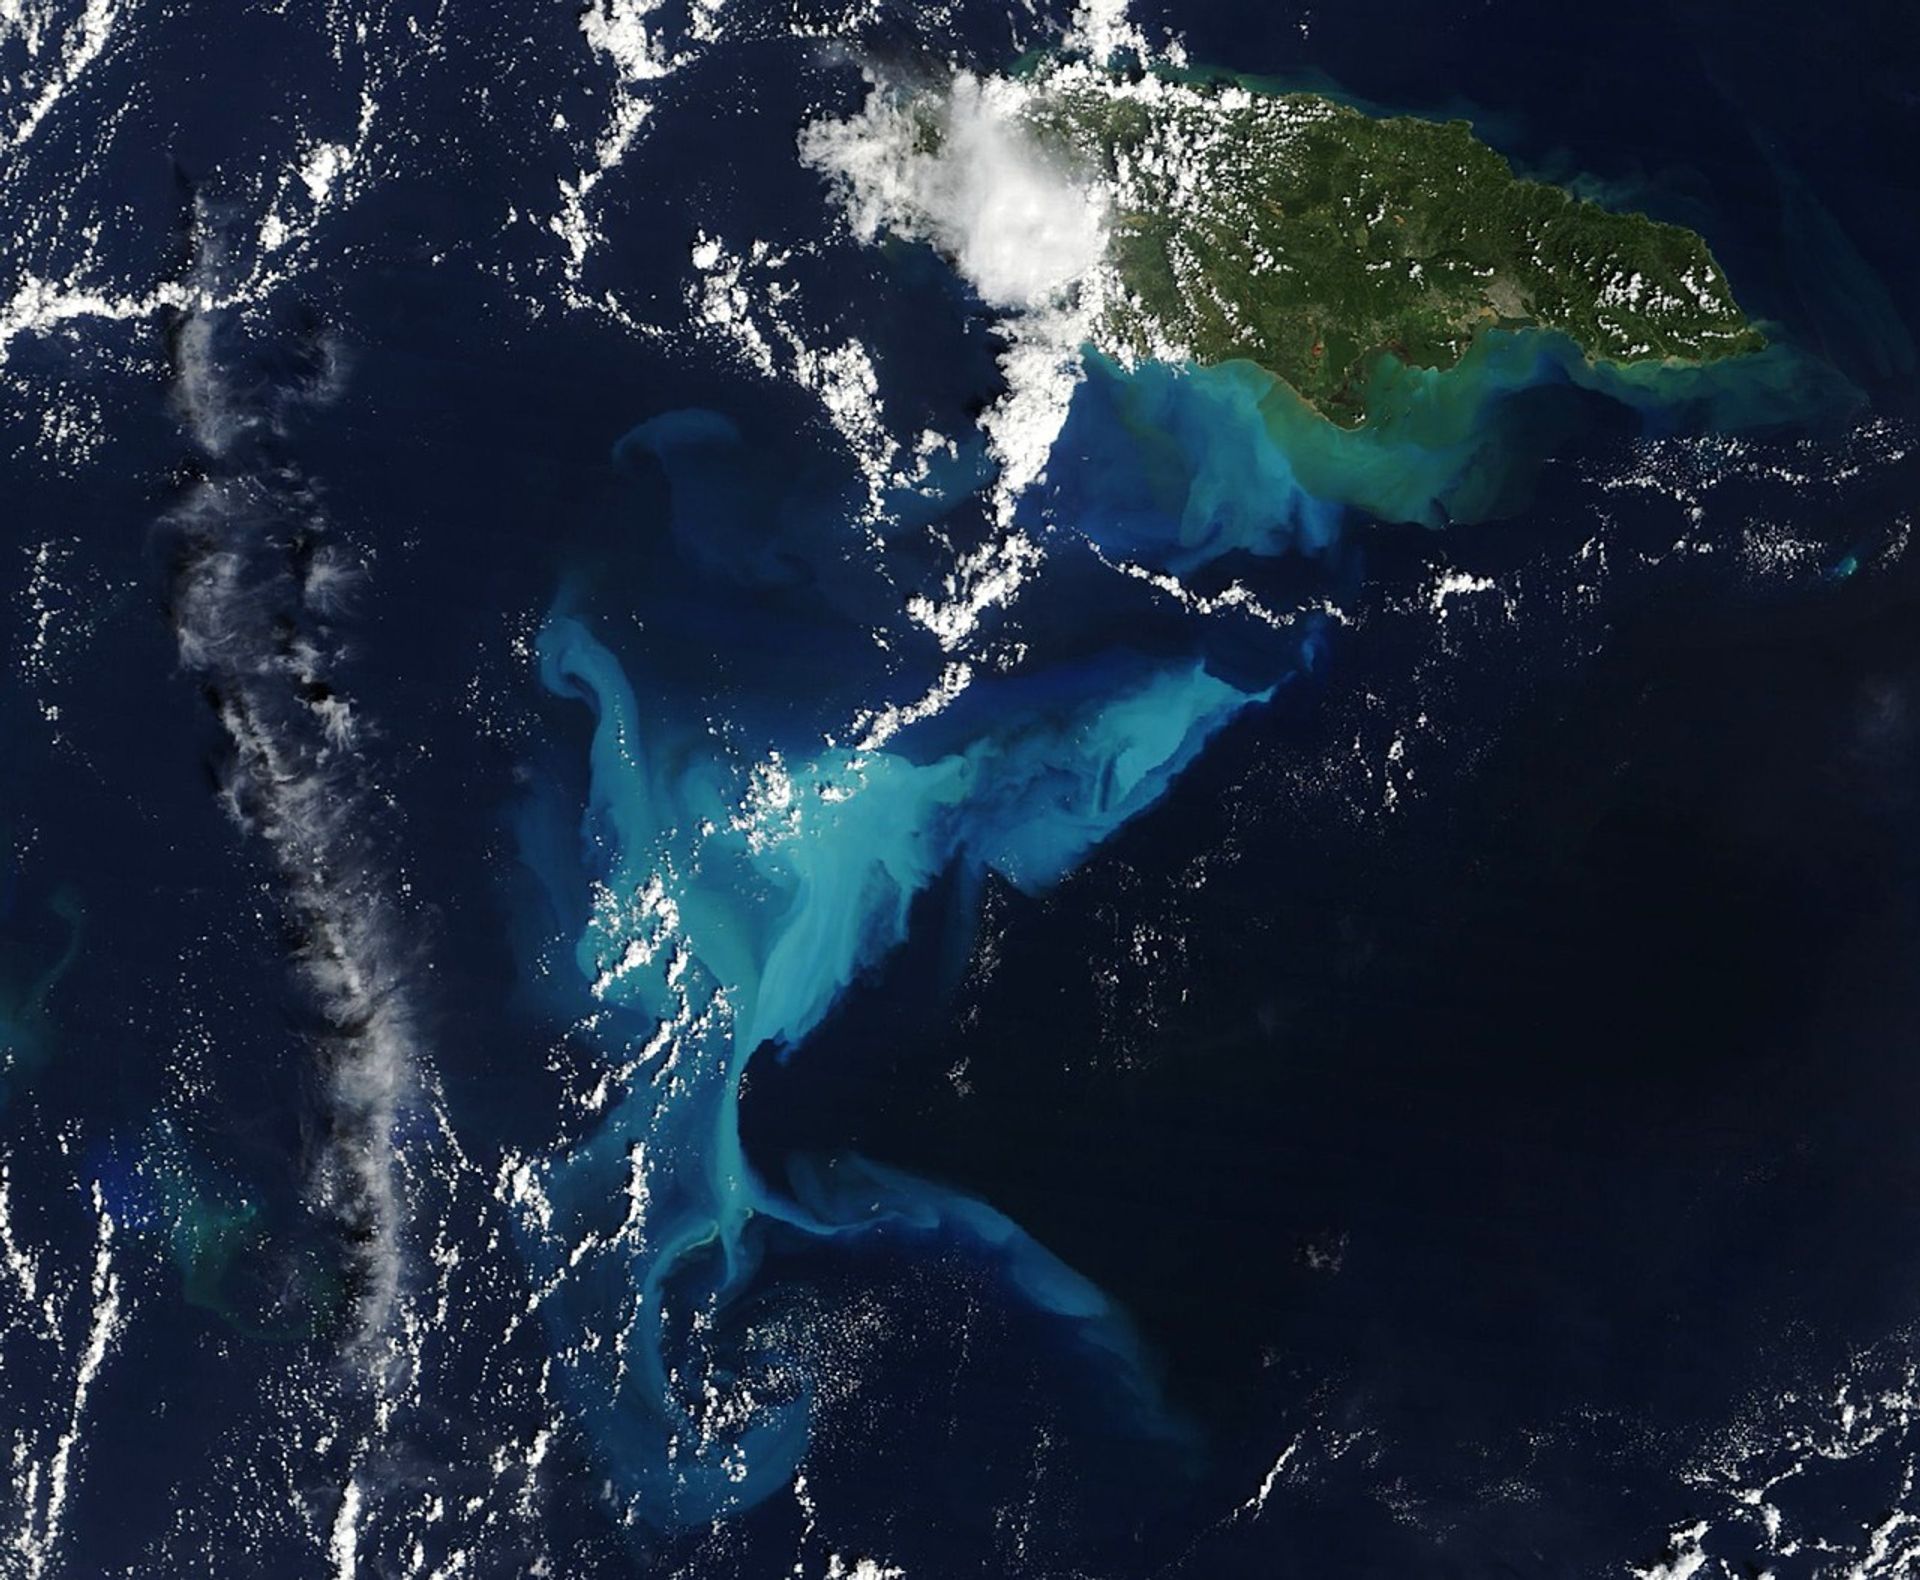
A satellite image shows a portion of the Caribbean Sea near Jamaica. Much of the water in the middle third of the image is bright blue due to suspended sediment. The mostly green island of Jamaica is in the upper right, and scattered clouds are present throughout.
NASA Earth Observatory
September 20, 2025
October 30, 2025
Before and After
Hurricane Melissa made landfall in Jamaica on October 28, 2025, as a category 5 storm, bringing sustained winds of 295 kilometers (185 miles) per hour and leaving a broad path of destruction on the island. The storm displaced tens of thousands of people, damaged or destroyed more than 100,000 structures, inflicted costly damage on farmland, and left the nation’s forests brown and battered.
Prior to landfall, in the waters south of the island, the hurricane created a large-scale natural oceanography experiment. Before encountering land and proceeding north, the monster storm crawled over the Caribbean Sea, churning up the water below. A couple of days later, a break in the clouds revealed what researchers believe could be a once-in-a-century event.
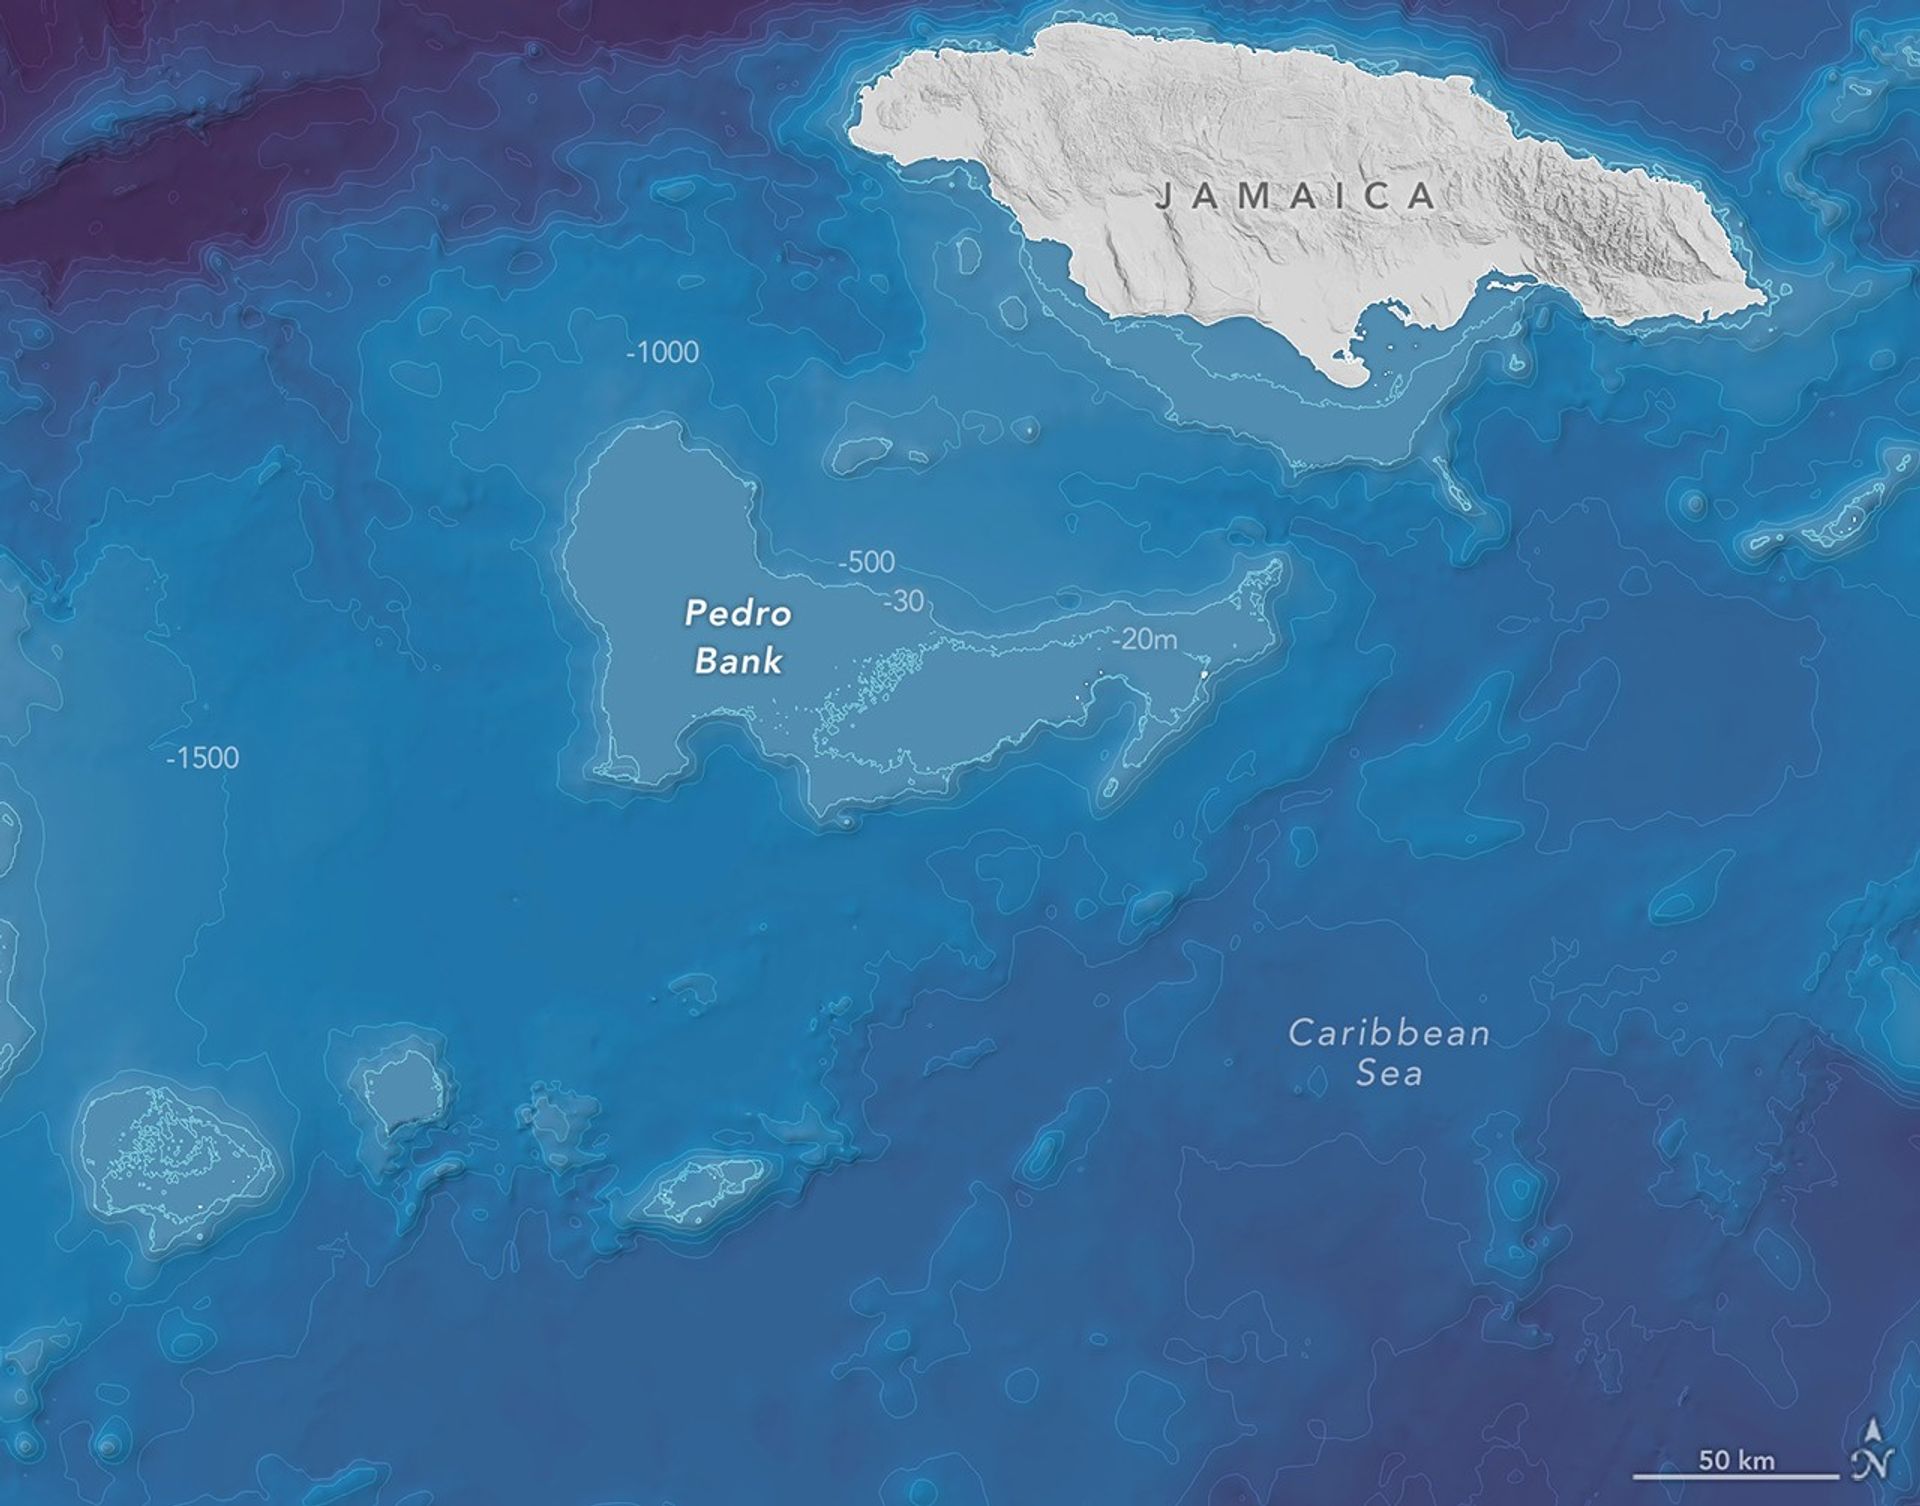
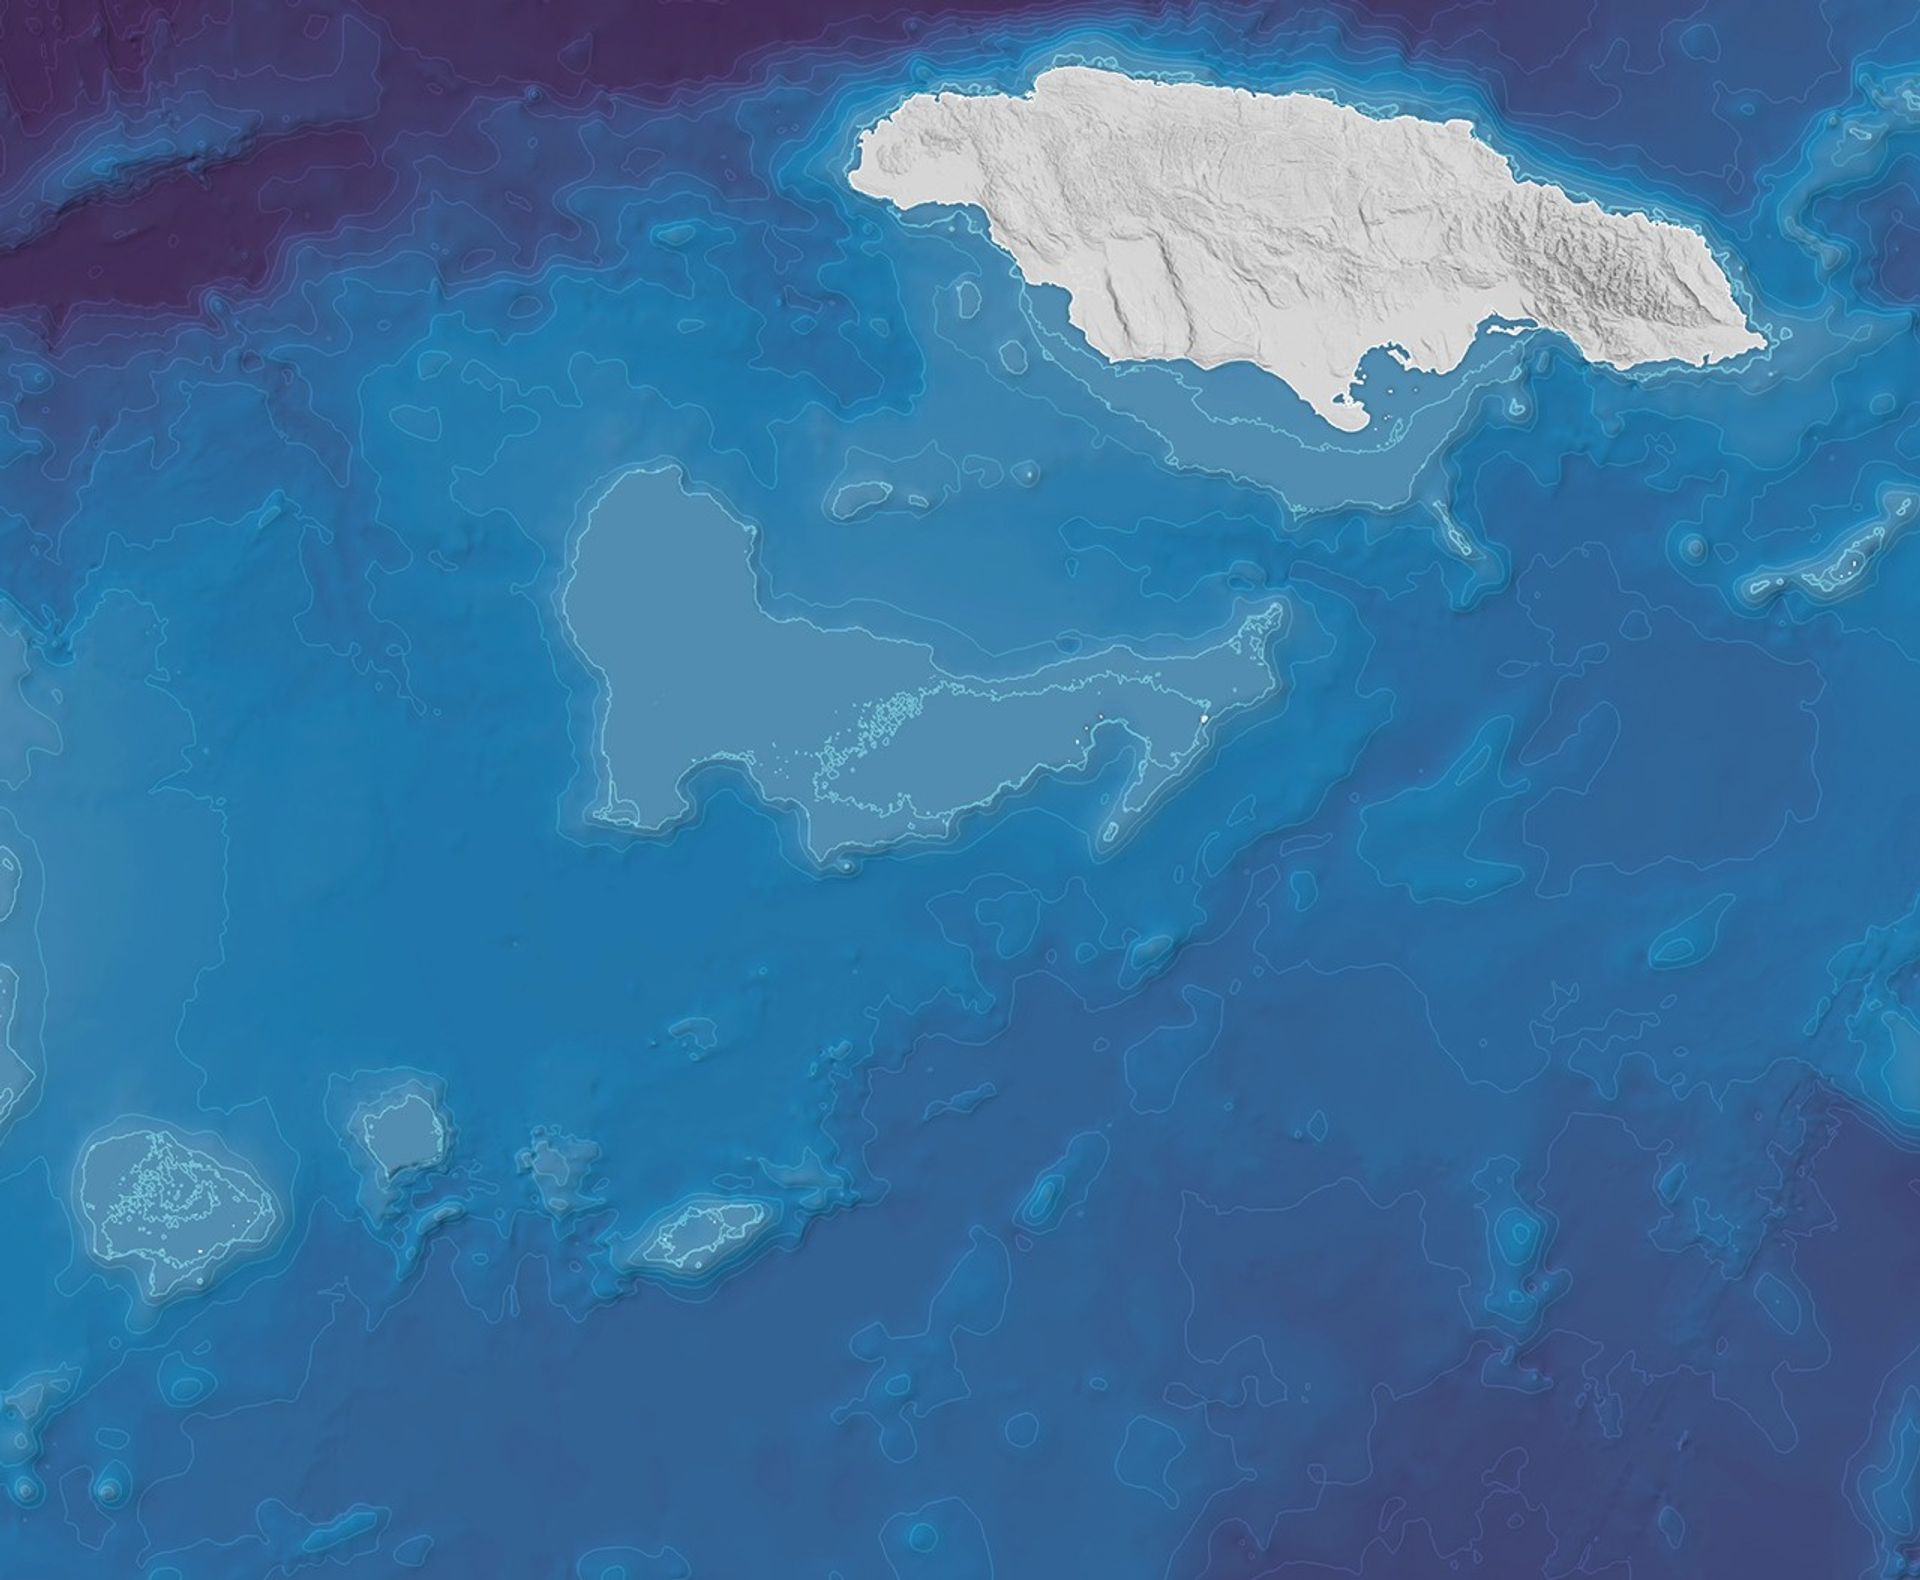
On October 30, 2025, the MODIS (Moderate Resolution Imaging Spectroradiometer) instrument on NASA’s Terra satellite acquired this image (right) of the waters south of Jamaica. Vast areas are colored bright blue by sediment stirred up from a carbonate platform called Pedro Bank. This plateau, submerged under about 25 meters (80 feet) of water, is slightly larger in area than the state of Delaware. For comparison, the left image was acquired by the same sensor on September 20, before the storm.
Pedro Bank is deep enough that it is only faintly visible in natural color satellite images most of the time. However, with enough disruption from hurricanes or strong cold fronts, its existence becomes more evident to satellites. Suspended calcium carbonate (CaCO3) mud, consisting primarily of remnants of marine organisms that live on the plateau, turns the water a Maya blue color. The appearance of this type of material contrasts with the greenish-brown color of sediment carried out to sea by swollen rivers on Jamaica’s southern coast.
As an intense storm that lingered in the vicinity of the bank, Hurricane Melissa generated “tremendous stirring power” in the water column, said James Acker, a data support scientist at the NASA Goddard Earth Sciences Data and Information Services Center with a particular interest in these events. Hurricane Beryl caused some brightening around Pedro Bank in July 2024, “but nothing like this,” he said. “While we always have to acknowledge the human cost of a disaster, this is an extraordinary geophysical image.”
Sediment suspension was visible on Pedro and other nearby shallow banks, indicating that Melissa affected a total area of about 37,500 square kilometers—more than three times the area of Jamaica—on October 30, said sedimentologist Jude Wilber, who tracked the plume’s progression using multiple satellite sensors. Having studied carbonate sediment transport for decades, he believes the Pedro Bank event was the largest observed in the satellite era. “It was extraordinary to see the sediment dispersed over such a large area,” he said.
The sediment acted as a tracer, illuminating currents and eddies near the surface. Some extended into the flow field of the Caribbean Current heading west and north, while other patterns suggested the influence of Ekman transport, Wilber said. The scientists also noted complexities in the south-flowing plume, which divided into three parts after encountering several small reefs. Sinking sediment in the easternmost arm exhibited a cascading stair-step pattern.
Like in other resuspension events, the temporary coloration of the water faded after about seven days as sediment settled. But changes to Pedro Bank itself may be more long-lasting. “I suspect this hurricane was so strong that it produced what I would call a ‘wipe’ of the benthic ecosystem,” Wilber said. Seagrasses, algae, and other organisms living on and around the bank were likely decimated, and it is unknown how repopulation of the area will unfold.
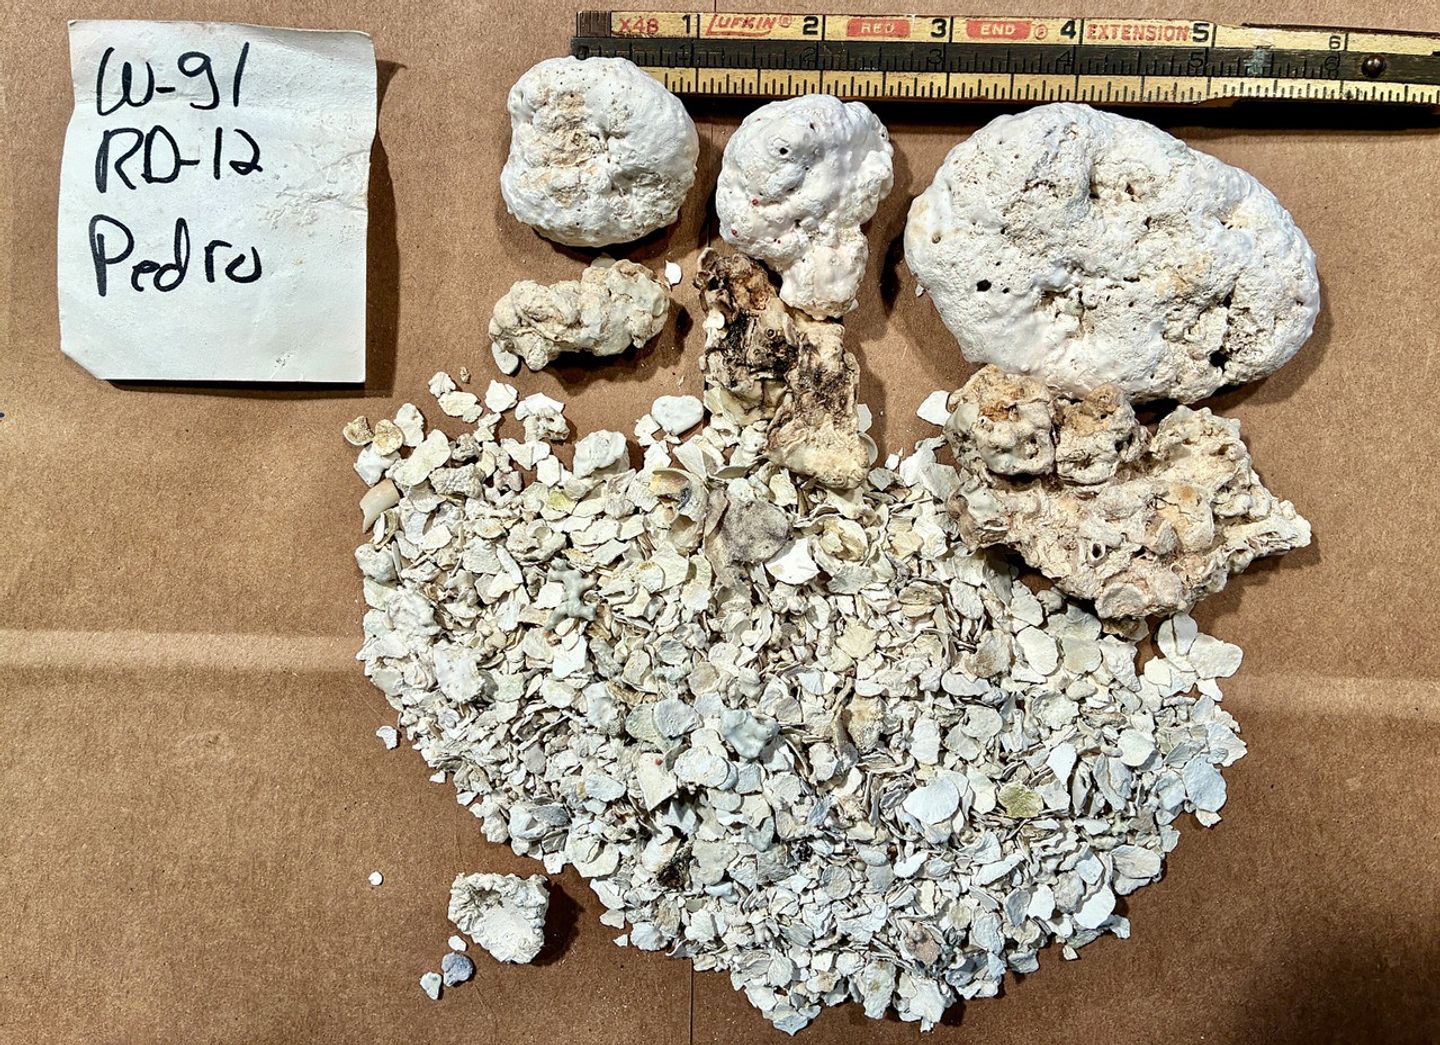
Sediments from the top of Pedro Bank contain masses of calcified red algae, flaky sands made of Halimeda macroalgae remnants, and carbonate mud. The wing-like shape of Halimeda sand allows it to be lifted and transported while waters are turbulent, and finer mud remains suspended longer. These samples were acquired during a research expedition in the winter of 1987-1988 and are archived at the Woods Hole Oceanographic Institution.
Photo by Jude Wilber, January 8, 2026.
Perhaps most consequentially for Earth’s oceans, however, is the effect of the sediment suspension event on the planet’s carbon cycle. Tropical cyclones are an important way for carbon in shallow-water marine sediments to reach deeper waters, where it can remain sequestered for the long term. At depth, carbonate sediments will also dissolve, another important process in the oceanic carbon system.
Near-continuous ocean observations by satellites have enabled greater understanding of these events and their carbon cycling. Acker and Wilber have worked on remote-sensing methods to quantify how much sediment reaches the deep ocean following the turbulence of tropical cyclones, including recently with Hurricane Ian over the West Florida Shelf. Now, hyperspectral observations from NASA’s PACE (Plankton, Aerosol, Cloud, ocean Ecosystem) mission, launched in February 2024, are poised to build on that progress, Acker said.
The phenomenon at Pedro Bank following Hurricane Melissa provided a singular opportunity to study this and other complex ocean processes—a large natural experiment that could not be accomplished any other way. Researchers will be further investigating a range of physical, geochemical, and biological aspects illuminated by this occurrence. As Wilber put it: “This event is a whole course in oceanography.”
NASA Earth Observatory images by Michala Garrison, using MODIS data from NASA EOSDIS LANCE and GIBS/Worldview, and ocean bathymetry data from the British Oceanographic Data Center’s General Bathymetric Chart of the Oceans (GEBCO). Photo by Jude Wilber. Story by Lindsey Doermann.