Reading view

There are new articles available, click to refresh the page.

Does Capital Really Rotate From Gold To Bitcoin? On-Chain Data Offers Insight

“Bitcoin is the digital gold” is one of the most popular narratives in the cryptocurrency industry, reiterating BTC’s growing status as a formidable store of value. However, while the premier cryptocurrency has floundered over the past months, gold and the metals market have largely witnessed explosive growth.

These contrasting performances have led to conversations about capital rotation between Bitcoin and gold, as the crowd expects one to always outperform the other at any given time. Recent data, however, suggests that the relationship between the BTC and gold price action is overrated.

Capital Flow Link Between BTC And Gold Overestimated 

In a January 24 post on the X platform, on-chain analyst with the pseudonym Darkfost weighed in on the discourse surrounding capital rotation between gold and Bitcoin. According to the market pundit, the idea that investor funds flow from gold to Bitcoin is somewhat overblown.

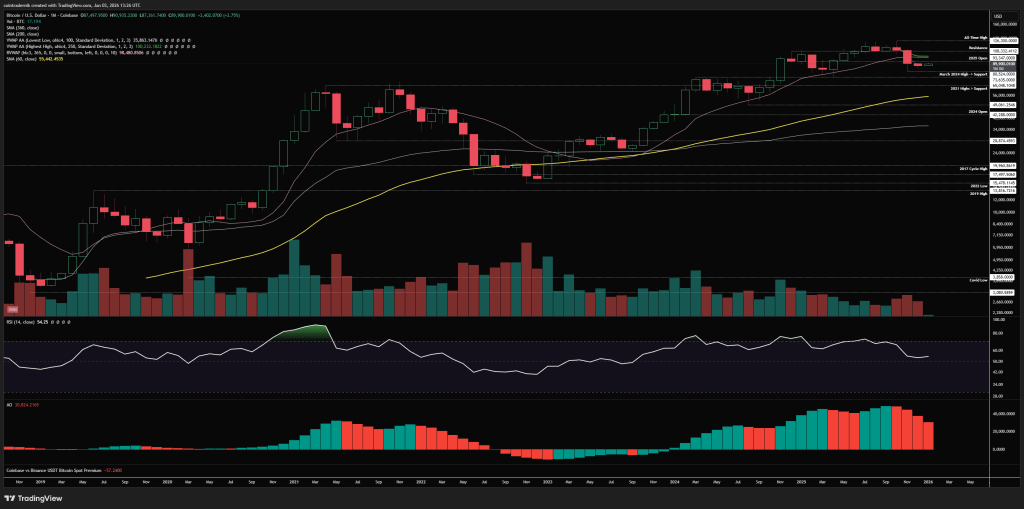
To highlight this overestimation, Darkfost shared a chart showing periods where BTC outperforms or underperforms depending on gold’s trend. This chart typically provides two signals: positive (BTC above the 180-day moving average [MA] and gold below the 180-day MA) and negative (BTC below the 180-day moving average and gold below the 180-day MA).

Bitcoin

As observed in the chart above and stated by Darkfost, the relationship between Bitcoin and gold does not appear to be fully substantiated. The on-chain analyst revealed that there have been as many positive periods as the negative ones, suggesting that the flagship cryptocurrency moves independently of gold.

Darkfost wrote:

This suggests that BTC continues to evolve independently, without clear evidence of a sustained capital rotation from gold.

Furthermore, Darkfost noted that a positive signal does not necessarily mean that capital is flowing out of gold into Bitcoin. According to the on-chain analyst, it is simply not possible to determine whether there is a capital flow relationship between the world’s largest cryptocurrency and gold.

Bitcoin & Gold Price Overview

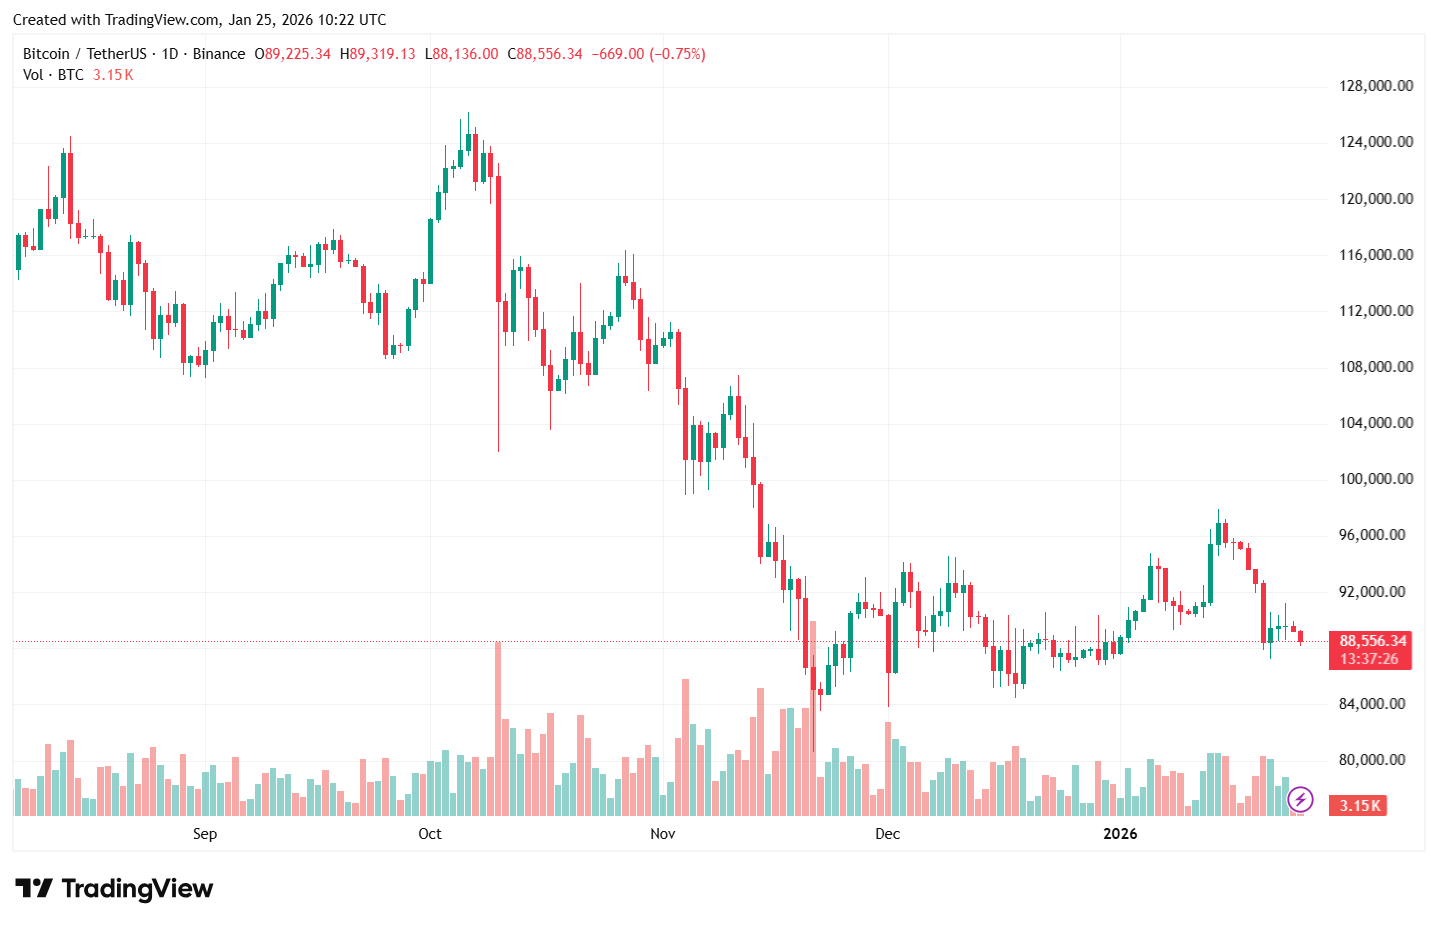
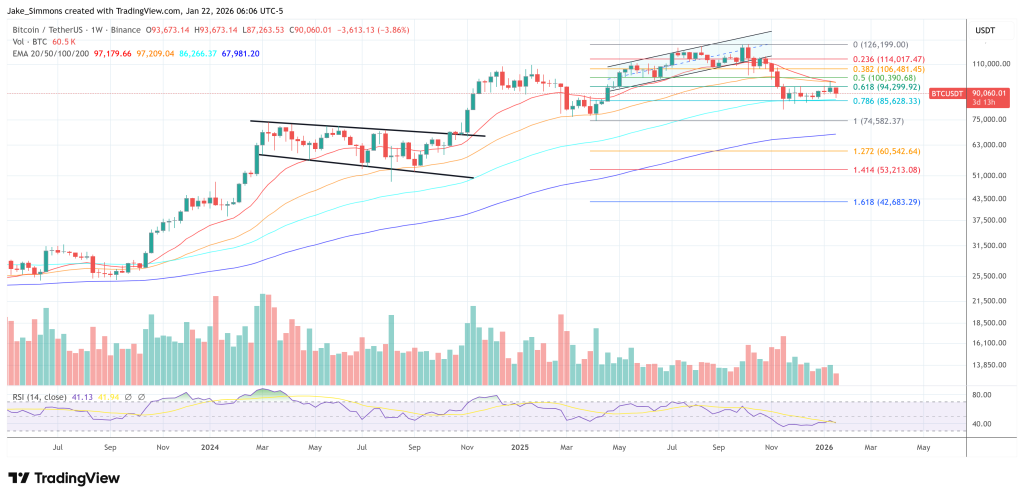
While Bitcoin started the new year on a pretty strong note, the bullish momentum has pretty much waned over the past two weeks. Meanwhile, the gold price has continued to flourish this year, recently reaching a new all-time high above $4,900 per ounce.

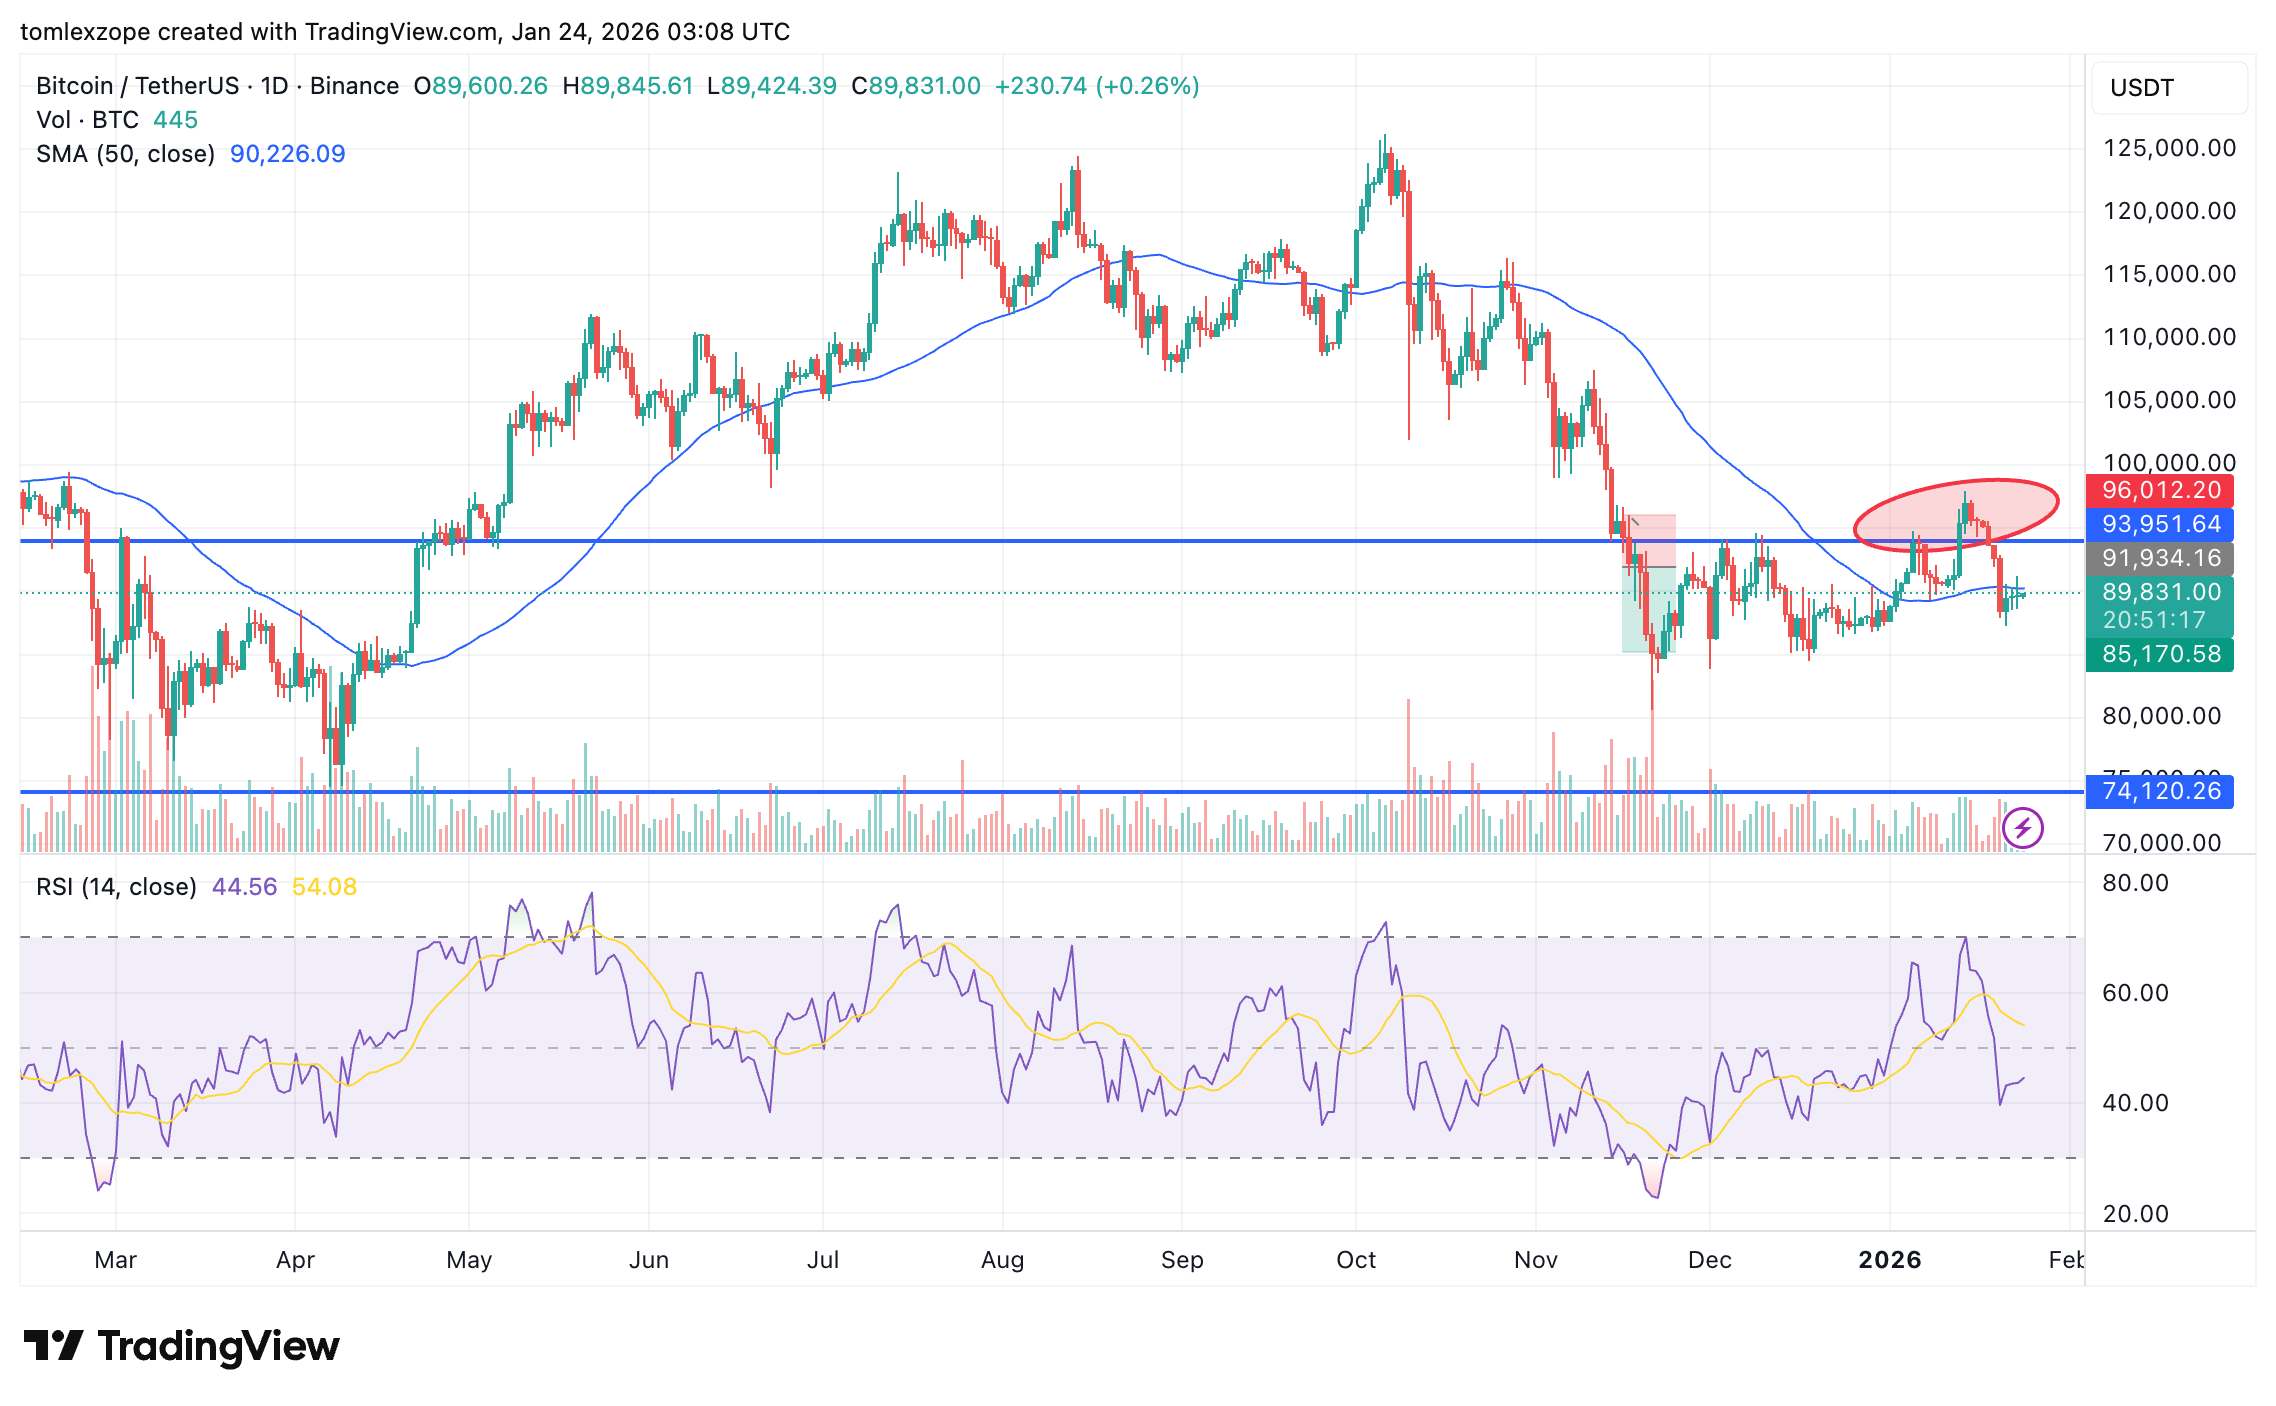
As of this writing, the price of BTC stands at around $89,230, reflecting no significant movement in the past 24 hours. According to data from CoinGecko, the flagship cryptocurrency is nearly 30% adrift its all-time high above the $126,000 level.

Bitcoin

Bitcoin Whale Demand Hits Extreme Levels As Next Rally Loads Up

The Bitcoin price action has been muted over the past few days, trading within the $90,000 and $88,000 levels. Classically, consolidation periods often precede major moves either to the upside or downside of the market.

As such, questions on the next trajectory of the flagship cryptocurrency are being asked. A latest on-chain evaluation has offered a positive prognosis on the next direction for the Bitcoin price. 

Accumulation Demand Metric Surges To All-Time-High 

In a Quicktake post on CryptoQuant, on-chain analyst CoinNiel hypothesized that the Bitcoin price could be at the beginning of a bullish trend. The market quant based this prognosis on two metrics — the Accumulator Address Demand and the Liquidity Inventory Ratio (month). 

The Accumulator Address Demand metric monitors the net buying pressure coming from addresses that buy Bitcoin consistently, and without any significant selling. This behavior (of buying and rarely selling) is typical of the large-scale Bitcoin holders, commonly known as the whales. 

Notably, CoinNiel also pointed out that when major withdrawals from exchanges occur, they are rarely ever incited by retailers, but by whales. As such, when the Bitcoin whales withdraw their holdings from exchanges, their buying pressure translates into an increase in the Accumulator Address Demand. 

Bitcoin

From the chart above, the indicator has reached an all-time high level. According to the crypto pundit, this could be a sign that the whales are currently experiencing, on intense levels, the “fear of missing out.”

The second metric, the Liquidity Inventory Ratio (Month), also reinforces CoinNiel’s bullish outlook. This metric tracks and compares existing Bitcoin demand to the supply available on exchanges, showing whether demand can overwhelm available supply

When this ratio rises sharply, it is usually a sign that demand is absorbing newly created supply. From the data shared by the analyst, the Liquidity Inventory Ratio has also reached an extreme value of 3.8.

However, this extreme reading is only a reflection of what is happening on US exchanges. Hence, CoinNiel implied that, for the first time in years, US exchanges are recording exceptionally high demand relative to the coins available.

In theory, a 3.8 reading implies the imminence of a supply shock in the scenario where current conditions prevail. But, the analyst highlighted that it may not necessarily happen, as a 3.8 reading is more a sign of intensified whale demand than a surefire means to predict supply shocks. 

The big picture, especially when these two metrics are looked at together, appears to be distinctly bullish. This is because available data points out that the whales are likely positioning for what could be a resumed bullish trajectory for the Bitcoin price.

Bitcoin Price At A Glance

As of this writing, Bitcoin is valued at $88,520, reflecting an over 1% decline in the past 24 hours.

Bitcoin

Bitcoin Price Mirroring Key Patterns From 2021 – Is History About To Repeat?

The Bitcoin price is showing signs of history repeating itself, as current price action mirrors key patterns from the 2021 cluster. With resistance near $91,000–$92,000 and the macro downtrend looming, traders are watching closely to see if BTC will break higher or face renewed pressure. The coming days could prove decisive in shaping the next major move.

Bitcoin Mirrors 2021 Cluster: History In Motion

Bitcoin continues to mirror the price patterns seen during the 2021 cluster. Crypto analyst Rekt Capital noted that the current market structure is echoing historical behavior, suggesting that similar dynamics are at play. Traders are closely watching these familiar patterns to gauge whether the cycle is repeating itself or if new trends may emerge.

The rules of the game remain consistent. A bearish acceleration would likely be triggered if Bitcoin breaks down from the macro descending triangle base, currently positioned around $82,000. Conversely, a bullish bias would require a decisive break above the macro downtrend, which sits near $100,000. These levels serve as critical decision points for the market, dictating whether bulls or bears gain control in the coming sessions.

Bitcoin

So far, Bitcoin has encountered rejection in the high $90,000s, falling just short of the macro downtrend. This mirrors previous market behavior, in which the asset developed a basing structure near the triangle’s base before attempting to push higher toward the downtrend’s upper boundary. It demonstrates that history is repeating itself for now, with the market consolidating and preparing for its next directional move.

If the macro downtrend continues to act as resistance, the triangle’s base may gradually weaken over time. Such a development would increase the risk of further downside, making the reaction at both the base and the downtrend crucial. 

BTC Surpasses $91,000 Before Facing Selling Pressure

In a recent market update by Ted, it was noted that while Bitcoin broke above the $91,000 threshold yesterday, the rally met significant resistance. Sellers entered the market with substantial force at these local highs, effectively capping the momentum and preventing a sustained breakout.

As a result of this rejection, Bitcoin has retreated into the “no-trading zone.” Ted suggests that this period of sideways price action is likely to persist through the next couple of days, largely driven by the typical low-liquidity environment seen during the weekend.

Looking ahead, the outlook remains cautious. Ted emphasizes that any upward movements will likely be short-lived until BTC can decisively clear the $91,000 to $92,000 resistance zone. Meanwhile, such a move must be backed by strong spot demand to prove its validity.

Bitcoin

$7 Trillion Player Is Moving Into Bitcoin, Can This Trigger A Surge To $200,000?

Swiss banking giant UBS, with assets under management (AuM) of up to $7 trillion, is set to launch Bitcoin trading for some of its clients. This comes amid predictions that regulatory clarity and broader adoption could send the BTC price to as high as $200,000. 

UBS To Offer Bitcoin Trading To Some Wealth Clients

Bloomberg reported that UBS is planning to launch crypto trading for some of its wealth clients, starting with its private bank clients in Switzerland. The bank will reportedly begin by offering these clients the opportunity to invest in Bitcoin and Ethereum. At the same time, the crypto offering could further expand to clients in the Pacific-Asia region and the U.S.

The banking giant is currently in discussions with potential partners, and there is no clear timeline for when it could launch Bitcoin and Ethereum trading for clients. This move is said to be partly due to increased demand from wealth clients for crypto exposure. UBS also faces increased competition as other Wall Street giants are working to offer crypto trading. 

Morgan Stanley, in partnership with Zerohash, announced plans to launch crypto trading in the first half of this year, starting with Bitcoin, Ethereum, and Solana. The banking giant may soon also be able to offer its crypto products, as it has filed with the SEC to launch spot BTC, ETH, and SOL ETFs. 

Furthermore, JPMorgan, another of UBS’ competitors, is considering offering crypto trading to institutional clients, although this plan is still in the early stages. The bank already accepts Bitcoin and Ethereum as collateral from its clients. Last year, it also filed to offer BTC structured notes that will track the performance of the BlackRock Bitcoin ETF.

Can Bank’s Entry Trigger A BTC Rally To $200,000  

Kevin O’Leary predicted that Bitcoin could rally to between $150,000 and $200,000 this year, driven by the passage of the CLARITY Act. His prediction came just as White House Crypto Czar David Sacks said banks would fully enter crypto once the bill passes. As such, there is a possibility that BTC could reach this $200,000 psychological level in anticipation of the amount of new capital that could flow into BTC from these banks once the bill passes. 

BitMine’s Chairman, Tom Lee, also predicted during a CNBC interview that Bitcoin could reach between $200,000 and $250,000 this year, partly due to growing institutional adoption by Wall Street giants. Meanwhile, Binance founder Changpeng “CZ” Zhao said that a BTC rally to $200,000 is the “most obvious thing in the world” to him.

At the time of writing, the Bitcoin price is trading at around $89,600, up in the last 24 hours, according to data from CoinMarketCap.

Bitcoin

Bitcoin Pattern From 2022 That Led To Crash To $20,000 Reappears

Bitcoin (BTC) is mirroring the same setup from its 2022 bull cycle, which led to a massive price crash to $20,000. According to market expert Crypto Bullet, this recurring structure could signal another major correction for BTC ahead. However, this time the leading cryptocurrency could give up almost a quarter of its current value. 

2022 Bitcoin Chart Pattern Signals Over 20% Crash

In his technical analysis released on X, Crypto Bullet revealed that Bitcoin is currently repeating a 2022 structure that could lead to a more than 20% decline in its value. To support his bearish outlook, the analyst presented a parallel chart comparing Bitcoin’s price action from 2023-2022 and 2025-2026, highlighting similar technical patterns, price behavior, and Moving Averages (MA). 

During the 2022 cycle, Bitcoin experienced a similar pattern, beginning with a test of the 100-day Moving Average (MA100), highlighted as the blue trendline on the chart. After facing rejection at that level, the price pulled back to a nearby support zone inside a rising channel. From there, BTC staged a sharp rally, surging to fresh highs around $48,500, where it aligned with the 200-day Moving Average (MA200), marked in orange. 

However, the recovery proved short-lived. Bitcoin soon reversed course and failed to reclaim the MA200 as support. Once the cryptocurrency’s price structure was lost, downside momentum accelerated, pushing the price into a much deeper correction toward the $20,000 level. 

According to Crypto Bullet, Bitcoin is repeating this exact pattern in 2026. It has already retested the MA100, gotten rejected, and moved lower into a support zone within a similar ascending channel. The chart also showed that in both cycles, BTC reached a “market cycle top,” first around December 2023 and then again in November 2025, before breaking down and entering a consolidation phase

Given how closely Bitcoin is mirroring its 2022 setup, Crypto Bullet has forecast another dramatic price crash, predicting a more than 23.5% drop from its current price near $89,500 to $68,450. Before this decline happens, the analyst expects BTC to experience a short-term recovery, potentially climbing back above the $100,000 psychological level to reach $102,000. 

Bitcoin Could Still Rally To $92,000

Crypto analyst Tyrex has stated that Bitcoin has been consolidating for the past 48 hours, with price holding above $89,000 for most of that period. Despite the muted price action, he believes that BTC could soon rally to $92,000. The analyst also noted that the broader market is in a state of fear, with many traders anticipating further declines in Bitcoin.

However, the analyst cautions that this expected drop may be a trap. He points out that an ascending channel is forming on Bitcoin’s chart, prompting him to adopt a more bullish outlook despite the prevailing bearish sentiment and sideways price movement.  

Featured image from Unsplash, chart from TradingView

Bitcoin Metric Suggests Miners Are In Recovery Mode — Price To Follow?

Over the past week, the price of Bitcoin faced a significant setback in its goal of reclaiming the six-figure threshold. The flagship cryptocurrency has been hovering around the $90,000 mark, as the market can’t seem to make a decision concerning the next price direction.

As Bitcoin faced a mild sell-off, which, in turn, drove its price to fall from its recent highs, specific market participants were under severe pressure, including the miners. Interestingly, a recent on-chain evaluation has raised the possibility that miners’ stress might be ending soon.

Miner Financial Health Flashes Classic Reversal Sign

In a January 23 post on the social media platform X, market expert Axel Adler Jr highlighted that the Bitcoin miners might have started their post-capitulation recovery journey. The relevant indicator here is the Miner Financial Health Index (7D-SMA). 

For context, this metric tracks the balance between miner revenue and miner selling pressure. Hence, it reflects whether miners are net BTC distributors or accumulators. Simply put, the metric shows if Bitcoin miners are under pressure, stable, or even profitable. 

Capitulation events often reflect on the Miner Health Index as a negative value, as the amount of BTC spent surpasses the amount of BTC earned. On the other hand, miners are typically said to be in the recovery phase when the balance between revenue and spending starts to lean away from the negative.

Image

From the chart shared by the analyst, it is apparent that the index has taken on an uptrend, targeting neutral levels on the metric’s charts. History shows that the index does not merely target the neutral mark when it trends upward.

Hence, if history were to repeat itself, the Bitcoin miners could be in for a rewarding ride, having survived the most recent capitulation event. Interestingly, the price of Bitcoin appears to have a directly proportional relationship with the Miner Health Index.

Bitcoin Price Gathers Momentum As Market Condition Shifts

In a separate post on X, Bitcoin Vector highlighted that Bitcoin might be garnering strength for a significant move in the near term. According to the analytics platform, this development coincides with the market exiting what was previously a “high-risk environment.”

Bitcoin Vector explained that this exit from a risky market environment was last seen in April 2025, just before the bull run resumed. The on-chain analytics firm explained that we could be witnessing the late stages of a classic momentum bottoming pattern, which historically leads to large rallies. 

Essentially, there has to be one last push lower in price and, at the same time, a momentum boost to the upside, for the bullish signal to be completely formed. As of this writing, Bitcoin is valued at around $89,830 with no significant movement in the past 24 hours.

Bitcoin

Bitcoin Price Still Has Room To Fall Below $60K — Crypto CEO

The Bitcoin price had a relatively rough trading period over the past week, as it hovered around the psychological $90,000 mark. The flagship cryptocurrency, which looked set for a return to six-figure valuation barely over a week ago, now seems to have lost all its bullish momentum.

Broadly speaking, these recent struggles put to rest questions around the “relief rallies” to the upside, and correlate more with the current bear market structure. However, the latest on-chain evaluation shows that the Bitcoin price woes could worsen from here on out.

Expert Explains Why $60,000 Is Possible For BTC Price

In a recent post on the X platform, Alphractal CEO and founder Joao Wedson said that the Bitcoin price could still have room to fall below the $60,000 level. This not-so-optimistic prediction is based on the number of days Bitcoin has traded at prices higher than today.

According to Wedson, there have been 355 days when the Bitcoin price has traded at levels higher than today. This figure was derived from the “Days Spent at a Profit” metric, which tracks the number of days in Bitcoin’s history where the market price was higher than the current price.

This indicator measures how much price action — in the past — has occurred above the current price level. From a historical standpoint, an increase in the number of “Days Spent at a Profit” tends to occur during bear cycles or extended periods of sideways movement, implying that different investor groups are holding BTC at a price higher than their cost bases.

Bitcoin price

As Wedson highlighted, the “Days Spent at a Profit” metric reached around 775 days as the Bitcoin price approached a bottom. Going by this historical context, the current level of this indicator (355 days) suggests that the flagship cryptocurrency is still a distance away from extreme levels often associated with bearish market bottoms.

Ultimately, this deduction means that the price of Bitcoin could still be at risk of an extended decline over the next 300 days. According to the Alphractal, this extended period of price decline could see BTC revisit $60,000, potentially triggering significant liquidations among retail investors and institutional players who entered the market post-ETF.

Bitcoin Price At A Glance

As of this writing, the price of BTC stands at around $89,900, reflecting no significant change in the past 24 hours. However, the market leader is currently down by over 5% on the weekly timeframe, while nearly 30% adrift its all-time high of $126,080.

Bitcoin price

Binance Founder Has ‘Strong Feelings’ For A Bitcoin Supercycle In 2026

The price of Bitcoin registered a hot start to the new year, making a run to reclaim the highly coveted $100,000 level in the early days of January. While the premier cryptocurrency has cooled off over the past few days, optimism has never been this high in the market over the last couple of months. Adding to this optimism is Binance’s co-founder and former CEO, Changpeng ‘CZ’ Zhao, who predicted an extremely positive outlook for Bitcoin in 2026.

BTC Could Abandon 4-Year Cycle Theory In 2026: CZ

In a CNBC interview at the World Economic Forum, CZ said that he has “strong feelings” that the Bitcoin price will enter a supercycle in 2026. This prediction came as a response to the interviewer’s question about Zhao’s Bitcoin price outlook.

In an economic context, a supercycle refers to an extended period characterized by the explosive growth of an asset or sector. Unlike a typical short-term rally triggered by hype and speculation, supercycles signal a significant shift underpinned by strong fundamentals over an extended period.

Zhao explained to the interviewer that the price of Bitcoin moves in a four-year cyclical pattern, spanning periods of all-time highs and cycle lows. However, the former Binance CEO agreed with the ongoing narrative that believes that the premier cryptocurrency will break the four-year cycle theory this year.

When asked about his strategy and current portfolio, CZ mentioned that he doesn’t trade the crypto market but rather accumulates coins with long-term promise. Specifically, the prominent crypto leader said that he keeps accumulating Bitcoin and BNB, the Binance ecosystem’s native token.

In his interview, CZ also talked about life after his four-month stint in jail, mentioning his work with YZi Labs, Giggle Academy, and as a crypto advisor to various governments. Zhao, who received a pardon from United States President Donald Trump in October 2025, clarified the rumors around receiving clemency for violating the US Bank Secrecy Act.

It is worth noting that CZ is not the first personality in the crypto space to speak about the Bitcoin price abandoning the halving-associated four-year cycle for a supercycle. Fidelity Labs managing partner, Parth Gargava, had echoed a similar sentiment about the BTC market earlier in the new year.

Gargava highlighted three drivers as the factors behind the transition from the typical four-year cycle to a supercycle. “Steady buy-in by institutions focused on ETFs, policy, and market maturation and changing correlations,” the Fidelity executive listed as the catalysts behind the shifting market landscape.

Bitcoin Price At A Glance

As of this writing, the price of BTC stands at around $89,460, reflecting no significant movement in the past day.

Bitcoin

Can Bitcoin Revisit $97,600? Glassnode Says Watch This

Bitcoin’s push to $97,600 last week drew a burst of bullish options activity, but Glassnode argues the derivatives tape looked more like short-dated positioning than broad-based conviction. In a Jan. 23 thread, the on-chain analytics firm pointed to a split between front-end call demand and longer-dated risk pricing that stayed anchored in downside protection.

“Let’s deep dive into options market behavior during last week’s move to 97.6K, and how options metrics help gauge conviction behind the move,” Glassnode wrote. The core takeaway: upside flow showed up, but it didn’t meaningfully change how the market priced risk further out the curve.

What Bitcoin Traders Can Learn From Last Week’s Rally

Glassnode first focused on near-term skew. Around mid-January, BTC rose roughly 8% over a few days, and the 1-week 25-delta skew moved sharply toward neutral from “deep put territory.” That kind of front-end shift can look like a market flipping bullish—until you check whether the same repricing is happening in longer expiries.

“Careful though,” Glassnode warned. “Near-dated call demand is often misread as directional conviction.” The thread paired that point with flow data: the options volume put/call ratio dropped from 1 to 0.4, signaling a surge in call activity. But, as Glassnode framed it, the question is not whether calls were bought, but how short-dated that demand actually was.

The longer-dated picture was notably less enthusiastic. Glassnode said the 1-month 25-delta skew “only moved from 7% to 4% at the low,” staying in put asymmetry even as the 1-week skew fell from 8% to 1%. On the 3-month 25-delta skew, the shift was even smaller (less than 1.5%) and it “stayed firmly in put territory,” continuing to price asymmetric downside.

For Glassnode, that divergence matters because it separates “flow” from “risk pricing.” Upside participation can be real, but if the market does not reprice skew across maturities, it suggests traders are not extending that optimism into a higher-conviction, longer-horizon view.

The volatility tape reinforced the same message. “Layering in ATM implied volatility, we see vol being sold as price moved higher,” Glassnode wrote. “Gamma sellers monetized the rally. This is not the volatility behavior typically associated with sustained breakouts.”

That combination: front-end call demand alongside vol supply can align with tactical positioning rather than a regime change. It can also leave spot moves more vulnerable if follow-through buying does not materialize once short-dated structures roll off.

Glassnode closed with a checklist for what a cleaner breakout would look like: “An ideal breakout setup combines spot pressing key levels, skew pointing higher with conviction across maturities, and volatility being bid. Last week’s move didn’t meet those conditions.”

For traders watching whether BTC can revisit $97,600, the thread’s implication is straightforward: monitor whether longer-dated skew begins to lift out of put territory and whether implied volatility starts to get bid, not sold, as spot tests key levels again.

At press time, BTC traded at $89,297.

Bitcoin price chart

Strategy Is Becoming Bitcoin’s Central Bank Proxy, Says Michael Saylor

Michael Saylor says Strategy’s evolving capital-markets machine is starting to resemble a “central bank of Bitcoin,” positioning the company as a conduit between traditional money markets and the Bitcoin network. In an interview with Gatecast, the Strategy executive chairman argued the firm’s shift toward perpetual preferred equity and “digital credit” instruments is designed to fund continuous bitcoin accumulation while stripping out refinancing risk.

Saylor traced the company’s pivot to the COVID-era shock of 2020, when “the physical economy of the world came to a grinding halt and the financial system was turned upside down.” Facing what he framed as an existential decision, he said Strategy discovered Bitcoin during “the war on COVID and the war on currency,” and used it to “escape a pretty miserable existence and turned into something digital and modern and much better.”

Strategy Is Building A ‘Central Bank of Bitcoin’

That transformation now sits on a scale Saylor claims is often misunderstood. Addressing criticism that Strategy is simply levering up to buy more Bitcoin, he said the firm has raised roughly $44 billion over the past year and a half and characterized “most of that” as equity rather than debt. “There isn’t really leverage,” Saylor said. “Equity is capital that you have forever. We’re funneling that capital into the crypto economy. We’re buying Bitcoin.” He added that Strategy has acquired “about $48 billion worth of Bitcoin” across “like 88 different transactions,” purchasing “as soon as we raise the capital.”

When asked whether Strategy is still just a buyer or something closer to a “shadow central bank of Bitcoin” given its holdings, Saylor leaned into the analogy. “Bitcoin is digital capital. It is the world reserve capital network. It’s replaced gold as the global non-sovereign store of value for the human race,” he said. Then came the framing: “Banks normally buy credit. We actually sell credit. So what we’re doing is the reverse of commercial banking, retail banking. It is sort of like central banking. We are sort of like the central bank of Bitcoin.”

Saylor’s “central bank” claim hinges on a product stack meant to translate Bitcoin’s balance-sheet asset into yield-bearing instruments for investors who won’t hold BTC directly. He described STRC as “a currency that’s pegged to the dollar” and “backed […] with Bitcoin,” with proceeds recycled into BTC purchases. In his telling, that mechanism links “the Bitcoin economy” to “the traditional finance economy and to the money markets of the world.”

Michael Saylor: “We are sort of like the central bank of Bitcoin.” pic.twitter.com/IyZ9EHLAQn

— TFTC (@TFTC21) January 22, 2026

The more material shift, he argued, is Strategy’s progression away from maturity-driven debt toward perpetual structures. Saylor laid out a four-stage evolution: initial use of credit and leverage, a senior note secured by BTC collateral that the company later refinanced and vowed not to repeat, then non-recourse convertible bonds, an approach he said became constrained by market size and retail inaccessibility and finally “digital credit,” which he described as “an equity […]a perpetual preferred equity.”

In one of his clearest statements of intent, Saylor said Strategy’s priority is to prevent principal from ever coming due. “We don’t want to have leverage. We want to have amplification via equity. We never want the principal to come due. We’d rather pay a higher dividend forever,” he said. “I’d rather pay 10% forever than pay 5% for 5 years.” Strategy, he added, has “announced a $1.44 billion cash reserve for the dividends,” giving it “the option to not raise any capital in the capital markets for up to two years,” and in his view “effectively stripped the credit risk off of the business.”

Saylor also pitched liquidity as a differentiator. He said Strategy has raised $7 billion over the last nine months via these instruments and described an emerging market of about $8 billion outstanding. Where preferred stocks typically trade thinly, he argued Strategy’s “digital credit instruments were trading 30 million a day,” with “Stretch […] more than a hundred million a day,” which he framed as a step-change in market access.

The firm’s investor pitch, as Saylor described it, splits the world into capital and credit buyers. “Bitcoin is digital capital. The world will be built on digital capital. But the world will run on digital credit,” he said, arguing that products like Stretch can offer a money-market-like alternative “powered by digital capital” while sidestepping Bitcoin’s volatility.

At press time, BTC traded at $89,250.

Bitcoin price chart

Years Later, Bitcoin Open Interest In BTC Still Fails To Break Past Previous Peaks

Bitcoin’s price is fluctuating below the $90,000 mark as volatility increases across the entire cryptocurrency market. During the bearish price action, attention is now being shifted to the cautious signal from the Bitcoin Open Interest in BTC terms, which has remained below past all-time high in years.

Open Interest Tells A Different Story When Measured In BTC

Amid the ongoing volatile action of the crypto market, the derivatives market for Bitcoin is providing a more subdued message. This message is unfolding on the Bitcoin Open Interest (OI) in BTC terms as outlined in a recent research by Joao Wedson, a market expert and founder of the Alphractal analytics platform.

In the report shared on the X platform, the market expert highlighted that the open interest measured in BTC terms has failed to reach new all-time highs since 2022. The BTC-based perspective shows a more restricted usage of leverage over cycles, whereas dollar-denominated measures frequently climb in tandem with price.

Bitcoin

On Thursday, the metric experienced a bounce, but Wedson stated that the upward move was mainly in USD-dominated open interest. This pattern suggests that traders are becoming more cautious in the market by allocating capital more carefully as opposed to putting it all into risky positions.

According to the expert, the trend simply suggests that speculation is present in the market and it’s currently expanding. However, the chart shows that the broader market is still far from any form of extreme or irrational euphoria. 

Not Enough Profit To Trigger A Bullish Recovery

BTC’s inability to produce another major rally is linked to the level of investors in profit. Darkfost stated that there are still not enough investors in profit to hope for a sustainable bullish recovery. Thus, it is crucial to understand that latent profits are not harmful to a market; it is quite the opposite.

When investors are most in profit, the situation is much more comfortable, which motivates them to hold. However, this only holds up to a certain point. Also, when the supply in profit surpasses 95% or even 100%, latest profits begin to impact the market and may trigger essential corrective phases.

The ongoing correction remained moderate with a drawdown to around 31%, but it was able to sharply reduce the percentage of supply in profit, suggesting very late entry by many investors. Currently, over 71% of BTC is in profit after dropping as low as 64%, a very concerning level that has typically been observed only when Bitcoin was entering a bear market. 

However, in Darkfost’s view, the market must reclaim above 75% supply in profit to regain a more stable structure. As long as it stays above this level, the supply in profit has historically been associated with positive periods, as shown in the chart. 

With the recent price rebound, the supply in profit saw a brief climb back to 75% before getting rejected. Meanwhile, many BTC investors possibly used this opportunity to exit at break-even or to cut their losses.

Bitcoin

Bitcoin price forecast: BTC stays below $90k as recovery signs slow down

Key takeaways

  • BTC is down less than 1% as the market remains choppy. 
  • The leading cryptocurrency could retest the $87k support level before rallying higher. 

BTC’s price action remains choppy

The cryptocurrency market continues to underperform as BTC and the other leading coins are in the red. Bitcoin has lost 0.7% of its value in the last 24 hours and is now trading around $89,150. 

The broader cryptocurrency market is attempting to stabilize after this week’s sell-off. Bitcoin price started the week on a negative note, closing below key support levels: the 50-day Exponential Moving Average (EMA) at $91,942.

The bulls attempted to defend the $90k psychological level but failed, with Bitcoin retesting the midpoint of a horizontal parallel channel at $87,787 before embarking on a recovery. At the time of writing on Friday, BTC is trading at around $89,175.

Will Bitcoin recover above $91k soon?

If the recovery continues, Bitcoin could extend its rally towards the first major resistance and the 50-day EMA at $91,942.

The Relative Strength Index (RSI) on the 4-hour chart is 39, pointing upward toward the neutral 50 level, indicating fading bearish momentum. For the bullish momentum to be sustained, the RSI must move above the neutral level. 

BTC/USD 4H Chart

Despite that, the Moving Average Convergence Divergence (MACD) indicator showed a bearish crossover on Tuesday, suggesting a mild downward pressure.

If the recovery fails and Bitcoin’s daily candle closes below the $87,787 support level, it could extend the fall toward the lower consolidation boundary at $85,569. 

Currently, the market conditions are choppy, with no clear direction in sight. Bitcoin has eliminated most of the gains it accumulated earlier this month, thanks to the trade tensions between the United States and the European Union (EU) regarding Greenland. 

However, while the issue seems to be resolved, Bitcoin’s performance has not significantly improved.

The post Bitcoin price forecast: BTC stays below $90k as recovery signs slow down appeared first on CoinJournal.

Here’s Why The Bitcoin, Ethereum, And Solana Prices Are Still Crashing Hard

Crypto researcher Axel has provided insights into why the Bitcoin, Ethereum, and Solana prices are still crashing. This comes as BTC continues to see a supply overhang, which threatens to put more downward pressure on crypto prices. 

Why The Bitcoin, Ethereum, and Solana Prices Are Still Crashing

In a research report, Axel noted that anomalous exchange inflows accompanied the BTC breakdown below the $90,000 zone as sellers prepared in advance. The market is also still at risk of further selling pressure as the 1.0 level of the short-term holders’ SOPR is now acting as a resistance rather than support. As such, there is a possibility that Bitcoin, Ethereum, and Solana prices will decline further. 

Further commenting on Bitcoin netflows into exchanges, Axel noted that between January 20 and 21, almost 17,000 BTC flowed into exchanges, coinciding with BTC dropping to as low as $87,000, while Ethereum and Solana prices also dropped. The crypto researcher explained that these anomalously high values followed a period of predominantly negative netflow in the first half of this month. 

Bitcoin

In the context of the falling Bitcoin price, Axel stated that such a spike is more likely to reflect supply preparation than neutral transfers. In other words, the breakdown below $90,000 appears to be structural rather than emotional. Meanwhile, Bitcoin netflow returned to neutral levels yesterday, but the accumulated inflow still creates a supply overhang, which could lead to further declines in the prices of Bitcoin, Ethereum, and Solana. 

Axel noted that a signal of improvement would be if netflow turns negative again amid rising prices, which could indicate that the overhang has cleared. However, with the short-term holders’ 7-day SMA SOPR below 0.996, the crypto researcher suggested that BTC faces increased selling pressure on every recovery as these holders look to sell at breakeven. He added that a reversal trigger could be confirmed if the SOPR breaks above 1.0 from below, with the 7-day SMA holding unity for three to five days to filter out false spikes after the selloff. 

Why A Break Above $100,000 Looks Unlikely For Now

In its latest research report, on-chain analytics platform Glassnode explained that a Bitcoin rally above $100,000 looks unlikely for now as the supply overhang persists. They noted how this overhang supply above $98,000 remains the dominant sell-side force capping short to mid-term rebounds. 

Alluding to the Unspent Realized Price Distribution metric, Glassnode noted that the recent BTC rally has partially filled the prior air gap between $93,000 and $98,000, driven by redistribution from top buyers into newer market participants. 

However, the unresolved supply overhang is expected to likely cap attempts above the $98,400 short-term holders’ cost basis and the $100,000 level. A meaningful and sustained acceleration in demand momentum is said to be required for a clean breakout above $100,000 to occur.

Bitcoin

Bitcoin Price Stability Sparks Recovery Hopes, But Hurdles Loom

Bitcoin price started a consolidation phase below $90,500. BTC is consolidating losses and might attempt a recovery wave if it clears $91,500.

  • Bitcoin started a minor recovery wave from the $87,200 level.
  • The price is trading below $90,500 and the 100 hourly Simple moving average.
  • There was a break above a short-term bearish trend line with resistance at $89,700 on the hourly chart of the BTC/USD pair (data feed from Kraken).
  • The pair might recover if it manages to settle above $90,500 and $91,500.

Bitcoin Price Eyes Recovery

Bitcoin price failed to stay above the $90,000 support and extended losses. BTC declined sharply below the $89,500 and $88,000 support levels.

The bears even pushed the price below $87,500. A low was formed at $87,200, and the price is now attempting a recovery wave. There was a move above the 23.6% Fib retracement level of the downward move from the $95,475 swing high to the $87,200 low.

Besides, there was a break above a short-term bearish trend line with resistance at $89,700 on the hourly chart of the BTC/USD pair. Bitcoin is now trading below $90,500 and the 100 hourly Simple moving average.

If the price remains stable above $89,000, it could attempt a fresh increase. Immediate resistance is near the $90,300 level. The first key resistance is near the $91,500 level since it is close to the 50% Fib retracement level of the downward move from the $95,475 swing high to the $87,200 low.

Bitcoin Price

A close above the $91,500 resistance might send the price further higher. In the stated case, the price could rise and test the $92,300 resistance. Any more gains might send the price toward the $93,000 level. The next barrier for the bulls could be $95,000 and $95,500.

Another Drop In BTC?

If Bitcoin fails to rise above the $91,500 resistance zone, it could start another decline. Immediate support is near the $89,000 level. The first major support is near the $88,200 level.

The next support is now near the $87,500 zone. Any more losses might send the price toward the $86,500 support in the near term. The main support sits at $85,500, below which BTC might accelerate lower in the near term.

Technical indicators:

Hourly MACD – The MACD is now losing pace in the bearish zone.

Hourly RSI (Relative Strength Index) – The RSI for BTC/USD is now above the 50 level.

Major Support Levels – $89,000, followed by $88,200.

Major Resistance Levels – $90,300 and $91,500.

Bitcoin Price Following The 2022 Fractal? Here Was The Previous Outcome

Technical analysis shared by crypto analyst CryptoBullet on X highlighted a familiar price action that suggests that Bitcoin’s current structure may be closely tracking a 2022 price fractal. 

Bitcoin’s price action in recent days has changed into a more fragile posture, with the cryptocurrency falling back below the psychological $90,000 level after failing to sustain higher ground above $97,000 on January 14.

How Bitcoin’s Current Structure Resembles The 2022 Fractal

According to CryptoBullet, Bitcoin’s present price action is closely following an interesting structure that it previously played out in 2022. Technical analysis on the daily candlestick timeframe chart posted by the analyst shows the earlier 2022 move as a transparent projection layered behind current price action, with a striking similarity in both rhythm and volatility. 

As it stands, Bitcoin has experienced a significant 28.7% pullback from its October 2025 peak and is now trading in a choppy consolidation, a behavior that closely matches the early stages of the 2022 downturn.

Bitcoin

CryptoBullet noted, however, that there is an important distinction. During the 2022 decline, Bitcoin had already tested the 50-week moving average and the 200-day moving average at this stage of the cycle. In the current setup, Bitcoin’s price action is trading below those levels but has not yet made a direct test, and this means that the structure may still be incomplete.

What The 2022 Outcome Predicts For Bitcoin’s Next Move

The projection in the background of the chart shows Bitcoin making one more push higher over the coming month, briefly reclaiming levels above $100,000 before running into a strong resistance at the 50-week moving average.

If this scenario plays out, the move would resemble the final relief rally seen in 2022, where the price rallied into long-term resistance before rolling over. CryptoBullet noted that timing also supports this idea, noting that considering the 2022 top is lined up with the October 2025 top, there appears to be roughly one month of price action left for a final leg up. 

The projection is that Bitcoin pushes to at least $100,000 again sometime in February 2026. However, support must hold above $83,000 in order for this bullish portion of the setup to be valid.

Although the short-term projection is bullish, the broader implication of the 2022 fractal is bearish for the mid-term. According to the chart’s projected path, Bitcoin is shown rejecting at the 50-week moving average after a brief rally, followed by a sustained decline that eventually drags its price action below $71,500. 

This prediction is based on exactly what unfolded in 2022, when a final pump gave way to a deeper corrective phase. That said, fractals are guides, not guarantees, meaning price history may rhyme, but it does not always repeat itself exactly.

Bitcoin

Bitcoin Is At Risk From Saylor: Pundit Shares Why Strategy’s BTC Holdings Is A Net Negative

Crypto pundit Crypto Chase has explained how Strategy’s Bitcoin holdings is a net negative for BTC’s adoption, especially among large investors. The pundit also ruled out the possibility of capitulation on Michael Saylor’s part, even if the flagship crypto drops below their entry point. 

Why Saylor’s Strategy Bitcoin Holdings Puts BTC At Risk

In an X post, Crypto Chase opined that Strategy’s BTC holdings do more to deter institutions and high-net-worth individuals than to attract them. The pundit added that there really isn’t any full-scale capitulation below Saylor’s average entry price of $76,000, as he believes that Saylor and Strategy will hold until zero, except if the board forces them to do otherwise.  

This statement followed Strategy’s latest $2.13 billion Bitcoin purchase, which saw the company’s holdings cross the 700,000 BTC milestone. The company now holds 709,715 BTC, which it acquired for $53.92 billion at an average price of $75,979. Meanwhile, Crypto Chase also stated that if the company were to offload these coins, the Bitcoin price would go back to $3,000 or lower. 

The pundit warned that there are not even close to enough bids to handle such selling pressure. As such, he believes that Strategy’s Bitcoin holdings would have to be sold over the counter to the U.S. government or Trump to avoid a total collapse of the flagship crypto. However, Saylor has so far asserted that they have no intention of ever selling their BTC holdings. 

Crypto Chase also mentioned that fear among uneducated market participants could provide a good entry if the narrative is that Saylor and Strategy would be liquidated if BTC drops below their average entry price. The pundit reiterated that it is game over if that ever happened, though. He is also not confident Bitcoin will rise to new highs anytime soon, noting there is significant overhead and Total Cost of Ownership, with entry points above $100,000. 

From Another Crypto Pundit’s Point Of View

It is worth noting that Crypto Chase’s statement about Saylor’s Strategy and Bitcoin’s holdings was in response to crypto pundit Ansem’s point of view. In an X post, Ansem said he believes Bitcoin will find its place alongside gold and silver in portfolios and benefit from large, high-net-worth individuals and institutions adding small positions. He remarked that BTC, as a digital analog, is easier to transport across global borders and easier to transact with. 

Ansem also noted that Saylor and Strategy’s cost average is currently around $75,000 and that he believes that a drop below that level would be a full-scale capitulation into a generational buying opportunity. From a technical standpoint, the pundit does not think Bitcoin will trade below last cycle’s price peak of $69,000 in 2021.

Bitcoin

This Bitcoin Price Level Must Hold Or It’s Mid-$50,000s: Veteran Analyst

Bitcoin’s April 2025 swing low around $73,000 has become the make-or-break line for 2026, according to veteran professional trader and commentator Nik Patel, who argues that a higher-timeframe break below that level would likely open the door to a prolonged grind in the mid-$50,000s.

In Part Three of his “2026 Outlook” published Jan. 21, Patel laid out a high-conviction call that Bitcoin prints fresh all-time highs in the first half of 2026, framing it as further evidence the market has shifted away from the clean, narrative-driven four-year cycle. “Bitcoin trades new all-time highs in H1 — the 4-year cycle is dead,” he wrote, summarizing his regime view as “higher for longer,” potentially stretching into 2027.

Why Bitcoin Must Hold $73,000 Or Risk A Slide

Patel’s core technical claim is simple: as long as Bitcoin does not close key higher timeframes below the April 2025 low, the broader structure remains intact and the base case is continuation higher. He acknowledged that he expected a sharper reversal earlier: “Timing-wise, I was wrong on my expectations for a more immediate reversal,” but stressed that price has continued to hold above the April lows “despite having every reason to break and close below.”

That resilience, in his view, matters more than moving averages or anchored references. “Since 2022, we have not made fresh lows on a weekly timeframe below the bottoms that preceded the next highs (or, more plainly, weekly structure in the most technical sense has remained bullish with higher-highs and higher-lows),” Patel wrote. “This has not changed and I place less weight on MAs, VWAPs etc. than I do on price itself, and whilst the $73k April lows that preceded the $126k all-time highs are protected, weekly structure is still bullish.”

His forecast leans heavily on a macro and positioning backdrop he describes as inconsistent with a deep-cycle crypto bear market. Patel cited “Goldilocks into reflation,” rising inflation breakevens, falling real rates, midterm dynamics, and bearish sentiment and positioning as part of the setup that makes a 2018- or 2022-style unwind less likely in his framework.

Patel’s downside map is unusually explicit for a discretionary macro-technical thesis. “If I’m wrong — and we close the higher timeframes below $73k — we likely trade mid-$50ks this year, consolidate there for many months and produce no new highs in 2026,” he wrote, outlining a scenario where a structural failure forces a wholesale reassessment.

Bitcoin price analysis

He reiterated that the trigger is not an intraday wick but timeframe closes. In his year-ahead playbook, he described being “invalidated on a weekly close below $73k but with a view to re-entering on an immediate reclaim,” while “fully” cutting exposure if Bitcoin prints a monthly close below $73,000, in which case he would “prepare for mid-$50ks.”

Patel also pushed back on the idea that the drawdown from the highs represents a new, uniquely bearish regime. “Where many view the most recent move off the highs into $80k as a ‘structural shift unlike prior corrections’, I disagree and continue to view this as a ‘higher for longer’ regime within which we have these 30-40% corrections, range-bound price-action chewing through supply and subsequently continue higher,” he wrote.

He added that the correction “felt different” in part because it coincided with what he called “the largest liquidation event in crypto history,” alongside forced selling dynamics and long-term holder supply, yet it has still only produced a drawdown modestly larger than prior pullbacks in the broader uptrend.

Even so, Patel allowed for near-term turbulence. He said there is “a decent chance we sweep the November low in early Q1,” but maintained he “categorically” does not expect a higher-timeframe close below the April lows in the first half of the year. His base case remains new highs in H1 2026—“perhaps in late Q1 but likely in early Q2.”

At press time, BTC traded at $90,060.

Bitcoin price chart

Coinbase Exec Points Out The Big Difference Between Bitcoin And Central Banks

Bitcoin’s role in the global financial system remains widely misunderstood, even at the highest levels of policy and finance. That disconnect surfaced during a major international forum, prompting a pointed clarification from a Coinbase executive. The moment centered on a fundamental question with growing relevance: what truly separates Bitcoin from central banks?

Bitcoin’s Structural Design Sets It Apart – Coinbase Executive

During the World Economic Forum in Davos, where global policymakers and financial leaders were debating the future of money and tokenization, Brian Armstrong, CEO of Coinbase, responded to remarks made by François Villeroy de Galhau, Governor of the Banque de France, who argued that central banks deserve greater trust than Bitcoin because they operate under democratic mandates and institutional oversight.

Armstrong’s response focused on how Bitcoin is designed. Bitcoin operates as a decentralized protocol with no issuing authority, no governing committee, and no single entity capable of altering its monetary rules. Its supply is fixed, its issuance is algorithmic, and its operation depends on a distributed network of participants rather than institutional oversight. This design makes Bitcoin structurally independent in a way no central bank can replicate.

By contrast, central banks sit at the top of national monetary systems. They control currency issuance, influence interest rates, and adjust monetary policy in response to political and economic pressures. Even when described as “independent,” they remain tightly connected to governments and fiscal policy. Armstrong highlighted that this link introduces discretion, policy shifts, and long-term currency debasement through money creation—a vulnerability Bitcoin was explicitly built to avoid.

This distinction becomes especially relevant during periods of aggressive deficit spending. Because Bitcoin’s supply cannot be expanded, it functions as a constraint rather than a tool. In Armstrong’s view, this makes Bitcoin a direct counterweight to systems where new money can be introduced at will, gradually reducing purchasing power over time. That structural constraint is the foundation of Bitcoin’s appeal as a hedge during periods of uncertainty.

Trust, Accountability, And Individual Choice

The exchange also exposed a deeper disagreement about how trust is formed. Villeroy de Galhau emphasized trust in central banks as institutions backed by legal authority and democratic systems. Armstrong countered by reframing trust as something derived from transparency and verifiability rather than institutional reputation. 

Armstrong further positioned Bitcoin as an accountability mechanism. Because its supply cannot be adjusted to accommodate government spending, it imposes discipline by design. In this sense, Bitcoin functions less as a policy tool and more as a constraint—similar to how gold historically limited monetary excess. This characteristic has driven its growing perception as a store of value during times of economic uncertainty.

Importantly, Armstrong did not frame the relationship between Bitcoin and fiat currencies as a zero-sum battle. Instead, he described it as a healthy competition that leaves the ultimate decision with individuals. Users can choose between systems: one based on institutional control and policy flexibility, and another based on fixed rules and decentralization.

Bitcoin price chart from Tradingview.com

Volatility Expands, But Bitcoin Whales And Sharks Aren’t Selling — They’re Buying More

Bitcoin briefly reclaimed the pivotal $90,000 price mark once again after a brief bounce, but volatility still lingers around the largest cryptocurrency asset. During the ongoing volatile landscape, investors appear to have found a new niche, and that is buying BTC at a significant and fast rate.

Large Bitcoin Holders Are Buying In The Noise

The ongoing market volatility may have significantly impacted the Bitcoin price direction, but this is not the same for investors’ sentiment and activity. In the current bearish state, BTC investors are now sending a clear bullish signal, especially as indicated in the activity of the largest holders.

Sentiment observed among BTC large holders has shifted toward buying once again. According to research shared by Santiment, a leading on-chain data analytics platform, whales and sharks continue to accumulate more BTC even as market volatility intensifies. 

During the ongoing bearish market, BTC’s price fell back to the $89,400 level, and assets like Silver and Gold experienced a steady spike. Instead of being shaken out by the pullback, these high-net-worth investors are persistently building positions, indicating a great level of confidence beneath the surface. 

When these key investors start to buy BTC at a rapid rate again while the broader market signals caution, it is often viewed as a strategic move or repositioning ahead of a potential price spike. This kind of behavior is typically seen during transitional phases.

Bitcoin

Data shows that wallet addresses holding between 10 and 10,000 BTC have purchased an additional +36,322 BTC, representing an over 0.27% rise in the past 9 days. Should this renewed buying pressure from big investors continue, it is likely to play a role in determining BTC’s next major move as it reshapes its supply and price dynamics.

While whale investors steadily add to their positions, wallet addresses holding 0.01 BTC have been dumping to the noise. This group, regarded as shrimp holders, has offloaded over 132 BTC within the same timeframe, indicating a -0.28% drop.

Santiment highlighted that it is considered an optimal condition for a crypto breakout when smart money accumulates, and retailers dump. In the absence of a geopolitical issue, this pattern continues to demonstrate a long-term bullish divergence.

Risk Around BTC Is Becoming High

Following the bearish reaction on Wednesday, the Bitcoin Risk Index metric experienced a surge, reaching the 21 level and hovering just below the High Risk zone at level 25. This uptick suggests that the continuation of the consolidation phase is highly likely and will be bolstered by the massive high-risk environment seen over the past few months.

Despite the surge, the market is still technically in a low-risk environment, and buyers are struggling to hold the pivotal support level at $89,200. At this level, the market is presented with two different scenarios.

The first, which is the bullish scenario, tells that BTC could undergo a clear push toward $94,800 and possibly $99,000 if $89,200 support holds in the short term. Meanwhile, in the bearish scenario, a continued consolidation below the support level driven by sellers would cause a drop to $84,500, marking the next line of defense for buyers.

Bitcoin

BTC stays below $90k despite Trump backing off Greenland tariff threats

Key takeaways

  • Bitcoin is up 1% in the last 24 hours but continues to trade below $90k.
  • The performance comes despite Trump’s Davos speech on Wednesday, which ended the imposition of new tariffs on European nations against the US purchase of Greenland.

Bitcoin remains below $90k despite improved risk sentiment

Bitcoin is currently in the green after adding 1% to its value in the last 24 hours, ending its six consecutive days of decline. 

The price recovery comes following strengthened global risk sentiment in response to US President Trump’s U-turn on Greenland at the World Economic Forum in Davos.

On Wednesday, Trump mentioned that he had reached an agreement with the North Atlantic Treaty Organization (NATO) on a framework for a future deal on Greenland. This ended the need to impose new tariffs on European nations.

In addition to that, Trump added that he hopes to sign the bill on crypto soon, as the US Congress continues to work on a crypto market structure bill that was postponed last week by the Senate Banking Committee.

However, the positive news hasn’t affected Bitcoin’s price action as it continues to trade below the $90k threshold. 

Institutional demand for Bitcoin is also on the decline. Data obtained from SoSoValue shows that spot Bitcoin ETFs recorded an outflow of $708.71 million on Wednesday, the third consecutive day of withdrawals and the highest single-day outflow since November 20. 

BTC eyes $93k if the $87k support holds

The BTC/USD 4H chart is bearish and efficient as Bitcoin has lost 7% of its value over the last seven days. 

It is currently trading below the 50-day Exponential Moving Average (EMA) at $92,044 and has lost the $90k psychological level. Bitcoin is trading at $89,900 after retesting the midpoint of a horizontal parallel channel at $87,787 earlier this week. 

If BTC continues its ongoing recovery, it could extend the advance toward the 50-day EMA at $92,044.

The RSI on the 4-hour chart is 40, pointing upward toward the neutral 50 level, indicating fading bearish momentum. However, the RSI must stay above the neutral 50 for the bulls to push the price higher. 

BTC/USD 4H Chart

The Moving Average Convergence Divergence (MACD) indicator showed a bearish crossover on Tuesday, indicating downward pressure.

However, if BTC closes the daily candle below the $87,787 support, it could extend the fall toward the next support level at $85,569.

The post BTC stays below $90k despite Trump backing off Greenland tariff threats appeared first on CoinJournal.

❌