XRP Charts Flash Familiar Signal As Analyst Calls For $11, Then $70
A growing number of chart watchers are pointing to a long stretch of sideways trading for XRP and saying this setup has come before big rallies. According to a widely followed analyst known as CryptoBull, the current price action echoes earlier runs in the token’s history.
The signal is simple: long quiet periods sometimes lead to sharp moves when buying pressure returns. That does not mean a jump is guaranteed. Markets can stay quiet for a long time, and timing is uncertain.
Pattern Mirrors Prior Cycles
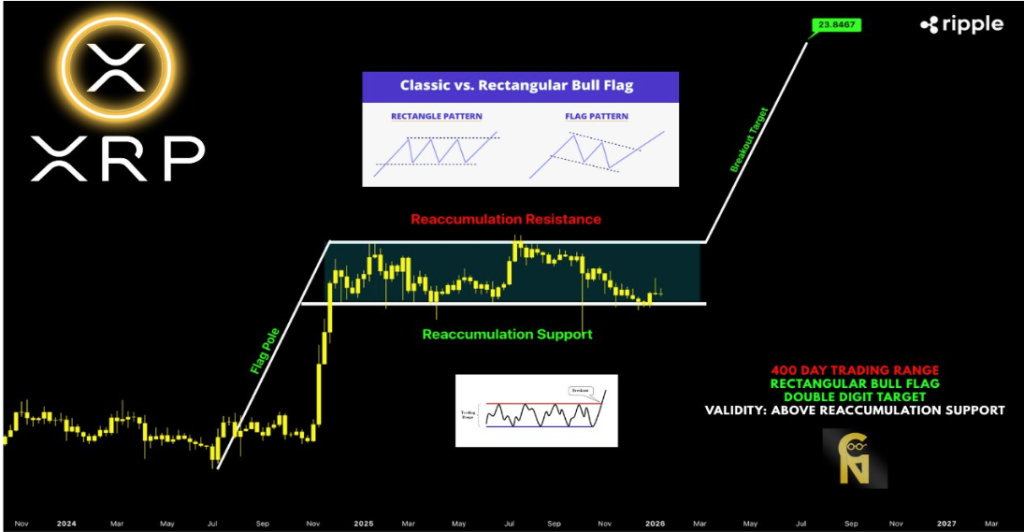
Based on reports, XRP’s weekly structure shows a stretch of range trading after strong breakouts from earlier years. The comparison reaches back several cycles. In past examples, long ranges eventually gave way to impulsive runs that pushed the price far above prior highs.
The next impulse will take #XRP to $11 and the last wave to $70. The price pattern is copying the previous bullrun, only difference is time, which makes sense, as we need longer accumulation for higher prices. pic.twitter.com/WJxzYDVRKT
— CryptoBull (@CryptoBull2020) January 23, 2026
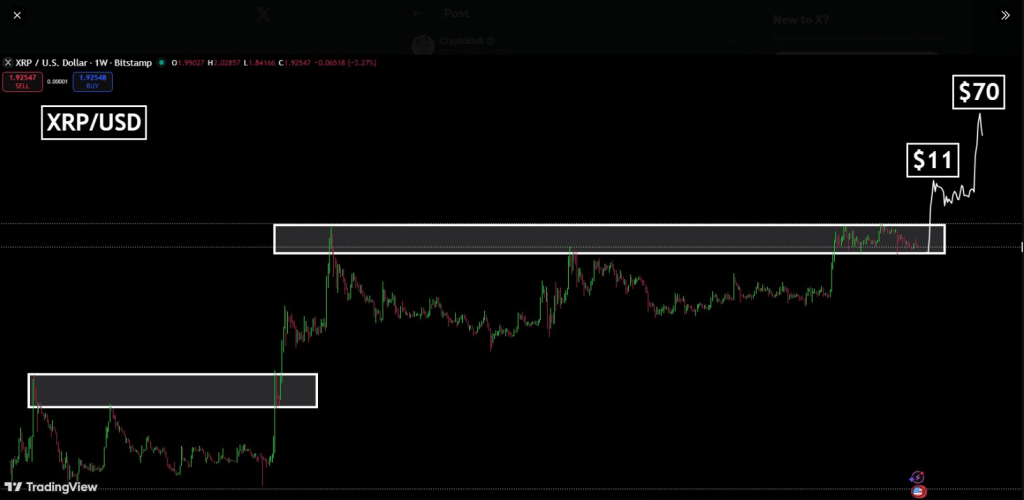
CryptoBull argues the present consolidation has lasted longer than previous ones, which, he says, could compress price action and build fuel for a larger expansion when momentum flips. The idea rests on history repeating itself in broad strokes, not in exact moves.
Longer Accumulation Could Support Bigger Targets
Some analysts see a sixfold move as plausible if the same pattern plays out. That kind of rise would put XRP near $11, a figure being discussed by multiple commentators. There is also talk of a further, final wave lifting the token much higher in a later stage — talk that reaches $70 in extreme scenarios.
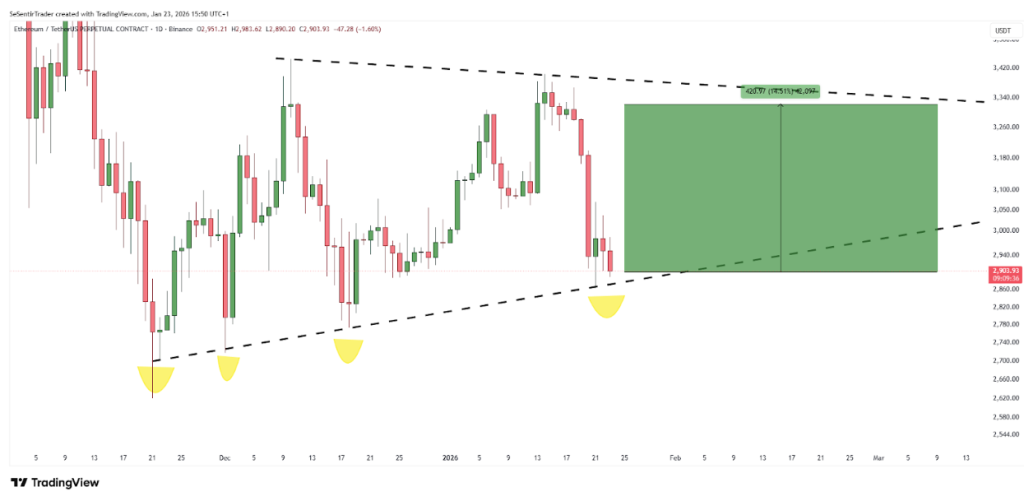
A bottom test—where price revisits support to confirm strength before a new push—has appeared in a few past cycles and is being watched closely now.
The presence of such tests can either validate a base or warn that the range has more work to do. Timelines are vague, and a long accumulation period can stretch for years before any decisive breakout.
RLUSD Rumors Fuel Speculative CallsReports that BlackRock may use Ripple’s RLUSD stablecoin have added fuel to the fire. News like that has pushed sentiment upward and sparked fresh technical calls, with some forecasts ranging from $6 to $14 in near- to mid-term scenarios.
Other voices go far beyond, naming targets that would imply market caps so large they would be hard to reconcile with today’s market size.
These more extreme numbers should be treated with caution, because they assume near-perfect conditions and massive capital flows that may never arrive. Still, adoption whispers can tilt sentiment and speed up moves when buyers pile in.
Featured image from Unsplash, chart from TradingView


 (@DonWedge)
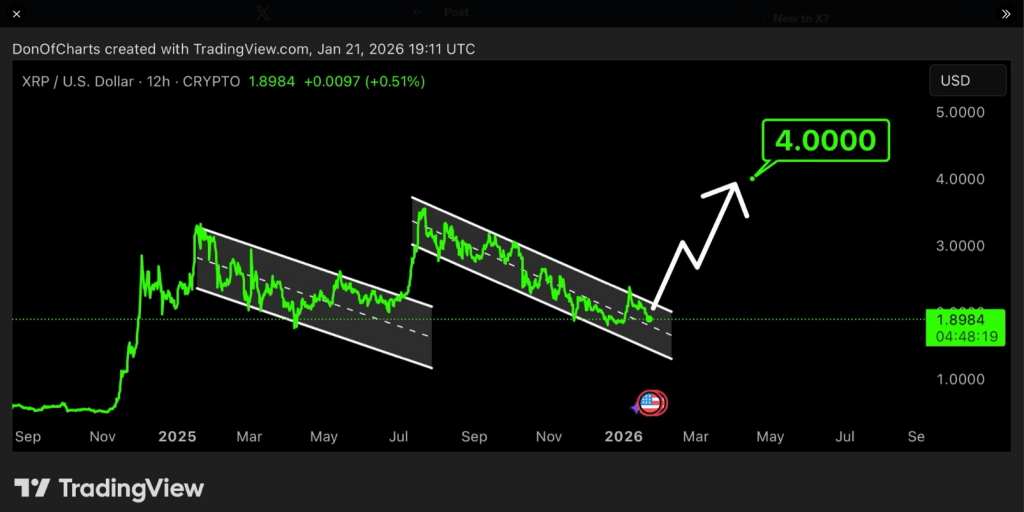
 ChartNerd
  (@ChartNerdTA)
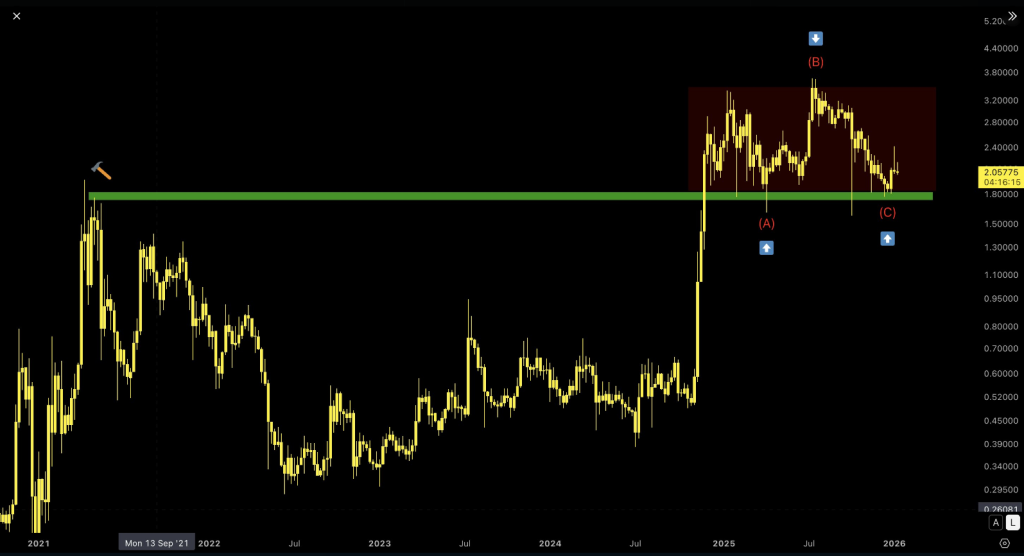

 What Regulators Might Ask