Reading view

There are new articles available, click to refresh the page.

NASA Back for Seconds with New Food System Design Challenge

4 min read

Preparations for Next Moonwalk Simulations Underway (and Underwater)

This illustration of Moon to Mars infrastructure shows astronauts living and working on the surface of Mars. NASA’s Moon to Mars Objectives establish an objectives-based approach to the agency's human deep space exploration efforts; NASA’s Moon to Mars Architecture approach distills the objectives into operational capabilities and elements.
This illustration of Moon to Mars infrastructure shows astronauts living and working on the surface of Mars. NASA’s Moon to Mars Objectives establish an objectives-based approach to the agency’s human deep space exploration efforts; NASA’s Moon to Mars Architecture approach distills the objectives into operational capabilities and elements.

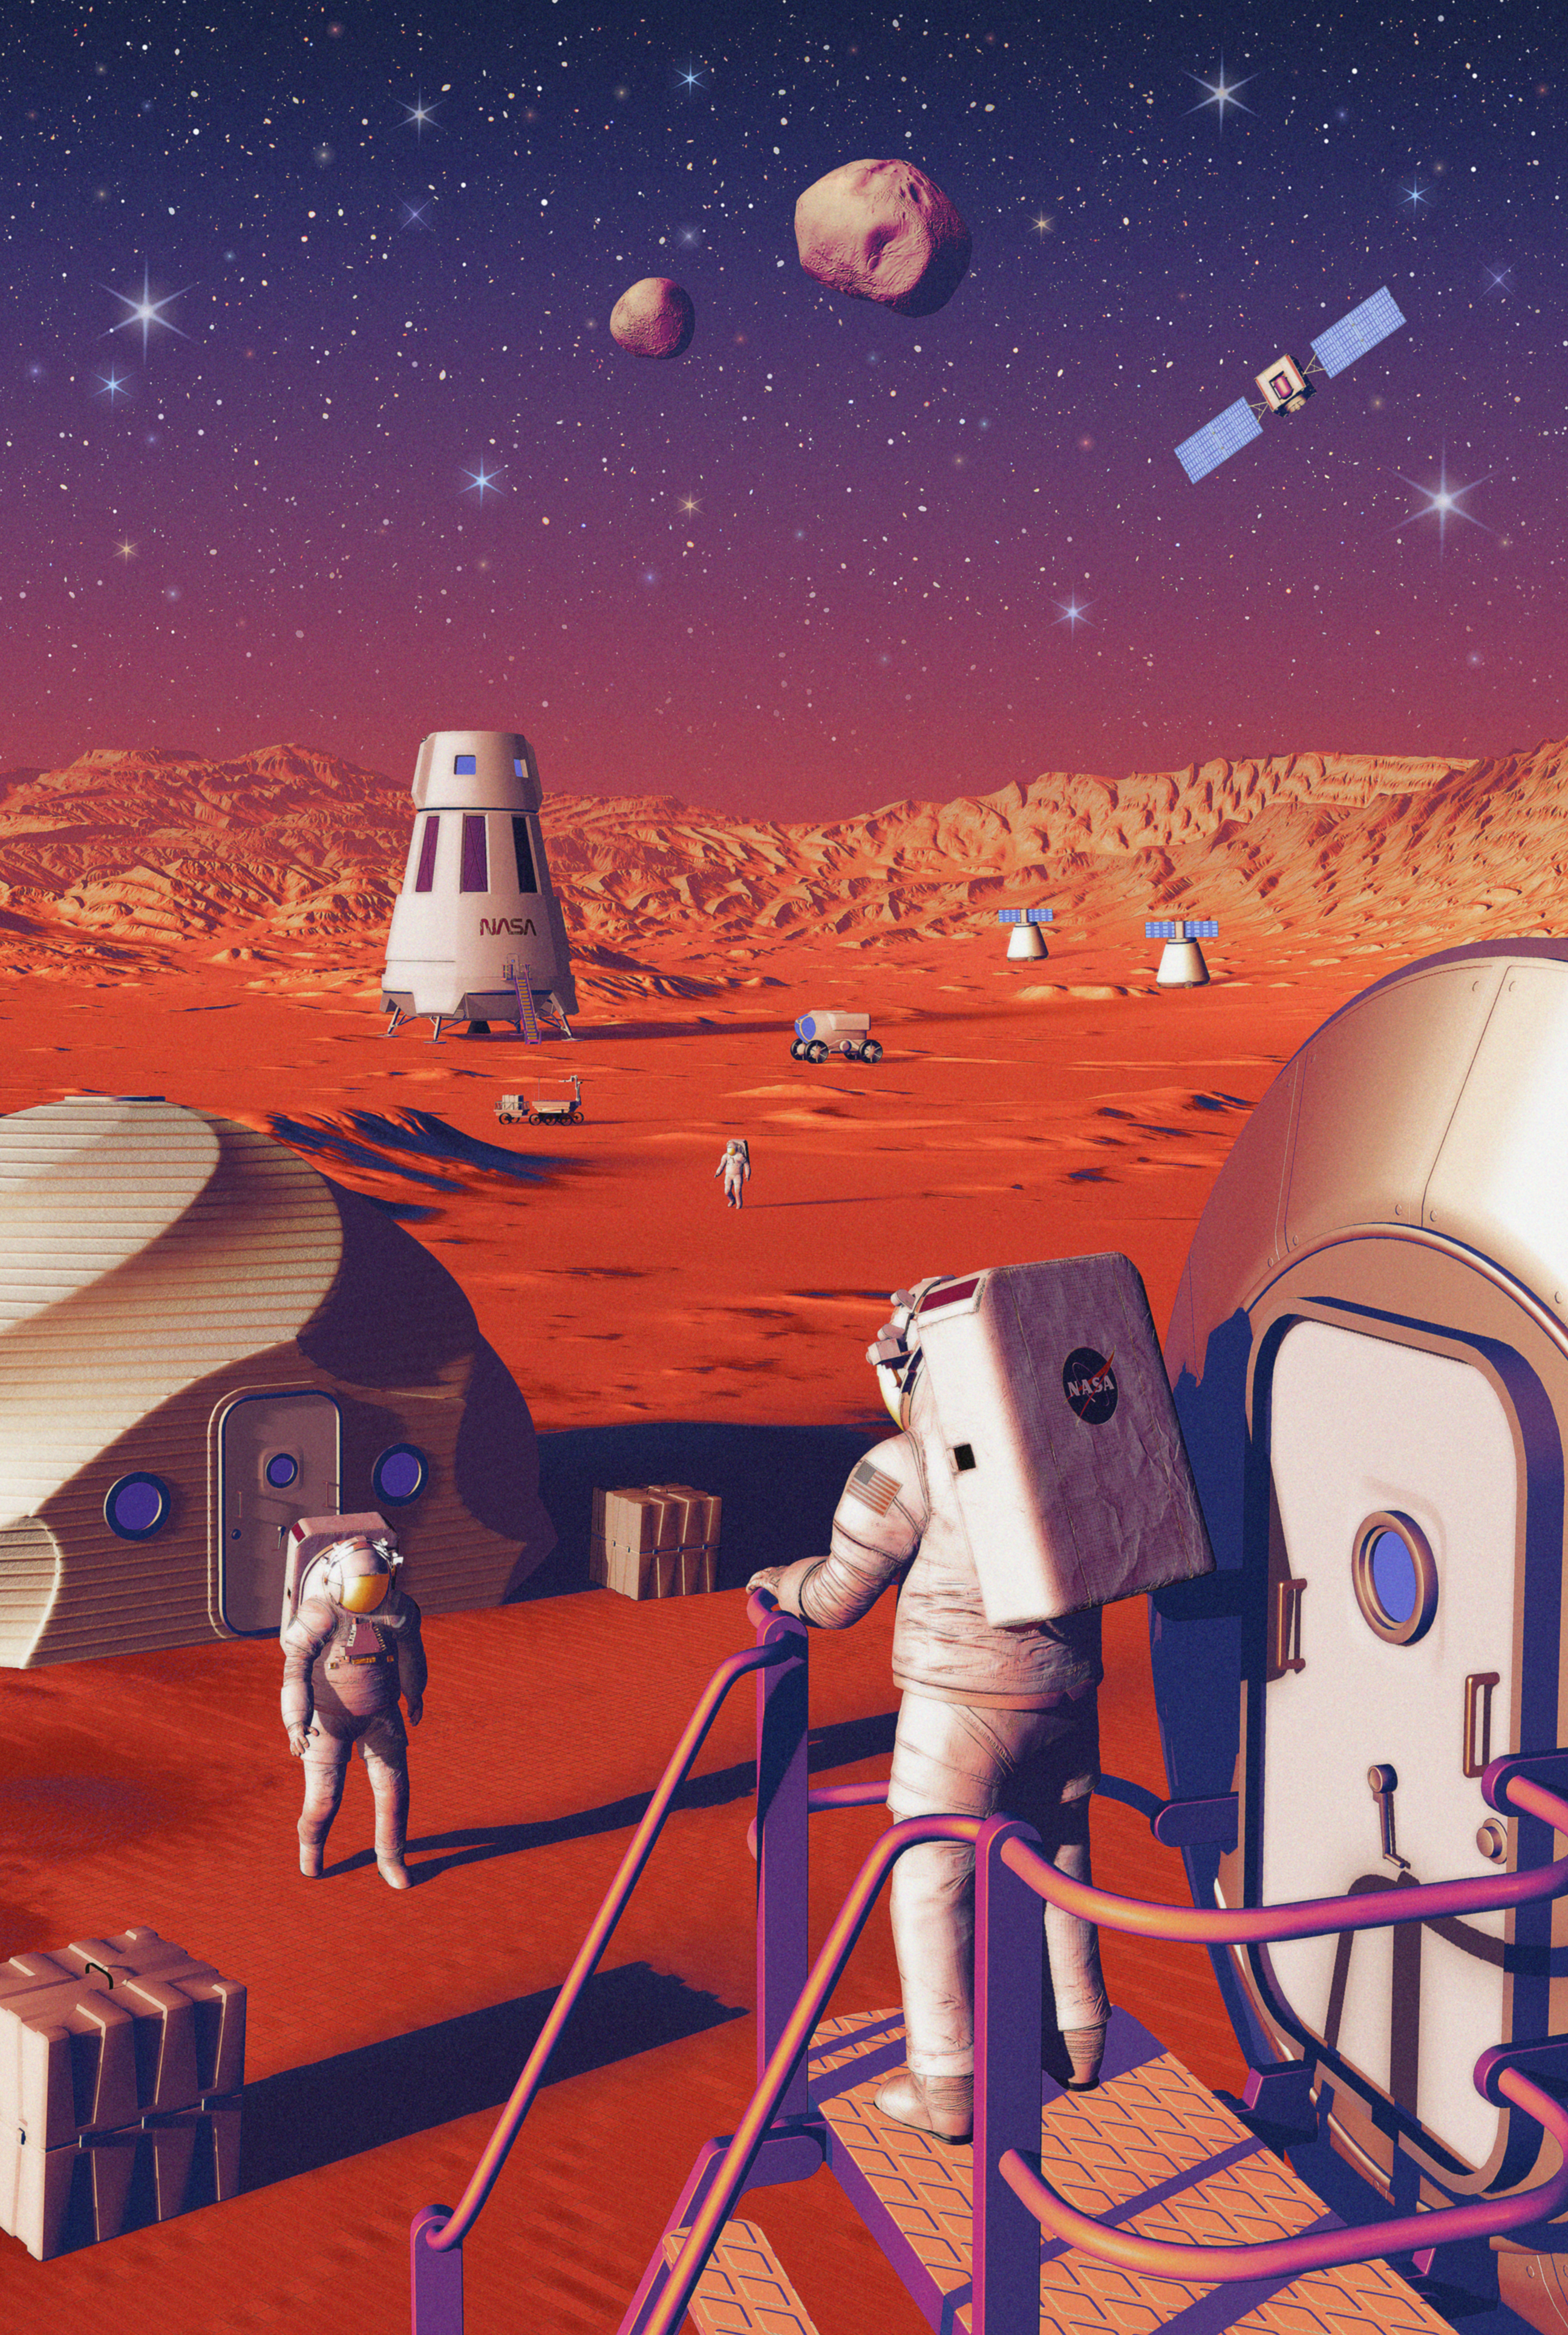
NASA is getting ready to send four astronauts around the Moon with Artemis II, laying the foundation for sustainable missions to the lunar surface and paving the way for human exploration on Mars. As the agency considers deep space endeavors that could last months or years, it must develop ways to feed astronauts beyond sending supplies from Earth.

That is why NASA is launching the Deep Space Food Challenge: Mars to Table, a new global competition inviting chefs, innovators, culinary experts, higher-education students, and citizen scientists to design a complete, Earth-independent food system for long-duration space missions.

“In the future, exploration missions will grow in both duration and distance from Earth. This will make the critical question of feeding our astronauts more complex, requiring innovative solutions to allow for long-term human exploration of space,” said Greg Stover, acting associate administrator of NASA’s Space Technology Missions Directorate at NASA Headquarters in Washington. “Opening the door to ideas from beyond the agency strengthens NASA’s ability to operate farther from Earth with greater independence.”

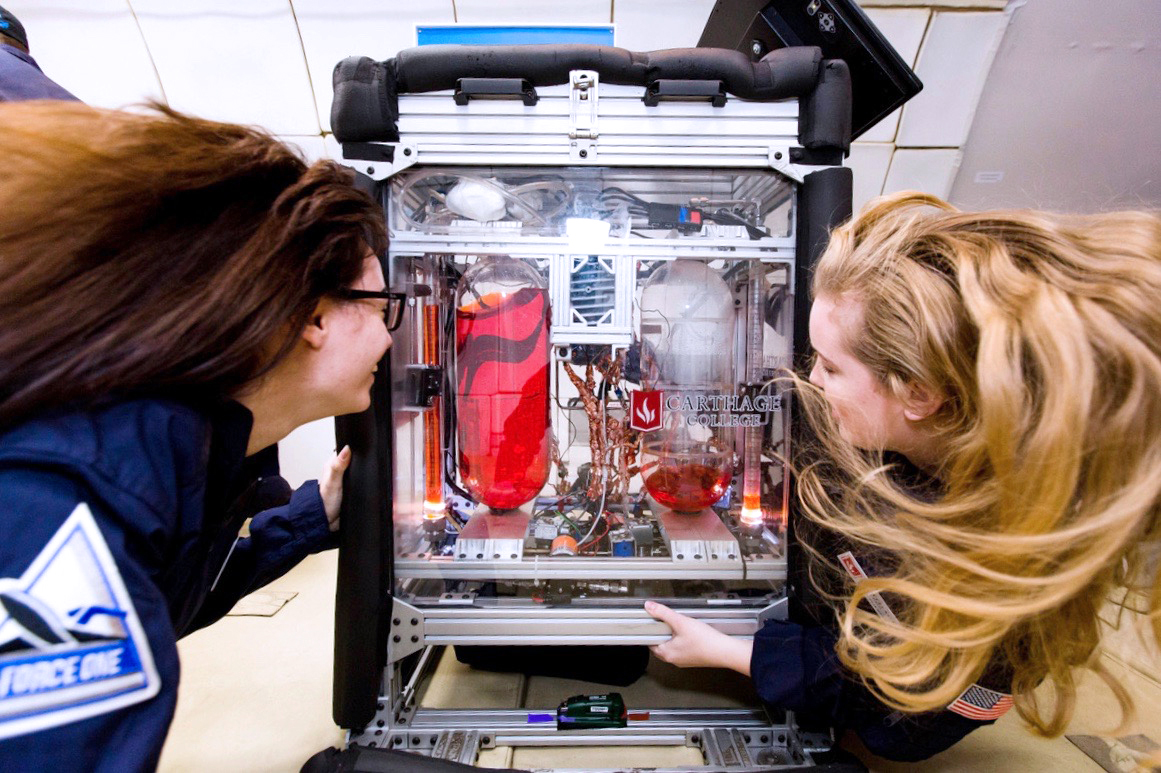
Mars to Table builds on NASA’s first Deep Space Food Challenge by seeking to integrate multiple food production and preparation methods into a holistic, self-sustaining system designed for use on Mars. This new challenge is open now until July 31 to the global public and carries a prize purse of up to $750,000.

“Future crews on the Moon and Mars will need food systems that are nutritious, sustainable, and fully independent from Earth,” said Jarah Meador, program executive for NASA’s Prizes, Challenges, and Crowdsourcing Program at NASA Headquarters. “Food will play a pivotal role in the overall health and happiness of future deep space explorers. The Mars to Table Challenge is about bringing all those pieces together into one comprehensive design.”

Solvers are tasked with creating a complete meal plan suitable for astronauts living on Mars, using a NASA-created mission scenario as their guide. Each team will design a full food system concept, including a detailed operations plan and system design layout that supports a surface mission. Teams must consider every detail – from nutritional balance and taste to safety, usability, and integration with NASA’s Environmental Control and Life Support Systems.

Participants in the Mars to Table Challenge are also encouraged to address food security on Earth. Innovative growth systems designed for space could make fresh food production possible in harsh, remote, or resource-limited areas, such as research stations located at Earth’s poles or in rural areas with limited access to traditional supply chains.

“This challenge isn’t just about feeding astronauts; it’s about feeding people anywhere,” said Jennifer Edmunson, acting program manager for NASA’s Centennial Challenges at NASA’s Marshall Spaceflight Center in Huntsville, Alabama. “Novel meals that are compact, shelf-stable, and nutrient-rich could expand culinary options for groups like military personnel or disaster relief responders. By solving for Mars and future planetary expeditions, we can also find solutions for Earth.”

NASA’s Centennial Challenges have a 20-year legacy of engaging the public to solve complex problems that benefit NASA’s broader initiatives. Past challenges have spurred advances in robotics, additive manufacturing, power and energy, textiles, chemistry, and biology.

Mars to Table is a collaborative, cross-program Centennial Challenge with support from NASA’s Division of Biological and Physical Sciences, Heliophysics Division, Planetary Science Program, Human Research Program, and Mars Campaign Office. Subject matter experts at the agency’s Johnson Space Center in Houston and Kennedy Space Center in Florida support the challenge. This challenge is part of the Prizes, Challenges and Crowdsourcing program within NASA’s Space Technology Mission Directorate. NASA has partnered with the Methuselah Foundation and contracted Floor23 Digital to support the administration and management of this challenge. 

To learn more about the challenge, including timelines, submission requirements, and future webinar dates, visit:

https://www.deepspacefood.org/marstotable

By Savannah Bullard

💾

NASA is launching the Deep Space Food Challenge: Mars to Table, a new global competition inviting chefs, innovators, culinary experts, higher-education stude...

NASA’s Carruthers Geocorona Observatory Reveals ‘First Light’ Images

3 min read

NASA’s Carruthers Geocorona Observatory Reveals ‘First Light’ Images

NASA’s Carruthers Geocorona Observatory has captured its first images from space, revealing rare views of Earth and the Moon in ultraviolet light. Taken on Nov. 17 — still months before the mission’s science phase begins — these “first light” images confirm the spacecraft is healthy while hinting at the incredible views to come.

The initial images consist of two from Carruthers’ Wide Field Imager and two from its Narrow Field Imager. Each imager captured two different views: one showing a broad spectrum of far ultraviolet light, and one revealing light from Earth’s geocorona.

Comparison of wide field and narrow field images from NASA's Carruthers Geocorona Observatory: Each column shows far ultraviolet and Lyman-alpha views of Earth, with brightness color scales, using wide and narrow field imagers.
These four images constitute the “first light” for the Carruthers Geocorona Observatory mission. The images were taken on Nov. 17, 2025, from a location near the Sun-Earth Lagrange point 1 by the spacecraft’s Wide Field Imager (left column) and Narrow Field Imager (right column) in far ultraviolet light (top row) and the specific wavelength of light emitted by atomic hydrogen known as Lyman-alpha (bottom row). Earth is the larger, bright circle near the middle of each image; the Moon is the smaller circle below and to the left of it. The fuzzy “halo” around Earth in the images in the bottom row is the geocorona: the ultraviolet light emitted by Earth’s exosphere, or outermost atmospheric layer. The lunar surface still shines in Lyman-alpha because its rocky surface reflects all wavelengths of sunlight — one reason it is important to compare Lyman-alpha images with the broad ultraviolet filter. The far ultraviolet light imagery from the Narrow Field Imagery also captured two background stars, whose surface temperatures must be approximately twice as hot as the our Sun’s to be so bright in this wavelength of light.
NASA/Carruthers Geocorona Observatory

When Carruthers captured these images, the Moon was also in its field of view and slightly closer to the spacecraft than Earth was, making the Moon appear larger and closer to Earth than usual.

The specific wavelength Carruthers observed in two of the images, called Lyman-alpha, is light emitted by atomic hydrogen. The faint glow of Lyman-alpha from hydrogen in Earth’s outer atmosphere is called the “geocorona,” Latin for “Earth crown.”

In the broad-spectrum images, the Moon and Earth look similar: both are spheres with well-defined edges. However, in the Lyman-alpha filter, the Moon still appears as a crisp, sharp sphere while Earth appears surrounded by a bright “fuzz” extending out to space. This glow is the geocorona, the primary focus of the Carruthers mission. It is the only way to “see” Earth’s outermost atmospheric layer, although the light of the geocorona has only been photographed a handful of times in history. Carruthers will be the first mission to image it repeatedly, and from far enough away to see its great extent and discover how it changes over time.

These first images also offer a rare treat: sunlight reflected off the far side of the Moon, a view impossible to capture from Earth.


Original
Annotated

An interactive slider image allowing the user to swipe between two versions of an image, one with annotations and one without. The image shows a spacecraft’s view of Earth (at center) and the Moon (lower left) in ultraviolet light. The image includes a circular heatmap with a bright yellow center (Earth) fading to green and blue at the edges, showing Earth’s geocorona. A smaller bright spot appears near the bottom edge (the Moon). A vertical color bar labeled

An interactive slider image allowing the user to swipe between two versions of an image, one with annotations and one without. The image shows a spacecraft’s view of Earth (at center) and the Moon (lower left) in ultraviolet light. The image includes a circular heatmap with a bright yellow center (Earth) fading to green and blue at the edges, showing Earth’s geocorona. A smaller bright spot appears near the bottom edge (the Moon). A vertical color bar labeled

An interactive slider image allowing the user to swipe between two versions of an image, one with annotations and one without. The image shows a spacecraft’s view of Earth (at center) and the Moon (lower left) in ultraviolet light. The image includes a circular heatmap with a bright yellow center (Earth) fading to green and blue at the edges, showing Earth’s geocorona. A smaller bright spot appears near the bottom edge (the Moon). A vertical color bar labeled

Original

Annotated

Carruthers Geocorona ObservatorY

A View of Earth’s Geocorona

Narrow Field Imager/Lyman-alpha filter


This view of the Earth, Moon, and Earth’s geocorona was captured by the Carruthers Geocorona Observatory’s Narrow Field Imager on Nov. 17, 2025. Move the slider to switch between the original version and one with overlaid annotations. In the annotated version, labels for Earth, the Moon, and Earth’s geocorona are overlaid on the image. The circle around Earth represents Earth’s surface, and the arc around Earth’s middle represents the orientation of Earth’s equator. The arrow pointing up and slightly to the left from Earth represents Earth’s rotational axis. The arrow pointing out to the right from Earth represents the direction to the Sun. The color scale indicates brightness, with brighter light appearing more yellow and dimmer light appearing more blue. The ‘glow’ that extends beyond Earth’s surface and out into space is Earth’s geocorona, which is emitted by hydrogen atoms in Earth’s exosphere in a wavelength of ultraviolet light known as Lyman-alpha.

These initial images were taken with short, five-minute exposures — just long enough to confirm that the instrument is performing well. During the main science phase, Carruthers will take 30-minute exposures, allowing it to reveal even fainter details of the geocorona and trace how Earth’s outer atmosphere responds to the changing Sun.

Carruthers launched on Sept. 24 and is just a few weeks from completing its journey to the Sun-Earth Lagrange point 1, a point of gravitational balance roughly 1 million miles closer to the Sun than Earth is. Carruthers will begin its primary science phase in March 2026, when it will begin sending back a steady stream of ultraviolet portraits of our planet’s ever-shifting outer atmosphere.

By Miles Hatfield
NASA’s Goddard Space Flight Center, Greenbelt, Md.

About the Author

Miles Hatfield

Miles Hatfield

Keep Exploring

Discover More Topics From NASA

NASA’s IMAP Mission Captures ‘First Light,’ Looks Back at Earth 

3 min read

NASA’s IMAP Mission Captures ‘First Light,’ Looks Back at Earth 

All 10 instruments aboard NASA’s newly launched IMAP (Interstellar Mapping and Acceleration Probe) mission have successfully recorded their first measurements in space. With these “first light” observations, the spacecraft is now collecting preliminary science data as it journeys to its observational post at Lagrange point 1 (L1), about 1 million miles from Earth toward the Sun. 

“We are extremely pleased with the initial in-flight performance of the IMAP mission. All instruments have successfully powered on and our commissioning remains on track. We have already collected useful data including exercising our near-real-time space weather data stream,” said Brad Williams, IMAP program executive at NASA Headquarters in Washington. “This successful milestone is quickly setting the stage for the start of our primary science operations.”

As a modern-day celestial cartographer, IMAP will chart the boundaries of the heliosphere — a huge bubble created by the Sun’s wind that encapsulates our entire solar system — and study how the heliosphere interacts with the local galactic neighborhood beyond.

To map the heliosphere’s boundaries, IMAP is equipped with three instruments that measure energetic neutral atoms: IMAP-Lo, IMAP-Hi, and IMAP-Ultra. These uncharged particles, called ENAs for short, are cosmic messengers formed at the heliosphere’s edge that allow scientists to study the boundary region and its variability from afar. 

An animated GIF shows a large oval that is initially filled with large rectangular pixels of different colors from dark blue, light blue, green, yellow, orange, red, and pink. The pixels change color rapidly. The oval then goes from filled to only having two large vertical bands of colored pixels and then two thinner vertical bands of pixels, with the rest of the oval becoming gray, with no data. At the center of the oval a white dot is labeled
These partial maps of the heliosphere’s boundaries were compiled from first-light data from the IMAP-Hi, IMAP-Lo, and IMAP-Ultra instruments. These initial looks offer a first glimpse at the detail NASA’s IMAP (Interstellar Mapping and Acceleration Probe) will be able to capture. The warmer colors show regions with more energetic neutral atoms (ENAs).
NASA

“It’s just astounding that within the first couple weeks of observations, we see such clear and consistent ENA data across the factor of 10,000 in energy covered collectively by the three imagers,” said David McComas, Princeton University professor and principal investigator for the IMAP mission. “This, plus excellent first light data from all seven of the other instruments, makes for a 10 out of 10, A-plus start to the mission.”

As IMAP travelled away from Earth, the IMAP-Ultra instrument looked back at the planet and picked up ENAs created by Earth’s magnetic environment. These terrestrially made ENAs, which overwhelm ENAs coming from the heliosphere in sheer numbers, is a reason why IMAP will be stationed at L1. There the spacecraft will have an unobstructed view of ENAs coming from the heliosphere’s boundaries.

An elongated, horizontal colorized map shows rectangular pixels of different colors, mostly blue and green but dominated by a large circular feature in red, orange, and yellow on the far left. The background is mostly blue but two large swatches of green appear near the top center and bottom center.
Earth’s magnetic environment can be seen glowing bright in this image taken by the IMAP-Ultra instrument, which includes ENA data as well as noise. Earth sits at the center of the red donut-shaped structure. This image was taken as IMAP left Earth for its post at Lagrange point 1.
NASA

The mission will also study the solar wind, a continuous flow of charged particles coming from the Sun. Solar wind observations from five of IMAP’s instruments will be used by the IMAP Active Link for Real-Time (I-ALiRT) system to provide roughly a half hour’s warning to voyaging astronauts and spacecraft near Earth about harmful space weather and radiation coming their way. The IMAP instruments are already making near-real-time solar wind measurements that can be used to support space weather forecasts. The I-ALiRT network is being exercised and will be ready for space weather forecasters when IMAP starts its regular science mission at L1.

With all of IMAP’s instruments up and running, the mission has nearly completed its commissioning stage and will arrive at L1 in early January. The mission is now working to complete the final commissioning steps and instrument calibration with the goal of being ready to take operational science data starting Saturday, Feb. 1, 2026. 

Here’s a look at IMAP’s instruments and what they’ve seen in their first-light observations.

A square image is mottled with black and blue pixels with an elongated oval-shaped feature in light blue, green, yellow, and orange at the bottom left. In the upper right is a smaller box around two smaller elongated streaks in green.
IMAP-Lo, IMAP-Hi, and IMAP-Ultra
The three ENA (energetic neutral atom) instruments, IMAP-Lo, IMAP-Hi, and IMAP-Ultra, will help construct maps of the boundaries of the heliosphere, which will advance our understanding of how the solar wind interacts with our local galaxy. The green streak in this image from IMAP-Hi shows the instrument’s ability to separate ENAs from other particles such as cosmic rays (green and yellow blob).
NASA
Four rectangular charts show graphs with blue lines that have small vertical variations on the left and middle but significantly large variations on the right.
MAG
The magnetometer instrument measures magnetic fields from the Sun that stretch across the solar system. Its first-light data clearly shows dynamic changes in the solar wind’s magnetic field due to a shockwave created by the solar wind (squiggles at right).
NASA
A graph shows lines in a rainbow of colors, from dark blue to green to yellow to red, each line with two peaks near the center.
SWAPI
The Solar Wind and Pickup Ions (SWAPI) instrument measures ions from the solar wind and charged particles from beyond the solar system. Initial data from SWAPI showed a change in the composition of the solar wind over one day. This image shows particles from a coronal mass ejection on Nov. 11 and 12, 2025.
NASA
A chart shows several blobs of color that are circled in black. They are labeled from top to bottom as Fe, Ne-Si, O, He, and H.
CoDICE
The Compact Dual Ion Composition Experiment (CoDICE) instrument measures ions from the solar wind and charged particles from beyond the solar system. It detected different types of oxygen, hydrogen, and helium atoms in its first-light data.
NASA
Scatter plot with logarithmic axes showing particle distributions labeled as Electrons, Hydrogen, Helium, Carbon, Nitrogen, Oxygen, Neon, Magnesium, Silicon, and Iron, with denser blue points at lower energies.
HIT
The High-energy Ion Telescope (HIT) measures energetic ions and electrons from the Sun. Early ion data shows the common elements up through iron.
NASA
A graph shows a black curved line with four peaks. The first peak on the left is labeled Comet C/2025 K1 (Atlas). The second peak is labeled alpha Leo. The third peak is labeled kappa Vel b01Car iCar. The fourth, much taller peak on the far right has no label. The vertical axis is labeled photon flux and the horizontal axis is labeled spin angle.
GLOWS
Unlike other IMAP instruments that study particles, the GLObal Solar Wind Structure (GLOWS) instrument images ultraviolet light called the helioglow that is created in part by the solar wind. The first data taken with GLOWS showed helioglow and bright stars, matching scientists’ expectations for the instrument. Unexpectedly, the signature of comet C/2025 K1 (ATLAS), shown by the first small bump from the left in the image, was also seen before it disappeared from GLOWS’ view.
NASA
A rectangular chart shows bands of colors from red at the bottom to yellow, green, blue, and purple at the top. On the right side of the image, the red and yellow extend vertically upward into the yellow and green bands. The vertical axis is labeled Energy and the horizontal axis is labeled with the dates October 11, October 12, and October 13 from left to right.
SWE
As its name suggests, the Solar Wind Electron (SWE) instrument measures electrons from the solar wind. In its first data collection, SWE successfully captured electrons at a range of energy levels. On Nov. 12, a solar storm passed through the solar system and SWE captured the resulting spike in the number of electrons at each energy level.
NASA
A graph shows a blue line with several spikes labeled with different atoms. From left to right the peaks are labeled C, O, Mg, Si, and H2S. The vertical axis is labeled Signal, while the horizontal axis is labeled Mass.
IDEX
The Interstellar Dust Experiment (IDEX) measures cosmic dust — conglomerations of particles originating outside of the solar system that are smaller than a grain of sand. Prior to IMAP, few of these dust particles had been measured. With two new detections already completed, IDEX has demonstrated its ability to become an unrivaled dust detector. This observation of one of the dust particles shows tentative identifications of the particle’s chemical composition, which includes carbon, oxygen, magnesium, silicon, and hydrogen sulfide.
NASA

By Mara Johnson-Groh
NASA’s Goddard Space Flight Center, Greenbelt, Md.

❌