Reading view

There are new articles available, click to refresh the page.

Institutional-Scale Ethereum Lockup: Bitmine Crosses 1.94M ETH Staked Mark

Ethereum has slipped below the critical $3,000 level, adding fresh pressure to a market that is already showing clear signs of hesitation. After weeks of choppy price action, ETH is now entering a more fragile phase where failed recoveries are starting to shift sentiment. With sellers gaining control and bullish momentum fading, several analysts are warning that this breakdown could open the door for a deeper correction if demand does not return quickly.

The timing is important. Ethereum is moving through a pivotal zone where short-term price direction could shape the broader narrative for 2026. If ETH continues to trade below $3,000 and lower support levels fail to hold, the market may transition into a prolonged risk-off regime. On the other hand, a fast recovery back above this psychological threshold could signal that the breakdown was only a liquidity sweep, setting up a rebound toward higher resistance.

Despite a weakening price structure, on-chain activity suggests large players remain active. Market data shows that Bitmine staked another 171,264 ETH, worth roughly $503.2 million, just a few hours ago. The move adds to the firm’s growing exposure and reinforces the idea that institutional-scale actors are still positioning aggressively, even as Ethereum faces one of its most decisive moments of the year.

Bitmine Ethereum Transfers | Source: Arkham

Bitmine’s ETH Staking Signals Long-Term Conviction Despite Short-Term Weakness

According to data from Arkham, Bitmine has now staked a total of 1,943,200 ETH, worth roughly $5.71 billion, marking one of the most aggressive Ethereum accumulation and yield-positioning moves currently visible on-chain.

Staking at this scale removes a significant amount of ETH from liquid circulation, effectively shifting supply away from exchanges and into long-term validator positions. In practical terms, it suggests Bitmine is not positioning for a short-term flip, but rather treating Ethereum as a strategic asset that can generate native yield while potentially appreciating over time.

This activity stands out because it is happening while Ethereum is under pressure after losing the $3,000 level. At the moment, the market is stuck in a fragile, risk-sensitive phase, where traders are reacting quickly to breakdowns and failed recoveries. Momentum has weakened, liquidity remains thin, and analysts are increasingly warning that a deeper correction could unfold if key supports continue to fail.

However, Bitmine’s staking expansion provides a counter-signal: large players appear willing to keep committing capital even as sentiment deteriorates. That divergence highlights the current split in the market—short-term participants are defensive, while longer-term allocators are still building exposure. If price stabilizes, this kind of staking-driven supply reduction can become a structural tailwind.

Ethereum Downtrend Pressure Builds

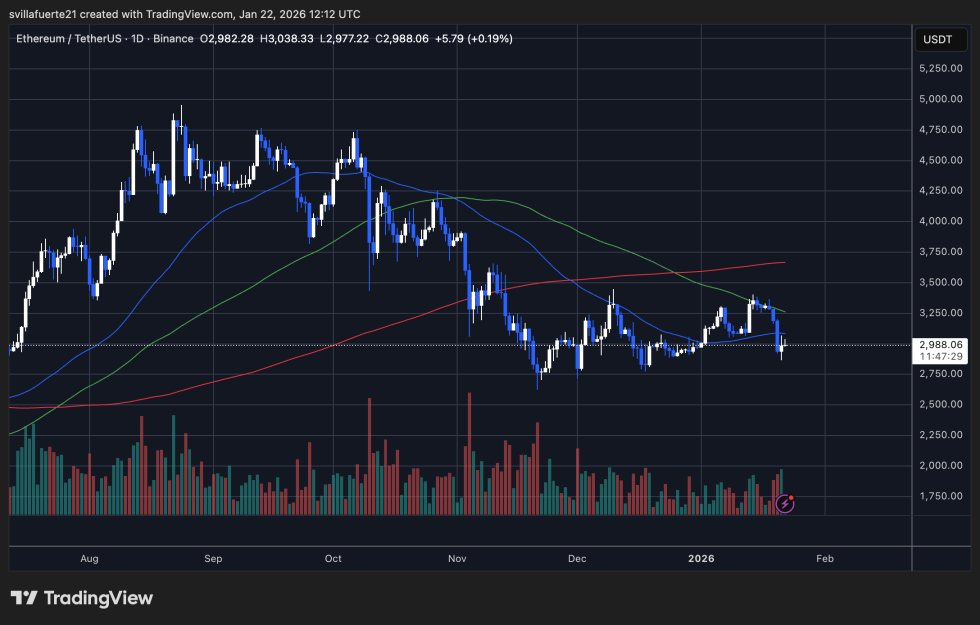
Ethereum is trading near $2,940 after losing the key $3,000 psychological level, putting the market back into a fragile position. The chart shows ETH has been trending lower since the October peak, with a clear sequence of lower highs and heavy sell-side volatility that accelerated into November. Although ETH managed to stabilize into a broad consolidation range between roughly $2,850 and $3,250, the most recent breakdown suggests buyers are struggling to defend support when momentum fades.

ETH testing key support | Source: ETHUSDT chart on TradingView

From a trend perspective, Ethereum remains capped beneath its major moving averages. Price is trading below the green long-term average and the blue mid-term average, both of which are sloping downward and acting as dynamic resistance.

The recent rebound attempt toward the $3,300–$3,400 zone failed right under the green line, reinforcing that sellers are still controlling rallies. Meanwhile, the red long-term average sits higher near the mid-$3,000s, highlighting that ETH remains far from reclaiming a macro bullish structure.

Volume has increased on the sharp red candles compared to the slower grind higher, which often signals distribution rather than healthy accumulation. If ETH cannot reclaim $3,000 quickly, downside risk opens toward the $2,850 range floor. A clean recovery back above $3,150–$3,250 would be needed to reduce bearish pressure and reset the near-term trend.

Featured image from ChatGPT, chart from TradingView.com 

Ethereum Approaches A “Never Broken” Support Line: Accumulators Step In

Ethereum is once again under pressure as it struggles to regain solid ground around the $3,000 level, reflecting a broader wave of uncertainty across the crypto market. With sentiment turning increasingly fragile, many altcoins remain stuck in corrective mode, and bulls are now forced to defend key support zones to prevent deeper downside. In this environment, Ethereum’s ability to push higher is becoming a critical signal for whether the market can stabilize or if the current bearish trend will extend.

Despite the weakness, on-chain data suggests that ETH may be nearing an important turning point. According to CryptoQuant, Ethereum is approaching a major support line that has historically acted as a strong floor during periods of heavy volatility.

The report highlights that the realized price of Ethereum accumulation addresses continues to climb and is now approaching the current market price, indicating that long-term accumulation remains active even as short-term traders hesitate.

This dynamic matters because accumulation-based cost levels often represent zones where large investors defend their positions aggressively. If ETH holds above this rising support range, the market may be setting the foundation for a broader recovery.

Ethereum Whale Cost Basis Signals a Potential Bottom Zone

CryptoQuant’s report suggests Ethereum may be approaching one of its most important structural support zones, anchored by the realized price of accumulation addresses. This metric tracks the average on-chain cost basis of entities that consistently accumulate ETH, and it often behaves as a “defense line” for whales who build long-term positions.

According to the analysis, this realized price level has historically acted as a reliable floor, with Ethereum never breaking below this range during prior drawdowns, even when broader market conditions turned sharply risk-off.

That historical behavior matters because it implies that accumulation whales tend to protect their cost basis aggressively, either by adding exposure near support or by reducing sell pressure when the price approaches their entry zone. In practice, this can limit downside momentum and create a stabilization area where volatility compresses before the next trend decision.

Ethereum Realized Price For Accumulation Addresses | Source: CryptoQuant

Based on the current trajectory, the report argues that even if ETH sees another leg down, the most probable “bottom zone” sits near $2,720. From current levels, that would represent an additional pullback of roughly 7%, keeping the move within a controlled correction rather than a full breakdown. If buyers defend this area, Ethereum could begin rebuilding a base for a renewed push back above $3,000.

ETH Price Slips Back Toward $3,000 As Bulls Struggle To Reclaim Control

Ethereum (ETH) continues to trade under heavy pressure as price struggles to stabilize around the $3,000 zone. The chart shows ETH printing another sharp rejection after failing to hold the recent rebound, reinforcing that the market remains in a corrective phase rather than a clean recovery. Even though buyers are attempting to defend current levels, momentum still looks weak, with each bounce being met by renewed selling.

ETH consolidates in a pivotal demand level | Source: ETHUSDT chart on TradingView

From a technical perspective, ETH is trading below its key moving averages, which highlights how resistance continues to stack above the price. The broader structure suggests a downtrend that is transitioning into consolidation, but without a confirmed breakout, the risk remains tilted to the downside.

The recent push toward the mid-$3,200 region failed to flip that zone into support, and the pullback toward $2,980 signals that bulls are still struggling to build sustainable demand.

Volume remains relatively muted compared to the larger selloffs seen earlier in the cycle, which supports the idea that this is a grinding distribution phase rather than full panic capitulation. For a bullish shift, ETH needs to reclaim $3,200–$3,300 and hold above it. Until then, the $2,900–$3,000 area remains the key line of defense.

Featured image from ChatGPT, chart from TradingView.com 

Ethereum Supply Tightens On Binance As Reserves Hit Lowest Level Since 2016

Ethereum has slipped below the $3,000 level again as selling pressure returns across the broader crypto market, keeping bulls on the defensive after a brief recovery attempt. The move back under this psychological zone suggests that traders remain cautious, with downside volatility re-emerging as risk appetite fades and liquidity thins near key support levels.

However, while price action looks heavy in the short term, on-chain data is flashing a different signal beneath the surface. According to Arab Chain, Ethereum reserves held across centralized exchanges have dropped to around 16.2 million ETH, marking their lowest level since 2016. That milestone matters because it highlights a steady, long-duration trend of withdrawals rather than a sudden one-off event.

In practical terms, fewer coins sitting on exchanges typically means less immediate supply available for spot selling, especially during periods of market stress. This behavior can reflect a shift away from short-term trading and toward longer-term holding, self-custody, or deployment in DeFi.

Ethereum remains vulnerable as price struggles below $3,000. Still, the persistent reserve decline suggests that supply conditions may be tightening in the background, setting the stage for a sharper reaction if demand returns.

Binance Reserves Keep Falling

The CryptoQuant analysis also points to a similar reserve drawdown on Binance, reinforcing the broader exchange supply contraction narrative. Since the beginning of 2026, Binance’s Ethereum reserves have dropped from roughly 4.168 million ETH to around 4.0 million ETH, signaling steady withdrawals even as the price remains under pressure. This matters because Binance is often the main liquidity hub for ETH spot and derivatives, so shifts in its reserve balance can reflect real changes in market positioning.

Ethereum Exchange Reserve Binance | Source: CryptoQuant

What stands out is that this decline is happening without a meaningful rebound in inflows. In other words, ETH is not rotating back onto exchanges aggressively, suggesting sellers are not rushing to increase liquid supply at current levels. That dynamic typically aligns with a market where investors prefer holding behavior over active distribution. Either moving ETH to cold storage or deploying it across DeFi.

While reserves falling does not guarantee an immediate rally, it can change the supply-demand equation over time. With fewer coins sitting on exchanges, the market becomes more reactive if demand returns suddenly, as there is less readily available ETH to absorb buy pressure.

If Ethereum manages to reclaim key resistance levels, this supply tightening could amplify upside follow-through.

Ethereum Loses $3,000 as Bears Regain Control

Ethereum is showing renewed weakness after failing to hold above the key $3,000 level, with price now hovering near $2,970 on the daily chart. After briefly stabilizing earlier this month, ETH attempted a rebound toward the $3,300–$3,400 supply zone. But momentum faded quickly as sellers stepped back in and pushed the market lower.

ETH testing critical support | Source: ETHUSDT chart on TradingView

From a technical perspective, Ethereum remains trapped below its major moving averages, reinforcing the bearish structure. The recent rejection near the descending trend of the 200-day average signals that upside attempts are still being capped by overhead resistance. Keeping bulls on the defensive. At the same time, the breakdown below $3,000 shifts market sentiment back into risk-off mode. Especially as crypto traders remain sensitive to broader macro uncertainty.

The current price action also reflects a fragile recovery attempt rather than a confirmed reversal. ETH’s latest drop places focus on the $2,850–$2,900 region as the next support area. An area where buyers previously stepped in during earlier selloffs. If this zone fails to hold, the market could revisit deeper levels from the previous correction phase.

For bulls to regain control, Ethereum must reclaim $3,000 quickly and build stronger demand above that threshold.

Binance Order Flow Suggests Ethereum Is In Correction Mode: Demand Still Missing

Ethereum is trying to stabilize above the $3,100 level after failing to break the $3,400 resistance, as the broader crypto market struggles to recover momentum. While bulls managed to defend key support in recent sessions, price action remains fragile and highly reactive, with sellers still showing up on rallies. ETH is stuck in a tight range, and traders are watching closely to see whether this pullback turns into a deeper correction or simply a reset before the next move higher.

A report from Arab Chain highlights that Binance data is signaling a sensitive phase for Ethereum at the start of 2026. According to the analysis, ETH is trading near the $3,200 zone, but market flow conditions remain tilted to the downside.

The Accumulated Order Flow (CVD) indicator sits at approximately -3,676, suggesting that net selling pressure is still dominating short-term activity. In simple terms, more aggressive sell orders are hitting the market than buy orders, even as price attempts to hold recent levels.

This divergence between price stabilization and negative flow reflects a market that is not collapsing, but also not attracting strong demand yet. As Ethereum defends support, the next test will be whether buyers can reclaim $3,300 and challenge the $3,400 ceiling again, or if weakness drags price back toward deeper support zones.

Ethereum Holds Despite Negative Binance Order Flow

Arab Chain notes that even though Ethereum’s CVD remains negative, the relationship between price and liquidity flows is not fully broken. According to the report, the 30-day correlation between ETH price and CVD sits near 0.62, which is a relatively constructive reading. This pattern suggests that price action partially aligns with volume behavior, even though liquidity currently tilts toward selling rather than fresh buying.

In other words, Ethereum is not trading in a vacuum—flows still matter—and the market is reacting in a way that reflects real positioning.

Binance ETH CVD Momentum & Price Correlation | Source: CryptoQuant

From a broader perspective, ETH’s gradual decline to its current levels signals a correction phase following its previous upside surge. Historically, this is the type of environment where short-term investors take profits and reduce exposure, while larger players begin to rebalance portfolios and slowly rebuild positions. Instead of an immediate trend reversal, the market often transitions into sideways price action as both sides test liquidity.

The key issue is that CVD remains negative, meaning demand has not yet become strong enough to flip the short-term flow structure. However, Ethereum’s ability to hold above the $3,000 level points to underlying support that is limiting downside acceleration.

This mismatch—weak momentum in volume flows but stable price behavior—often precedes quieter consolidation periods that can later set the foundation for stronger upside once liquidity conditions improve.

EETH Bulls Fight to Reclaim $3,100

Ethereum is trying to stabilize above the $3,100 level after a sharp rejection from the $3,400 supply zone, with price now trading near $3,111. The chart shows ETH still recovering from the broader downtrend that started after the November breakdown, but the structure remains fragile as sellers continue defending every attempt to push higher.

ETH testing key MA | Source: ETHUSDT chart on TradingView

From a technical perspective, the $3,300–$3,400 region stands out as the key resistance cluster. Price has repeatedly failed in this area, and the latest rejection confirms it remains a major distribution level. At the same time, Ethereum is holding above its short-term moving average near $3,050–$3,100. Suggesting buyers are still active, defending the current range.

However, ETH remains capped below the mid-term moving averages, which are trending lower and acting as dynamic resistance. This keeps the market in a “recovery inside a downtrend” setup unless bulls can flip those levels back into support. Volume has also remained relatively muted during the rebound, signaling that the move still lacks aggressive follow-through.

Ethereum appears stuck in consolidation. With $3,000 as the critical floor and $3,400 as the breakout trigger needed to shift market sentiment.

Featured image from ChatGPT, chart from TradingView.com 

Ethereum Exchange Outflows Signal Supply Is Stepping Back

Ethereum is struggling to push above critical supply levels after a brief surge above $3,300, as the market attempts to stabilize following weeks of sustained selling pressure. While the rebound has sparked renewed optimism, price action remains fragile, with bulls still needing clear confirmation before a broader recovery can take hold. Still, the fact that ETH is holding near key levels has led some analysts to start calling for higher prices, arguing that the market may be entering a new phase after the recent downtrend.

Supporting this view, a CryptoQuant analyst highlighted Ethereum Exchange Netflow spot data showing persistent ETH outflows from spot exchanges during price pullbacks, while inflows during upward moves remain relatively limited. This pattern suggests a more disciplined supply environment, where holders are reluctant to sell into weakness and are not aggressively distributing during rallies.

In other words, sell-side pressure appears to be easing, even as Ethereum remains capped below major resistance. If demand returns, this type of netflow structure can support sharper upside moves, as fewer coins are available on exchanges to meet new buying interest. For now, Ethereum is caught between fading fear and unfinished recovery, with the next breakout attempt likely to define the short-term trend.

ETH Supply Tightens As Exchange Outflows Persist

Ethereum’s recent Exchange Netflow behavior suggests that the latest pullbacks have been met with holding and accumulation rather than broad-based distribution. Instead of rushing to send ETH onto exchanges during weakness, many participants appear willing to sit through volatility, reducing the immediate sell pressure that typically accelerates downtrends. This supports the idea that supply is gradually stepping back, even as price remains capped below key resistance zones and market sentiment stays cautious.

Ethereum Exchange Netflow | Source: CryptoQuant

However, Exchange Netflow alone is not enough to define direction. A favorable supply structure can still fail if demand remains weak, or if macro conditions deteriorate and force investors back into risk-off positioning. In that scenario, downside continuation cannot be ruled out, even if exchange balances remain constrained.

That said, in the absence of major systemic stress, the current netflow profile offers a constructive backdrop for upside. The lack of supply expansion during drawdowns and the restrained profit-taking during rebounds imply that sellers are not in control. If demand rotates back into Ethereum, price could respond more efficiently because there is less readily available liquidity sitting on exchanges.

In this sense, the on-chain data is not signaling an immediate breakout. Instead, it highlights a market structure that appears increasingly prepared for upward price action once broader conditions align and buyers regain conviction.

Ethereum Bulls Fight Structural Resistance

Ethereum is attempting to stabilize above the $3,300 zone after a sharp rebound from the December lows, but the chart shows bulls are still battling heavy overhead supply. Price recently pushed into the $3,300–$3,400 band, a level that has repeatedly acted as a pivot point during this downtrend. While momentum has improved, ETH is still trading below key moving averages, reinforcing the idea that this move may be more of a recovery leg than a confirmed reversal.

ETH testing critical resistance | Source: ETHUSDT chart on TradingView

The blue moving average overhead continues to slope downward and sits above current price, highlighting that the broader structure remains pressured. At the same time, the green moving average is flattening near the $3,300 area, adding to the resistance cluster and making this zone difficult to reclaim cleanly.

From a market structure perspective, ETH has shifted from a clear downtrend into a tighter consolidation, with buyers stepping in on dips and building higher lows since early January. However, volume remains relatively muted compared to the October and November selloffs, suggesting that conviction is still developing.

Featured image from ChatGPT, chart from TradingView.com 

Bitmine Deepens Ethereum Bet With $514M ETH Staking Move – Staking Exposure Reaches $5.6B

Ethereum has reclaimed the $3,300 level after weeks of choppy and uncertain price action, offering bulls a brief sense of relief. However, upside momentum remains fragile, as buyers continue to struggle against the $3,400 zone, a level that has repeatedly capped recent advances. This area now stands as a clear short-term inflection point, separating a potential recovery phase from what some analysts still describe as a broader bearish structure.

Market participants remain divided. On one side, skeptics argue that the latest rebound resembles a classic relief rally, driven by short covering and temporary sentiment improvement rather than a genuine shift in trend.

From this perspective, Ethereum may still be vulnerable to renewed downside if macro conditions tighten or risk appetite fades. On the other side, more constructive analysts believe the stabilization above $3,300 could mark the early stages of a recovery, with higher levels coming into focus if resistance is convincingly reclaimed.

Adding complexity to the narrative, on-chain developments continue to draw attention. Just a few hours ago, Bitmine staked an additional 154,304 ETH, worth roughly $514 million, signaling sustained confidence from large players despite market uncertainty. As price compresses below resistance, Ethereum now sits at a critical juncture where conviction from both bulls and bears is being tested.

Bitmine Ethereum Transfers | Source: Arkham

Bitmine’s Growing Staking Footprint Signals Long-Term Conviction

According to data reported by Lookonchain, Bitmine’s Ethereum exposure has reached a notable scale. In total, the firm has now staked approximately 1,685,088 ETH, valued at around $5.62 billion at current prices. This places Bitmine among the largest single staking participants in the Ethereum ecosystem, underscoring the growing role of institutional and quasi-institutional actors in securing the network.

What makes this positioning particularly relevant is Bitmine’s overall balance. The company reportedly holds about 2.133 million ETH in total, meaning that close to 80% of its Ether reserves are actively staked rather than sitting idle. This allocation suggests a long-term, yield-oriented strategy rather than a short-term trading approach. By committing such a large portion of its holdings to staking, Bitmine is effectively signaling confidence in Ethereum’s medium- to long-term outlook, despite ongoing price volatility and macro uncertainty.

From a market perspective, large-scale staking reduces the amount of ETH that is readily liquid and available for sale. While this does not eliminate selling pressure entirely, it can contribute to a tighter circulating supply during periods of demand recovery.

At the same time, concentrated staking activity highlights how network security and yield generation are increasingly influenced by large holders. As Ethereum trades near key resistance levels, Bitmine’s positioning reinforces the narrative that some major players remain structurally committed, even as short-term price direction remains contested.

Ethereum Tests Key Weekly Resistance

Ethereum’s price action on the weekly chart shows a market attempting to stabilize after a volatile multi-year cycle. ETH has reclaimed the $3,300 area and is now trading just below a clearly defined resistance zone near $3,400. This level has repeatedly capped upside during prior rallies, making it a critical area for bulls to reclaim with conviction.

ETH consolidates around critical liquidity level | Source: ETHUSDT chart on TradingView

From a trend perspective, Ethereum remains above its long-term moving averages, including the 200-week line, which continues to slope upward. This suggests that despite recent drawdowns, the broader structural uptrend has not been invalidated. However, price is still trading below the previous cycle highs near $4,200–$4,400, highlighting that ETH is in a recovery phase rather than a confirmed breakout.

Momentum has improved compared to late 2025, with higher lows forming after the sharp sell-off toward the $1,600–$1,800 region. Volume during the rebound has been moderate, signaling participation without clear signs of speculative excess. This supports the idea of controlled accumulation rather than euphoric chasing.

Still, the inability to cleanly break above $3,400 keeps downside risk relevant. A rejection here could lead to renewed consolidation toward the $2,800–$3,000 zone. For bullish continuation, ETH needs a sustained weekly close above resistance, which would shift market structure and open the path toward higher liquidity zones above $3,800.

Featured image from ChatGPT, chart from TradingView.com 

Ethereum Open Interest Breaks October 9 Threshold: Traders Return Post-Shakeout

Ethereum is showing tentative signs of relief after weeks of downside pressure, but the recovery remains fragile. The price is currently struggling to push decisively above the $3,400 level, a zone that has repeatedly acted as resistance during recent attempts to rebound. While short-term sentiment has improved alongside broader market stabilization, risks remain elevated. Several analysts warn that Ethereum could still face further declines in the coming weeks if momentum fades and macro or liquidity conditions deteriorate again.

Adding complexity to the picture, derivatives data suggest a renewed buildup of risk. A report from Arab Chain highlights that Ethereum’s open interest on Binance has climbed to approximately $8.6 billion, its highest level since October 9.

Ethereum Open Interest | Source: CryptoQuant

This marks a notable shift after a prolonged period of contraction following the sharp liquidation event in October, when open interest collapsed from above $10 billion to below $7 billion in a matter of days. That episode flushed excessive leverage from the market and forced traders into a defensive stance.

The current rise in open interest signals that traders are gradually returning and rebuilding positions at lower price levels. However, this also increases the price’s sensitivity to sudden moves.

Ethereum Derivatives Activity Rebuilds Confidence

Ethereum is currently testing a key structural resistance zone around $3,400, and the latest derivatives data adds important context to this price behavior. According to the CryptoQuant report by Arab Chain, the rise in open interest on Binance reflects renewed activity in the derivatives market and a clear return of traders’ appetite for leverage. This is a notable shift from the defensive posture seen after the October liquidation wave.

What stands out is that this increase in open interest is occurring while ETH trades near the $3,300–$3,400 area, well below its previous cycle highs. This suggests that traders are not chasing price at extremes, but instead building positions at relatively discounted levels. Historically, this type of positioning often reflects expectations of a medium-term upside move rather than short-term speculation.

At the same time, the fact that open interest has reached its highest level since October 9 without returning to prior overheated extremes points to a more balanced recovery. If this growth is driven by steady inflows rather than aggressive leverage, it supports the idea of a healthier market structure forming after the post-liquidation contraction phase.

However, risks remain asymmetric near resistance. A continued and rapid expansion in open interest while price stalls below $3,400 could increase vulnerability to sharp volatility. For Ethereum to sustain momentum, price and open interest must remain aligned, confirming that confidence is rebuilding rather than overstretching.

Price Faces Key Resistance Level

Ethereum price action on the daily chart shows a market attempting to recover, but still constrained by heavy structural resistance near the $3,400 region. After a sharp decline from the October highs, ETH established a local bottom below $2,900 and has since been forming higher lows, suggesting short-term stabilization rather than a confirmed trend reversal.

ETH trying to push above resistance | Source: ETHUSDT chart on TradingView

Price is currently trading near $3,300, where multiple technical factors converge. The descending 200-day moving average and prior horizontal support-turned-resistance are capping upside momentum. Each rally into this zone has met selling pressure, highlighting that this area remains a critical supply region. The inability to reclaim $3,400 decisively keeps the broader structure neutral-to-bearish.

On the downside, the rising short-term moving average and recent higher lows around $3,000–$3,050 provide initial support. As long as ETH holds above this range, the market maintains a constructive consolidation structure rather than resuming the prior impulsive downtrend. Volume has remained moderate during the recovery, indicating controlled participation rather than aggressive speculative buying.

ETH is compressing between rising short-term support and declining long-term resistance. This type of price behavior often precedes a directional move. A clean daily close above $3,400 would signal a shift in market control and open the door for a broader recovery.

Featured image from ChatGPT, chart from TradingView.com 

❌