Reading view

There are new articles available, click to refresh the page.

XRP At ‘Critical Inflection Point’: Analyst Signals Major Expansion If This Level Holds

As XRP attempts to climb to higher levels, an analyst affirmed that the altcoin is “doing what it needs to do” to continue its bullish rally, highlighting multiple key structures in key timeframes.

XRP Enters Inflection Point

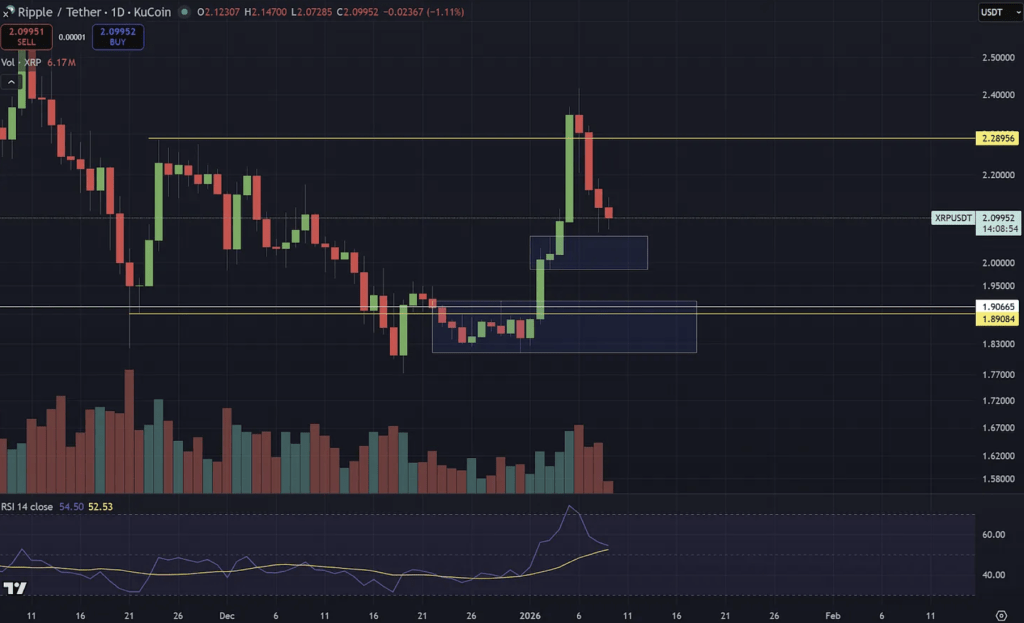
After retesting the $1.90 area on Friday morning, XRP saw a 4.6% intraday bounce toward the mid-zone of its local range. Over the past five days, the cryptocurrency has been hovering in the $1.85-$2.00 price range, failing to hold the upper zone of this range.

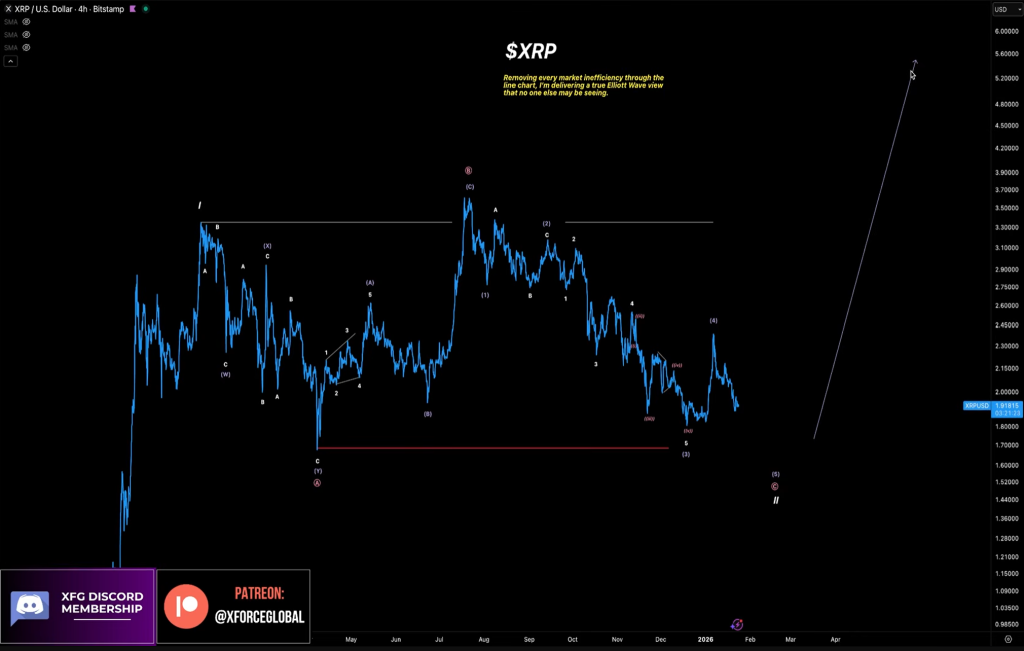
Market watcher ChartNerd pointed out a key reversal pattern that could signal a massive price expansion may be around the corner, noting that the altcoin is at a “critical inflection point” as it retests a macro support zone.

He explained that a running flat ABC correction formation is “a sophisticated structure where the failure of the ‘C’ wave to breach previous lows signals underlying bullish strength.”

XRP has been mirroring the same structure over the past 400 days, which would point “toward a structural breakout, marking the transition from a yearly long base into a new primary uptrend” if it resolves.

xrp

As the chart shows, “the wave counts repeating toward the structure are evident in XRP’s price action,” and as long as the macro support holds, around the $1.80 area, the C wave “could be working in the bulls’ defense.”

We could be just building a base above $1.80, marking the C wave in this running flat correction before the major breakout.

ChartNerd added that there could be a scenario in which XRP deviates below its major support before a V-shape recovery. However, he warned that losing this area would not be healthy, detailing that the only way to invalidate the pattern would be for the price to close below the structure’s support, retest it as resistance, and drop to lower levels.

XRP’s Price Defends Macro Support

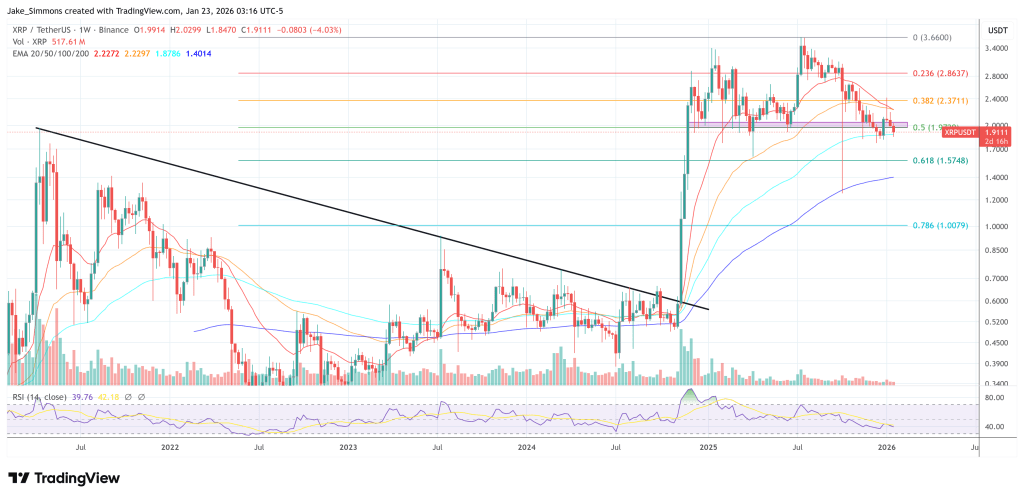
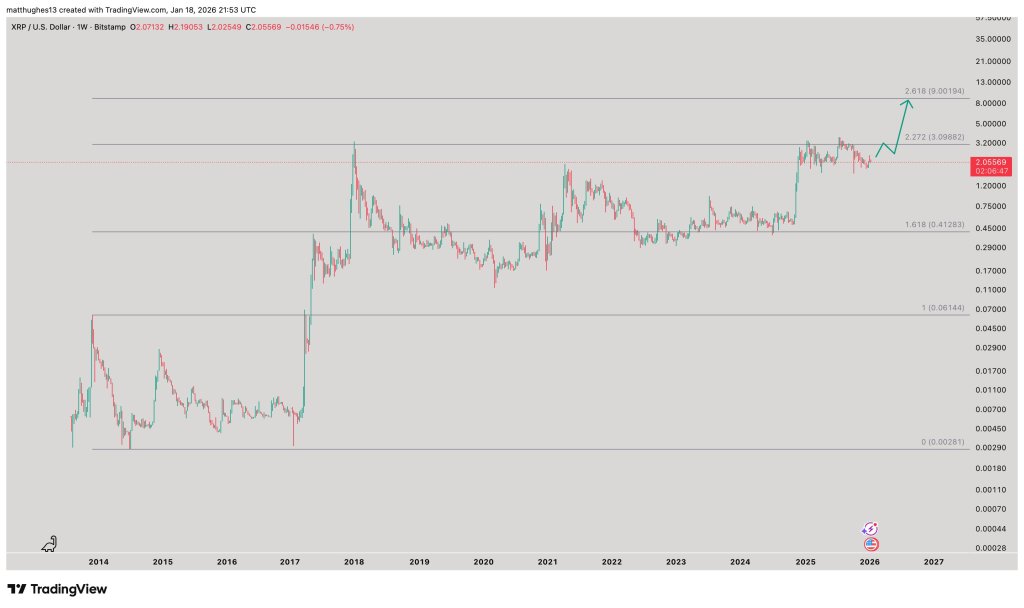
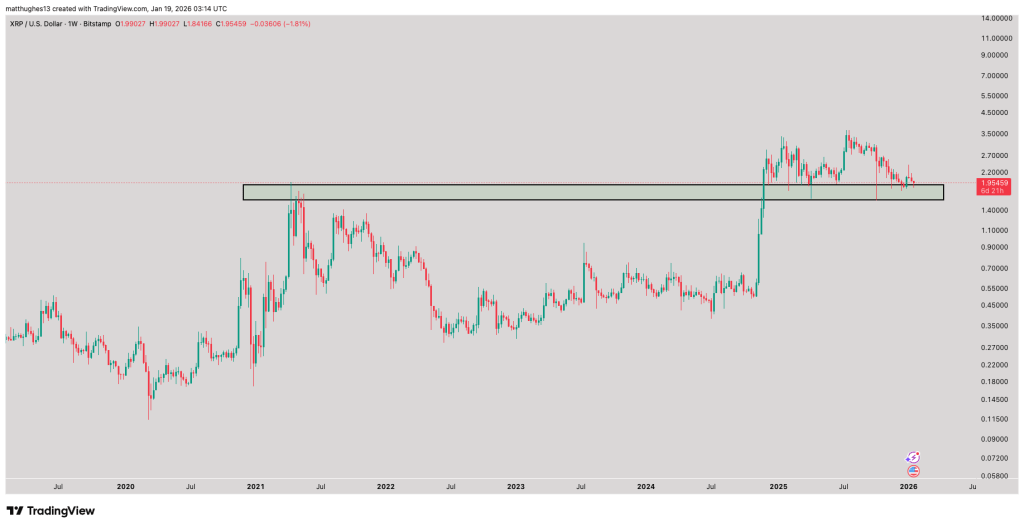
The analyst emphasized the importance of the $1.80 level, noting that XRP has been defending this territory for over a year and could lead to a new all-time high (ATH) rally.

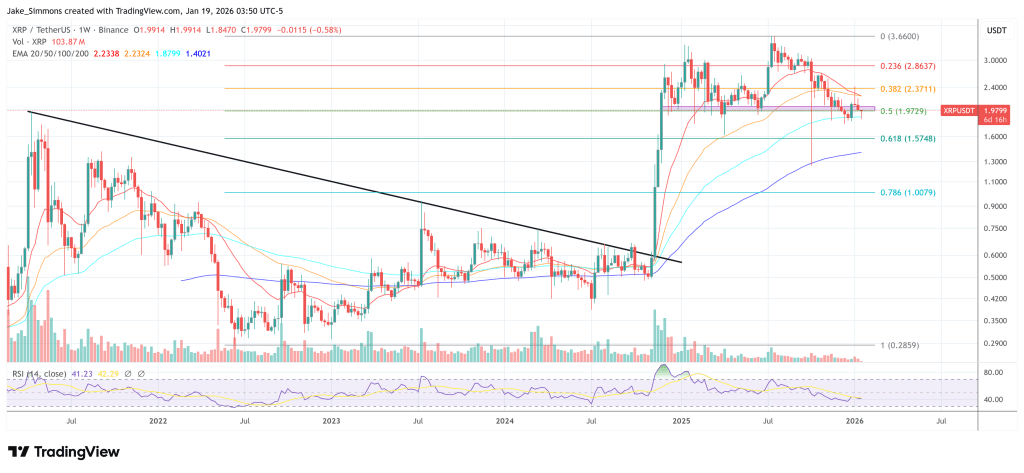
“This is a macro accumulation zone, and we evidently also have two major levels of descending resistance for XRP,” he detailed, highlighting that when the first multi-month descending resistance broke, the altcoin rallied to a new all-time high.

It’s pretty simple: we have descending resistance on our heads at the moment, and we once had a point of contact on this resistance at the $2.40 high (…) So, at this moment in time, the simplicity tells us: break the descending resistance, and this is where XRP really starts gearing up for further expansion.

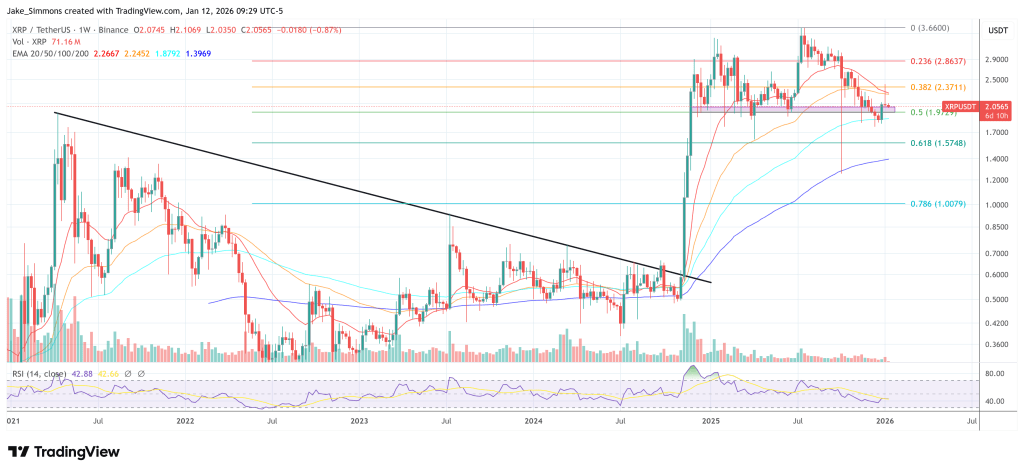
Based on this, ChartNerd asserted that if the altcoin defends the $1.80 macro support, then a similar rally is likely. Similarly, he pointed to a bullish reversal structure building below the key $2.70 resistance on XRP’s chart.

Per the post, the cryptocurrency formed a three-month falling wedge pattern that was broken out of during the early January rally. Now, the price is retesting the pattern’s breakout level as support and could be preparing to climb toward the level it started forming.

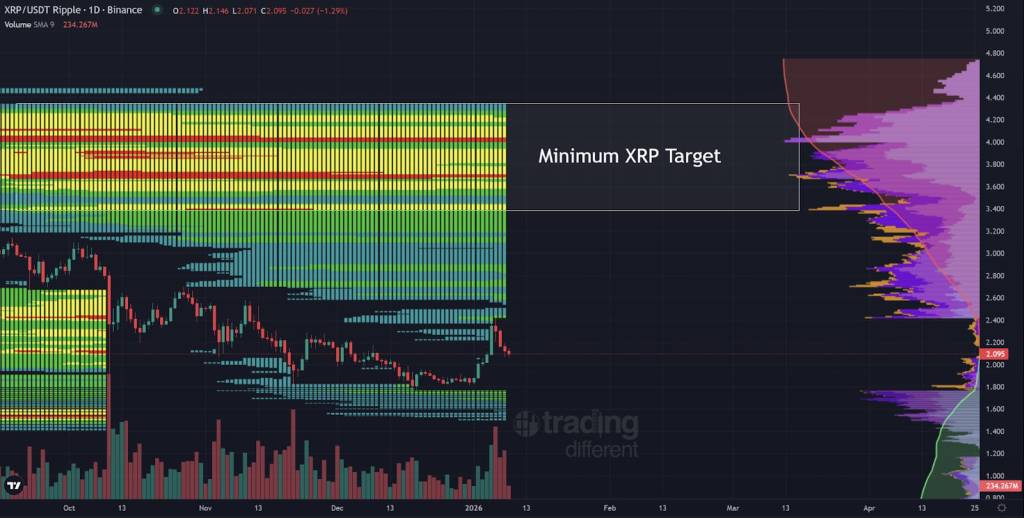
“So XRP just needs to defend the guard at $1.80, and this is where we could be looking for that sort of major expansion and looking to press back up to the target of $2.70,” before potentially challenging its pre-Q4 range, he concluded.

XRP, XRPUSDT

XRP Targets $6–$14 After Final Shakeout: Certified Elliott Wave Analyst

Certified Elliott Wave analyst XForceGlobal (@XForceGlobal) told followers on X that “$5+ remains on the horizon,” arguing that the token’s past year of range-bound trading is validating an Elliott Wave “flat” correction that typically resolves with a sharp, final move before a continuation higher.

In a 10-minute video shared alongside the post, the analyst framed XRP’s recent price action as the late stage of a flat pattern, an extended period where neither bulls nor bears can force a clean trend. “A flat occurs when the market fails to trend on both sides. They’re basically evenly matched,” he said. “And that’s not a sign of weakness, it’s a sign of balance.”

XRP Traders ‘Exhausted’ As Breakout Nears

XForceGlobal positioned the structure as a corrective phase within a larger bullish sequence, describing the market as forming a new floor rather than breaking down. “This is where the buyers and sellers enter a Mexican standoff with each other, creating a new price floor,” he said, adding that the sideways feel is the point: “They’re not designed to go anywhere, basically. And the markets naturally alternate between expansion and compression.”

The analyst emphasized the psychological aspect of prolonged consolidation, arguing that flats tend to “eliminate even the leverage traders through time rather than price” by exhausting both sides. “By the time the flat actually resolves, which is very close, in my opinion, most traders are emotionally already exhausted,” he said. “Positioning has been pretty much neutralized, and the path for continuation, to me, becomes very clear.”

XRP Elliott Wave analysis

In Elliott Wave terms, XForceGlobal described the flat as a three-part A-B-C structure, with waves A and B unfolding as corrective “three-wave” moves and wave C completing as an impulsive “five-wave” move. He argued that this final phase is the moment the market stops drifting and forces a resolution.

“Wave C must be impulsive because it represents the resolution of the balance that we have for waves A and B,” he said. “It’s not the continuation of a larger structure to the downside.” He framed impulsiveness as behavioral rather than directional, attributing it to urgency and follow-through once one side “decisively gives up,” clearing out the range that built during the earlier legs.

That distinction matters for positioning, because his base case anticipates one more decisive shakeout before a move higher. He said the market is currently in an “expanded flat” configuration where wave B pushed above the prior high, and he expects a break of local structure “once” before the market turns up. He highlighted $1.70 as a prior low that could be undercut as part of the process without invalidating the larger setup, so long as broader support holds.

XForceGlobal’s post leaned heavily on conviction built over time—“I didn’t spend 2,000+ days accumulating XRP for no reason!”—while also stressing that he has already taken some profit. In the transcript, he said he “personally took some profits around the $2.70 level” and would continue to “sell into strength.”

On upside expectations, he called for higher levels “in this current cycle,” tying potential targets to the duration of the consolidation. “The longer that we distribute here, the higher the targets are going to be,” he said, adding that “a minimum of a $6 range all the way up to even the $14 range is my personal target.”

He also flagged conditions that would change the trade management. If the market shows “red flags” and breaks further structure than he expects, he suggested that is where risk management should take priority.

For XRP traders, the practical takeaway from his framework is timing and path, not direction: a final, forceful leg lower could still be consistent with a bullish continuation thesis while a deeper structural breakdown would challenge it.

At press time, XRP traded at $1.91.

XRP price analysis

Bonk Price Prediction: 300% Rally in Sight – BONK Just Did What Every Trader Was Waiting For

With a pick-up in market momentum this week, a higher low could have just confirmed a 300% rally, with a bullish breakout structure now guiding Bonk price predictions.

The meme coin momentum that kicked off the year is showing real staying power, returning after what now seems to have been a healthy cooldown.

With it, a 6-month falling wedge breakout setup may have gotten the go-ahead it was waiting for.

BONK USDT 1-day chart - falling wedge breakout confirmation. Source: TradingView.
BONK USDT 1-day chart – falling wedge breakout confirmation. Source: TradingView.

A potential post-breakout bounce from a multi-month demand zone and 0.236 Fibonacci retracement level at $0.00000885 rules the downside up to a shallow pullback within a very strong, existing trend.

Buying pressure remains dominant, keeping BONK firmly on the breakout path.

Market positioning reflects that confidence. Coinglass data shows that market participants are betting on upside, with a long/short ratio of 1.021 – the majority of traders are longing the BONK price.

Bonk Price Analysis: 300% Move in Motion

With this potential higher low, the bull run stands to continue with the breakout of the 5-month falling wedge pattern. Particularly with momentum indicators firmly bullish.

BONK USDT 1-day chart - falling wedge breakout path. Source: TradingView.
BONK USDT 1-day chart – falling wedge breakout path. Source: TradingView.

The RSI has reaffirmed its position in bullish territory, bottoming just above the 50 neutral line as buyers maintain control after months of failed attempts to find the strength.

The MACD shows this staying power, narrowly avoiding a death cross as it maintains a lead above the signal line.

If momentum follows through, a multi-stage breakout could unfold. The first target sits at pre–October 10 liquidation levels near $0.0000215, unwinding the late-2025 bear market.

Beyond that, attention turns to September highs near $0.000026.

A fully realised breakout, however, could extend as much as 300% from current prices toward prior all-time highs around $0.000041.

Maxi Doge: BONK Might Not Be the Token to Watch

While tried-and-tested Doge tokens are the easy bet, when capital rotates back into meme coins, big momentum usually concentrates around a single high-beta Doge play.

The pattern is familiar. Dogecoin set the foundation, Shiba Inu took over in 2021, followed by Floki, Bonk, Dogwifhat, and Neiro. Every bull cycle eventually crowns a new Doge-inspired frontrunner.

This time around, Maxi Doge ($MAXI) is tapping into the raw energy of early Dogecoin, with an active community focused on shared alpha, trading ideas, and competitive engagement rather than pure speculation.

Participation is at its core. Weekly Maxi Ripped and Maxi Pump competitions reward top performers with leaderboard recognition, incentives, and bragging rights.

The hype is already showing in the numbers. The $MAXI presale has raised almost $4.5 million, while early backers are earning up to 69% APY through staking rewards.

For traders who missed earlier Doge runs, Maxi Doge could be the next opportunity to position ahead of a meme coin before it reaches the mainstream.

Visit the Official Maxi Doge Website Here

The post Bonk Price Prediction: 300% Rally in Sight – BONK Just Did What Every Trader Was Waiting For appeared first on Cryptonews.

Solana (SOL) Recovery At Risk With Bears Guarding Resistance

Solana failed to settle above $140 and nosedived. SOL price is now consolidating losses below $135 and might struggle to start a recovery wave.

  • SOL price started a fresh decline below $136 and $135 against the US Dollar.
  • The price is now trading below $135 and the 100-hourly simple moving average.
  • There is a key bearish trend line forming with resistance at $138 on the hourly chart of the SOL/USD pair (data source from Kraken).
  • The price could start a recovery wave if the bulls defend $128 or $125.

Solana Price Dips Further

Solana price failed to remain stable above $140 and started a fresh decline, like Bitcoin and Ethereum. SOL declined below the $138 and $135 support levels.

The price gained bearish momentum below $132. A low was formed at $124, and the price is now consolidating losses. The price recovered a few points and climbed above the 23.6% Fib retracement level of the downward move from the $143 swing high to the $124 low.

Solana is now trading below $135 and the 100-hourly simple moving average. On the upside, immediate resistance is near the $134 level or the 50% Fib retracement level of the downward move from the $143 swing high to the $124 low.

Solana Price

The next major resistance is near the $136 level. The main resistance could be $138. There is also a key bearish trend line forming with resistance at $138 on the hourly chart of the SOL/USD pair. A successful close above the $138 resistance zone could set the pace for another steady increase. The next key resistance is $144. Any more gains might send the price toward the $150 level.

Another Decline In SOL?

If SOL fails to rise above the $133 resistance, it could continue to move down. Initial support on the downside is near the $129 zone. The first major support is near the $125 level.

A break below the $125 level might send the price toward the $120 support zone. If there is a close below the $120 support, the price could decline toward the $112 support in the near term.

Technical Indicators

Hourly MACD – The MACD for SOL/USD is losing pace in the bearish zone.

Hourly Hours RSI (Relative Strength Index) – The RSI for SOL/USD is above the 50 level.

Major Support Levels – $129 and $125.

Major Resistance Levels – $133 and $138.

Shiba Inu Price Prediction: SHIB Confirms Life-Long Launchpad – Is This the Bottom Dip Buyers Have Waited For?

Two years of consolidation may have been building to this launchpad moment, as a historic demand zone puts bullish Shiba Inu price predictions back in focus.

The meme coin momentum that kicked off the year is showing real staying power, picking up again this week after what now seems to have been a brief and healthy cooldown.

This has particular importance to SHIB. A higher low here stands to confirm its most important bull market proving ground, a long-standing demand zone around $0.0000068.

SHIB USD 1-day chart - life-long demand zone bounce. Source: TradingView.
SHIB USD 1-day chart – life-long demand zone bounce. Source: TradingView.

Across Shiba Inu’s history, this level has consistently acted as a launchpad, marking cycle bottoms and igniting bull runs that average a 640% gain.

If the zone holds once again, those who took early positions and bought the dip could feel the full weight of the next bull run once it gains traction.

Shiba Inu Price Prediction: How a SHIB Bull Run Could Unfold

A year of consolidation has carved out a falling wedge that is now nearing its apex, making the bounce from this lifelong demand zone a potential final bottom before a breakout.

Price action over the past two months reinforces the setup, shaping a bullish head-and-shoulders structure. The latest higher low suggests the right shoulder is forming, setting the stage for a final push higher.

SHIB USD 1-day chart - head-and-shoulder sets up falling wedge breakout. Source: TradingView.
SHIB USD 1-day chart – head-and-shoulder sets up falling wedge breakout. Source: TradingView.

Momentum indicators support the bullish case. While the RSI has slipped just below the neutral 50 level, the broader uptrend it has established points to an imminent bounce.

The recent MACD death cross below the signal line also looks more like a pause than a reversal, occurring near peak levels that have marked consolidation within this structure.

If the right shoulder fully develops, breakout pressure shifts toward the wedge’s key threshold at the psychological $0.00001 level.

A confirmed breakout targets a 320% advance toward $0.000033, though in a stronger bull market continuation, upside could credibly extend as much as 490% toward all-time highs around $0.000042.

This level must prove as support before the full 320% breakout move to $0.000033. And in a full-blown altseason, the step could credibly see gains extend 490% to all-time highs around $0.000042.

Maxi Doge: SHIB Might Not Be the Token to Watch

While tried-and-tested Doge tokens are the easy pick, when capital rotates back into meme coins, momentum almost always circles back to one high-beta pick.

History makes the pattern clear: Dogecoin started the trend, Shiba Inu ran with it in 2021, followed by Floki, Bonk, Dogwifhat, and Neiro. Every bull cycle eventually crowns a new Doge-inspired frontrunner.

This time around, Maxi Doge ($MAXI) is tapping into those early Dogecoin vibes with a community built around sharing early alpha, trading ideas, and competitive engagement.

Participation is at its core. Weekly Maxi Ripped and Maxi Pump competitions reward top performers with leaderboard recognition, incentives, and bragging rights.

The hype is already showing in the numbers. The $MAXI presale has raised almost $4.5 million, while early backers are earning up to 69% APY through staking rewards.

For those who missed the Doge wave before, Maxi Doge could be the next chance to catch a meme coin before it enters the mainstream.

Visit the Official Maxi Doge Website Here

The post Shiba Inu Price Prediction: SHIB Confirms Life-Long Launchpad – Is This the Bottom Dip Buyers Have Waited For? appeared first on Cryptonews.

Bitcoin Bear Market Depths: A Closer Look At How Low BTC Could Go

On Tuesday, Bitcoin (BTC) dipped below the significant $90,000 mark once again, raising concerns about the possibility of entering a new bear market and casting doubt on the cryptocurrency’s prospects. Market analyst Raun Neuner published a new analysis of the situation in a post on X (formerly Twitter).

Is $37,000 On The Horizon?  

Neuner highlighted that while stocks are performing robustly and commodities are experiencing what he calls a “supercycle,” the crypto market still struggles to gain traction. This situation raises the critical question: What is the worst-case scenario for Bitcoin?

Historically, Bitcoin’s bull markets tend to peak approximately 532 days after each Halving event. Applying this pattern to the current cycle suggests that Bitcoin could have reached its peak around early October, where it briefly touched $125,000. 

Historical trends show that following these peaks, Bitcoin typically endures a substantial decline of 70 to 80%. If this framework holds for the current cycle, Neuner estimates a potential downturn to around $37,000 in the event of a full bear market.

Zooming out to consider broader traditional market dynamics provides further context. After a year marked by strong performances in both stocks and commodities, market corrections are to be expected. 

During risk-off periods in equity markets, Bitcoin has historically amplified these downward moves, contributing to building pressure toward the lower end of the spectrum. The analyst indicates that a key reference point for Bitcoin might be around the $57,000 mark, where the 200-week moving average (MA) resides.

Critical Bitcoin Support Levels To Watch

The immediate factors contributing to Bitcoin’s recent drop below the $90,000 threshold are linked to heightened volatility in global bond and equity markets, exacerbated by geopolitical tensions. 

Walter Bloomberg, an expert in market analysis, pointed out that the new downtrend has been spurred by various macroeconomic factors, including renewed threats from President Trump regarding tariffs on Greenland and Japan’s fiscal strategies that have added to market instability. 

Consequently, investors have turned to safe-haven assets like gold, which recently reached a record price exceeding $4,700. In response, Bloomberg warns that macro risks may be underappreciated. 

Demand for downside protection in Bitcoin’s options market is also rising, indicating that investors are aware of the potential for further declines.

The next significant levels for the Bitcoin price in the near term, according to Bloomberg, lie between $84,000 and $85,000, which are expected to act as support for BTC. If the cryptocurrency fails to hold these levels, fears of a deep bear market may become more pronounced.

Bitcoin

Featured image from DALL-E, chart from TradingView.com 

Ethereum Price Prediction: Price Holds Key Line as Transactions Hit All‑Time Highs – Is ETH Coiling to Explode?

Ethereum is hitting record-breaking activity on-chain, yet Ethereum price predictions haven’t caught up, and pressure is building beneath the surface.

Weekly active addresses just hit a new all-time high of 706,000, surpassing the peak of the last bull run as adoption surges across the network.

Ethereum active addresses 7-day SMA. Source: CryptoQuant.

Despite this on-chain strength, market participation remains selective. Whales are the only cohort accumulating, with wallets holding 10,000–100,000 ETH adding roughly 190,000 ETH over the past week.

Ethereum balance by holder value (ETH). Source: CryptoQuant.

Retail behavior tells a different story. Wallets in the 1,000–10,000 and 100–1,000 ETH brackets have continued to reduce exposure, likely reacting to macro uncertainty with geopolitical tensions between the U.S. and NATO over Greenland.

While metrics show a disconnect between fundamentals and market behavior, technicians show bullish momentum quietly building beneath the surface for the altcoin.

Ethereum Price Prediction: Key Line Could Trigger Explosive Move

Since Ethereum carved out a local bottom in November, a clear sequence of higher lows has established a decisive support trendline, compressing price against upper resistance.

This forms a 2-month symmetrical triangle, now nearing its apex – making the next retest of support its potential last before a breakout or breakdown.

That structure has formed a two-month symmetrical triangle now approaching its apex, making the next support retest its potential last before pressure releases in a breakout or breakdown.

Momentum indicators continue to favor the bullish case. While the RSI has slipped below the neutral 50 level, its own rising trendline suggests a bounce may be imminent.

The recent MACD death cross could also prove short-lived, reflecting consolidation rather than a broader trend reversal.

The key breakout threshold stands in a divisive zone around $3,350. If flipped into support, a move toward all-time highs comes into focus, with a 55% breakout targeting $4,800.

Traders should remain cautious near $4,250, which stands as strong interim resistance to the move.

Maxi Doge: Another Play Quietly Building Momentum

When capital rotates from Bitcoin into altcoins, momentum almost always circles back to one thing: Doge.

History makes the pattern clear. Dogecoin started the trend, Shiba Inu ran with it in 2021, followed by Floki, Bonk, Dogwifhat, and Neiro. Every bull cycle eventually crowns a new Doge meme-inspired frontrunner.

This time around, Maxi Doge ($MAXI) is tapping into those early Dogecoin vibes with a community built around sharing early alpha, trading ideas, and competitive engagement.

Participation is at its core. Weekly Maxi Ripped and Maxi Pump competitions reward top performers with leaderboard recognition, incentives, and bragging rights.

The hype is already showing in the numbers. The $MAXI presale has raised over $4.5 million, while early backers are earning up to 69% APY through staking rewards.

For those who missed the Doge wave before, Maxi Doge could be the next chance to catch a meme coin before it enters the mainstream.

Visit the Official Maxi Doge Website Here

The post Ethereum Price Prediction: Price Holds Key Line as Transactions Hit All‑Time Highs – Is ETH Coiling to Explode? appeared first on Cryptonews.

Solana (SOL) Loses Its Footing, Setting the Stage for Another Dive

Solana failed to settle above $145 and nosedived. SOL price is now consolidating losses below $135 and might decline further below $130.

  • SOL price started a fresh decline below $138 and $135 against the US Dollar.
  • The price is now trading below $135 and the 100-hourly simple moving average.
  • There is a key bearish trend line forming with resistance at $140 on the hourly chart of the SOL/USD pair (data source from Kraken).
  • The price could start a recovery wave if the bulls defend $132 or $130.

Solana Price Dips Again

Solana price failed to remain stable above $142 and started a fresh decline, like Bitcoin and Ethereum. SOL declined below the $140 and $138 support levels.

The price gained bearish momentum below $135. A low was formed at $130, and the price is now consolidating losses. The price recovered a few points and climbed above the 23.6% Fib retracement level of the downward move from the $143 swing high to the $130 low.

Solana is now trading below $135 and the 100-hourly simple moving average. On the upside, immediate resistance is near the $135 level. The next major resistance is near the $136 level or the 50% Fib retracement level of the downward move from the $143 swing high to the $130 low.

Solana Price

The main resistance could be $140. There is also a key bearish trend line forming with resistance at $140 on the hourly chart of the SOL/USD pair. A successful close above the $140 resistance zone could set the pace for another steady increase. The next key resistance is $144. Any more gains might send the price toward the $150 level.

Another Decline In SOL?

If SOL fails to rise above the $136 resistance, it could continue to move down. Initial support on the downside is near the $132 zone. The first major support is near the $130 level.

A break below the $130 level might send the price toward the $122 support zone. If there is a close below the $122 support, the price could decline toward the $115 support in the near term.

Technical Indicators

Hourly MACD – The MACD for SOL/USD is gaining pace in the bearish zone.

Hourly Hours RSI (Relative Strength Index) – The RSI for SOL/USD is below the 50 level.

Major Support Levels – $132 and $130.

Major Resistance Levels – $136 and $140.

Dogecoin Price Prediction: Oversold Signal Flashes for Only the 4th Time Ever – What Followed Last Time Was Insane 

The weekly RSI has entered oversold conditions for the fourth time ever, and each time prior has marked a cycle bottom for Dogecoin price predicition.

While near-oversold readings around 40 often coincide with mid-term trend shifts, true oversold conditions around 30 have only ever preceded the meme coin’s most aggressive parabolic moves.

Historical precedent says it could be the start of this cycle’s bullish phase, and an opportunity pseudonymous X analyst Cryptollica has labelled “life-changing” for those who position early.

DOGE USD 1-week chart, oversold RSI. Source: X, @Cryptollica.

Market behavior also reads similarly. Adding to the narrative in a separate X post, Cryptollica noted the DOGE/BTC pair mirrors similar accumulation patterns to those in 2014-2017.

Rather than signaling structural weakness, the prolonged bleed against Bitcoin since 2021 may reflect energy compression. Cryptollica frames it as a loading fractal, not “death.”

With DOGE entering the final stage of a multi-year compression against Bitcoin, an oversold weekly RSI may be signaling an imminent volatility squeeze, one that has historically preceded major capital rotation from BTC into altcoins.

Dogecoin Price Prediction: How High Could DOGE Go This Time?

This potential shift comes as Dogecon tests the lower boundary of a year-long descending wedge pattern as a launchpad.

DOGE USD 1-week chart, falling wedge pattern. Source: TradingView.

Momentum indicators show a potential shift. The RSI is forming a potential higher low after its oversold encounter, as bullish strength builds beneath the surface.

With the MACD closing in on a potential golden cross, strength could soon become a full-fledged uptrend that puts a breakout push in focus.

The resistance that has marked local tops throughout the pattern at $0.28 marks the key breakout threshold. If flipped to support, it higher and firmer footing for a sustained push.

Filly realised the pattern eyes a 520% push into new price discovery, targeting $0.80, with potential interim psychological resistance around all-time highs at $0.48.

Maxi Doge: DOGE Could Set Up a Bigger Play

When capital rotates from Bitcoin into altcoins, momentum almost always circles back to one thing: Doge.

The pattern is well established. Dogecoin sparked the movement, Shiba Inu amplified it in 2021, followed by Floki, Bonk, Dogwifhat, and Neiro. Every bull cycle eventually delivers a Doge-thened runner.

This cycle, attention is turning toward Maxi Doge ($MAXI). The project channels early Dogecoin energy with a community centered on shared alpha, trading insights, and competitive engagement.

Participation is at its core. Weekly Maxi Ripped and Maxi Pump competitions reward top performers with leaderboard recognition, incentives, and bragging rights.

The hype is already showing in the numbers. The $MAXI presale has raised almost $4.5 million, while early backers are earning up to 69% APY through staking rewards.

For traders who missed previous Doge-driven runs, Maxi Doge could offer another early entry before meme coin momentum moves back into the spotlight.

Visit the Official Maxi Doge Website Here

The post Dogecoin Price Prediction: Oversold Signal Flashes for Only the 4th Time Ever – What Followed Last Time Was Insane  appeared first on Cryptonews.

Bitcoin Price Outlook: Bulls Eye $98,000 Breakout After Holding $90,000 Zone

Bitcoin Magazine

Bitcoin Price Outlook: Bulls Eye $98,000 Breakout After Holding $90,000 Zone

Bitcoin Price Weekly Outlook

Well, the bitcoin price action was looking quite bearish after last week’s close, but the bulls managed to maintain the bullish structure around the $90,000 level and made that push up to $98,000 resistance. The price retreated from there and closed the week out at $93,638. Expect the bulls to take another run at the $98,000 resistance level this week and aim for the upper end of this resistance zone at $103,500 if they can sustain price action above $98,000. Early in the week, support at $91,400 may be tested and must hold for the bulls to continue their charge.

Key Support and Resistance Levels Now

The bulls have finally made some progress, chipping away at overhead resistance. The bulls will look to regain the $94,000 level as short-term support this week. If they can keep the momentum going, they will once again challenge the $98,000 resistance and try to push to the upper end of this zone at $103,500. Closing days at the upper end of this zone should usher in a move up to the next major resistance zone at $106,000 to $109,000. This area should be very strong resistance, but $116,000 lies beyond this range at the 0.786 Fibonacci retracement if the bulls’ strength can persist.

Look for bulls to defend the $91,400 level with authority, as losing this level would give the bears some renewed confidence to push the price down even lower. $87,000 would look to contain price action below there, and act as a doorway to the major $84,000 support level. Breaking $84,000 support opens up the low $70,000 area for a test.

Outlook For This Week

Bulls should attempt to capitalize on their recent resolve heading into this week. Look for another test of $98,000 if they can manage to regain $94,000 early this week. However, a more bearish test of the $91,400 support is possible here as well, but as long as bulls can hold this level, bullish bias remains, and re-challenging $98,000 is in the cards. Closing a day above $98,000 should lead the price towards $103,500.

Market mood: Slightly Bullish – The bulls finally managed to show some resilience here as they defended the $90,000 area last week. Price action leans in their favor heading into this week.

The next few weeks
The bulls have held onto some momentum over the past week, but they are entering some heavier resistance areas now. If bulls can push even higher, above $100,000, they will start entering an area where we could see a major price reversal. $103,500 to $109,000 should be a tough zone to conquer, and we should not be surprised to see price kicked back down with authority from this area over the coming weeks. Holding support from there would be critical in determining whether this rally can keep going to new highs or if it finally gives way to new lows below $80,000.

Terminology Guide:

Bulls/Bullish: Buyers or investors expecting the price to go higher.

Bears/Bearish: Sellers or investors expecting the price to go lower.

Support or support level: A level at which the price should hold for the asset, at least initially. The more touches on support, the weaker it gets and the more likely it is to fail to hold the price.

Resistance or resistance level: Opposite of support.  The level that is likely to reject the price, at least initially. The more touches at resistance, the weaker it gets and the more likely it is to fail to hold back the price.

Fibonacci Retracements and Extensions: Ratios based on what is known as the golden ratio, a universal ratio pertaining to growth and decay cycles in nature. The golden ratio is based on the constants Phi (1.618) and phi (0.618).

This post Bitcoin Price Outlook: Bulls Eye $98,000 Breakout After Holding $90,000 Zone first appeared on Bitcoin Magazine and is written by Ethan Greene - Feral Analysis and Juan Galt.

XRP Is Doing Something It Hasn’t Done Since 2021: Here’s Why It Matters

XRP is flashing a rare relative-strength signal against ETH, according to crypto analyst Matt Hughes (“The Great Mattsby”), who points to a 2-week Ichimoku cloud flip that he says hasn’t meaningfully held as support since 2021. With XRP also boxed inside a defined USD range on lower timeframes, Hughes frames the next phase as a conditional “prove it” moment: reclaim one level, and the market has room to work; fail it, and the breakout narrative stays premature.

XRP Poised To Outperform ETH?

Hughes’ primary claim is anchored to the XRP/ETH pair on a 2-week chart. In his read, there’s a massive regime change: “When looking at the 2-week Ichimoku cloud, you can see that XRP is doing something it hasn’t done since 2021: flipping the 2-week cloud to support. The cloud has been a massive resistance for most of the chart’s history until now (with a notable breakout in 2021, but only a few weeks).”

XRP/ETH chart: 2-week Ichimoku cloud

On Hughes’ chart, XRP/ETH is pressing into the top side of the 2-week Ichimoku cloud, with the latest candle marked around 0.00062. His bullish read is that a clean flip, price holding above the cloud and treating it as a floor on pullbacks, would be a regime change for the pair.

XRP Roadmap To $9

Hughes’ shorter-timeframe work shifts from relative performance to mechanics in spot USD terms. On the daily XRP/USD chart, price is still behaving like a market that has not resolved its larger consolidation, oscillating between stacked horizontal levels while respecting sloping fan lines that visually reinforce why upside attempts have repeatedly stalled.

Hughes boils that structure down to one actionable threshold: “Price moves in increments, and this Gann fan perfectly illustrates why price is stuck in its current range. Once XRP can close candles above $2.30, the move up can continue.” Above that, the next targets on the daily timeframe are $2.59 and $2.95.

XRP daily chart: Gann fan

The weekly XRP/USD chart adds the next level if that acceptance arrives. Two extension levels (drawn from the 2014 low to the 2017 high) are explicitly marked: 2.272 at $3.09882 and 2.618 at $9.00194, with Hughes’ drawn path stepping first toward the low-$3 area before stretching higher if momentum persists.

Thus, Hughes’ bullish scenario is a two-part sequence: first, clear the USD range trigger (a sustained close above $2.30), then convert the last major zone before the 2025 high into support. He states it in more pointed terms on X: “XRP’s been grinding sideways for 1+ year while many other alts were bleeding. Not IF it hits $9—it’s WHEN. Key flip: $3.09 becomes support and then its go time.”

XRP weekly chart target the 2.618 Fib

The failure scenario is simpler and more immediate. If XRP cannot secure closes above $2.30, the fan-and-range framework remains intact: rallies are still just rallies into the same ceiling, and the market risks reverting back towards $1.78.

However, a dip towards this price would not change anything about the long-term bullish chart of XRP. Pointing to a gap between chart structure and crowd sentiment, Hughes wrote:

“An actual infant in diapers and a 120-year-old grandpa who’s forgotten his own name can look at this chart and go, ‘Yep, classic breakout above the 2021 top, now flipping it to rock-solid support.’ Meanwhile, every bear on X, their mailman, their mailman’s dog walker, and that one guy who still thinks it’s 2022 are out here screaming ‘BEARISH! DOOM! SELL YOUR KIDS!’ like it’s still the bear market special. Bro, even my grandma’s bingo partner is bullish at this point. Wake up and smell the bull fuel.”

XRP weekly chart: classical retest of 2021 breakout

At press time, XRP traded at $1.9799.

XRP price chart

Monero Triggers Retail Alert That Preceded ZEC And DASH Drops As Privacy Coin Hype Returns

Monero (XMR), one of crypto’s most established privacy-focused assets, has exploded higher to start 2026, delivering one of the strongest moves in the market over the past few days. Monero is built around private, censorship-resistant transactions, using cryptography to obscure wallet balances and transfer details on-chain. That privacy-first design has kept XMR in its own category for years, often moving independently from large-cap altcoins when narrative-driven momentum returns.

Since the beginning of the year, XMR has surged from roughly $410 to nearly $799, a near-vertical move that reflects both aggressive demand and a rapid shift in trader attention toward the privacy coin sector. The breakout comes after similar sharp rallies in names like Zcash (ZEC) and Dash (DASH), which also experienced explosive upside followed by fast pullbacks.

Zcash climbed to around $750 before reversing toward the $400 zone, while Dash ran to roughly $120 and later dropped to near $35. Those moves set the tone for a volatile privacy coin rotation, where price action tends to accelerate quickly once momentum enters the sector.

Now, with Monero leading the pack, the market is watching whether this rally can establish higher support levels, or if it becomes another short-lived spike driven by crowded positioning and thin liquidity.

Retail Hype Signal Flashes As Monero Extends Its Breakout

Monero’s surge is now starting to show the same “retail frenzy” footprint that appeared earlier in other privacy coins, raising questions about how sustainable this move really is. A trading frequency signal—often associated with crowded participation and late-stage chasing—previously lit up in Zcash and Dash near their local tops, before both coins reversed sharply.

Monero Futures Retail Activity Through Trading Frequency Surge | Source: CryptoQuant

In Zcash, the retail-heavy activity spike aligned with a push to roughly $698, and the price has since slid back to around $442, a drawdown of about 37%. Dash followed a similar pattern. The trigger appeared near $120, before the market cooled off aggressively and dragged the price down to the $57 zone. A decline of roughly 52%.

Now, the same signal is flashing for Monero. The retail-frequency threshold appeared around $714 as XMR traded deep into its parabolic advance. That matters because these setups often reflect emotional participation, where buyers enter late, liquidity thins, and volatility increases sharply.

This doesn’t guarantee an immediate top, but history suggests a clear risk: once retail demand becomes dominant, the rally can become fragile. The bigger question is whether Monero can absorb profit-taking without breaking structure—or if it repeats the same post-spike unwind seen in ZEC and DASH.

XMR Surges Into Parabolic Territory

Monero is showing one of the strongest price trends in the market. The weekly chart is now moving into a clear parabolic expansion phase. After spending much of 2024 in a slow accumulation range, XMR gradually built a base and repeatedly defended higher lows. This has set the stage for the subsequent breakout.

Once Monero reclaimed the $200 area, momentum accelerated sharply, and buyers began to absorb sell pressure without allowing deep pullbacks. The chart shows a clear bullish structure. With price holding above rising moving averages and using them as dynamic support during each consolidation phase. This type of price behavior usually reflects sustained demand rather than a single short-lived spike.

However, the most notable development is the latest impulse candle. We saw the price surge into the $700 zone with almost no overhead resistance. These kinds of vertical advances often signal aggressive market participation and can lead to a volatility expansion event. Price either continues trending higher or enters a sharp correction after exhaustion.

From a market structure perspective, the key is whether Monero can hold above previous breakout zones near $500–$600. If buyers defend those areas, the uptrend remains intact. If not, a deeper retracement could unfold quickly.

Featured image from ChatGPT, chart from TradingView.com 

Solana (SOL) Slips Back to Support, Setting Up a High-Tension Test

Solana failed to stay above $146 and corrected gains. SOL price is now trading below $145 and might find bids near the $140 zone.

  • SOL price started a downside correction below $145 against the US Dollar.
  • The price is now trading below $145 and the 100-hourly simple moving average.
  • There is a bullish trend line forming with support at $141 on the hourly chart of the SOL/USD pair (data source from Kraken).
  • The pair could extend losses if it dips below the $140 zone.

Solana Price Starts Downside Correction

Solana price failed to surpass $150 and started a downside correction, like Bitcoin and Ethereum. SOL dipped below $146 and $145 to enter a short-term bearish zone.

There was a move below the 61.8% Fib retracement level of the upward wave from the $138 swing low to the $149 high. However, the bulls are active above $140. Besides, there is a bullish trend line forming with support at $141 on the hourly chart of the SOL/USD pair.

Solana Price

Solana is now trading below $145 and the 100-hourly simple moving average. On the upside, the price is facing resistance near the $144 level. The next major resistance is near the $146 level. The main resistance could be $148. A successful close above the $148 resistance zone could set the pace for another steady increase. The next key resistance is $155. Any more gains might send the price toward the $162 level.

More Losses In SOL?

If SOL fails to rise above the $146 resistance, it could start another decline. Initial support on the downside is near the $141 zone and the trend line. The first major support is near the $140 level and the 76.4% Fib retracement level of the upward wave from the $138 swing low to the $149 high.

A break below the $140 level might send the price toward the $132 support zone. If there is a close below the $132 support, the price could decline toward the $124 support in the near term.

Technical Indicators

Hourly MACD – The MACD for SOL/USD is gaining pace in the bearish zone.

Hourly Hours RSI (Relative Strength Index) – The RSI for SOL/USD is below the 50 level.

Major Support Levels – $141 and $140.

Major Resistance Levels – $146 and $148.

Solana (SOL) Escapes Resistance Zone, Rally Pressure Intensifies

Solana started a fresh increase above the $142 zone. SOL price is now consolidating above $142 and might aim for more gains above the $150 zone.

  • SOL price started a fresh upward move above the $142 and $145 levels against the US Dollar.
  • The price is now trading above $142 and the 100-hourly simple moving average.
  • There is a bullish trend line forming with support at $140 on the hourly chart of the SOL/USD pair (data source from Kraken).
  • The pair could extend gains if it clears the $150 resistance zone.

Solana Price Starts Fresh Surge

Solana price started a decent increase after it settled above the $135 zone, like Bitcoin and Ethereum. SOL climbed above the $140 level to enter a short-term positive zone.

The price even smashed the $142 resistance. The bulls were able to push the price above $145. A high was formed at $148, and the price is now consolidating gains. There was a minor decline below the 23.6% Fib retracement level of the recent upward move from the $138 swing low to the $148 high.

Solana is now trading above $142 and the 100-hourly simple moving average. Besides, there is a bullish trend line forming with support at $140 on the hourly chart of the SOL/USD pair.

Solana Price

On the upside, the price is facing resistance near $148. The next major resistance is near the $150 level. The main resistance could be $155. A successful close above the $155 resistance zone could set the pace for another steady increase. The next key resistance is $162. Any more gains might send the price toward the $170 level.

Downside Correction In SOL?

If SOL fails to rise above the $148 resistance, it could start another decline. Initial support on the downside is near the $144 zone. The first major support is near the $143 level or the 50% Fib retracement level of the recent upward move from the $138 swing low to the $148 high.

A break below the $143 level might send the price toward the $140 support zone and the trend line. If there is a close below the $140 support, the price could decline toward the $135 support in the near term.

Technical Indicators

Hourly MACD – The MACD for SOL/USD is gaining pace in the bullish zone.

Hourly Hours RSI (Relative Strength Index) – The RSI for SOL/USD is above the 50 level.

Major Support Levels – $144 and $140.

Major Resistance Levels – $148 and $150.

Bitcoin Forecast: All-Time High In Sight, But Expert Flags Potential For Bear Market Reversal

On Tuesday, Bitcoin (BTC) witnessed a notable surge, approaching its nearest resistance level at $94,000, a barrier that has thus far hindered the cryptocurrency’s return to significant milestones, including the coveted $100,000 mark. Despite this, experts remain optimistic about new all-time highs for Bitcoin within the year.

Potential Bitcoin Return To $100,000

Nic Puckrin, a digital asset analyst and co-founder of Coin Bureau, commented on the recent price movements, suggesting that the uptick is more likely a reflexive response from investors who are rebalancing their portfolios after last year’s heavy sell-off, rather than an indication of a fundamental trend shift. 

“The bounce in Bitcoin we’re seeing this week is most likely a reflexive move by investors rather than something indicative of a major shift in trend,” Puckrin explained.

Currently, Bitcoin has struggled to maintain momentum after rejecting the $94,700 resistance level. Puckrin warns that a failure to break through this barrier could lead to another decline in value. However, if BTC does breach this resistance, he believes a return to the $100,000 level may be achievable. 

Looking further ahead, Puckrin anticipates another all-time high in 2026, although he advises caution regarding the extent of that potential rise. “In the longer term, I expect to see another all-time high this year, but it won’t be as dramatic as some are predicting, and the possibility of a reversal into bear territory remains very real,” he added.

Key Resistance Level

Contrasting this optimism, some analysts express skepticism about Bitcoin’s immediate prospects. Vince Stanzione, CEO and founder of First Information, maintains a bearish outlook, arguing that the risk-reward ratio at current prices is unappealing. 

Stanzione evaluates Bitcoin against gold rather than the dollar, asserting that Bitcoin has considerable ground to cover. “I was negative on Bitcoin throughout 2025, and I’m sticking with that view in 2026,” he noted. 

He pointed out that while the market’s leading cryptocurrency experienced a decline of about 6% by the end of 2025, gold surged by 66%, resulting in a significant disparity in performance.

Stanzione believes gold will continue to outperform Bitcoin this year, predicting that the digital asset will close the year at a lower price. “There are no compelling reasons to buy Bitcoin at the current $92,000 level,” he stated. 

Meanwhile, market analyst Ali Martinez highlighted a crucial price level for Bitcoin in the short term, stating on social media platform X (formerly Twitter) that $94,555 is the “bullish trigger” for the cryptocurrency. 

Should Bitcoin break through this level, Martinez indicated that the next target could be $105,291, representing a potential 12% increase. This move would significantly narrow the gap to the all-time high of over $126,000 reached last October.

Bitcoin

Featured image from DALL-E, chart from TradingView.com

XRP Has One Last Buying Opportunity, Says Analyst: Here’s When

XRP may be setting up for a final, cleaner long entry if the broader market delivers one more volatility-driven pullback, according to CryptoinsightUK’s Will Taylor, who says his preferred “risk to reward” zone sits materially below current support. The thesis hinges on whether Bitcoin prints a double-bottom-style retest and drags major alts into deeper liquidity pockets before the next leg higher.

In his Jan. 10 newsletter, Taylor framed early 2026 as a market caught between two plausible paths: a familiar pullback-and-recover structure that has defined prior Bitcoin dips, or a continuation higher that leaves would-be buyers watching price run away.

“The question mark for me is whether we do get a wick below this ascending trend line into that double bottom area and then push higher,” he wrote, adding that the setup is crowded. “On the other side of this, it does make you think that everyone is probably looking at the same structure and waiting for something like this to play out.”

Taylor said he had closed short-term trades during the week, not as a shift in his higher-timeframe view, but as a response to what he described as low-timeframe conditions and event risk. “Today we get the ruling on tariffs in the US. Is that going to provide some volatility?” he asked, pointing to a cluster of geopolitical headlines as potential catalysts that could either produce the pullback he’s watching for—or “deceive people… who are waiting for a pullback, and instead continue higher from here and leave those orders behind.”

Taylor’s shorter-term trade framework leans heavily on liquidity positioning, using Ethereum as a key tell for what Bitcoin might do next. He argued ETH “kind of favours the double bottom scenario” because “the amount of liquidity that has built up for ETH down to about $2,600” is heavier below than above on the hourly chart, an imbalance he views as a magnet if the market attempts to rally without first clearing that downside interest.

One Last Buying Opportunity For XRP?

That same logic carries into his XRP plan. Taylor said XRP has already “swept the highs of the range first,” forcing a decision point between holding a nearer support band—his “first blue box”—or fading into a deeper demand zone.

“Now the discussion becomes whether we move into the first blue box as a weaker area of support and hold there… or whether we come back down into the deeper support zone around $1.90 to $1.82 and hold there,” he wrote. “That deeper area is my preferred risk to reward zone for placing long positions, and that is where I will be looking to get back into an XRP long and add to my position if we see that move specifically.”

XRP price analysis

He added that the daily RSI on XRP was “close to crossing bearish,” presenting a technical backdrop that, in his view, supports the case for one more washout before trend continuation while stressing it does not alter his higher-timeframe bullish thesis.

Taylor then pivoted to a more stimulative medium-term narrative, citing talk of “putting 200 billion into additional mortgage backed security purchases to cut mortgage rates,” along with suggestions of potential stimulus checks and the inflation sensitivity of oil prices.

“Because of all of this, I think we’re going to see an epic rally. I don’t think people are really expecting the size or the scale of the move that could come,” Taylor wrote. “I believe we’re in the final shakeout period before the market really starts to march higher.” He said he remained “around 95% exposed to the market through spot positions,” framing the decision to close short-term trades as “a capital protection mechanism.”

His minimum XRP price target is $3.40 and extends to $4.40 based on liquidity in the medium term. Long-term, he says that the argument for the $8-$12 range is still valid, as reported last week.

XRP liquidity chart

Separate commentary in the newsletter from analyst @thecryptomann1 highlighted what “confirmation” would look like on Bitcoin: a reclaim of roughly $105,000, a push through, and a successful retest. He cited “a huge amount of volume around this region” and alignment with bull market support bands, arguing that regaining them would shift the read from “relief rally” to something more durable.

He also pointed to USDT dominance sitting on a multi-year trend line but showing weakness, including being “trapped below the 20 EMA” with RSI “below 50” and rolling over conditions that, if they resolve lower, could align with a risk-on breakout in majors.

At press time, XRP traded at $2.05.

XRP price chart

Bitcoin Bears Hold $94K Resistance as Price Drops to $90,891 Weekly Close

Bitcoin Magazine

Bitcoin Bears Hold $94K Resistance as Price Drops to $90,891 Weekly Close

Bitcoin Price Weekly Outlook

Bitcoin buyers made a nice push to $94,000 resistance again last week, but the price promptly sold off again from this level to close the week out at $90,891. Sunday’s close gave us a doji candle, indicating indecision and a potential reversal back in the bears’ favor. The bulls are once again looking lethargic as they lack the follow-through necessary to overtake resistance. Bears are in the driver’s seat heading into this week. Look for them to try to push the price down through the $87,000 support level to make another attempt at breaking $84,000 support.

Key Support and Resistance Levels Now

The bulls are looking for support at the $87,000 level to hold if bears manage to keep the push lower going here. $84,000 still sits as strong support below here, but will weaken with any further pressure. If the bears can manage to break this support, the price is sure to accelerate down to the low $70,000 area, with a close below $68,000 required to lose this support level. Below this zone, bulls will look to gain some sort of strength off the 0.618 Fibonacci retracement at $58,000.

Bears will look to defend the $91,400 level as resistance over the short term here. The resistance at $94,000 has done its job so far, but it will be under heavy pressure if bulls can muster the strength to get the price back up there. Above $94,000, there is a resistance zone that stretches from $98,000 up to $103,500. Above here, we have another resistance zone from $106,000 up to $109,000 at the 0.618 Fibonacci retracement from the drop from the top down to $80,000.

Outlook For This Week

Wounded bulls need some help to hang on to momentum this week. Look for the bears to push the price down to $87,000 early in the week and possibly below it. Bulls will try to stop the price from closing any days below $87,000. If the bears manage a daily close below here, $84,000 support will be under heavy threat, and the bulls will need buyers to step up to the plate with some big volume to hold this support level once again.

Market mood: Bearish – After a weekly shooting star doji candle close, the bulls’ momentum has faded. The bears have tilted control slightly in their favor to start this week.

The next few weeks
Price action may remain choppy and confined within a range over the next few weeks. Bulls need to see a close above $94,000 to break above this range and look for upward momentum, while bears need to see a close below $84,000 to try to break down below this major support level. Between $94,000 and $84,000 is now a neutral zone, where bulls and bears may battle back and forth. Neither side is poised to take firm control of the price action until either of these boundaries is broken.

Terminology Guide:

Bulls/Bullish: Buyers or investors expecting the price to go higher.

Bears/Bearish: Sellers or investors expecting the price to go lower.

Support or support level: A level at which the price should hold for the asset, at least initially. The more touches on support, the weaker it gets and the more likely it is to fail to hold the price.

Resistance or resistance level: Opposite of support.  The level that is likely to reject the price, at least initially. The more touches at resistance, the weaker it gets and the more likely it is to fail to hold back the price.

Shooting Star Candle: A candlestick that occurs after an uptrend, marked by a long wick upwards above the candle body and a smaller wick (or no wick) to the downside. The long wick up indicates strong selling near the highs. This candle can often indicate the end of an uptrend.

Doji Candle: A candlestick that closes at nearly the same price at which it opened. This candle indicates indecision, and can signal a reversal in price action if it occurs after an uptrend or downtrend.

Fibonacci Retracements and Extensions: Ratios based on what is known as the golden ratio, a universal ratio pertaining to growth and decay cycles in nature. The golden ratio is based on the constants Phi (1.618) and phi (0.618).

This post Bitcoin Bears Hold $94K Resistance as Price Drops to $90,891 Weekly Close first appeared on Bitcoin Magazine and is written by Ethan Greene - Feral Analysis and Juan Galt.

Bitcoin Weekly Analysis: Momentum Builds Toward $98,000 Amid Neutral Mood

Bitcoin Magazine

Bitcoin Weekly Analysis: Momentum Builds Toward $98,000 Amid Neutral Mood

After remaining relatively sideways through the Christmas and New Year’s weeks, the bitcoin price made a small move higher over this past weekend. Bitcoin price closed the week at $91,489, just above the short-term resistance level at $91,400. If bulls can sustain above this level, they should take another run at the $94,000 resistance level this week, which has kept a lid on the price since mid-November. $98,000 is within reach this week as well.

Key Support and Resistance Levels Now

Bulls will try to carry some momentum into the New Year here and take out the $94,000 resistance level. Above $94,000, we have $98,000, where resistance really starts to pick up, and stretches from there all the way up to $103,500. This area is poised well to reject the price if it can climb above $94,000. $109,000 provides a likely final ceiling for the price that will be extremely tough to conquer. If the price gets above $109,000, we can start talking about potentially seeing new highs.

The bulls will want to hold support at $87,000 if the bears can manage to drive the price down there. $84,000 is still strong support below there, but it will weaken with further touches. If $84,000 support fails, we will look down to the $72,000 to $68,000 support zone as a strong level to produce a bounce.

Outlook For This Week

Sleepy bears have let up a little over the past few weeks. This week, the bulls will likely try to take advantage of this by continuing to push the price higher into the next resistance level, so look for the bulls to make another attempt at $94,000. $98,000 should keep a lid on things this week if bulls can manage to push past $94,000. If bulls fail to hold the $91,400 level this week, look for them to defend the $87,000 level to give themselves another attempt at getting above it and taking on $94,000 once again.

Market mood: Neutral – Bulls have managed to hold support levels over the past few weeks and have a bit of upward momentum this week. The bearish mood has softened to a more neutral level.

The next few weeks
The weekly chart has been sandwiched between the lower trend line of the broadening wedge above and the weekly 100 SMA below for several weeks now. One of them had to break, and for now, it is the trend line resistance that has eroded away to give the bulls a chance to push higher. Long-term bias is still bearish, however, so look for any bullish move to find a top over the coming weeks and come back down to test support at $87,000 to $84,000. Closing any weeks below $84,000 at this point will set bears up to drop the price down to the next support level in the low $70,000 range. On the upside, the bulls will need to sustain weekly closes above $100,000 to try to turn the long-term trend around.

Terminology Guide:

Bulls/Bullish: Buyers or investors expecting the price to go higher.

Bears/Bearish: Sellers or investors expecting the price to go lower.

Support or support level: A level at which the price should hold for the asset, at least initially. The more touches on support, the weaker it gets and the more likely it is to fail to hold the price.

Resistance or resistance level: Opposite of support.  The level that is likely to reject the price, at least initially. The more touches at resistance, the weaker it gets and the more likely it is to fail to hold back the price.

SMA: Simple Moving Average. Average price based on closing prices over the specified period. In the case of RSI, it is the average strength index value over the specified period.

Broadening Wedge: A chart pattern consisting of an upper trend line acting as resistance and a lower trend line acting as support. These trend lines must diverge away from each other in order to validate the pattern. This pattern is a result of expanding price volatility, typically resulting in higher highs and lower lows.

Fibonacci Retracements and Extensions: Ratios based on what is known as the golden ratio, a universal ratio pertaining to growth and decay cycles in nature. The golden ratio is based on the constants Phi (1.618) and phi (0.618).

This post Bitcoin Weekly Analysis: Momentum Builds Toward $98,000 Amid Neutral Mood first appeared on Bitcoin Magazine and is written by Ethan Greene - Feral Analysis and Juan Galt.

Bitcoin Price Outlook: Bulls Target $94,000 Break for Momentum Into New Year

Bitcoin Magazine

Bitcoin Price Outlook: Bulls Target $94,000 Break for Momentum Into New Year

Last week, bulls needed to hold closes above $85,000 to stave off the bears, and they managed to do just that. Bitcoin price dropped to support once again last week, and the bulls defended it well, pushing the price back up to close the week out at $88,656. The price on the weekly chart has been rejecting from the lower trend line of the broadening wedge pattern for several weeks now, but the trend line is so low now that the price should push above it this week. If it fails to do so this week, look for the price to take the next leg down into the low $70,000 range.

Bitcoin Price Outlook: Bulls Target $94,000 Break for Momentum Into New Year

Key Support and Resistance Levels Now

Bulls will want to continue the push this week, level by level if need be. Initial resistance sits at $91,400, with the next level at $94,000. Above here, we should see very strong resistance at $98,000. Then we should see a fairly strong resistance zone from $101,000 all the way up to $108,000. Closing above $108,000 would start to place severe doubts on the long-term top being in place here.

The $84,000 support level below is proving to be resilient, holding up again this past week. If it is lost, the expected support levels below have not changed. The $72,000 to $68,000 zone should be expected to support the price on a first test at the least. Closing below $68,000 likely leads to a slow grind down to the 0.618 Fibonacci retracement support at $57,000.

Bitcoin Price Outlook: Bulls Target $94,000 Break for Momentum Into New Year

Outlook For This Week

The bears may be getting a little flustered with their recent failure to break support. This week, look for the bulls to push back a bit harder as they gain some confidence after holding support once again. Market liquidity should be low for Christmas week, so price movement may be lacking. There are some very large long-dated bitcoin options expiring on December 26th, however, with a max pain price of $100,000, so look for the price to try to push closer to the $100,000 level this week.

Bitcoin Price Outlook: Bulls Target $94,000 Break for Momentum Into New Year

Market mood: Bearish – Bulls are pushing back a little here, but they still need to prove it to the bears with some positive price action.

The next few weeks
Bulls held back the bears from breaking down major support last week. If the bulls can finally manage to take out resistance at $94,000 over the next couple of weeks, they may be able to sustain some upward momentum into the new year as well. So if we see a weekly close above $94,000, look for the price to move towards $101,000. This momentum could continue to $108,000 with a close above $100,000. Resistance becomes extremely thick near this level, though, so a strong rejection near this level should be expected if we can make it there over the coming weeks.

Terminology Guide:

Bulls/Bullish: Buyers or investors expecting the price to go higher.

Bears/Bearish: Sellers or investors expecting the price to go lower.

Support or support level: A level at which the price should hold for the asset, at least initially. The more touches on support, the weaker it gets and the more likely it is to fail to hold the price.

Resistance or resistance level: Opposite of support.  The level that is likely to reject the price, at least initially. The more touches at resistance, the weaker it gets and the more likely it is to fail to hold back the price.

Broadening Wedge: A chart pattern consisting of an upper trend line acting as resistance and a lower trend line acting as support. These trend lines must diverge away from each other in order to validate the pattern. This pattern is a result of expanding price volatility, typically resulting in higher highs and lower lows.

Fibonacci Retracements and Extensions: Ratios based on what is known as the golden ratio, a universal ratio pertaining to growth and decay cycles in nature. The golden ratio is based on the constants Phi (1.618) and phi (0.618).

This post Bitcoin Price Outlook: Bulls Target $94,000 Break for Momentum Into New Year first appeared on Bitcoin Magazine and is written by Ethan Greene - Feral Analysis and Juan Galt.

Bitcoin’s Weekly Close Signals Imminent Drop Below $84,000 Toward $70,000 Floor

Bitcoin Magazine

Bitcoin’s Weekly Close Signals Imminent Drop Below $84,000 Toward $70,000 Floor

Bitcoin Price Weekly Outlook

Bitcoin price is looking lethargic heading into this week. Last week saw prices reject once again from the $94,000 resistance level. The bulls were not able to gain any momentum whatsoever as the price bled down into Sunday to close at $88,170. This week, the bears will look to break the $84,000 support level and take the price into the low $70,000 range. The bulls will desperately try to hold onto this $84,000 level as support, but it may not be able to survive another test.

Bitcoin's Weekly Close Signals Imminent Drop Below $84,000 Toward $70,000 Floor

Key Support and Resistance Levels Now

With the $84,000 support level again under pressure this week, the bears will look to finally drive the price down below it. There’s a small chance bulls may be able to defend $85,000, but it’s unlikely to hold here unless we see big buying volume step in. The $72,000 to $68,000 support zone below should be a solid floor on initial tests, so it would likely take a few weeks to break down through this level if we get there. Below here, bulls will look to hang onto the 0.618 Fibonacci retracement support at $57,000.

Up higher, we have a blanket of resistance now from $94,000 all the way up to $118,000. If bulls can manage to finally conquer $94,000, they will look to $101,000 next, although sellers should step in strongly above $97,000. Above $101,000, it should be a slow go all the way to $107,000. Even more buying pressure would be necessary above $107,000 to push through this thick zone all the way to $118,000. None of these levels seem attainable anytime soon with the current price action, however.

Outlook For This Week

Bitcoin’s weekly red candle close was not what the bulls wanted to see last week. The bears got a much-needed rest over the past few weeks and should see renewed strength this week. Look for the bears to attempt to break the $84,000 support level at some point this week, with bulls potentially trying to put in a bounce to maintain higher lows around the $87,000 to $85,000 area. If price drops below $84,000 this week, I would expect to see acceleration down to at least $75,000 and likely into the low $70,000 area.

Bitcoin's Weekly Close Signals Imminent Drop Below $84,000 Toward $70,000 Floor

Market mood: Extremely Bearish – Bulls had some time to try to push the price above short-term support over the last couple of weeks and failed to do so. The bears are in control and should be well rested for renewed selling strength to the downside.

The next few weeks
Sellers received a much-needed break over the past few weeks, while buyers were only able to pause the bearish momentum. Bears should take advantage here to take out the $84,000 support level. In the next few weeks, look for the support zone in the $72,000 to $68,000 area to be hit. However, we should see a strong bounce from this area after an initial test. So if this zone is touched, look for price to at least re-test the $84,000 level from down there, with potential for an even stronger bounce. This zone is a potential area for a reversal out of the bear market, but if the “4-Year Cycle” holds true, then the price would likely test lower later into 2026.

Bitcoin's Weekly Close Signals Imminent Drop Below $84,000 Toward $70,000 Floor

Terminology Guide:

Bulls/Bullish: Buyers or investors expecting the price to go higher.

Bears/Bearish: Sellers or investors expecting the price to go lower.

Support or support level: A level at which the price should hold for the asset, at least initially. The more touches on support, the weaker it gets and the more likely it is to fail to hold the price.

Resistance or resistance level: Opposite of support.  The level that is likely to reject the price, at least initially. The more touches at resistance, the weaker it gets and the more likely it is to fail to hold back the price.

Fibonacci Retracements and Extensions: Ratios based on what is known as the golden ratio, a universal ratio pertaining to growth and decay cycles in nature. The golden ratio is based on the constants Phi (1.618) and phi (0.618).

This post Bitcoin’s Weekly Close Signals Imminent Drop Below $84,000 Toward $70,000 Floor first appeared on Bitcoin Magazine and is written by Ethan Greene - Feral Analysis and Juan Galt.

❌