Ukrainian forces have destroyed an Iranian-made Shahed-107 attack drone using a STING interceptor drone during active combat operations, according to a report by the Ukrainian defense outlet Militarniy. The interception was carried out by fighters from the Sky Wars unit of the 47th Mechanized Brigade “Magura,” who used the STING drone interceptor to shoot down […]
Bitcoin is trading below the $90,000 level once again, as the market continues to drift through a phase defined by indecision, rising caution, and growing fear. After repeated failures to reclaim this psychological threshold, price action has started to reflect a lack of conviction on both sides, with buyers hesitating to step in aggressively and sellers pressing every rebound attempt. While the broader trend has not fully collapsed, the inability to hold key levels is increasing uncertainty around Bitcoin’s next major move.
Top analyst Darkfost argues that on-chain signals are starting to mirror conditions typically seen near the end of prolonged drawdowns. According to his analysis, Bitcoin’s unrealized profits and losses are sliding back toward levels that have historically appeared only at the exit of bear markets, when the market has already absorbed a deep reset in sentiment. This shift suggests that stress is building under the surface, even if price has not yet entered a full capitulation phase.
Since Bitcoin’s last all-time high, Darkfost notes that many late-arriving investors have moved into uncomfortable territory, facing mounting downside pressure as the market cools. As a result, unrealized profits are shrinking, unrealized losses are expanding, and the overall balance continues to deteriorate—an environment that often forces traders into a decisive choice between holding through volatility or exiting under stress.
Decision Point For Bitcoin Investors
Darkfost highlighted a chart based on an adjusted version of NUPL (Net Unrealized Profit/Loss), designed to capture investor stress more accurately during shifting market regimes. Instead of relying solely on the standard market cap, the model incorporates the realized capitalization of both Short-Term Holders (STHs) and Long-Term Holders (LTHs), then compares that blended realized foundation against Bitcoin’s traditional market cap.
The result is a clearer view of how much profit or loss sits “on paper” across the market, filtered through a more structural lens. To reduce noise and better define trend shifts, the metric is smoothed using an average, producing what Darkfost refers to as aNUPL.
The key takeaway is that Bitcoin is approaching levels that have historically forced investors into a binary decision. When unrealized profits compress and unrealized losses expand to these ranges, holders typically face two outcomes: hold and continue accumulating, or capitulate and lock in losses. That difference in behavior becomes critical because it shapes liquidity, sentiment, and the next directional trend.
If long-term participants absorb the pressure and keep holding, the market can stabilize and rotate back into recovery. But if selling accelerates from stressed cohorts, the decline can deepen into a broader bear phase. This is why tracking realized and unrealized profit dynamics remains essential, especially during periods of uncertainty.
Bitcoin Consolidates After Sharp Weekly Breakdown
Bitcoin is trading around $89,000 on the weekly chart after a steep selloff that pushed the price out of its prior distribution zone. The latest candle reflects heavy downside pressure, with BTC dropping roughly 4.8% on the week and struggling to stabilize near a key pivot that has repeatedly acted as support and resistance throughout the cycle.
After failing to hold above the psychological $90,000 threshold, the market is now trapped in a tight consolidation range, suggesting traders are waiting for confirmation before committing to a larger move.
From a trend standpoint, Bitcoin remains vulnerable as it trades below the blue moving average, which is now acting as overhead resistance near the low-$100K region. The rejection from that dynamic level aligns with the broader structure: BTC topped near the mid-$120K range, then entered a sharp corrective leg that reset momentum into early 2026. While the green moving average continues to slope upward and is approaching the current price zone, the market has not yet shown the strength needed to reclaim its former trend trajectory.
Importantly, the weekly structure is now compressing. If buyers can defend the $88K–$90K region and push BTC back above $92K–$95K, it would signal a recovery attempt toward the moving average band. However, a sustained failure here increases the risk of a deeper retracement toward the low-$80K zone, where prior demand previously emerged.
Featured image from ChatGPT, chart from TradingView.com
Mark Griffith — Amazon employee No. 1,037 and the third hire for what would become Fulfillment by Amazon — is retiring after more than two decades with the Seattle-area tech giant.
Griffith spent most of his career at FBA, which handles shipping, customer service, and returns for third-party businesses. He was director of software engineering for FBA and then for Amazon payments. His final role was director of seller fulfillment services.
Griffith penned a lengthy reflection on Substack in which he shares his career journey, what he learned from working at the company, and pithy personal and professional advice.
“I have given my ALL to Amazon for 8 hours+ a day for a long time – but I’ve never given it everything – that is too dangerous – I don’t live to work – I work to live. I work hard; I try to work empathetically and smart and help others – but I am ready to let others carry on,” Griffith said.
Vinay Kumar. (DigitalOcean Photo)
— DigitalOcean named Vinay Kumar as chief product and technology officer of the infrastructure-as-a-service company. Kumar, based in Seattle, was previously with Oracle for more than 11 years, leaving the role of senior vice president of cloud engineering.
Paddy Srinivasan, CEO of DigitalOcean, highlighted Kumar’s experience building cloud and AI platforms at scale, his “tremendous product strategy acumen” and his understanding of the “operational rigor required for mission-critical workloads.”
Chris Hundley. (LinkedIn Photo)
— Chris Hundley has joined Seattle RFID tech company Impinj as executive VP of enterprise solutions.
“Impinj has built an incredible foundation as the market leader in RAIN RFID, with strong momentum helping businesses wirelessly connect billions of items across use cases including loss prevention, shipment verification, and asset management,” Hundley said on LinkedIn.
Hundley is the founder and former CEO of the marketing automation startup Siftrock, which was acquired by Drift in 2018. He was also chief technology officer and president of AudioEye, which aimed to make digital technology inclusive for people with disabilities.
Lindsay Bayne. (LinkedIn Photo)
— Lindsay Bayne is now senior director of advocacy at UiPath, a New York-based company that helps businesses automate repetitive, complex tasks.
Bayne was previously at Microsoft for more than a decade, leaving the role of director of the Growth Innovation and Strategy Team.
“I’m honored to join and partner with this incredibly talented team, advocate for our incredible customers, and help showcase the real-world impact of automation and AI,” Bayne said on LinkedIn.
Christin Camacho. (LinkedIn Photo)
— Christin Camacho is now head of go-to-market for BuildQ, an AI platform for clean energy development and due diligence. Camacho joins the company following nearly seven years at LevelTen Energy, a Seattle-based clean energy marketplace, where she served as vice president of marketing. She previously worked at Redfin.
“BuildQ’s AI accelerates every stage of development for large wind, solar, and storage projects. Ultimately, that means more clean energy projects get built, faster, and that’s a mission I’ve dedicated my career to,” Camacho said via email.
In her new role, Camacho will work with Maryssa Barron, a former LevelTen colleague and founder and CEO of BuildQ.
— Lowell Bander, founding general manager of Seattle’s 9Zero, is changing roles at the climate tech entrepreneurial hub. Bander is taking the title of ecosystem advisor as the organization looks for a new leader. Bander is also an advisor on Seattle Mayor Katie Wilson’s transportation and environment transition team.
— Nate Frazier is now community liaison for the Oregon AI Accelerator. The Portland organization aims to coordinate the state’s entrepreneurial groups, investors and universities to foster AI innovation.
— The Seattle Hub for Synthetic Biology has named the first cohort for its SeaBridge Fellowship, a research training program. In March, the effort received a $10 million grant from the Washington Research Foundation. The scientists will receive two years of financial support plus funding for career development, mentorship training and networking. They include:
Changho Chun, a postdoctoral scholar in the University of Washington’s Department of Rehabilitation Medicine who is doing research that could aid in treating ALS (Lou Gehrig’s disease).
Ian Linde, a postdoc in the Public Health Sciences Division at Fred Hutch Cancer Center studying the conditions under which gene mutations lead to breast cancer tumors.
Abigail Nagle, a postdoc in the UW Department of Laboratory Medicine and Pathology investigating communications between connective tissue and heart muscle tissue.
Stephanie Sansbury, a postdoc in the UW Department of Biochemistry and Institute for Protein Design researching processes around engineered protein nanoparticles in pursuit of therapeutics.
Zachary Stevenson, a postdoc in the UW Department of Genome Sciences studying synthetic cellular circuits to broaden the scope of cell programming.
Julie Trolle, a postdoc in the UW Department of Genome Sciences aiming to engineer cancer-fighting T cells that express multiple genes, thereby improving their ability to kill tumor cells.
Arata Wakimoto, a postdoc in the UW Department of Obstetrics & Gynecology investigating embryonic development as relates to congenital spine and neural tube disorders.
Rachel Wellington, a postdoc in Translational Science and Therapeutics Division of Fred Hutch researching cellular recording technologies in the differentiation of stem cells.
Ethereum is once again under pressure as it struggles to regain solid ground around the $3,000 level, reflecting a broader wave of uncertainty across the crypto market. With sentiment turning increasingly fragile, many altcoins remain stuck in corrective mode, and bulls are now forced to defend key support zones to prevent deeper downside. In this environment, Ethereum’s ability to push higher is becoming a critical signal for whether the market can stabilize or if the current bearish trend will extend.
Despite the weakness, on-chain data suggests that ETH may be nearing an important turning point. According to CryptoQuant, Ethereum is approaching a major support line that has historically acted as a strong floor during periods of heavy volatility.
The report highlights that the realized price of Ethereum accumulation addresses continues to climb and is now approaching the current market price, indicating that long-term accumulation remains active even as short-term traders hesitate.
This dynamic matters because accumulation-based cost levels often represent zones where large investors defend their positions aggressively. If ETH holds above this rising support range, the market may be setting the foundation for a broader recovery.
Ethereum Whale Cost Basis Signals a Potential Bottom Zone
CryptoQuant’s report suggests Ethereum may be approaching one of its most important structural support zones, anchored by the realized price of accumulation addresses. This metric tracks the average on-chain cost basis of entities that consistently accumulate ETH, and it often behaves as a “defense line” for whales who build long-term positions.
According to the analysis, this realized price level has historically acted as a reliable floor, with Ethereum never breaking below this range during prior drawdowns, even when broader market conditions turned sharply risk-off.
That historical behavior matters because it implies that accumulation whales tend to protect their cost basis aggressively, either by adding exposure near support or by reducing sell pressure when the price approaches their entry zone. In practice, this can limit downside momentum and create a stabilization area where volatility compresses before the next trend decision.
Based on the current trajectory, the report argues that even if ETH sees another leg down, the most probable “bottom zone” sits near $2,720. From current levels, that would represent an additional pullback of roughly 7%, keeping the move within a controlled correction rather than a full breakdown. If buyers defend this area, Ethereum could begin rebuilding a base for a renewed push back above $3,000.
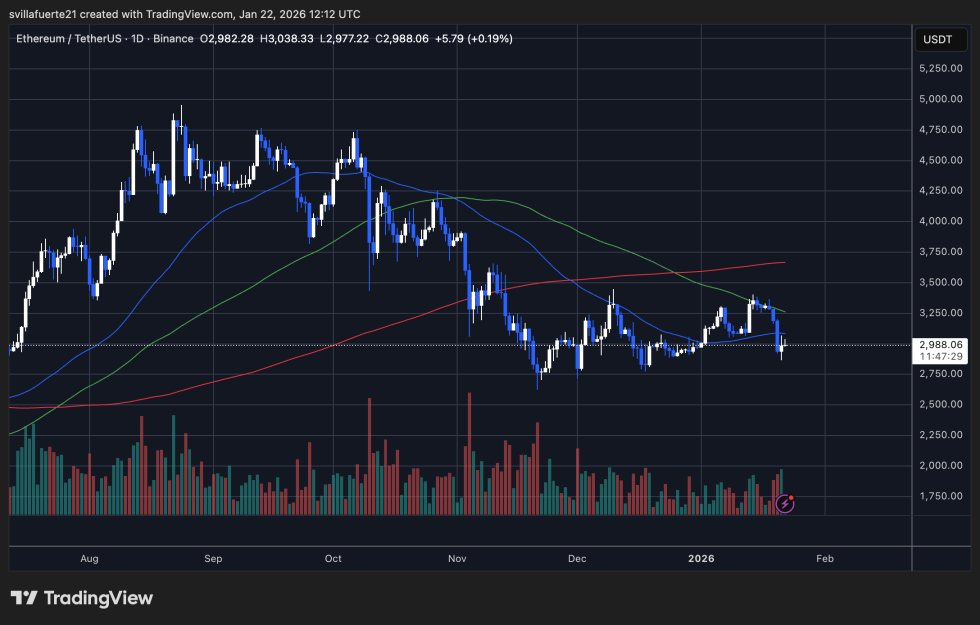
ETH Price Slips Back Toward $3,000 As Bulls Struggle To Reclaim Control
Ethereum (ETH) continues to trade under heavy pressure as price struggles to stabilize around the $3,000 zone. The chart shows ETH printing another sharp rejection after failing to hold the recent rebound, reinforcing that the market remains in a corrective phase rather than a clean recovery. Even though buyers are attempting to defend current levels, momentum still looks weak, with each bounce being met by renewed selling.
From a technical perspective, ETH is trading below its key moving averages, which highlights how resistance continues to stack above the price. The broader structure suggests a downtrend that is transitioning into consolidation, but without a confirmed breakout, the risk remains tilted to the downside.
The recent push toward the mid-$3,200 region failed to flip that zone into support, and the pullback toward $2,980 signals that bulls are still struggling to build sustainable demand.
Volume remains relatively muted compared to the larger selloffs seen earlier in the cycle, which supports the idea that this is a grinding distribution phase rather than full panic capitulation. For a bullish shift, ETH needs to reclaim $3,200–$3,300 and hold above it. Until then, the $2,900–$3,000 area remains the key line of defense.
Featured image from ChatGPT, chart from TradingView.com
Although already having entered the territory of ‘retro gaming’, the Sony PlayStation 3 remains a notoriously hard to emulate game console. Much of this is to blame on its unique PowerPC-based Cell processor architecture, which uses a highly parallel approach across its asymmetric multi-core die that is very hard to map to more standard architectures like those in today’s x86 and ARM CPUs. This makes it even more amazing that the RPCS3 emulator team has now crossed the 70% ‘playable’ threshold on their compatibility list.
This doesn’t mean that you can fire up these games on any purported ‘gaming system’, as the system requirements are pretty steep. If you want any kind of enjoyable performance the recommended PC specifications feature an Intel 10th generation 6-core CPU, 16 GB of dual-channel RAM and a NVIDIA RTX 2000 or AMD RX 5000 series GPU or better.
It should be noted here also that the ‘playable’ tag in the compatibility list means that the game can be completed without game breaking glitches. Performance remains an issue, with very creative optimizations through e.g. the abuse of x86 SIMD instructions remaining the topic of research by the emulator developers. Yet as original PS3 hardware gradually becomes less available, the importance of projects like RPCS3 will become more clear.
And how a more advanced approach changed the way I trade momentum, breakouts, and liquidity
Volume is one of the most widely used metrics in trading. Every crypto trader, from beginner to professional, has stared at the green and red bars under their chart trying to decode market intent.
But here’s the uncomfortable truth:
Most traders are reading the wrong volume. Or worse — they’re reading it in the wrong context.
This is especially true when it comes to the popular Daily 24h Volume indicator. You’ve probably seen it on exchanges like Binance, Bybit, OKX — and on TradingView indicators that attempt to emulate it.
And while the metric sounds intuitive (“how much volume traded in the last 24h”), it’s often misunderstood and misapplied in live trading.
In this article, I want to break down:
Why many traders rely on Daily 24h Volume Indicator
What its conceptual weaknesses are
How it differs from standard bar-by-bar volume
A clear comparison between the two
And how these insights led me to build a customized, more actionable volume engine that I personally use
Let’s start with the basics.
1. Why Traders Use Daily 24h Volume Indicator
At the bottom, the 24-hour volume is highlighted in red, compared to the standard volume indicator above.
Daily 24h Volume Indicator is attractive because:
It reflects overall market participation
It updates continuously and shows exchange-wide liquidity
It gives a sense of the asset’s current “activity level”
For example:
If 24h volume is rising → traders assume interest is growing
If 24h volume is dropping → traders assume liquidity is drying up
It’s a macro-level liquidity gauge.
But here’s the problem:
Daily 24h volume does NOT tell you what’s happening right now on your candle. It tells you what happened in the past day, smoothed into one enormous rolling window. This introduces several pitfalls.
2. The Weaknesses of Daily 24h Volume (Why It Misleads Traders)
Weakness 1 — It’s a rolling metric, not a per-bar signal
Daily 24 volume cannot show momentum shifts inside a candle. You might think volume is increasing… But it’s actually just updating the rolling window.
Weakness 2 — It hides individual bar structure
It blends all buy/sell pressure, spikes, and micro-movements into one big number.
You miss:
Who is in control (buyers or sellers)
Strength of candle body
Wick dominance
Volume spikes on breakouts
Weakness 3 — It reacts slowly
Because it covers the full 24h window, it behaves like a moving average:
Big events fade slowly
Sudden surges barely move the line
It lags on market turns
Weakness 4 — Traders assume it reflects “current volume”
But the bar forming RIGHT NOW could have:
Huge actual volume
But Daily 24 barely moves
— or —
Very small actual volume
But Daily 24 stays high from past candles
This disconnect confuses decision-making.
3. Standard Volume vs Daily 24 Volume — Conceptual Differences
Below is a simplified comparison to set things straight.
In short:
Daily 24h volume is liquidity context.
Per-bar volume is actionable information.
Most traders mix these two concepts — and get confused signals as a result.
4. Why I Built My Own Volume Indicator
After years of active crypto trading, I realized I needed:
Something as reliable as per-candle volume
Something as informative as exchange 24h volume
Something that actually helps predict breakouts and momentum shifts
Something that reflects real buying/selling pressure, not just bar color
Something that filters noise and highlights meaningful spikes
This led me to develop the Advanced Volume Suite — a tool that merges the strengths of both worlds:
Exchange-style liquidity
Real-time actionable volume signals
Momentum detection
Spike identification
Breakout confirmation
It’s the volume engine I personally use in my trading, and now I’m sharing it publicly.
The next section describes how it works.
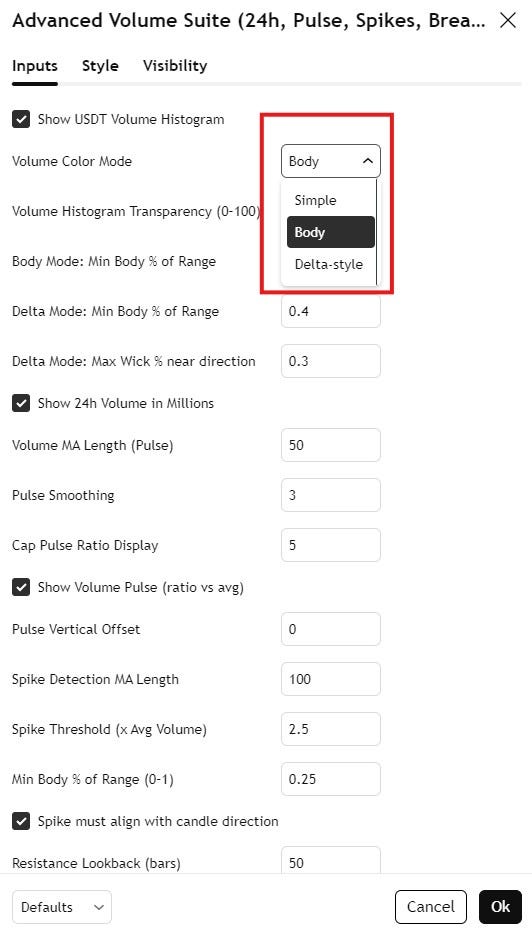
5. Introducing a complete professional toolkit for reading true market volume, momentum, and liquidity: Advanced Volume Suite (24h, Pulse, Spikes, Breakout Pressure)
🔍 What This Indicator Does
The Advanced Volume Suite is a multi-layered volume analysis system designed for traders who rely on volume as a primary decision driver. It expands far beyond TradingView’s standard volume bars by adding:
✔ True USDT Volume
All volume is converted into USDT value (volume × close) to normalize activity across increasing or decreasing prices.
✔ Rolling 24-Hour Volume (Exchange-style metric)
The indicator calculates a custom 24h rolling volume, just like Binance and Bybit display.
✔ Volume Pulse (Strength vs Average)
A powerful ratio that measures momentum inside each bar.
The meaning of Inception’s ending famously revolves around a top which spins forever in dreams, but in real life comes to a stop like any other top. Any other top, that is, except for [Aaed Musa]’s self-spinning top, which can continuously spin for about two hours before coming to a stop.
The one constraint was that every functional component had to be contained within the top’s shell, and [Aaed]’s first approach was to build a reaction wheel into the top. When a motor accelerates a weighted wheel, conservation of angular momentum applies an equal and opposite torque to the motor. The problem is that motors eventually reach a top speed and stop accelerating, which puts an end to the torque. This is known as saturation, and the only way to desaturate a reaction wheel is to slow it down, which counteracts the originally generated torque. [Aaed] originally planned to mount the motor in a one-way bearing, which would let it bleed off speed without producing torque against the rest of the top, but it was rather choppy in practice.
The solution occurred to [Aaed] while watching the aforementioned final scene, when it occurred to him that the wobbling of a top could actually generate rotation. A prototype proved that an off-center weight rotating at a constant speed did successfully spin the top by rotating the center of mass, and after that, it was a matter of incremental testing and improvement. A higher moment of inertia worked better, as did a lower center of gravity and a tip made from a hard, low-friction silicon nitride ball bearing. He made housings out of both 3D-printed plastic and CNC-milled aluminium, which each contained a tiny brushless motor, an electric speed controller, a microcontroller, and a small rechargeable lithium battery.
If you allow for external power, you can make the top itself the rotor of a motor, and drive it from a base. Alternatively, if you levitate your top in a vacuum, it could spin for longer than recorded history.
Preparations for Next Moonwalk Simulations Underway (and Underwater)
NASA’s X-59 quiet supersonic research aircraft flies above Palmdale and Edwards, California, during its first flight Oct. 28, 2025, accompanied by a NASA F/A-18 research aircraft serving as chase.
NASA/Jim Ross
As NASA’s X-59 quiet supersonic research aircraft continues a series of flight tests over the California high desert in 2026, its pilot will be flying with a buddy closely looking out for his safety.
That colleague will be another test pilot in a separate chase aircraft. His job as chase pilot: keep a careful watch on things as he tracks the X-59 through the sky, providing an extra set of eyes to help ensure the flight tests are as safe as possible.
Having a chase pilot watch to make sure operations are going smoothly is an essential task when an experimental aircraft is exercising its capabilities for the first time. The chase pilot also takes on tasks like monitoring local weather and supplementing communications between the X-59 and air traffic control.
“All this helps reduce the test pilot’s workload so he can concentrate on the actual test mission,” said Jim “Clue” Less, a NASA research pilot since 2010 and 21-year veteran U.S. Air Force flyer.
Less served as chase pilot in a NASA F/A-18 research jet when NASA test pilot Nils Larson made the X-59’s first flight on Oct. 28. Going forward, Less and Larson will take turns flying as X-59 test pilot or chase pilot.
NASA pilots Jim “Clue” Less (left) and Nils Larson celebrate the X-59’s first flight on Oct. 28, 2025. Less flew an F-18 chase aircraft while Larson flew the X-59.
NASA/Genaro Vavuris
Staying Close
So how close does a chase aircraft fly to the X-59?
“We fly as close as we need to,” Less said. “But no closer than we need to.”
The distance depends on where the chase aircraft needs to be to best ensure the success of the test flight. Chase pilots, however, never get so close as to jeopardize safety.
We fly as close as we need to, but no closer than we need to.
Jim "clue" LESS
NASA Test Pilot
For example, during the X-59’s first flight the chase aircraft moved to within a wingspan of the experimental aircraft. At that proximity, the airspeed and altitude indicators inside both aircraft could be compared, allowing the X-59 team to calibrate their instruments.
Generally, the chase aircraft will remain about 500 and 1,000 feet away—or about 5-10 times the length of the X-59 itself—as the two aircraft cruise together.
“Of course, the chase pilot can move in closer if I need to look over something on the aircraft,” Less said. “We would come in as close as needed, but for the most part the goal is to stay out of the way.”
Airborne Photo Op
In a view captured from a NASA F/A-18 chase aircraft, the X-59 quiet supersonic research aircraft lifts off for its first flight Oct. 28, 2025, from U.S. Air Force Plant 42 in Palmdale, California.
NASA/Lori Losey
The up-close-and-personal vantage point of the chase aircraft also affords the opportunity to capture photos and video of the test aircraft.
For the initial X-59 flight, a NASA photographer—fully trained and certified to fly in a high-performance jet—sat in the chase aircraft’s rear seat to record images and transmit high-definition video down to the ground.
“We really have the best views,” Less said. “The top focus of the test team always is a safe flight and landing. But if we get some great shots in the process, it’s an added bonus.”
Chase aircraft can also carry sensors that gather data during the flight that would be impossible to obtain from the ground. In a future phase of X-59 flights, the chase aircraft will carry a probe to measure the X-59’s supersonic shock waves and help validate that the airplane is producing a quieter sonic “thump,” rather than a loud sonic boom to people on the ground.
The instrumentation was successfully tested using a pair of NASA F-15 research jets earlier this year.
As part of NASA’s Quesst mission, the data could help open the way for commercial faster-than-sound air travel over land.
Choice of Chase Aircraft
A NASA F-15 aircraft sits 20 feet off the left side of the X-59 aircraft, with a white hangar and hills in the background, during electromagnetic interference testing.
NASA/Carla Thomas
Chase aircraft have served as a staple of civilian and military flight tests for decades, with NASA and its predecessor—the National Advisory Committee for Aeronautics—employing aircraft of all types for the job.
While both types are qualified as chase aircraft for the X-59, each has characteristics that make them appropriate for certain tasks.
The F/A-18 is a little more agile flying at lower speeds. One of NASA’s F/A-18s has a two-seat cockpit, and the optical quality and field of view of its canopy makes it the preferred aircraft for Armstrong’s in-flight photographers.
At the same time, the F-15 is more capable of keeping pace with the X-59 during supersonic test flights and carries the instrumentation that will measure the X-59’s shock waves.
“The choice for which chase aircraft we will use for any given X-59 test flight could go either way depending on other mission needs and if any scheduled maintenance requires the airplane to be grounded for a while,” Less said.
About the Author
Jim Banke
Managing Editor/Senior Writer
Jim Banke is a veteran aviation and aerospace communicator with more than 40 years of experience as a writer, producer, consultant, and project manager based at Cape Canaveral, Florida. He is part of NASA Aeronautics' Strategic Communications Team and is Managing Editor for the Aeronautics topic on the NASA website.
After years of design, development, and testing, NASA’s X-59 quiet supersonic research aircraft took to the skies for the first time on Oct. 28, 2025, markin...
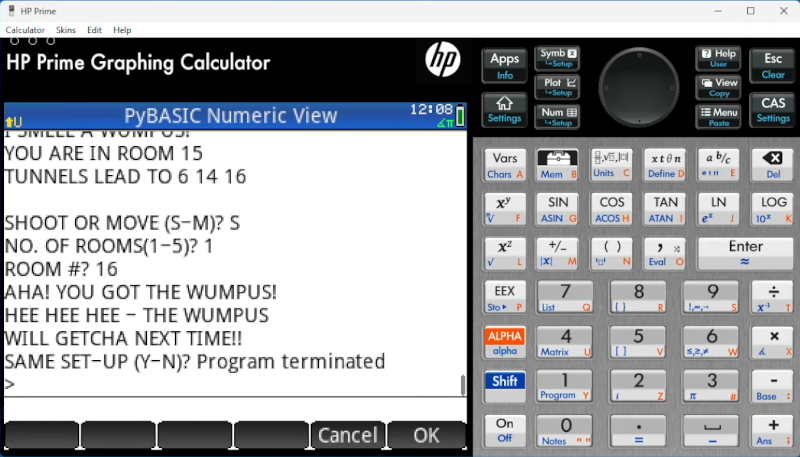
We are always amused that we can run emulations or virtual copies of yesterday’s computers on our modern computers. In fact, there is so much power at your command now that you can run, say, a DOS emulator on a Windows virtual machine under Linux, even though the resulting DOS prompt would probably still perform better than an old 4.77 MHz PC. Remember when you could get calculators that ran BASIC? Well, [Calculator Clique] shows off BASIC running on a decidedly modern HP Prime calculator. The trick? It’s running under Python. Check it out in the video below.
Think about it. The HP Prime has an ARM processor inside. In addition to its normal programming system, it has Micropython as an option. So that’s one interpreter. Then PyBasic has a nice classic Basic interpreter that runs on Python. We’ve even ported it to one or two of the Hackaday Superconference badges.
If you have a Prime, this is a great way to make it even easier to belt out a simple algorithm. Of course, depending on your age, you might prefer to stick with Python. Fair enough, but don’t forget the many classic games available for Basic. Adventure and Hunt the Wumpus are two of the sample programs included.
If you ever built a line following robot, you’ll be nostalgic about [Jeremy’s] light-seeking robot. It is a very simple build since there is no CPU and, therefore, also no software.
The trick, of course, is a pair of photo-sensitive resistors. A pair of motors turns the robot until one of the sensors detects light, then moves it forward.
This is a classic beginner project made even easier with a 3D printer and PCB to hold the components. You might consider using an adjustable resistor to let you tune the sensitivity more easily. In addition, we’ve found that black tubes around the light sensors in this sort of application give you a better directional reading, which can help.
The robot only has two wheels, but a third skid holds the thing up. A freely-rotating wheel might work better, but for a simple demonstration like this, the skid plate is perfectly fine.
This is a good reminder that not every project has to be fantastically complex or require an RTOS and high-speed multi-core CPUs. You can do a lot with just a handful of simple components.
If you want to follow a line, the basic idea is usually the same, with perhaps some different sensors. Usually, but not always.
A projector is one of the few upgrades that can make your living room feel completely different overnight. Not “slightly better,” but “how is this my house?” different—especially when you start talking about a screen size up to 200 inches. The XGIMI HORIZON Ultra 4K projector is down to $998.99, a 41% discount from $1,699.99. […]
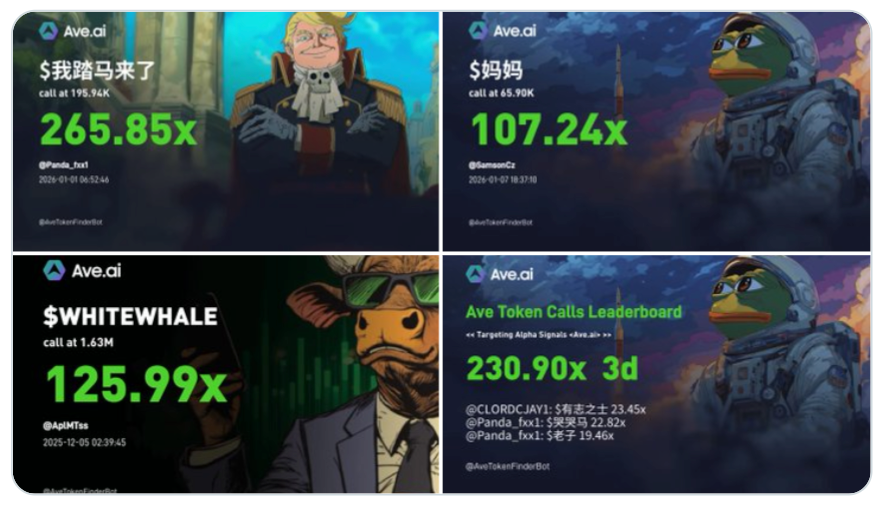
In the first weeks of 2026, the crypto market wasn’t just watching price charts — it was watching capital flows. A bold signal arrived from the BNB ecosystem: the BNB Chain Foundation quietly deployed $200,000 across four Chinese meme tokens. This wasn’t a meme joke — it was a strategic allocation that reveals how narrative-driven capital is reshaping liquidity and trading dynamics on BNB Chain.
For alpha-hungry traders, this marks one of the earliest institutional signals of on-chain narrative adoption — and a moment when smart tools matter more than ever.
BNB Chain’s $200K Meme Coin Allocation — More Than Just Buzz
What Happened
Over a short window, on-chain data shows the BNB Chain Foundation executed buys roughly like this:
These aren’t random picks — they are culturally resonant, community-driven tokens with strong narrative identities within the Chinese crypto space.
Why This Matters
From a market-structure standpoint:
Institutional capital engaging meme narratives unlocks new liquidity vectors Institutions historically avoided memetic assets due to volatility and lack of fundamentals. This allocation suggests narrative conviction has matured to the point where capital is deployed not just for hype — but for early flow capture.
Narrative adoption attracts attention and volume very quickly Narrative and social engagement are now core drivers of on-chain liquidity. As traders recognize patterns, rotational flows tend to accelerate — drawing more traders into these ecosystems.
BNB Chain is reinforcing itself as a narrative + liquidity hub Meme coins drive network activity, which improves fees, turnover, and market depth. For BNB Chain, this is good for long-term token velocity and utility.
Memecoin Rotations Are Now a Predictable Market Force
Historically, memecoins were unpredictable. But in 2026, patterns are emerging:
Narrative → Social Buzz → On-Chain Flow → Price Movement
Ceiling tests and liquidity migrations are more likely when capital moves early.
Institutional or foundation allocations often preface retail interest spikes.
These patterns create actionable windows for traders — if they can spot them before the crowd reacts. That’s where the next generation of tools matters.
Why Most Platforms Lag Behind
Centralized exchange charts show price after it has moved — too late for alpha plays.
Traditional on-chain dashboards show raw data — but without context or pattern recognition.
And social tools gauge chatter — often after narratives have peaked.
For real edge in fast narrative markets, traders need something that fuses on-chain signals with narrative momentum — and surfaces it before others do.
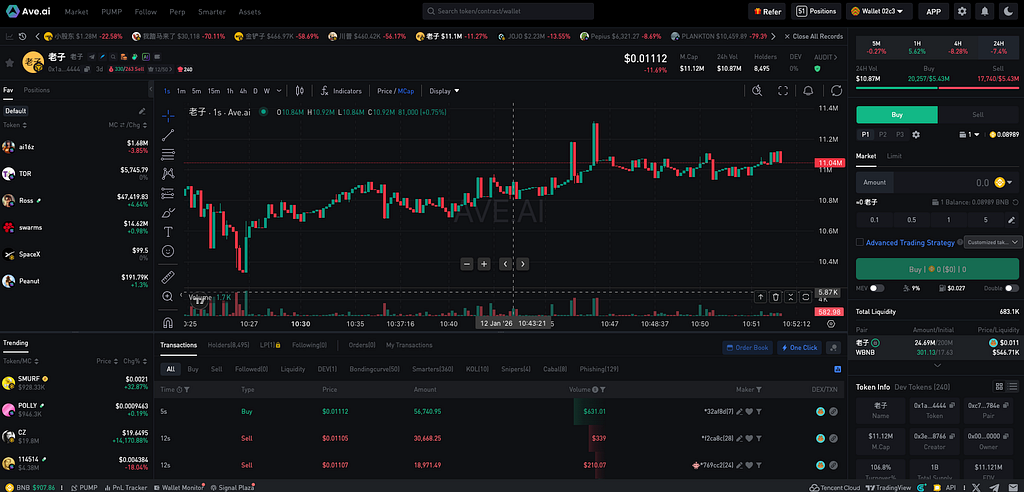
Enter Ave.ai — Your Trading Edge in Meme-Driven Markets
When markets move fast, traders need tools that move faster.
Ave.ai isn’t just another analytics dashboard — it’s an AI-powered alpha detection engine. Here’s why it matters for navigating BNB Chain and meme coin rotations:
1. Early Narrative Discovery, Before Price Spikes
Ave.ai monitors:
Emerging memecoin narratives
Wallet accumulation patterns
Liquidity shifts before major volume spikes
Real-time cultural sentiment signals
Instead of explaining price after it moved, Ave.ai reveals signals before markets catch up.
2. Cross-Layer Signal Fusion
Where others silo data sources, Ave.ai intelligently correlates:
This means Ave.ai interprets signals based on meaningful patterns — not noise.
3. Filters for High-Probability Setups
In meme markets, noise is the enemy of alpha. Not all spikes become sustainable moves — but Ave.ai’s filters help you:
Prioritize tokens with authentic volume growth
Spot liquidity migrations before listings
See where institutional or foundation money is flowing
Detect narrative arcs early
This helps traders conserve capital, avoid false alarms, and focus on setups with stronger risk–reward.
How Traders Can Position Around This Signal
Here’s a practical playbook based on the BNB Foundation allocation pattern:
Step 1 — Watch Institutional Flow
Use Ave.ai to track foundation or smart wallet buys that precede broader retail flows.
Step 2 — Confirm Narrative Momentum
Check social sentiment spikes before volume surges — not after.
Step 3 — Confirm Early Liquidity Moves
Look for rising liquidity on DEX pairs on BNB Chain before price breakout.
Step 4 — Execute with Precision
Alpha trades often close quickly — so entry/exit signals matter. Ave.ai’s FAST watchlists and alerts are built for these micro-windows.
The Macro Implication: Meme Coins Are Structural, Not Accidental
The era of memecoins as “unpredictable outliers” is ending.
Today’s narrative-driven assets are:
Data-trackable
Pattern-identifiable
Capitalized by institutional allocators
Fueled by cross-border community participation
BNB Chain’s strategic bet — captured early — is signaling that narrative markets are now part of the crypto infrastructure.
Conclusion: Narrative Moves Capital — But Tools Capture Alpha
When capital shifts early onto narrative tokens — especially with institutional or foundation participation — the market begins to follow. But where and when it follows is key.
That’s where Ave.ai stands apart:
AI-assisted narrative discovery
On-chain + sentiment signal fusion
Actionable alpha detection before prices move
Designed for fast meme coin rotations on chains like BNB
In a market where timing is everything, Ave.ai gives you a front-row seat — and the fastest route to alpha.
Ready to elevate your trading experience? Try Ave AI now:
Disclaimer: This blog post is for informational purposes only and does not constitute financial advice. Cryptocurrency trading involves significant risk. Always conduct your own research before making any investment decisions.
A Ukrainian defense company, CENTRE ZAKHYST, has announced the successful development and combat testing of its ODIN counter-unmanned aerial systems, a domestically produced solution designed to intercept attack drones, according to a statement released by the company. CENTRE ZAKHYST said the system has been implemented in combat conditions and tested both at training grounds and […]
For switching high-powered loads from a microcontroller, or for switching AC loads in general, most of us will reach into the parts bin and pull out a generic relay of some sort. Relays are fundamental, proven technologies to safely switch all kinds of loads. They do have their downsides, though, so if you need silent operation, precise timing, or the ability to operate orders of magnitude more times you might want to look at a triac instead. These solid state devices can switch AC loads unlike other transistor-based devices and [Ray] at OpenSprinkler is here to give us an overview on how to use them.
The key to switching an AC load is bi-directional conductivity. A normal transistor or diode can only conduct in one direction, so if you try to switch an AC load with one of these you’ll end up with what essentially amounts to a bad rectifier. Triacs do have a “gate” analogous to the base of a bipolar junction transistor, but the gate will trigger the triac when current flows in either direction as well. The amount of current needed to trigger the triac does depend on the state of the switched waveform, so it can be more complex to configure than a relay or transistor in some situations.
After going through some of the theory around these devices, [Ray] demonstrates how to use them with an irrigation system, which are almost always operating on a 24VAC system thanks to various historical quirks. This involves providing the triacs with a low voltage source to provide gate current as well as a few other steps. But with that out of the way, switching AC loads with triacs can become second nature. If you prefer a DC setup for your sprinklers, though, [vinthewrench] has demonstrated how to convert these sprinkler systems instead.
[Dr Ali Shirsavar] from Biricha Digital runs us through How to Select the Perfect Output Capacitor for Your Power Supply. Your switching-mode power supply (SMPS) will require an output capacitor both to iron out voltage swings due to loading and to attenuate ripple caused by switching. In this video we learn how to calculate the required capacitance, and when necessary the ESR, for your output capacitor.
To begin [Dr Ali] shows us that in order to calculate the minimum capacitance to mitigate voltage swings we need values for Δi, Δv, and Ts. Using these we can calculate the minimum output capacitance. We then need to calculate another minimum capacitance for our circuit given that we need to attenuate ripple. To calculate this second minimum we need to change our approach depending on the type of capacitor we are using, such as ceramic, or electrolytic, or something else.
When our circuit calls for an electrolytic capacitor the equivalent series resistance (ESR) becomes relevant and we need to take it into account. The ESR is so predominant that in our calculations for the minimum capacitance to mitigate ripple we can ignore the capacitance and use the ESR only as it is the feature which dominates. [Dr Ali] goes into detail for both examples using ceramic capacitors and electrolytic capacitors. Armed with the minimum capacitance (in Farads) and maximum ESR (in Ohms) you can then go shopping to find a capacitor which meets the requirements.
 Ukrainian forces have destroyed an Iranian-made Shahed-107 attack drone using a STING interceptor drone during active combat operations, according to a report by the Ukrainian defense outlet Militarniy. The interception was carried out by fighters from the Sky Wars unit of the 47th Mechanized Brigade “Magura,” who used the STING drone interceptor to shoot down […]


 A Ukrainian defense company, CENTRE ZAKHYST, has announced the successful development and combat testing of its ODIN counter-unmanned aerial systems, a domestically produced solution designed to intercept attack drones, according to a statement released by the company. CENTRE ZAKHYST said the system has been implemented in combat conditions and tested both at training grounds and […]
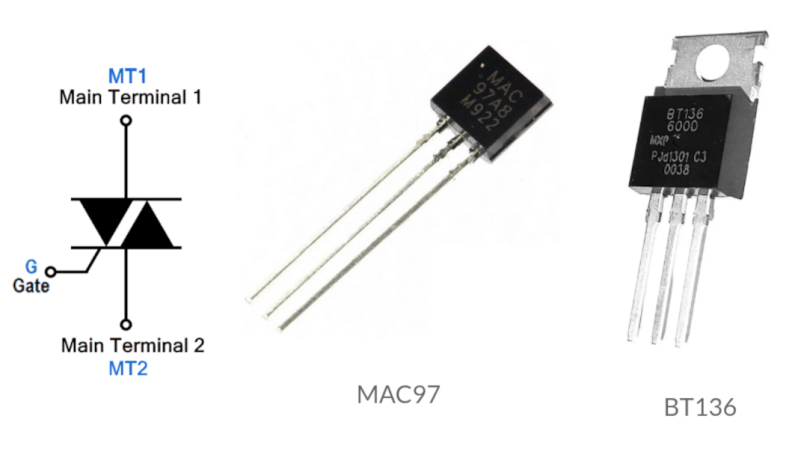
![[Dr Ali Shirsavar] drawing schematics and equations on the whiteboard](https://hackaday.com/wp-content/uploads/2026/01/Biricha-caps-banner.jpg?w=800)