Reading view

There are new articles available, click to refresh the page.

Assessing SIEM effectiveness

A SIEM is a complex system offering broad and flexible threat detection capabilities. Due to its complexity, its effectiveness heavily depends on how it is configured and what data sources are connected to it. A one-time SIEM setup during implementation is not enough: both the organization’s infrastructure and attackers’ techniques evolve over time. To operate effectively, the SIEM system must reflect the current state of affairs.

We provide customers with services to assess SIEM effectiveness, helping to identify issues and offering options for system optimization. In this article, we examine typical SIEM operational pitfalls and how to address them. For each case, we also include methods for independent verification.

This material is based on an assessment of Kaspersky SIEM effectiveness; therefore, all specific examples, commands, and field names are taken from that solution. However, the assessment methodology, issues we identified, and ways to enhance system effectiveness can easily be extrapolated to any other SIEM.

Methodology for assessing SIEM effectiveness

The primary audience for the effectiveness assessment report comprises the SIEM support and operation teams within an organization. The main goal is to analyze how well the usage of SIEM aligns with its objectives. Consequently, the scope of checks can vary depending on the stated goals. A standard assessment is conducted across the following areas:

  • Composition and scope of connected data sources
  • Coverage of data sources
  • Data flows from existing sources
  • Correctness of data normalization
  • Detection logic operability
  • Detection logic accuracy
  • Detection logic coverage
  • Use of contextual data
  • SIEM technical integration into SOC processes
  • SOC analysts’ handling of alerts in the SIEM
  • Forwarding of alerts, security event data, and incident information to other systems
  • Deployment architecture and documentation

At the same time, these areas are examined not only in isolation but also in terms of their potential influence on one another. Here are a couple of examples illustrating this interdependence:

  • Issues with detection logic due to incorrect data normalization. A correlation rule with the condition deviceCustomString1 not contains <string> triggers a large number of alerts. The detection logic itself is correct: the specific event and the specific field it targets should not generate a large volume of data matching the condition. Our review revealed the issue was in the data ingested by the SIEM, where incorrect encoding caused the string targeted by the rule to be transformed into a different one. Consequently, all events matched the condition and generated alerts.
  • When analyzing coverage for a specific source type, we discovered that the SIEM was only monitoring 5% of all such sources deployed in the infrastructure. However, extending that coverage would increase system load and storage requirements. Therefore, besides connecting additional sources, it would be necessary to scale resources for specific modules (storage, collectors, or the correlator).

The effectiveness assessment consists of several stages:

  • Collect and analyze documentation, if available. This allows assessing SIEM objectives, implementation settings (ideally, the deployment settings at the time of the assessment), associated processes, and so on.
  • Interview system engineers, analysts, and administrators. This allows assessing current tasks and the most pressing issues, as well as determining exactly how the SIEM is being operated. Interviews are typically broken down into two phases: an introductory interview, conducted at project start to gather general information, and a follow-up interview, conducted mid-project to discuss questions arising from the analysis of previously collected data.
  • Gather information within the SIEM and then analyze it. This is the most extensive part of the assessment, during which Kaspersky experts are granted read-only access to the system or a part of it to collect factual data on its configuration, detection logic, data flows, and so on.

The assessment produces a list of recommendations. Some of these can be implemented almost immediately, while others require more comprehensive changes driven by process optimization or a transition to a more structured approach to system use.

Issues arising from SIEM operations

The problems we identify during a SIEM effectiveness assessment can be divided into three groups:

  • Performance issues, meaning operational errors in various system components. These problems are typically resolved by technical support, but to prevent them, it is worth periodically checking system health status.
  • Efficiency issues – when the system functions normally but seemingly adds little value or is not used to its full potential. This is usually due to the customer using the system capabilities in a limited way, incorrectly, or not as intended by the developer.
  • Detection issues – when the SIEM is operational and continuously evolving according to defined processes and approaches, but alerts are mostly false positives, and the system misses incidents. For the most part, these problems are related to the approach taken in developing detection logic.

Key observations from the assessment

Event source inventory

When building the inventory of event sources for a SIEM, we follow the principle of layered monitoring: the system should have information about all detectable stages of an attack. This principle enables the detection of attacks even if individual malicious actions have gone unnoticed, and allows for retrospective reconstruction of the full attack chain, starting from the attackers’ point of entry.

Problem: During effectiveness assessments, we frequently find that the inventory of connected source types is not updated when the infrastructure changes. In some cases, it has not been updated since the initial SIEM deployment, which limits incident detection capabilities. Consequently, certain types of sources remain completely invisible to the system.

We have also encountered non-standard cases of incomplete source inventory. For example, an infrastructure contains hosts running both Windows and Linux, but monitoring is configured for only one family of operating systems.

How to detect: To identify the problems described above, determine the list of source types connected to the SIEM and compare it against what actually exists in the infrastructure. Identifying the presence of specific systems in the infrastructure requires an audit. However, this task is one of the most critical for many areas of cybersecurity, and we recommend running it on a periodic basis.

We have compiled a reference sheet of system types commonly found in most organizations. Depending on the organization type, infrastructure, and threat model, we may rearrange priorities. However, a good starting point is as follows:

  • High Priority – sources associated with:
    • Remote access provision
    • External services accessible from the internet
    • External perimeter
    • Endpoint operating systems
    • Information security tools
  • Medium Priority – sources associated with:
    • Remote access management within the perimeter
    • Internal network communication
    • Infrastructure availability
    • Virtualization and cloud solutions
  • Low Priority – sources associated with:
    • Business applications
    • Internal IT services
    • Applications used by various specialized teams (HR, Development, PR, IT, and so on)

Monitoring data flow from sources

Regardless of how good the detection logic is, it cannot function without telemetry from the data sources.

Problem: The SIEM core is not receiving events from specific sources or collectors. Based on all assessments conducted, the average proportion of collectors that are configured with sources but are not transmitting events is 38%. Correlation rules may exist for these sources, but they will, of course, never trigger. It is also important to remember that a single collector can serve hundreds of sources (such as workstations), so the loss of data flow from even one collector can mean losing monitoring visibility for a significant portion of the infrastructure.

How to detect: The process of locating sources that are not transmitting data can be broken down into two components.

  1. Checking collector health. Find the status of collectors (see the support website for the steps to do this in Kaspersky SIEM) and identify those with a status of Offline, Stopped, Disabled, and so on.
  2. Checking the event flow. In Kaspersky SIEM, this can be done by gathering statistics using the following query (counting the number of events received from each collector over a specific time period):
SELECT count(ID), CollectorID, CollectorName FROM `events` GROUP BY CollectorID, CollectorName ORDER BY count(ID)
It is essential to specify an optimal time range for collecting these statistics. Too large a range can increase the load on the SIEM, while too small a range may provide inaccurate information for a one-time check – especially for sources that transmit telemetry relatively infrequently, say, once a week. Therefore, it is advisable to choose a smaller time window, such as 2–4 days, but run several queries for different periods in the past.

Additionally, for a more comprehensive approach, it is recommended to use built-in functionality or custom logic implemented via correlation rules and lists to monitor event flow. This will help automate the process of detecting problems with sources.

Event source coverage

Problem: The system is not receiving events from all sources of a particular type that exist in the infrastructure. For example, the company uses workstations and servers running Windows. During SIEM deployment, workstations are immediately connected for monitoring, while the server segment is postponed for one reason or another. As a result, the SIEM receives events from Windows systems, the flow is normalized, and correlation rules work, but an incident in the unmonitored server segment would go unnoticed.

How to detect: Below are query variations that can be used to search for unconnected sources.

  • SELECT count(distinct, DeviceAddress), DeviceVendor, DeviceProduct FROM events GROUP BY DeviceVendor, DeviceProduct ORDER BY count(ID)
  • SELECT count(distinct, DeviceHostName), DeviceVendor, DeviceProduct FROM events GROUP BY DeviceVendor, DeviceProduct ORDER BY count(ID)

We have split the query into two variations because, depending on the source and the DNS integration settings, some events may contain either a DeviceAddress or DeviceHostName field.

These queries will help determine the number of unique data sources sending logs of a specific type. This count must be compared against the actual number of sources of that type, obtained from the system owners.

Retaining raw data

Raw data can be useful for developing custom normalizers or for storing events not used in correlation that might be needed during incident investigation. However, careless use of this setting can cause significantly more harm than good.

Problem: Enabling the Keep raw event option effectively doubles the event size in the database, as it stores two copies: the original and the normalized version. This is particularly critical for high-volume collectors receiving events from sources like NetFlow, DNS, firewalls, and others. It is worth noting that this option is typically used for testing a normalizer but is often forgotten and left enabled after its configuration is complete.

How to detect: This option is applied at the normalizer level. Therefore, it is necessary to review all active normalizers and determine whether retaining raw data is required for their operation.

Normalization

As with the absence of events from sources, normalization issues lead to detection logic failing, as this logic relies on finding specific information in a specific event field.

Problem: Several issues related to normalization can be identified:

  • The event flow is not being normalized at all.
  • Events are only partially normalized – this is particularly relevant for custom, non-out-of-the-box normalizers.
  • The normalizer being used only parses headers, such as syslog_headers, placing the entire event body into a single field, this field most often being Message.
  • An outdated default normalizer is being used.

How to detect: Identifying normalization issues is more challenging than spotting source problems due to the high volume of telemetry and variety of parsers. Here are several approaches to narrowing the search:

  • First, check which normalizers supplied with the SIEM the organization uses and whether their versions are up to date. In our assessments, we frequently encounter auditd events being normalized by the outdated normalizer, Linux audit and iptables syslog v2 for Kaspersky SIEM. The new normalizer completely reworks and optimizes the normalization schema for events from this source.
  • Execute the query:
SELECT count(ID), DeviceProduct, DeviceVendor, CollectorName FROM `events` GROUP BY DeviceProduct, DeviceVendor, CollectorName ORDER BY count(ID)
This query gathers statistics on events from each collector, broken down by the DeviceVendor and DeviceProduct fields. While these fields are not mandatory, they are present in almost any normalization schema. Therefore, their complete absence or empty values may indicate normalization issues. We recommend including these fields when developing custom normalizers.

To simplify the identification of normalization problems when developing custom normalizers, you can implement the following mechanism. For each successfully normalized event, add a Name field, populated from a constant or the event itself. For a final catch-all normalizer that processes all unparsed events, set the constant value: Name = unparsed event. This will later allow you to identify non-normalized events through a simple search on this field.

Detection logic coverage

Collected events alone are, in most cases, only useful for investigating an incident that has already been identified. For a SIEM to operate to its full potential, it requires detection logic to be developed to uncover probable security incidents.

Problem: The mean correlation rule coverage of sources, determined across all our assessments, is 43%. While this figure is only a ballpark figure – as different source types provide different information – to calculate it, we defined “coverage” as the presence of at least one correlation rule for a source. This means that for more than half of the connected sources, the SIEM is not actively detecting. Meanwhile, effort and SIEM resources are spent on connecting, maintaining, and configuring these sources. In some cases, this is formally justified, for instance, if logs are only needed for regulatory compliance. However, this is an exception rather than the rule.

We do not recommend solving this problem by simply not connecting sources to the SIEM. On the contrary, sources should be connected, but this should be done concurrently with the development of corresponding detection logic. Otherwise, it can be forgotten or postponed indefinitely, while the source pointlessly consumes system resources.

How to detect: This brings us back to auditing, a process that can be greatly aided by creating and maintaining a register of developed detection logic. Given that not every detection logic rule explicitly states the source type from which it expects telemetry, its description should be added to this register during the development phase.

If descriptions of the correlation rules are not available, you can refer to the following:

  • The name of the detection logic. With a standardized approach to naming correlation rules, the name can indicate the associated source or at least provide a brief description of what it detects.
  • The use of fields within the rules, such as DeviceVendor, DeviceProduct (another argument for including these fields in the normalizer), Name, DeviceAction, DeviceEventCategory, DeviceEventClassID, and others. These can help identify the actual source.

Excessive alerts generated by the detection logic

One criterion for correlation rules effectiveness is a low false positive rate.

Problem: Detection logic generates an abnormally high number of alerts that are physically impossible to process, regardless of the size of the SOC team.

How to detect: First and foremost, detection logic should be tested during development and refined to achieve an acceptable false positive rate. However, even a well-tuned correlation rule can start producing excessive alerts due to changes in the event flow or connected infrastructure. To identify these rules, we recommend periodically running the following query:

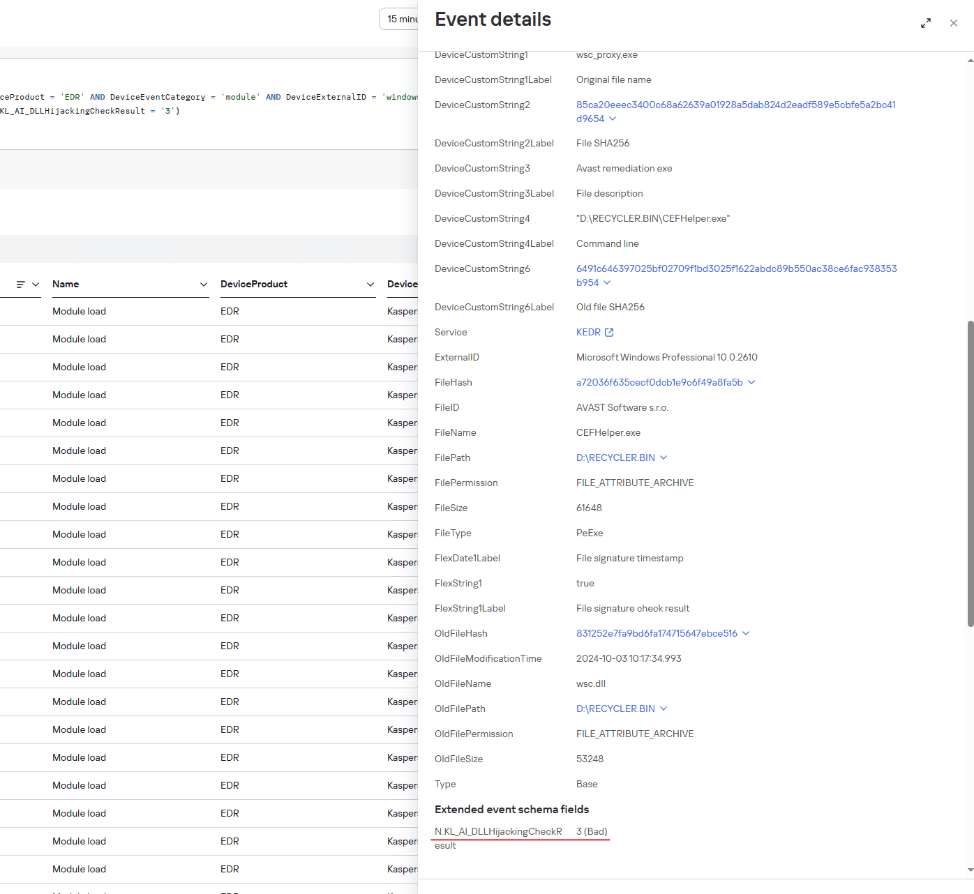
SELECT count(ID), Name FROM `events` WHERE Type = 3 GROUP BY Name ORDER BY count(ID)

In Kaspersky SIEM, a value of 3 in the Type field indicates a correlation event.

Subsequently, for each identified rule with an anomalous alert count, verify the correctness of the logic it uses and the integrity of the event stream on which it triggered.

Depending on the issue you identify, the solution may involve modifying the detection logic, adding exceptions (for example, it is often the case that 99% of the spam originates from just 1–5 specific objects, such as an IP address, a command parameter, or a URL), or adjusting event collection and normalization.

Lack of integration with indicators of compromise

SIEM integrations with other systems are generally a critical part of both event processing and alert enrichment. In at least one specific case, their presence directly impacts detection performance: integration with technical Threat Intelligence data or IoCs (indicators of compromise).

A SIEM allows conveniently checking objects against various reputation databases or blocklists. Furthermore, there are numerous sources of this data that are ready to integrate natively with a SIEM or require minimal effort to incorporate.

Problem: There is no integration with TI data.

How to detect: Generally, IoCs are integrated into a SIEM at the system configuration level during deployment or subsequent optimization. The use of TI within a SIEM can be implemented at various levels:

  • At the data source level. Some sources, such as NGFWs, add this information to events involving relevant objects.
  • At the SIEM native functionality level. For example, Kaspersky SIEM integrates with CyberTrace indicators, which add object reputation information at the moment of processing an event from a source.
  • At the detection logic level. Information about IoCs is stored in various active lists, and correlation rules match objects against these to enrich the event.

Furthermore, TI data does not appear in a SIEM out of thin air. It is either provided by external suppliers (commercially or in an open format) or is part of the built-in functionality of the security tools in use. For instance, various NGFW systems can additionally check the reputation of external IP addresses or domains that users are accessing. Therefore, the first step is to determine whether you are receiving information about indicators of compromise and in what form (whether external providers’ feeds have been integrated and/or the deployed security tools have this capability). It is worth noting that receiving TI data only at the security tool level does not always cover all types of IoCs.

If data is being received in some form, the next step is to verify that the SIEM is utilizing it. For TI-related events coming from security tools, the SIEM needs a correlation rule developed to generate alerts. Thus, checking integration in this case involves determining the capabilities of the security tools, searching for the corresponding events in the SIEM, and identifying whether there is detection logic associated with these events. If events from the security tools are absent, the source audit configuration should be assessed to see if the telemetry type in question is being forwarded to the SIEM at all. If normalization is the issue, you should assess parsing accuracy and reconfigure the normalizer.

If TI data comes from external providers, determine how it is processed within the organization. Is there a centralized system for aggregating and managing threat data (such as CyberTrace), or is the information stored in, say, CSV files?

In the former case (there is a threat data aggregation and management system) you must check if it is integrated with the SIEM. For Kaspersky SIEM and CyberTrace, this integration is handled through the SIEM interface. Following this, SIEM event flows are directed to the threat data aggregation and management system, where matches are identified and alerts are generated, and then both are sent back to the SIEM. Therefore, checking the integration involves ensuring that all collectors receiving events that may contain IoCs are forwarding those events to the threat data aggregation and management system. We also recommend checking if the SIEM has a correlation rule that generates an alert based on matching detected objects with IoCs.

In the latter case (threat information is stored in files), you must confirm that the SIEM has a collector and normalizer configured to load this data into the system as events. Also, verify that logic is configured for storing this data within the SIEM for use in correlation. This is typically done with the help of lists that contain the obtained IoCs. Finally, check if a correlation rule exists that compares the event flow against these IoC lists.

As the examples illustrate, integration with TI in standard scenarios ultimately boils down to developing a final correlation rule that triggers an alert upon detecting a match with known IoCs. Given the variety of integration methods, creating and providing a universal out-of-the-box rule is difficult. Therefore, in most cases, to ensure IoCs are connected to the SIEM, you need to determine if the company has developed that rule (the existence of the rule) and if it has been correctly configured. If no correlation rule exists in the system, we recommend creating one based on the TI integration methods implemented in your infrastructure. If a rule does exist, its functionality must be verified: if there are no alerts from it, analyze its trigger conditions against the event data visible in the SIEM and adjust it accordingly.

The SIEM is not kept up to date

For a SIEM to run effectively, it must contain current data about the infrastructure it monitors and the threats it’s meant to detect. Both elements change over time: new systems and software, users, security policies, and processes are introduced into the infrastructure, while attackers develop new techniques and tools. It is safe to assume that a perfectly configured and deployed SIEM system will no longer be able to fully see the altered infrastructure or the new threats after five years of running without additional configuration. Therefore, practically all components – event collection, detection, additional integrations for contextual information, and exclusions – must be maintained and kept up to date.

Furthermore, it is important to acknowledge that it is impossible to cover 100% of all threats. Continuous research into attacks, development of detection methods, and configuration of corresponding rules are a necessity. The SOC itself also evolves. As it reaches certain maturity levels, new growth opportunities open up for the team, requiring the utilization of new capabilities.

Problem: The SIEM has not evolved since its initial deployment.

How to detect: Compare the original statement of work or other deployment documentation against the current state of the system. If there have been no changes, or only minimal ones, it is highly likely that your SIEM has areas for growth and optimization. Any infrastructure is dynamic and requires continuous adaptation.

Other issues with SIEM implementation and operation

In this article, we have outlined the primary problems we identify during SIEM effectiveness assessments, but this list is not exhaustive. We also frequently encounter:

  • Mismatch between license capacity and actual SIEM load. The problem is almost always the absence of events from sources, rather than an incorrect initial assessment of the organization’s needs.
  • Lack of user rights management within the system (for example, every user is assigned the administrator role).
  • Poor organization of customizable SIEM resources (rules, normalizers, filters, and so on). Examples include chaotic naming conventions, non-optimal grouping, and obsolete or test content intermixed with active content. We have encountered confusing resource names like [dev] test_Add user to admin group_final2.
  • Use of out-of-the-box resources without adaptation to the organization’s infrastructure. To maximize a SIEM’s value, it is essential at a minimum to populate exception lists and specify infrastructure parameters: lists of administrators and critical services and hosts.
  • Disabled native integrations with external systems, such as LDAP, DNS, and GeoIP.

Generally, most issues with SIEM effectiveness stem from the natural degradation (accumulation of errors) of the processes implemented within the system. Therefore, in most cases, maintaining effectiveness involves structuring these processes, monitoring the quality of SIEM engagement at all stages (source onboarding, correlation rule development, normalization, and so on), and conducting regular reviews of all system components and resources.

Conclusion

A SIEM is a powerful tool for monitoring and detecting threats, capable of identifying attacks at various stages across nearly any point in an organization’s infrastructure. However, if improperly configured and operated, it can become ineffective or even useless while still consuming significant resources. Therefore, it is crucial to periodically audit the SIEM’s components, settings, detection rules, and data sources.

If a SOC is overloaded or otherwise unable to independently identify operational issues with its SIEM, we offer Kaspersky SIEM platform users a service to assess its operation. Following the assessment, we provide a list of recommendations to address the issues we identify. That being said, it is important to clarify that these are not strict, prescriptive instructions, but rather highlight areas that warrant attention and analysis to improve the product’s performance, enhance threat detection accuracy, and enable more efficient SIEM utilization.

Yet another DCOM object for lateral movement

Introduction

If you’re a penetration tester, you know that lateral movement is becoming increasingly difficult, especially in well-defended environments. One common technique for remote command execution has been the use of DCOM objects.

Over the years, many different DCOM objects have been discovered. Some rely on native Windows components, others depend on third-party software such as Microsoft Office, and some are undocumented objects found through reverse engineering. While certain objects still work, others no longer function in newer versions of Windows.

This research presents a previously undescribed DCOM object that can be used for both command execution and potential persistence. This new technique abuses older initial access and persistence methods through Control Panel items.

First, we will discuss COM technology. After that, we will review the current state of the Impacket dcomexec script, focusing on objects that still function, and discuss potential fixes and improvements, then move on to techniques for enumerating objects on the system. Next, we will examine Control Panel items, how adversaries have used them for initial access and persistence, and how these items can be leveraged through a DCOM object to achieve command execution.

Finally, we will cover detection strategies to identify and respond to this type of activity.

COM/DCOM technology

What is COM?

COM stands for Component Object Model, a Microsoft technology that defines a binary standard for interoperability. It enables the creation of reusable software components that can interact at runtime without the need to compile COM libraries directly into an application.

These software components operate in a client–server model. A COM object exposes its functionality through one or more interfaces. An interface is essentially a collection of related member functions (methods).

COM also enables communication between processes running on the same machine by using local RPC (Remote Procedure Call) to handle cross-process communication.

Terms

To ensure a better understanding of its structure and functionality, let’s revise COM-related terminology.

  1. COM interface
    A COM interface defines the functionality that a COM object exposes. Each COM interface is identified by a unique GUID known as the IID (Interface ID). All COM interfaces can be found in the Windows Registry under HKEY_CLASSES_ROOT\Interface, where they are organized by GUID.
  2. COM class (COM CoClass)
    A COM class is the actual implementation of one or more COM interfaces. Like COM interfaces, classes are identified by unique GUIDs, but in this case the GUID is called the CLSID (Class ID). This GUID is used to locate the COM server and activate the corresponding COM class.

    All COM classes must be registered in the registry under HKEY_CLASSES_ROOT\CLSID, where each class’s GUID is stored. Under each GUID, you may find multiple subkeys that serve different purposes, such as:

    • InprocServer32/LocalServer32: Specifies the system path of the COM server where the class is defined. InprocServer32 is used for in-process servers (DLLs), while LocalServer32 is used for out-of-process servers (EXEs). We’ll describe this in more detail later.
    • ProgID: A human-readable name assigned to the COM class.
    • TypeLib: A binary description of the COM class (essentially documentation for the class).
    • AppID: Used to describe security configuration for the class.
  3. COM server
    A COM is the module where a COM class is defined. The server can be implemented as an EXE, in which case it is called an out-of-process server, or as a DLL, in which case it is called an in-process server. Each COM server has a unique file path or location in the system. Information about COM servers is stored in the Windows Registry. The COM runtime uses the registry to locate the server and perform further actions. Registry entries for COM servers are located under the HKEY_CLASSES_ROOT root key for both 32- and 64-bit servers.
Component Object Model implementation

Component Object Model implementation

Client–server model

  1. In-process server
    In the case of an in-process server, the server is implemented as a DLL. The client loads this DLL into its own address space and directly executes functions exposed by the COM object. This approach is efficient since both client and server run within the same process.
    In-process COM server

    In-process COM server

  2. Out-of-process server
    Here, the server is implemented and compiled as an executable (EXE). Since the client cannot load an EXE into its address space, the server runs in its own process, separate from the client. Communication between the two processes is handled via ALPC (Advanced Local Procedure Call) ports, which serve as the RPC transport layer for COM.
Out-of-process COM server

Out-of-process COM server

What is DCOM?

DCOM is an extension of COM where the D stands for Distributed. It enables the client and server to reside on different machines. From the user’s perspective, there is no difference: DCOM provides an abstraction layer that makes both the client and the server appear as if they are on the same machine.

Under the hood, however, COM uses TCP as the RPC transport layer to enable communication across machines.

Distributed COM implementation

Distributed COM implementation

Certain requirements must be met to extend a COM object into a DCOM object. The most important one for our research is the presence of the AppID subkey in the registry, located under the COM CLSID entry.

The AppID value contains a GUID that maps to a corresponding key under HKEY_CLASSES_ROOT\AppID. Several subkeys may exist under this GUID. Two critical ones are:

  • AccessPermission: controls access permissions.
  • LaunchPermission: controls activation permissions.

These registry settings grant remote clients permissions to activate and interact with DCOM objects.

Lateral movement via DCOM

After attackers compromise a host, their next objective is often to compromise additional machines. This is what we call lateral movement. One common lateral movement technique is to achieve remote command execution on a target machine. There are many ways to do this, one of which involves abusing DCOM objects.

In recent years, many DCOM objects have been discovered. This research focuses on the objects exposed by the Impacket script dcomexec.py that can be used for command execution. More specifically, three exposed objects are used: ShellWindows, ShellBrowserWindow and MMC20.

  1. ShellWindows
    ShellWindows was one of the first DCOM objects to be identified. It represents a collection of open shell windows and is hosted by explorer.exe, meaning any COM client communicates with that process.

    In Impacket’s dcomexec.py, once an instance of this COM object is created on a remote machine, the script provides a semi-interactive shell.

    Each time a user enters a command, the function exposed by the COM object is called. The command output is redirected to a file, which the script retrieves via SMB and displays back to simulate a regular shell.

    Internally, the script runs this command when connecting:

    cmd.exe /Q /c cd \ 1> \\127.0.0.1\ADMIN$\__17602 2>&1

    This sets the working directory to C:\ and redirects the output to the ADMIN$ share under the filename __17602. After that, the script checks whether the file exists; if it does, execution is considered successful and the output appears as if in a shell.

    When running dcomexec.py against Windows 10 and 11 using the ShellWindows object, the script hangs after confirming SMB connection initialization and printing the SMB banner. As I mentioned in my personal blog post, it appears that this DCOM object no longer has permission to write to the ADMIN$ share. A simple fix is to redirect the output to a directory the DCOM object can write to, such as the Temp folder. The Temp folder can then be accessed under the same ADMIN$ share. A small change in the code resolves the issue. For example:

    OUTPUT_FILENAME = 'Temp\\__' + str(time.time())[:5]

  2. ShellBrowserWindow
    The ShellBrowserWindow object behaves almost identically to ShellWindows and exhibits the same behavior on Windows 10. The same workaround that we used for ShellWindows applies in this case. However, on Windows 11, this object no longer works for command execution.
  3. MMC20
    The MMC20.Application COM object is the automation interface for Microsoft Management Console (MMC). It exposes methods and properties that allow MMC snap-ins to be automated.

    This object has historically worked across all Windows versions. Starting with Windows Server 2025, however, attempting to use it triggers a Defender alert, and execution is blocked.

    As shown in earlier examples, the dcomexec.py script writes the command output to a file under ADMIN$, with a filename that begins with __:

    OUTPUT_FILENAME = '__' + str(time.time())[:5]

    Defender appears to check for files written under ADMIN$ that start with __, and when it detects one, it blocks the process and alerts the user. A quick fix is to simply remove the double underscores from the output filename.

    Another way to bypass this issue is to use the same workaround used for ShellWindows – redirecting the output to the Temp folder. The table below outlines the status of these objects across different Windows versions.

    Windows Server 2025 Windows Server 2022 Windows 11 Windows 10
    ShellWindows Doesn’t work Doesn’t work Works but needs a fix Works but needs a fix
    ShellBrowserWindow Doesn’t work Doesn’t work Doesn’t work Works but needs a fix
    MMC20 Detected by Defender Works Works Works

Enumerating COM/DCOM objects

The first step to identifying which DCOM objects could be used for lateral movement is to enumerate them. By enumerating, I don’t just mean listing the objects. Enumeration involves:

  • Finding objects and filtering specifically for DCOM objects.
  • Identifying their interfaces.
  • Inspecting the exposed functions.

Automating enumeration is difficult because most COM objects lack a type library (TypeLib). A TypeLib acts as documentation for an object: which interfaces it supports, which functions are exposed, and the definitions of those functions. Even when TypeLibs are available, manual inspection is often still required, as we will explain later.

There are several approaches to enumerating COM objects depending on their use cases. Next, we’ll describe the methods I used while conducting this research, taking into account both automated and manual methods.

  1. Automation using PowerShell
    In PowerShell, you can use .NET to create and interact with DCOM objects. Objects can be created using either their ProgID or CLSID, after which you can call their functions (as shown in the figure below).
    Shell.Application COM object function list in PowerShell

    Shell.Application COM object function list in PowerShell

    Under the hood, PowerShell checks whether the COM object has a TypeLib and implements the IDispatch interface. IDispatch enables late binding, which allows runtime dynamic object creation and function invocation. With these two conditions met, PowerShell can dynamically interact with COM objects at runtime.

    Our strategy looks like this:

    As you can see in the last box, we perform manual inspection to look for functions with names that could be of interest, such as Execute, Exec, Shell, etc. These names often indicate potential command execution capabilities.

    However, this approach has several limitations:

    • TypeLib requirement: Not all COM objects have a TypeLib, so many objects cannot be enumerated this way.
    • IDispatch requirement: Not all COM objects implement the IDispatch interface, which is required for PowerShell interaction.
    • Interface control: When you instantiate an object in PowerShell, you cannot choose which interface the instance will be tied to. If a COM class implements multiple interfaces, PowerShell will automatically select the one marked as [default] in the TypeLib. This means that other non-default interfaces, which may contain additional relevant functionality, such as command execution, could be overlooked.
  2. Automation using C++
    As you might expect, C++ is one of the languages that natively supports COM clients. Using C++, you can create instances of COM objects and call their functions via header files that define the interfaces.However, with this approach, we are not necessarily interested in calling functions directly. Instead, the goal is to check whether a specific COM object supports certain interfaces. The reasoning is that many interfaces have been found to contain functions that can be abused for command execution or other purposes.

    This strategy primarily relies on an interface called IUnknown. All COM interfaces should inherit from this interface, and all COM classes should implement it.The IUnknown interface exposes three main functions. The most important is QueryInterface(), which is used to ask a COM object for a pointer to one of its interfaces.So, the strategy is to:

    • Enumerate COM classes in the system by reading CLSIDs under the HKEY_CLASSES_ROOT\CLSID key.
    • Check whether they support any known valuable interfaces. If they do, those classes may be leveraged for command execution or other useful functionality.

    This method has several advantages:

    • No TypeLib dependency: Unlike PowerShell, this approach does not require the COM object to have a TypeLib.
    • Use of IUnknown: In C++, you can use the QueryInterface function from the base IUnknown interface to check if a particular interface is supported by a COM class.
    • No need for interface definitions: Even without knowing the exact interface structure, you can obtain a pointer to its virtual function table (vtable), typically cast as a void*. This is enough to confirm the existence of the interface and potentially inspect it further.

    The figure below illustrates this strategy:

    This approach is good in terms of automation because it eliminates the need for manual inspection. However, we are still only checking well-known interfaces commonly used for lateral movement, while potentially missing others.

  3. Manual inspection using open-source tools

    As you can see, automation can be difficult since it requires several prerequisites and, in many cases, still ends with a manual inspection. An alternative approach is manual inspection using a tool called OleViewDotNet, developed by James Forshaw. This tool allows you to:
    • List all COM classes in the system.
    • Create instances of those classes.
    • Check their supported interfaces.
    • Call specific functions.
    • Apply various filters for easier analysis.
    • Perform other inspection tasks.
    Open-source tool for inspecting COM interfaces

    Open-source tool for inspecting COM interfaces

    One of the most valuable features of this tool is its naming visibility. OleViewDotNet extracts the names of interfaces and classes (when available) from the Windows Registry and displays them, along with any associated type libraries.

    This makes manual inspection easier, since you can analyze the names of classes, interfaces, or type libraries and correlate them with potentially interesting functionality, for example, functions that could lead to command execution or persistence techniques.

Control Panel items as attack surfaces

Control Panel items allow users to view and adjust their computer settings. These items are implemented as DLLs that export the CPlApplet function and typically have the .cpl extension. Control Panel items can also be executables, but our research will focus on DLLs only.

Control Panel items

Control Panel items

Attackers can abuse CPL files for initial access. When a user executes a malicious .cpl file (e.g., delivered via phishing), the system may be compromised – a technique mapped to MITRE ATT&CK T1218.002.

Adversaries may also modify the extensions of malicious DLLs to .cpl and register them in the corresponding locations in the registry.

  • Under HKEY_CURRENT_USER:
    HKCU\Software\Microsoft\Windows\CurrentVersion\Control Panel\Cpls
  • Under HKEY_LOCAL_MACHINE:
    • For 64-bit DLLs:
      HKLM\Software\Microsoft\Windows\CurrentVersion\Control Panel\Cpls
    • For 32-bit DLLs:
      HKLM\Software\WOW6432Node\Microsoft\Windows\CurrentVersion\Control Panel\Cpls

These locations are important when Control Panel DLLs need to be available to the current logged-in user or to all users on the machine. However, the “Control Panel” subkey and its “Cpls” subkey under HKCU should be created manually, unlike the “Control Panel” and “Cpls” subkeys under HKLM, which are created automatically by the operating system.

Once registered, the DLL (CPL file) will load every time the Control Panel is opened, enabling persistence on the victim’s system.

It’s worth noting that even DLLs that do not comply with the CPL specification, do not export CPlApplet, or do not have the .cpl extension can still be executed via their DllEntryPoint function if they are registered under the registry keys listed above.

There are multiple ways to execute Control Panel items:

  • From cmd: control.exe [filename].cpl
  • By double-clicking the .cpl file.

Both methods use rundll32.exe under the hood:

rundll32.exe shell32.dll,Control_RunDLL [filename].cpl

This calls the Control_RunDLL function from shell32.dll, passing the CPL file as an argument. Everything inside the CPlApplet function will then be executed.

However, if the CPL file has been registered in the registry as shown earlier, then every time the Control Panel is opened, the file is loaded into memory through the COM Surrogate process (dllhost.exe):

COM Surrogate process loading the CPL file

COM Surrogate process loading the CPL file

What happened was that a Control Panel with a COM client used a COM object to load these CPL files. We will talk about this COM object in more detail later.

The COM Surrogate process was designed to host COM server DLLs in a separate process rather than loading them directly into the client process’s address space. This isolation improves stability for the in-process server model. This hosting behavior can be configured for a COM object in the registry if you want a COM server DLL to run inside a separate process because, by default, it is loaded in the same process.

‘DCOMing’ through Control Panel items

While following the manual approach of enumerating COM/DCOM objects that could be useful for lateral movement, I came across a COM object called COpenControlPanel, which is exposed through shell32.dll and has the CLSID {06622D85-6856-4460-8DE1-A81921B41C4B}. This object exposes multiple interfaces, one of which is IOpenControlPanel with IID {D11AD862-66DE-4DF4-BF6C-1F5621996AF1}.

IOpenControlPanel interface in the OleViewDotNet output

IOpenControlPanel interface in the OleViewDotNet output

I immediately thought of its potential to compromise Control Panel items, so I wanted to check which functions were exposed by this interface. Unfortunately, neither the interface nor the COM class has a type library.

COpenControlPanel interfaces without TypeLib

COpenControlPanel interfaces without TypeLib

Normally, checking the interface definition would require reverse engineering, so at first, it looked like we needed to take a different research path. However, it turned out that the IOpenControlPanel interface is documented on MSDN, and according to the documentation, it exposes several functions. One of them, called Open, allows a specified Control Panel item to be opened using its name as the first argument.

Full type and function definitions are provided in the shobjidl_core.h Windows header file.

Open function exposed by IOpenControlPanel interface

Open function exposed by IOpenControlPanel interface

It’s worth noting that in newer versions of Windows (e.g., Windows Server 2025 and Windows 11), Microsoft has removed interface names from the registry, which means they can no longer be identified through OleViewDotNet.

COpenControlPanel interfaces without names

COpenControlPanel interfaces without names

Returning to the COpenControlPanel COM object, I found that the Open function can trigger a DLL to be loaded into memory if it has been registered in the registry. For the purposes of this research, I created a DLL that basically just spawns a message box which is defined under the DllEntryPoint function. I registered it under HKCU\Software\Microsoft\Windows\CurrentVersion\Control Panel\Cpls and then created a simple C++ COM client to call the Open function on this interface.

As expected, the DLL was loaded into memory. It was hosted in the same way that it would be if the Control Panel itself was opened: through the COM Surrogate process (dllhost.exe). Using Process Explorer, it was clear that dllhost.exe loaded my DLL while simultaneously hosting the COpenControlPanel object along with other COM objects.

COM Surrogate loading a custom DLL and hosting the COpenControlPanel object

COM Surrogate loading a custom DLL and hosting the COpenControlPanel object

Based on my testing, I made the following observations:

  1. The DLL that needs to be registered does not necessarily have to be a .cpl file; any DLL with a valid entry point will be loaded.
  2. The Open() function accepts the name of a Control Panel item as its first argument. However, it appears that even if a random string is supplied, it still causes all DLLs registered in the relevant registry location to be loaded into memory.

Now, what if we could trigger this COM object remotely? In other words, what if it is not just a COM object but also a DCOM object? To verify this, we checked the AppID of the COpenControlPanel object using OleViewDotNet.

COpenControlPanel object in OleViewDotNet

COpenControlPanel object in OleViewDotNet

Both the launch and access permissions are empty, which means the object will follow the system’s default DCOM security policy. By default, members of the Administrators group are allowed to launch and access the DCOM object.

Based on this, we can build a remote strategy. First, upload the “malicious” DLL, then use the Remote Registry service to register it in the appropriate registry location. Finally, use a trigger acting as a DCOM client to remotely invoke the Open() function, causing our DLL to be loaded. The diagram below illustrates the flow of this approach.

Malicious DLL loading using DCOM

Malicious DLL loading using DCOM

The trigger can be written in either C++ or Python, for example, using Impacket. I chose Python because of its flexibility. The trigger itself is straightforward: we define the DCOM class, the interface, and the function to call. The full code example can be found here.

Once the trigger runs, the behavior will be the same as when executing the COM client locally: our DLL will be loaded through the COM Surrogate process (dllhost.exe).

As you can see, this technique not only achieves command execution but also provides persistence. It can be triggered in two ways: when a user opens the Control Panel or remotely at any time via DCOM.

Detection

The first step in detecting such activity is to check whether any Control Panel items have been registered under the following registry paths:

  • HKCU\Software\Microsoft\Windows\CurrentVersion\Control Panel\Cpls
  • HKLM\Software\Microsoft\Windows\CurrentVersion\Control Panel\Cpls
  • HKLM\Software\WOW6432Node\Microsoft\Windows\CurrentVersion\Control Panel\Cpls

Although commonly known best practices and research papers regarding Windows security advise monitoring only the first subkey, for thorough coverage it is important to monitor all of the above.

In addition, monitoring dllhost.exe (COM Surrogate) for unusual COM objects such as COpenControlPanel can provide indicators of malicious activity.
Finally, it is always recommended to monitor Remote Registry usage because it is commonly abused in many types of attacks, not just in this scenario.

Conclusion

In conclusion, I hope this research has clarified yet another attack vector and emphasized the importance of implementing hardening practices. Below are a few closing points for security researchers to take into account:

  • As shown, DCOM represents a large attack surface. Windows exposes many DCOM classes, a significant number of which lack type libraries – meaning reverse engineering can reveal additional classes that may be abused for lateral movement.
  • Changing registry values to register malicious CPLs is not good practice from a red teaming ethics perspective. Defender products tend to monitor common persistence paths, but Control Panel applets can be registered in multiple registry locations, so there is always a gap that can be exploited.
  • Bitness also matters. On x64 systems, loading a 32-bit DLL will spawn a 32-bit COM Surrogate process (dllhost.exe *32). This is unusual on 64-bit hosts and therefore serves as a useful detection signal for defenders and an interesting red flag for red teamers to consider.

Turn me on, turn me off: Zigbee assessment in industrial environments

We all encounter IoT and home automation in some form or another, from smart speakers to automated sensors that control water pumps. These services appear simple and straightforward to us, but many devices and protocols work together under the hood to deliver them.

One of those protocols is Zigbee. Zigbee is a low-power wireless protocol (based on IEEE 802.15.4) used by many smart devices to talk to each other. It’s common in homes, but is also used in industrial environments where hundreds or thousands of sensors may coordinate to support a process.

There are many guides online about performing security assessments of Zigbee. Most focus on the Zigbee you see in home setups. They often skip the Zigbee used at industrial sites, what I call ‘non-public’ or ‘industrial’ Zigbee.

In this blog, I will take you on a journey through Zigbee assessments. I’ll explain the basics of the protocol and map the attack surface likely to be found in deployments. I’ll also walk you through two realistic attack vectors that you might see in facilities, covering the technical details and common problems that show up in assessments. Finally, I will present practical ways to address these problems.

Zigbee introduction

Protocol overview

Zigbee is a wireless communication protocol designed for low-power applications in wireless sensor networks. Based on the IEEE 802.15.4 standard, it was created for short-range and low-power communication. Zigbee supports mesh networking, meaning devices can connect through each other to extend the network range. It operates on the 2.4 GHz frequency band and is widely used in smart homes, industrial automation, energy monitoring, and many other applications.

You may be wondering why there’s a need for Zigbee when Wi-Fi is everywhere? The answer depends on the application. In most home setups, Wi-Fi works well for connecting devices. But imagine you have a battery-powered sensor that isn’t connected to your home’s electricity. If it used Wi-Fi, its battery would drain quickly – maybe in just a few days – because Wi-Fi consumes much more power. In contrast, the Zigbee protocol allows for months or even years of uninterrupted work.

Now imagine an even more extreme case. You need to place sensors in a radiation zone where humans can’t go. You drop the sensors from a helicopter and they need to operate for months without a battery replacement. In this situation, power consumption becomes the top priority. Wi-Fi wouldn’t work, but Zigbee is built exactly for this kind of scenario.

Also, Zigbee has a big advantage if the area is very large, covering thousands of square meters and requiring thousands of sensors: it supports thousands of nodes in a mesh network, while Wi-Fi is usually limited to hundreds at most.

There are lots more ins and outs, but these are the main reasons Zigbee is preferred for large-scale, low-power sensor networks.

Since both Zigbee and IEEE 802.15.4 define wireless communication, many people confuse the two. The difference between them, to put it simply, concerns the layers they support. IEEE 802.15.4 defines the physical (PHY) and media access control (MAC) layers, which basically determine how devices send and receive data over the air. Zigbee (as well as other protocols like Thread, WirelessHART, 6LoWPAN, and MiWi) builds on IEEE 802.15.4 by adding the network and application layers that define how devices form a network and communicate.

Zigbee operates in the 2.4 GHz wireless band, which it shares with Wi-Fi and Bluetooth. The Zigbee band includes 16 channels, each with a 2 MHz bandwidth and a 5 MHz gap between channels.

This shared frequency means Zigbee networks can sometimes face interference from Wi-Fi or Bluetooth devices. However, Zigbee’s low power and adaptive channel selection help minimize these conflicts.

Devices and network

There are three main types of Zigbee devices, each of which plays a different role in the network.

  1. Zigbee coordinator
    The coordinator is the brain of the Zigbee network. A Zigbee network is always started by a coordinator and can only contain one coordinator, which has the fixed address 0x0000.
    It performs several key tasks:
    • Starts and manages the Zigbee network.
    • Chooses the Zigbee channel.
    • Assigns addresses to other devices.
    • Stores network information.
    • Chooses the PAN ID: a 2-byte identifier (for example, 0x1234) that uniquely identifies the network.
    • Sets the Extended PAN ID: an 8-byte value, often an ASCII name representing the network.

    The coordinator can have child devices, which can be either Zigbee routers or Zigbee end devices.

  2. Zigbee router
    The router works just like a router in a traditional network: it forwards data between devices, extends the network range and can also accept child devices, which are usually Zigbee end devices.
    Routers are crucial for building large mesh networks because they enable communication between distant nodes by passing data through multiple hops.
  3. Zigbee end device
    The end device, also referred to as a Zigbee endpoint, is the simplest and most power-efficient type of Zigbee device. It only communicates with its parent, either a coordinator or router, and sleeps most of the time to conserve power. Common examples include sensors, remotes, and buttons.

Zigbee end devices do not accept child devices unless they are configured as both a router and an endpoint simultaneously.

Each of these device types, also known as Zigbee nodes, has two types of address:

  • Short address: two bytes long, similar to an IP address in a TCP/IP network.
  • Extended address: eight bytes long, similar to a MAC address.

Both addresses can be used in the MAC and network layers, unlike in TCP/IP, where the MAC address is used only in Layer 2 and the IP address in Layer 3.

Zigbee setup

Zigbee has many attack surfaces, such as protocol fuzzing and low-level radio attacks. In this post, however, I’ll focus on application-level attacks. Our test setup uses two attack vectors and is intentionally small to make the concepts clear.

In our setup, a Zigbee coordinator is connected to a single device that functions as both a Zigbee endpoint and a router. The coordinator also has other interfaces (Ethernet, Bluetooth, Wi-Fi, LTE), while the endpoint has a relay attached that the coordinator can switch on or off over Zigbee. This relay can be triggered by events coming from any interface, for example, a Bluetooth command or an Ethernet message.

Our goal will be to take control of the relay and toggle its state (turn it off and on) using only the Zigbee interface. Because the other interfaces (Ethernet, Bluetooth, Wi-Fi, LTE) are out of scope, the attack must work by hijacking Zigbee communication.

For the purposes of this research, we will attempt to hijack the communication between the endpoint and the coordinator. The two attack vectors we will test are:

  1. Spoofed packet injection: sending forged Zigbee commands made to look like they come from the coordinator to trigger the relay.
  2. Coordinator impersonation (rejoin attack): impersonating the legitimate coordinator to trick the endpoint into joining the attacker-controlled coordinator and controlling it directly.

Spoofed packet injection

In this scenario, we assume the Zigbee network is already up and running and that both the coordinator and endpoint nodes are working normally. The coordinator has additional interfaces, such as Ethernet, and the system uses those interfaces to trigger the relay. For instance, a command comes in over Ethernet and the coordinator sends a Zigbee command to the endpoint to toggle the relay. Our goal is to toggle the relay by injecting simulated legitimate Zigbee packets, using only the Zigbee link.

Sniffing

The first step in any radio assessment is to sniff the wireless traffic so we can learn how the devices talk. For Zigbee, a common and simple tool is the nRF52840 USB dongle by Nordic Semiconductor. With the official nRF Sniffer for 802.15.4 firmware, the dongle can run in promiscuous mode to capture all 802.15.4/Zigbee traffic. Those captures can be opened in Wireshark with the appropriate dissector to inspect the frames.

How do you find the channel that’s in use?

Zigbee runs on one of the 16 channels that we mentioned earlier, so we must set the sniffer to the same channel that the network uses. One practical way to scan the channels is to change the sniffer channel manually in Wireshark and watch for Zigbee traffic. When we see traffic, we know we’ve found the right channel.

After selecting the channel, we will be able to see the communication between the endpoint and the coordinator, though it will most likely be encrypted:

In the “Info” column, we can see that Wireshark only identifies packets as Data or Command without specifying their exact type, and that’s because the traffic is encrypted.

Even when Zigbee payloads are encrypted, the network and MAC headers remain visible. That means we can usually read things like source and destination addresses, PAN ID, short and extended MAC addresses, and frame control fields. The application payload (i.e., the actual command to toggle the relay) is typically encrypted at the Zigbee network/application layer, so we won’t see it in clear text without encryption keys. Nevertheless, we can still learn enough from the headers.

Decryption

Zigbee supports several key types and encryption models. In this post, we’ll keep it simple and look at a case involving only two security-related devices: a Zigbee coordinator and a device that is both an endpoint and a router. That way, we’ll only use a network encryption model, whereas with, say, mesh networks there can be various encryption models in use.

The network encryption model is a common concept. The traffic that we sniffed earlier is typically encrypted using the network key. This key is a symmetric AES-128 key shared by all devices in a Zigbee network. It protects network-layer packets (hop-by-hop) such as routing and broadcast packets. Because every router on the path shares the network key, this encryption method is not considered end-to-end.

Depending on the specific implementation, Zigbee can use two approaches for application payloads:

  • Network-layer encryption (hop-by-hop): the network key encrypts the Application Support Sublayer (APS) data, the sublayer of the application layer in Zigbee. In this case, each router along the route can decrypt the APS payload. This is not end-to-end encryption, so it is not recommended for transmitting sensitive data.
  • Link key (end-to-end) encryption: a link key, which is also an AES-128 key, is shared between two devices (for example, the coordinator and an endpoint).

The link key provides end-to-end protection of the APS payload between the two devices.

Because the network key could allow an attacker to read and forge many types of network traffic, it must be random and protected. Exposing the key effectively compromises the entire network.

When a new device joins, the coordinator (Trust Center) delivers the network key using a Transport Key command. That transport packet must be protected by a link key so the network key is not exposed in clear text. The link key authenticates the joining device and protects the key delivery.

The image below shows the transport packet:

There are two common ways link keys are provided:

  • Pre-installed: the device ships with an installation code or link key already set.
  • Key establishment: the device runs a key-establishment protocol.

A common historical problem is the global default Trust Center link key, “ZigBeeAlliance09”. It was included in early versions of Zigbee (pre-3.0) to facilitate testing and interoperability. However, many vendors left it enabled on consumer devices, and that has caused major security issues. If an attacker knows this key, they can join devices and read or steal the network key.

Newer versions – Zigbee 3.0 and later – introduced installation codes and procedures to derive unique link keys for each device. An installation code is usually a factory-assigned secret (often encoded on the device label) that the Trust Center uses to derive a unique link key for the device in question. This helps avoid the problems caused by a single hard-coded global key.

Unfortunately, many manufacturers still ignore these best practices. During real assessments, we often encounter devices that use default or hard-coded keys.

How can these keys be obtained?

If an endpoint has already joined the network and communicates with the coordinator using the network key, there are two main options for decrypting traffic:

  1. Guess or brute-force the network key. This is usually impractical because a properly generated network key is a random AES-128 key.
  2. Force the device to rejoin and capture the transport key. If we can make the endpoint leave the network and then rejoin, the coordinator will send the transport key. Capturing that packet can reveal the network key, but the transport key itself is protected by the link key. Therefore, we still need the link key.

To obtain the network and link keys, many approaches can be used:

  • The well-known default link key, ZigBeeAlliance09. Many legacy devices still use it.
  • Identify the device manufacturer and search for the default keys used by that vendor. We can find the manufacturer by:
    • Checking the device MAC/OUI (the first three bytes of the 64-bit extended address often map to a vendor).
    • Physically inspecting the device (label, model, chip markings).
  • Extract the firmware from the coordinator or device if we have physical access and search for hard-coded keys inside the firmware images.

Once we have the relevant keys, the decryption process is straightforward:

  1. Open the capture in Wireshark.
  2. Go to Edit -> Preferences -> Protocols -> Zigbee.
  3. Add the network key and any link keys in our possession.
  4. Wireshark will then show decrypted APS payloads and higher-level Zigbee packets.

After successful decryption, packet types and readable application commands will be visible, such as Link Status or on/off cluster commands:

Choose your gadget

Now that we can read and potentially decrypt traffic, we need hardware and software to inject packets over the Zigbee link between the coordinator and the endpoint. To keep this practical and simple, I opted for cheap, widely available tools that are easy to set up.

For the hardware, I used the nRF52840 USB dongle, the same device we used for sniffing. It’s inexpensive, easy to find, and supports IEEE 802.15.4/Zigbee, so it can sniff and transmit.

The dongle runs the firmware we can use. A good firmware platform is Zephyr RTOS. Zephyr has an IEEE 802.15.4 radio API that enables the device to receive raw frames, essentially enabling sniffer mode, as well as send raw frames as seen in the snippets below.

Using this API and other components, we created a transceiver implementation written in C, compiled it to firmware, and flashed it to the dongle. The firmware can expose a simple runtime interface, such as a USB serial port, which allows us to control the radio from a laptop.

At runtime, the dongle listens on the serial port (for example, /dev/ttyACM1). Using a script, we can send it raw bytes, which the firmware will pass to the radio API and transmit to the channel. The following is an example of a tiny Python script to open the serial port:

I used the Scapy tool with the 802.15.4/Zigbee extensions to build Zigbee packets. Scapy lets us assemble packets layer-by-layer – MAC → NWK → APS → ZCL – and then convert them to raw bytes to send to the dongle. We will talk about APS and ZCL in more detail later.

Here is an example of how we can use Scapy to craft an APS layer packet:

from scapy.layers.dot15d4 import Dot15d4, Dot15d4FCS, Dot15d4Data, Dot15d4Cmd, Dot15d4Beacon, Dot15d4CmdAssocResp
from scapy.layers.zigbee import ZigbeeNWK, ZigbeeAppDataPayload, ZigbeeSecurityHeader, ZigBeeBeacon, ZigbeeAppCommandPayload

Before sending, the packet must be properly encrypted and signed so the endpoint accepts it. That means applying AES-CCM (AES-128 with MIC) using the network key (or the correct link key) and adhering to Zigbee’s rules for packet encryption and MIC calculation. This is how we implemented the encryption and MIC in Python (using a cryptographic library) after building the Scapy packet. We then sent the final bytes to the dongle.

This is how we implemented the encryption and MIC:

Crafting the packet

Now that we know how to inject packets, the next question is what to inject. To toggle the relay, we simply need to send the same type of command that the coordinator already sends. The easiest way to find that command is to sniff the traffic and read the application payload. However, when we look at captures in Wireshark, we can see many packets under ZCL marked [Malformed Packet].

A “malformed” ZCL packet usually means Wireshark could not fully interpret the packet because the application layer is non-standard or lacks details Wireshark expects. To understand why this happens, let’s look at the Zigbee application layer.

The Zigbee application layer consists of four parts:

  • Application Support Sublayer (APS): routes messages to the correct profile, endpoint, and cluster, and provides application-level security.
  • Application Framework (AF): contains the application objects that implement device functionality. These objects reside on endpoints (logical addresses 1–240) and expose clusters (sets of attributes and commands).
  • Zigbee Cluster Library (ZCL): defines standard clusters and commands so devices can interoperate.
  • Zigbee Device Object (ZDO): handles device discovery and management (out of scope for this post).

To make sense of application traffic, we must introduce three concepts:

  • Profile: a rulebook for how devices should behave for a specific use case. Public (standard) profiles are managed by the Connectivity Standards Alliance (CSA). Vendors can also create private profiles for proprietary features.
  • Cluster: a set of attributes and commands for a particular function. For example, the On/Off cluster contains On and Off commands and an OnOff attribute that displays the current state.
  • Endpoint: a logical “port” on the device where a profile and clusters reside. A device can host multiple endpoints for different functions.

Putting all this together, in the standard home automation traffic we see APS pointing to the home automation profile, the On/Off cluster, and a destination endpoint (for example, endpoint 1). In ZCL, the byte 0x00 often means “Off”.

In many industrial setups, vendors use private profiles or custom application frameworks. That’s why Wireshark can’t decode the packets; the AF payload is custom, so the dissector doesn’t know the format.

So how do we find the right bytes to toggle the switch when the application is private? Our strategy has two phases.

  1. Passive phase
    Sniff traffic while the system is driven legitimately. For example, trigger the relay from another interface (Ethernet or Bluetooth) and capture the Zigbee packets used to toggle the relay. If we can decrypt the captures, we can extract the application payload that correlates with the on/off action.
  2. Active phase
  3. With the legitimate payload at hand, we can now turn to creating our own packet. There are two ways to do that. First, we need to replay or duplicate the captured application payload exactly as it is. This works if there are no freshness checks like sequence numbers. Otherwise, we have to reverse-engineer the payload and adjust any counters or fields that prevent replay. For instance, many applications include an application-level counter. If the device ignores packets with a lower application counter, we must locate and increment that counter when we craft our packet.

    Another important protective measure is the frame counter inside the Zigbee security header (in the network header security fields). The frame counter prevents replay attacks; the receiver expects the frame counter to increase with each new packet, and will reject packets with a lower or repeated counter.

So, in the active phase, we must:

  1. Sniff the traffic until the coordinator sends a valid packet to the endpoint.
  2. Decrypt the packet, extract the counters and increase them by one.
  3. Build a packet with the correct APS/AF fields (profile, endpoint, cluster).
  4. Include a valid ZCL command or the vendor-specific payload that we identified in the passive phase.
  5. Encrypt and sign the packet with the correct network or link key.
  6. Make sure both the application counter (if used) and the Zigbee frame counter are modified so the packet is accepted.

The whole strategy for this phase will look like this:

If all of the above are handled correctly, we will be able to hijack the Zigbee communication and toggle the relay (turn it off and on) using only the Zigbee link.

Coordinator impersonation (rejoin attack)

The goal of this attack vector is to force the Zigbee endpoint to leave its original coordinator’s network and join our spoofed network so that we can take control of the device. To do this, we must achieve two things:

  1. Force the endpoint to leave the original network.
  2. Spoof the original coordinator and trick the node into joining our fake coordinator.

Force leaving

To better understand how to manipulate endpoint connections, let’s first describe the concept of a beacon frame. Beacon frames are periodic announcements sent by a coordinator and by routers. They advertise the presence of a network and provide join information, such as:

  • PAN ID and Extended PAN ID
  • Coordinator address
  • Stack/profile information
  • Device capacity (for example, whether the coordinator can accept child devices)

When a device wants to join, it sends a beacon request across Zigbee channels and waits for beacon replies from nearby coordinators/routers. Even if the network is not beacon-enabled for regular synchronization, beacon frames are still used during the join/discovery process, so they are mandatory when a node tries to discover networks.

Note that beacon frames exist at both the Zigbee and IEEE 802.15.4 levels. The MAC layer carries the basic beacon structure that Zigbee then extends with network-specific fields.

Now, we can force the endpoint to leave its network by abusing how Zigbee handles PAN conflicts. If a coordinator sees beacons from another coordinator using the same PAN ID and the same channel, it may trigger a PAN ID conflict resolution. When that happens, the coordinator can instruct its nodes to change PAN ID and rejoin, which causes them to leave and then attempt to join again. That rejoin window gives us an opportunity to advertise a spoofed coordinator and capture the joining node.

In the capture shown below, packet 7 is a beacon generated by our spoofed coordinator using the same PAN ID as the real network. As a result, the endpoint with the address 0xe8fa leaves the network (see packets 14–16).

Choose me

After forcing the endpoint to leave its original network by sending a fake beacon, the next step is to make the endpoint choose our spoofed coordinator. At this point, we assume we already have the necessary keys (network and link keys) and understand how the application behaves.

To impersonate the original coordinator, our spoofed coordinator must reply to any beacon request the endpoint sends. The beacon response must include the same Extended PAN ID (and other fields) that the endpoint expects. If the endpoint deems our beacon acceptable, it may attempt to join us.

I can think of two ways to make the endpoint prefer our coordinator.

  1. Jam the real coordinator
    Use a device that reduces the real coordinator’s signal at the endpoint so that it appears weaker, forcing the endpoint to prefer our beacon. This requires extra hardware.
  2. Exploit undefined or vendor-specific behavior
    Zigbee stacks sometimes behave slightly differently across vendors. One useful field in a beacon is the Update ID field. It increments when a coordinator changes network configuration.

If two coordinators advertise the same Extended PAN ID but one has a higher Update ID, some stacks will prefer the beacon with the higher Update ID. This is undefined behavior across implementations; it works on some stacks but not on others. In my experience, sometimes it works and sometimes it fails. There are lots of other similar quirks we can try during an assessment.

Even if the endpoint chooses our fake coordinator, the connection may be unstable. One main reason for that is the timing. The endpoint expects ACKs for the frames it sends to the coordinator, as well as fast responses regarding connection initiation packets. If our responder is implemented in Python on a laptop that receives packets, builds responses, and forwards them to a dongle, the round trip will be too slow. The endpoint will not receive timely ACKs or packets and will drop the connection.

In short, we’re not just faking a few packets; we’re trying to reimplement parts of Zigbee and IEEE 802.15.4 that must run quickly and reliably. This is usually too slow for production stacks when done in high-level, interpreted code.

A practical fix is to run a real Zigbee coordinator stack directly on the dongle. For example, the nRF52840 dongle can act as a coordinator if flashed with the right Nordic SDK firmware (see Nordic’s network coordinator sample). That provides the correct timing and ACK behavior needed for a stable connection.

However, that simple solution has one significant disadvantage. In industrial deployments we often run into incompatibilities. In my tests I compared beacons from the real coordinator and the Nordic coordinator firmware. Notable differences were visible in stack profile headers:

The stack profile identifies the network profile type. Common values include 0x00, which is a network-specific (private) profile, and 0x02, which is a Zigbee Pro (public) profile.

If the endpoint expects a network-specific profile (i.e., it uses a private vendor profile) and we provide Zigbee Pro, the endpoint will refuse to join. Devices that only understand private profiles will not join public-profile networks, and vice versa. In my case, I could not change the Nordic firmware to match the proprietary stack profile, so the endpoint refused to join.

Because of this discrepancy, the “flash a coordinator firmware on the dongle” fix was ineffective in that environment. This is why the standard off-the-shelf tools and firmware often fail in industrial cases, forcing us to continue working with and optimizing our custom setup instead.

Back to the roots

In our previous test setup we used a sniffer in promiscuous mode, which receives every frame on the air regardless of destination. Real Zigbee (IEEE 802.15.4) nodes do not work like that. At the MAC/802.15.4 layer, a node filters frames by PAN ID and destination address. A frame is only passed to upper layers if the PAN ID matches and the destination address is the node’s address or a broadcast address.

We can mimic that real behavior on the dongle by running Zephyr RTOS and making the dongle act as a basic 802.15.4 coordinator. In that role, we set a PAN ID and short network address on the dongle so that the radio only accepts frames that match those criteria. This is important because it allows the dongle to handle auto-ACKs and MAC-level timing: the dongle will immediately send ACKs at the MAC level.

With the dongle doing MAC-level work (sending ACKs and PAN filtering), we can implement the Zigbee logic in Python. Scapy helps a lot with packet construction: we can create our own beacons with the headers matching those of the original coordinator, which solves the incompatibility problem. However, we must still implement the higher-level Zigbee state machine in our code, including connection initiation, association, network key handling, APS/AF behavior, and application payload handling. That’s the hardest part.

There is one timing problem that we cannot solve in Python: the very first steps of initiating a connection require immediate packet responses. To handle this issue, we implemented the time-critical parts in C on the dongle firmware. For example, we can statically generate the packets for connection initiation in Python and hard-code them in the firmware. Then, using “if” statements, we can determine how to respond to each packet from the endpoint.

So, we let the dongle (C/Zephyr) handle MAC-level ACKs and the initial association handshake, but let Python build higher-level packets and instruct the dongle what to send next when dealing with the application level. This hybrid model reduces latency and maintains a stable connection. The final architecture looks like this:

Deliver the key

Here’s a quick recap of how joining works: a Zigbee endpoint broadcasts beacon requests across channels, waits for beacon responses, chooses a coordinator, and sends an association request, followed by a data request to identify its short address. The coordinator then sends a transport key packet containing the network key. If the endpoint has the correct link key, it can decrypt the transport key packet and obtain the network key, meaning it has now been authenticated. From that point on, network traffic is encrypted with the network key. The entire process looks like this:

The sticking point is the transport key packet. This packet is protected using the link key, a per-device key shared between the coordinator (Trust Center) and the joining endpoint. Before the link key can be used for encryption, it often needs to be processed (hashed/derived) according to Zigbee’s key derivation rules. Since there is no trivial Python implementation that implements this hashing algorithm, we may need to implement the algorithm ourselves.

I implemented the required key derivation; the code is available on our GitHub.

Now that we’ve managed to obtain the hashed link key and deliver it to the endpoint, we can successfully mimic a coordinator.

The final success

If we follow the steps above, we can get the endpoint to join our spoofed coordinator. Once the endpoint joins, it will often remain associated with our coordinator, even after we power it down (until another event causes it to re-evaluate its connection). From that point on, we can interact with the device at the application layer using Python. Getting access as a coordinator allowed us to switch the relay on and off as intended, but also provided much more functionality and control over the node.

Conclusion

In conclusion, this study demonstrates why private vendor profiles in industrial environments complicate assessments: common tools and frameworks often fail, necessitating the development of custom tools and firmware. We tested a simple two-node scenario, but with multiple nodes the attack surface changes drastically and new attack vectors emerge (for example, attacks against routing protocols).

As we saw, a misconfigured Zigbee setup can lead to a complete network compromise. To improve Zigbee security, use the latest specification’s security features, such as using installation codes to derive unique link keys for each device. Also, avoid using hard-coded or default keys. Finally, it is not recommended to use the network key encryption model. Add another layer of security in addition to the network level protection by using end-to-end encryption at the application level.

Hunting for Mythic in network traffic

Post-exploitation frameworks

Threat actors frequently employ post-exploitation frameworks in cyberattacks to maintain control over compromised hosts and move laterally within the organization’s network. While they once favored closed-source frameworks, such as Cobalt Strike and Brute Ratel C4, open-source projects like Mythic, Sliver, and Havoc have surged in popularity in recent years. Malicious actors are also quick to adopt relatively new frameworks, such as Adaptix C2.

Analysis of popular frameworks revealed that their development focuses heavily on evading detection by antivirus and EDR solutions, often at the expense of stealth against systems that analyze network traffic. While obfuscating an agent’s network activity is inherently challenging, agents must inevitably communicate with their command-and-control servers. Consequently, an agent’s presence in the system and its malicious actions can be detected with the help of various network-based intrusion detection systems (IDS) and, of course, Network Detection and Response (NDR) solutions.

This article examines methods for detecting the Mythic framework within an infrastructure by analyzing network traffic. This framework has gained significant traction among various threat actors, including Mythic Likho (Arcane Wolf) и GOFFEE (Paper Werewolf), and continues to be used in APT and other attacks.

The Mythic framework

Mythic C2 is a multi-user command and control (C&C, or C2) platform designed for managing malicious agents during complex cyberattacks. Mythic is built on a Docker container architecture, with its core components – the server, agents, and transport modules – written in Python. This architecture allows operators to add new agents, communication channels, and custom modifications on the fly.

Since Mythic is a versatile tool for the attacker, from the defender’s perspective, its use can align with multiple stages of the Unified Kill Chain, as well as a large number of tactics, techniques, and procedures in the MITRE ATT&CK® framework.

  • Pivoting is a tactic where the attacker uses an already compromised system as a pivot point to gain access to other systems within the network. In this way, they gradually expand their presence within the organization’s infrastructure, bypassing firewalls, network segmentation, and other security controls.
  • Collection (TA0009) is a tactic focused on gathering and aggregating information of value to the attacker: files, credentials, screenshots, and system logs. In the context of network operations, collection is often performed locally on compromised hosts, with data then packaged for transfer. Tools like Mythic automate the discovery and selection of data sought by the adversary.
  • Exfiltration (TA0010) is the process of moving collected information out of the secured network via legitimate or covert channels, such as HTTP(s), DNS, or SMB, etc. Attackers may use resident agents or intermediate relays (pivot hosts) to conceal the exfiltration source and route.
  • Command and Control (TA0011) encompasses the mechanisms for establishing and maintaining a communication channel between the operator and compromised hosts to transmit commands and receive status updates. This includes direct connections, relaying through pivot hosts, and the use of covert protocols. Frameworks like Mythic provide advanced C2 capabilities, such as scheduled command execution, tunneling, and multi-channel communication, which complicate the detection and blocking of their activity.

This article focuses exclusively on the Command and Control (TA0011) tactic, whose techniques can be effectively detected within the network traffic of Mythic agents.

Detecting Mythic agent activity in network traffic

At the time of writing, Mythic supports data transfer over HTTP/S, WebSocket, TCP, SMB, DNS, and MQTT. The platform also boasts over a dozen different agents, written in Go, Python, and C#, designed for Windows, macOS, and Linux.

Mythic employs two primary architectures for its command network:

  • In this model, agents communicate with adjacent agents forming a chain of connections which eventually leads to a node communicating directly with the Mythic C2 server. For this purpose, agents utilize TCP and SMB.
  • In this model, agents communicate directly with the C2 server via HTTP/S, WebSocket, MQTT, or DNS.

P2P communication

Mythic provides pivoting capabilities via named SMB pipes and TCP sockets. To detect Mythic agent activity in P2P mode, we will examine their network traffic and create corresponding Suricata detection rules (signatures).

P2P communication via SMB

When managing agents via the SMB protocol, a named pipe is used by default for communication, with its name matching the agent’s UUID.

Although this parameter can be changed, it serves as a reliable indicator and can be easily described with a regular expression. Example:
[a-z0-9]{8}\-[a-z0-9]{4}\-[a-z0-9]{4}\-[a-z0-9]{4}\-[a-z0-9]{12}

For SMB communication, agents encode and encrypt data according to the pattern: base64(UUID+AES256(JSON)). This data is then split into blocks and transmitted over the network. The screenshot below illustrates what a network session for establishing a connection between agents looks like in Wireshark.

Commands and their responses are packaged within the MythicMessage data structure. This structure contains three header fields, as well as the commands themselves or the corresponding responses:

  • Total size (4 bytes)
  • Number of data blocks (4 bytes)
  • Current block number (4 bytes)
  • Base64-encoded data

The screenshot below shows an example of SMB communication between agents.

The agent (10.63.101.164) sends a command to another agent in the MythicMessage format. The first three Write Requests transmit the total message size, total number of blocks, and current block number. The fourth request transmits the Base64-encoded data. This is followed by a sequence of Read Requests, which are also transmitted in the MythicMessage format.

Below are the data transmitted in the fourth field of the MythicMessage structure.

The content is encoded in Base64. Upon decoding, the structure of the transmitted information becomes visible: it begins with the UUID of the infected host, followed by a data block encrypted using AES-256.

The fact that the data starts with a UUID string can be leveraged to create a signature-based detection rule that searches network packets for the identifier pattern.

To search for packets containing a UUID, the following signature can be applied. It uses specific request types and protocol flags as filters (Command: Ioctl (11), Function: FSCTL_PIPE_WAIT (0x00110018)), followed by a check to see if the pipe name matches the UUID pattern.

alert tcp any any -> any [139, 445] (msg: "Trojan.Mythic.SMB.C&C"; flow: to_server, established; content: "|fe|SMB"; offset: 4; depth: 4; content: "|0b 00|"; distance: 8; within: 2; content: "|18 00 11 00|"; distance: 48; within: 12; pcre: "/\x48\x00\x00\x00[\x00-\xFF]{2}([a-z0-9]\x00){8}\-\x00([a-z0-9]\x00){4}\-\x00([a-z0-9]\x00){4}\-\x00([a-z0-9]\x00){4}\-\x00([a-z0-9]\x00){12}$/R"; threshold: type both, track by_src, count 1, seconds 60; reference: url, https://github.com/MythicC2Profiles/smb; classtype: ndr1; sid: 9000101; rev: 1;)

Agent activity can also be detected by analyzing data transmitted in SMB WriteRequest packets with the protocol flag Command: Write (9) and a distinct packet structure where the BlobOffset and BlobLen fields are set to zero. If the Data field is Base64-encoded and, after decoding, begins with a UUID-formatted string, this indicates a command-and-control channel.

alert tcp any any -> any [139, 445] (msg: "Trojan.Mythic.SMB.C&C"; flow: to_server, established; dsize: > 360; content: "|fe|SMB"; offset: 4; depth: 4; content: "|09 00|"; distance: 8; within: 2; content: "|00 00 00 00 00 00 00 00 00 00 00 00|"; distance: 86; within: 12; base64_decode: bytes 64, offset 0, relative; base64_data; pcre: "/^[a-z0-9]{8}\-[a-z0-9]{4}\-[a-z0-9]{4}\-[a-z0-9]{4}\-[a-z0-9]{12}/"; threshold: type both, track by_src, count 1, seconds 60; reference: url, https://github.com/MythicC2Profiles/smb; classtype: ndr1; sid: 9000102; rev: 1;)

Below is the KATA NDR user interface displaying an alert about detecting a Mythic agent operating in P2P mode over SMB. In this instance, the first rule – which checks the request type, protocol flags, and the UUID pattern – was triggered.

It should be noted that these signatures have a limitation. If the SMBv3 protocol with encryption enabled is used, Mythic agent activity cannot be detected with signature-based methods. A possible alternative is behavioral analysis. However, in this context, it suffers from low accuracy and a high false-positive rate. The SMB protocol is widely used by organizations for various legitimate purposes, making it difficult to isolate behavioral patterns that definitively indicate malicious activity.

P2P communication via TCP

Mythic also supports P2P communications via TCP. The connection initialization process appears in network traffic as follows:

As with SMB, the MythicMessage structure is used for transmitting and receiving data. First, the data length (4 bytes) is sent as a big-endian DWORD in a separate packet. Subsequent packets transmit the number of data blocks, the current block number, and the data itself. However, unlike SMB packets, the value of the current block number field is always 0x00000000, due to TCP’s built-in packet fragmentation support.

The data encoding scheme is also analogous to what we observed with SMB and appears as follows: base64(UUID+AES256(JSON)). Below is an example of a network packet containing Mythic data.

The decoded data appears as follows:

Similar to communication via SMB, signature-based detection rules can be created for TCP traffic to identify Mythic agent activity by searching for packets containing UUID-formatted strings. Below are two Suricata detection rules. The first rule is a utility rule. It does not generate security alerts but instead tags the TCP session with an internal flag, which is then checked by another rule. The second rule verifies the flag and applies filters to confirm that the current packet is being analyzed at the beginning of a network session. It then decodes the Base64 data and searches the resulting content for a UUID-formatted string.

alert tcp any any -> any any (msg: "Trojan.Mythic.TCP.C&C"; flow: from_server, established; dsize: 4; stream_size: server, <, 6; stream_size: client, <, 3; content: "|00 00|"; depth: 2; pcre: "/^\x00\x00[\x00-\x5C]{1}[\x00-\xFF]{1}$/"; flowbits: set, mythic_tcp_p2p_msg_len; flowbits: noalert; threshold: type both, track by_src, count 1, seconds 60; reference: url, https://github.com/MythicC2Profiles/tcp; classtype: ndr1; sid: 9000103; rev: 1;)

alert tcp any any -> any any (msg: "Trojan.Mythic.TCP.C&C"; flow: from_server, established; dsize: > 300; stream_size: server, <, 6000; stream_size: client, <, 6000; flowbits: isset, mythic_tcp_p2p_msg_len; content: "|00 00 00|"; depth: 3; content: "|00 00 00 00|"; distance: 1; within: 4; base64_decode: bytes 64, offset 0, relative; base64_data; pcre: "/^[a-z0-9]{8}\-[a-z0-9]{4}\-[a-z0-9]{4}\-[a-z0-9]{4}\-[a-z0-9]{12}/"; threshold: type both, track by_src, count 1, seconds 60; reference: url, https://github.com/MythicC2Profiles/tcp; classtype: ndr1; sid: 9000104; rev: 1;)

Below is the NDR interface displaying an example of the two rules detecting a Mythic agent operating in P2P mode over TCP.

Egress transport modules

Covert Egress communication

For stealthy operations, Mythic allows agents to be managed through popular services. This makes its activity less conspicuous within network traffic. Mythic includes transport modules based on the following services:

  • Discord
  • GitHub
  • Slack

Of these, only the first two remain relevant at the time of writing. Communication via Slack (the Slack C2 Profile transport module) is no longer supported by the developers and is considered deprecated, so we will not examine it further.

The Discord C2 Profile transport module

The use of the Discord service as a mediator for C2 communication within the Mythic framework has been gaining popularity recently. In this scenario, agent traffic is indistinguishable from normal Discord activity, with commands and their execution results masquerading as messages and file attachments. Communication with the server occurs over HTTPS and is encrypted with TLS. Therefore, detecting Mythic traffic requires decrypting this.

Analyzing decrypted TLS traffic

Let’s assume we are using an NDR platform in conjunction with a network traffic decryption (TLS inspection) system to detect suspicious network activity. In this case, we operate under the assumption that we can decrypt all TLS traffic. Let’s examine possible detection rules for that scenario.

Agent and server communication occurs via Discord API calls to send messages to a specific channel. Communication between the agent and Mythic uses the MythicMessageWrapper structure, which contains the following fields:

  • message: the transmitted data
  • sender_id: a GUID generated by the agent, included in every message
  • to_server: a direction flag – a message intended for the server or the agent
  • id: not used
  • final: not used

Of particular interest to us is the message field, which contains the transmitted data encoded in Base64. The MythicMessageWrapper message is transmitted in plaintext, making it accessible to anyone with read permissions for messages on the Discord server.

Below is an example of data transmission via messages in a Discord channel.

To establish a connection, the agent authenticates to the Discord server via the API call /api/v10/gateway/bot. We observe the following data in the network traffic:

After successful initialization, the agent gains the ability to receive and respond to commands. To create a message in the channel, the agent makes a POST request to the API endpoint /channels/<channel.id>/messages. The network traffic for this call is shown in the screenshot below.

After decoding the Base64, the content of the message field appears as follows:

A structure characteristic of a UUID is visible at the beginning of the packet.

After processing the message, the agent deletes it from the channel via a DELETE request to the API endpoint /channels/{channel.id}/messages/{message.id}.

Below is a Suricata rule that detects the agent’s Discord-based communication activity. It checks the API activity for creating HTTP messages for the presence of Base64-encoded data containing the agent’s UUID.

alert tcp any any -> any any (msg: "Trojan.Mythic.HTTP.C&C"; flow: to_server, established; content: "POST"; http_method; content: "/api/"; http_uri; content: "/channels/"; distance: 0; http_uri; pcre: "/\/messages$/U"; content: "|7b 22|content|22|"; depth: 20; http_client_body; content: "|22|sender_id"; depth: 1500; http_client_body; pcre: "/\x22sender_id\x5c\x22\x3a\x5c\x22[a-z0-9]{8}\-[a-z0-9]{4}\-[a-z0-9]{4}\-[a-z0-9]{4}\-[a-z0-9]{12}/"; threshold: type both, track by_src, count 1, seconds 60; reference: url, https://github.com/MythicC2Profiles/discord; classtype: ndr1; sid: 9000105; rev: 1;)

Below is the NDR user interface displaying an example of detecting the activity of the Discord C2 Profile transport module for a Mythic agent within decrypted HTTP traffic.

Analyzing encrypted TLS traffic

If Discord usage is permitted on the network and there is no capability to decrypt traffic, it becomes nearly impossible to detect agent activity. In this scenario, behavioral analysis of requests to the Discord server may prove useful. Below is network traffic showing frequent TLS connections to the Discord server, which could indicate commands being sent to an agent.

In this case, we can use a Suricata rule to detect the frequent TLS sessions with Discord servers:

alert tcp any any -> any any (msg: "NetTool.PossibleMythicDiscordEgress.TLS.C&C"; flow: to_server, established; tls_sni; content: "discord.com"; nocase; threshold: type both, track by_src, count 4, seconds 420; reference: url, https://github.com/MythicC2Profiles/discord; classtype: ndr3; sid: 9000106; rev: 1;)

Another method for detecting these communications involves tracking multiple DNS queries to the discord.com domain.

The following rule can be applied to detect these:

alert udp any any -> any 53 (msg: "NetTool.PossibleMythicDiscordEgress.DNS.C&C"; content: "|01 00 00 01 00 00 00 00 00 00|"; depth: 10; offset: 2; content: "|07|discord|03|com|00|"; nocase; distance: 0; threshold: type both, track by_src, count 4, seconds 60; reference: url, https://github.com/MythicC2Profiles/discord; classtype: ndr3; sid: 9000107; rev: 1;)

Below is the NDR user interface showing an example of a custom rule in operation, detecting the activity of the Discord C2 Profile transport module for a Mythic agent within encrypted traffic based on characteristic DNS queries.

The proposed rule options have low accuracy and can generate a high number of false positives. Therefore, they must be adapted to the specific characteristics of the infrastructure in which they will run. Threshold and count parameters, which control the triggering frequency and time window, require tuning.

GitHub C2 Profile transport module

GitHub’s popularity has made it an attractive choice as a mediator for managing Mythic agents. The core concept is the same as in other covert Egress communication transport modules. Communication with GitHub utilizes HTTPS. Successful operation requires an account on the target platform and the ability to communicate via API calls. The transport module utilizes the GitHub API to send comments to pre-created Issues and to commit files to a branch within a repository controlled by the attackers. In this model, the agent interacts only with GitHub: it creates and reads comments, uploads files, and manages branches. It does not communicate with any other servers. The communication algorithm via GitHub is as follows:

  1. The agent posts a comment (check-in) to a designated Issue on GitHub, intended for agents to report their results.
  2. The Mythic server validates the comment, deletes it, and posts a reply in an issue designated for server use.
  3. The agent creates a branch with a name matching its UUID and writes a get_tasking file to it (performs a push request).
  4. The Mythic server reads the file and writes a response file to the same branch.
  5. The agent reads the response file, deletes the branch, pauses, and repeats the cycle.
Analyzing decrypted TLS traffic

Let’s consider an approach to detecting agent activity when traffic decryption is possible.

Agent communication with the server utilizes API calls to GitHub. The payload is encoded in Base64 and published in plaintext; therefore, anyone who can view the repository or analyze the traffic contents can decode it.

Analysis of agent communication revealed that the most useful traffic for creating detection rules is associated with publishing check-in comments, creating a branch, and publishing a file.

During the check-in phase, the agent posts a comment to register a new agent and establish communication.

The transmitted data is encoded in Base64 and contains the agent’s UUID and the portion of the message encrypted using AES-256.

This allows for a signature that detects UUID-formatted substrings within GitHub comment creation requests.

alert tcp any any -> any any (msg: "Trojan.Mythic.HTTP.C&C"; flow: to_server, established; content: "POST"; http_method; content: "api.github.com"; http_host; content: "/repos/"; depth: 8; http_uri; pcre: "/\/comments$/U"; content: "|22|body|22|"; depth: 8; http_client_body; base64_decode: bytes 300, offset 2, relative; base64_data; pcre: "/^[a-z0-9]{8}\-[a-z0-9]{4}\-[a-z0-9]{4}\-[a-z0-9]{4}\-[a-z0-9]{12}/"; threshold: type both, track by_src, count 1, seconds 60; reference: url, https://github.com/MythicC2Profiles/github; classtype: ndr1; sid: 9000108; rev: 1;)

Another stage suitable for detection is when the agent creates a separate branch with its UUID as the name. All subsequent relevant communication with the server will occur within this branch. Here is an example of a branch creation request:

Therefore, we can create a detection rule to identify UUID-formatted strings within branch creation requests.

alert tcp any any -> any any (msg: "Trojan.Mythic.HTTP.C&C"; flow: to_server, established; content: "POST"; http_method; content: "api.github.com"; http_host; content: "/repos/"; depth: 100; http_uri; content: "/git/refs"; distance: 0; http_uri; content: "|22|ref|22 3a|"; depth: 10; http_client_body; content: "refs/heads/"; distance: 0; within: 50; http_client_body; pcre: "/refs\/heads\/[a-z0-9]{8}\-[a-z0-9]{4}\-[a-z0-9]{4}\-[a-z0-9]{4}\-[a-z0-9]{12}\x22/"; threshold: type both, track by_src, count 1, seconds 60; reference: url, https://github.com/MythicC2Profiles/github; classtype: ndr1; sid: 9000109; rev: 1;)

After creating the branch, the agent writes a file to it (sends a push request), which contains Base64-encoded data.

Therefore, we can create a rule to trigger on file publication requests to a branch whose name matches the UUID pattern.

alert tcp any any -> any any (msg: "Trojan.Mythic.HTTP.C&C"; flow: to_server, established; content: "PUT"; http_method; content: "api.github.com"; http_host; content: "/repos/"; depth:8; http_uri; content: "/contents/"; distance: 0; http_uri; content: "|22|content|22|"; depth: 100; http_client_body; pcre: "/\x22message\x22\x3a\x22[a-z0-9]{8}\-[a-z0-9]{4}\-[a-z0-9]{4}\-[a-z0-9]{4}\-[a-z0-9]{12}\x22/"; threshold: type both, track by_src, count 1, seconds 60; reference: url, https://github.com/MythicC2Profiles/github; classtype: ndr1; sid: 9000110; rev: 1;)

The screenshot below shows how the NDR solution logs all suspicious communications using the GitHub API and subsequently identifies the Mythic agent’s activity. The result is an alert with the verdict Trojan.Mythic.HTTP.C&C.

Analyzing encrypted TLS traffic

Communication with GitHub occurs over HTTPS; therefore, in the absence of traffic decryption capability, signature-based methods for detecting agent activity cannot be applied. Let’s consider a behavioral agent activity detection approach.

For instance, it is possible to detect connections to GitHub servers that are atypical in frequency and purpose, originating from network segments where this activity is not expected. The screenshot below shows an example of an agent’s multiple TLS sessions. The traffic reflects the execution of several commands, as well as idle time, manifested as constant polling of the server while awaiting new tasks.

Multiple TLS sessions with the GitHub service from uncharacteristic network segments can be detected using the rule presented below:

alert tcp any any -> any any (msg:"NetTool.PossibleMythicGitHubEgress.TLS.C&C"; flow: to_server, established; tls_sni; content: "api.github.com"; nocase; threshold: type both, track by_src, count 4, seconds 60; reference: url, https://github.com/MythicC2Profiles/github; classtype: ndr3; sid: 9000111; rev: 1;)

Additionally, multiple DNS queries to the service can be logged in the traffic.

This activity is detected with the help of the following rule:

alert udp any any -> any 53 (msg: "NetTool.PossibleMythicGitHubEgress.DNS.C&C"; content: "|01 00 00 01 00 00 00 00 00 00|"; depth: 10; offset: 2; content: "|03|api|06|github|03|com|00|"; nocase; distance: 0; threshold: type both, track by_src, count 12, seconds 180; reference: url, https://github.com/MythicC2Profiles/github; classtype: ndr3; sid: 9000112; rev: 1;)

The screenshot below shows the NDR interface with an example of the first rule in action, detecting traces of the GitHub profile activity for a Mythic agent within encrypted TLS traffic.

The suggested rule options can produce false positives, so to improve their effectiveness, they must be adapted to the specific characteristics of the infrastructure in which they will run. The parameters of the threshold keyword – specifically the count and seconds values, which control the number of events required to generate an alert and the time window for their occurrence in NDR – must be configured.

Direct Egress communication

The Egress communication model allows agents to interact directly with the C2 server via the following protocols:

  • HTTP(S)
  • WebSocket
  • MQTT
  • DNS

The first two protocols are the most prevalent. The DNS-based transport module is still under development, and the module based on MQTT sees little use among operators. We will not examine them within the scope of this article.

Communication via HTTP

HTTP is the most common protocol for building a Mythic agent control network. The HTTP transport container acts as a proxy between the agents and the Mythic server. It allows data to be transmitted in both plaintext and encrypted form. Crucially, the metadata is not encrypted, which enables the creation of signature-based detection rules.

Below is an example of unencrypted Mythic network traffic over HTTP. During a GET request, data encoded in Base64 is passed in the value of the query parameter.

After decoding, the agent’s UUID – generated according to a specific pattern – becomes visible. This identifier is followed by a JSON object containing the key parameters of the host, collected by the agent.

If data encryption is applied, the network traffic for agent communication appears as shown in the screenshot below.

After decrypting the traffic and decoding from Base64, the communication data reveals the familiar structure: UUID+AES256(JSON).

Therefore, to create a detection signature for this case, we can also rely on the presence of a UUID within the Base64-encoded data in POST requests.

alert tcp any any -> any any (msg: "Trojan.Mythic.HTTP.C&C"; flow: to_server, established; content: "POST"; http_method; content: "|0D 0A 0D 0A|"; base64_decode: bytes 80, offset 0, relative; base64_data; content: "-"; offset: 8; depth: 1; content: "-"; distance: 4; within: 1; content: "-"; distance: 4; within: 1; content: "-"; distance: 4; within: 1; pcre: "/[0-9a-fA-F]{8}\-[0-9a-fA-F]{4}\-[0-9a-fA-F]{4}\-[0-9a-fA-F]{4}\-[0-9a-fA-F]{12}/"; threshold: type both, track by_src, count 1, seconds 180; reference: md5, 6ef89ccee639b4df42eaf273af8b5ffd; classtype: trojan1; sid: 9000113; rev: 2;)

The screenshot below shows how the NDR platform detects agent communication with the server over HTTP, generating an alert with the name Trojan.Mythic.HTTP.C&C.

Communication via HTTPS

Mythic agents can communicate with the server via HTTPS using the corresponding transport module. In this case, data is encrypted with TLS and is not amenable to signature-based analysis. However, the activity of Mythic agents can be detected if they use the default SSL certificate. Below is an example of network traffic from a Mythic agent with such a certificate.

For this purpose, the following signature is applied:

alert tcp any any -> any any (msg:"Trojan.Mythic.TLS.C&C"; flow:established, from_server; content:"|16 03|"; depth:2; content:"|0B|"; distance:3; within:1; content:"|55 04|"; distance:0; content:"|09|Mythic C2"; nocase; distance:0; threshold:type both,track by_src,count 1,seconds 60; reference:url,github.com/its-a-feature/Mythic; classtype:ndr1; sid:9000114; rev:1;)

WebSocket

The WebSocket protocol enables full-duplex communication between a client and a remote host. Mythic can utilize it for agent management.

The process of agent communication with the server via WebSocket is as follows:

  1. The agent sends a request to the WebSocket container to change the protocol for the HTTP(S) connection.
  2. The agent and the WebSocket container switch to WebSocket to send and receive messages.
  3. The agent sends a message to the WebSocket container requesting tasks from the Mythic container.
  4. The WebSocket container forwards the request to the Mythic container.
  5. The Mythic container returns the tasks to the WebSocket container.
  6. The WebSocket container forwards these tasks to the agent.

It is worth mentioning that in this communication model, both the WebSocket container and the Mythic container reside on the Mythic server. Below is a screenshot of the initial agent connection to the server.

An analysis of the TCP session shows that the actual data is transmitted in the data field in Base64 encoding.

Decoding reveals the familiar data structure: UUID+AES256(JSON).

Therefore, we can use an approach similar to those discussed above to detect agent activity. The signature should rely on the UUID string at the beginning of the data field. The rule first verifies that the session data matches the data:base64 format, then decodes the data field and searches for a string matching the UUID pattern.

alert tcp any any -> any any (msg: "Trojan.Mythic.WebSocket.C&C"; flow: established, from_server; content: "|7B 22|data|22 3a 22|"; depth: 14; pcre: "/^[0-9a-zA-Z\/\+]+[=]{0,2}\x22\x7D\x0A$/R"; content: "|7B 22|data|22 3a 22|"; depth: 14; base64_decode: bytes 48, offset 0, relative; base64_data; pcre: "/^[a-z0-9]{8}\-[a-z0-9]{4}\-[a-z0-9]{4}\-[a-z0-9]{4}\-[a-z0-9]{12}/i"; threshold: type both, track by_src, count 1, seconds 30; reference: url, https://github.com/MythicAgents/; classtype: ndr1; sid: 9000115; rev: 2;)

Below is the Trojan.Mythic.WebSocket.C&C signature triggering on Mythic agent communication over WebSocket.

Takeaways

The Mythic post-exploitation framework continues to gain popularity and evolve rapidly. New agents are emerging, designed for covert persistence within target infrastructures. Despite this evolution, the various implementations of network communication in Mythic share many common characteristics that remain largely consistent over time. This consistency enables IDS/NDR solutions to effectively detect the framework’s agent activity through network traffic analysis.

Mythic supports a wide array of agent management options utilizing several network protocols. Our analysis of agent communications across these protocols revealed that agent activity can be detected by searching for specific data patterns within network traffic. The primary detection criterion involves tracking UUID strings in specific positions within Base64-encoded transmitted data. However, while the general approach to detecting agent activity is similar across protocols, each requires protocol-specific filters. Consequently, creating a single, universal signature for detecting Mythic agents in network traffic is challenging; individual detection rules must be crafted for each protocol. This article has provided signatures that are included in Kaspersky NDR.

Kaspersky NDR is designed to identify current threats within network infrastructures. It enables the detection of all popular post-exploitation frameworks based on their characteristic traffic patterns. Since the network components of these frameworks change infrequently, employing an NDR solution ensures high effectiveness in agent discovery.

Kaspersky verdicts in Kaspersky solutions (Kaspersky Anti-Targeted Attack with NDR module and Kaspersky NGFW)

Trojan.Mythic.SMB.C&C
Trojan.Mythic.TCP.C&C
Trojan.Mythic.HTTP.C&C
Trojan.Mythic.TLS.C&C
Trojan.Mythic.WebSocket.C&C

How we trained an ML model to detect DLL hijacking

DLL hijacking is a common technique in which attackers replace a library called by a legitimate process with a malicious one. It is used by both creators of mass-impact malware, like stealers and banking Trojans, and by APT and cybercrime groups behind targeted attacks. In recent years, the number of DLL hijacking attacks has grown significantly.

Trend in the number of DLL hijacking attacks. 2023 data is taken as 100% (download)

We have observed this technique and its variations, like DLL sideloading, in targeted attacks on organizations in Russia, Africa, South Korea, and other countries and regions. Lumma, one of 2025’s most active stealers, uses this method for distribution. Threat actors trying to profit from popular applications, such as DeepSeek, also resort to DLL hijacking.

Detecting a DLL substitution attack is not easy because the library executes within the trusted address space of a legitimate process. So, to a security solution, this activity may look like a trusted process. Directing excessive attention to trusted processes can compromise overall system performance, so you have to strike a delicate balance between a sufficient level of security and sufficient convenience.

Detecting DLL hijacking with a machine-learning model

Artificial intelligence can help where simple detection algorithms fall short. Kaspersky has been using machine learning for 20 years to identify malicious activity at various stages. The AI expertise center researches the capabilities of different models in threat detection, then trains and implements them. Our colleagues at the threat intelligence center approached us with a question of whether machine learning could be used to detect DLL hijacking, and more importantly, whether it would help improve detection accuracy.

Preparation

To determine if we could train a model to distinguish between malicious and legitimate library loads, we first needed to define a set of features highly indicative of DLL hijacking. We identified the following key features:

  • Wrong library location. Many standard libraries reside in standard directories, while a malicious DLL is often found in an unusual location, such as the same folder as the executable that calls it.
  • Wrong executable location. Attackers often save executables in non-standard paths, like temporary directories or user folders, instead of %Program Files%.
  • Renamed executable. To avoid detection, attackers frequently save legitimate applications under arbitrary names.
  • Library size has changed, and it is no longer signed.
  • Modified library structure.

Training sample and labeling

For the training sample, we used dynamic library load data provided by our internal automatic processing systems, which handle millions of files every day, and anonymized telemetry, such as that voluntarily provided by Kaspersky users through Kaspersky Security Network.

The training sample was labeled in three iterations. Initially, we could not automatically pull event labeling from our analysts that indicated whether an event was a DLL hijacking attack. So, we used data from our databases containing only file reputation, and labeled the rest of the data manually. We labeled as DLL hijacking those library-call events where the process was definitively legitimate but the DLL was definitively malicious. However, this labeling was not enough because some processes, like “svchost”, are designed mainly to load various libraries. As a result, the model we trained on this data had a high rate of false positives and was not practical for real-world use.

In the next iteration, we additionally filtered malicious libraries by family, keeping only those which were known to exhibit DLL-hijacking behavior. The model trained on this refined data showed significantly better accuracy and essentially confirmed our hypothesis that we could use machine learning to detect this type of attacks.

At this stage, our training dataset had tens of millions of objects. This included about 20 million clean files and around 50,000 definitively malicious ones.

Status Total Unique files
Unknown ~ 18M ~ 6M
Malicious ~ 50K ~ 1,000
Clean ~ 20M ~ 250K

We then trained subsequent models on the results of their predecessors, which had been verified and further labeled by analysts. This process significantly increased the efficiency of our training.

Loading DLLs: what does normal look like?

So, we had a labeled sample with a large number of library loading events from various processes. How can we describe a “clean” library? Using a process name + library name combination does not account for renamed processes. Besides, a legitimate user, not just an attacker, can rename a process. If we used the process hash instead of the name, we would solve the renaming problem, but then every version of the same library would be treated as a separate library. We ultimately settled on using a library name + process signature combination. While this approach considers all identically named libraries from a single vendor as one, it generally produces a more or less realistic picture.

To describe safe library loading events, we used a set of counters that included information about the processes (the frequency of a specific process name for a file with a given hash, the frequency of a specific file path for a file with that hash, and so on), information about the libraries (the frequency of a specific path for that library, the percentage of legitimate launches, and so on), and event properties (that is, whether the library is in the same directory as the file that calls it).

The result was a system with multiple aggregates (sets of counters and keys) that could describe an input event. These aggregates can contain a single key (e.g., a DLL’s hash sum) or multiple keys (e.g., a process’s hash sum + process signature). Based on these aggregates, we can derive a set of features that describe the library loading event. The diagram below provides examples of how these features are derived:

Feature extraction from aggregates

Feature extraction from aggregates

Loading DLLs: how to describe hijacking

Certain feature combinations (dependencies) strongly indicate DLL hijacking. These can be simple dependencies. For some processes, the clean library they call always resides in a separate folder, while the malicious one is most often placed in the process folder.

Other dependencies can be more complex and require several conditions to be met. For example, a process renaming itself does not, on its own, indicate DLL hijacking. However, if the new name appears in the data stream for the first time, and the library is located on a non-standard path, it is highly likely to be malicious.

Model evolution

Within this project, we trained several generations of models. The primary goal of the first generation was to show that machine learning could at all be applied to detecting DLL hijacking. When training this model, we used the broadest possible interpretation of the term.

The model’s workflow was as simple as possible:

  1. We took a data stream and extracted a frequency description for selected sets of keys.
  2. We took the same data stream from a different time period and obtained a set of features.
  3. We used type 1 labeling, where events in which a legitimate process loaded a malicious library from a specified set of families were marked as DLL hijacking.
  4. We trained the model on the resulting data.
First-generation model diagram

First-generation model diagram

The second-generation model was trained on data that had been processed by the first-generation model and verified by analysts (labeling type 2). Consequently, the labeling was more precise than during the training of the first model. Additionally, we added more features to describe the library structure and slightly complicated the workflow for describing library loads.

Second-generation model diagram

Second-generation model diagram

Based on the results from this second-generation model, we were able to identify several common types of false positives. For example, the training sample included potentially unwanted applications. These can, in certain contexts, exhibit behavior similar to DLL hijacking, but they are not malicious and rarely belong to this attack type.

We fixed these errors in the third-generation model. First, with the help of analysts, we flagged the potentially unwanted applications in the training sample so the model would not detect them. Second, in this new version, we used an expanded labeling that included useful detections from both the first and second generations. Additionally, we expanded the feature description through one-hot encoding — a technique for converting categorical features into a binary format — for certain fields. Also, since the volume of events processed by the model increased over time, this version added normalization of all features based on the data flow size.

Third-generation model diagram

Third-generation model diagram

Comparison of the models

To evaluate the evolution of our models, we applied them to a test data set none of them had worked with before. The graph below shows the ratio of true positive to false positive verdicts for each model.

Trends in true positives and false positives from the first-, second-, and third-generation models

Trends in true positives and false positives from the first-, second-, and third-generation models

As the models evolved, the percentage of true positives grew. While the first-generation model achieved a relatively good result (0.6 or higher) only with a very high false positive rate (10⁻³ or more), the second-generation model reached this at 10⁻⁵. The third-generation model, at the same low false positive rate, produced 0.8 true positives, which is considered a good result.

Evaluating the models on the data stream at a fixed score shows that the absolute number of new events labeled as DLL Hijacking increased from one generation to the next. That said, evaluating the models by their false verdict rate also helps track progress: the first model has a fairly high error rate, while the second and third generations have significantly lower ones.

False positives rate among model outputs, July 2024 – August 2025 (download)

Practical application of the models

All three model generations are used in our internal systems to detect likely cases of DLL hijacking within telemetry data streams. We receive 6.5 million security events daily, linked to 800,000 unique files. Aggregates are built from this sample at a specified interval, enriched, and then fed into the models. The output data is then ranked by model and by the probability of DLL hijacking assigned to the event, and then sent to our analysts. For instance, if the third-generation model flags an event as DLL hijacking with high confidence, it should be investigated first, whereas a less definitive verdict from the first-generation model can be checked last.

Simultaneously, the models are tested on a separate data stream they have not seen before. This is done to assess their effectiveness over time, as a model’s detection performance can degrade. The graph below shows that the percentage of correct detections varies slightly over time, but on average, the models detect 70–80% of DLL hijacking cases.

DLL hijacking detection trends for all three models, October 2024 – September 2025 (download)

Additionally, we recently deployed a DLL hijacking detection model into the Kaspersky SIEM, but first we tested the model in the Kaspersky MDR service. During the pilot phase, the model helped to detect and prevent a number of DLL hijacking incidents in our clients’ systems. We have written a separate article about how the machine learning model for detecting targeted attacks involving DLL hijacking works in Kaspersky SIEM and the incidents it has identified.

Conclusion

Based on the training and application of the three generations of models, the experiment to detect DLL hijacking using machine learning was a success. We were able to develop a model that distinguishes events resembling DLL hijacking from other events, and refined it to a state suitable for practical use, not only in our internal systems but also in commercial products. Currently, the models operate in the cloud, scanning hundreds of thousands of unique files per month and detecting thousands of files used in DLL hijacking attacks each month. They regularly identify previously unknown variations of these attacks. The results from the models are sent to analysts who verify them and create new detection rules based on their findings.

Detecting DLL hijacking with machine learning: real-world cases

Introduction

Our colleagues from the AI expertise center recently developed a machine-learning model that detects DLL-hijacking attacks. We then integrated this model into the Kaspersky Unified Monitoring and Analysis Platform SIEM system. In a separate article, our colleagues shared how the model had been created and what success they had achieved in lab environments. Here, we focus on how it operates within Kaspersky SIEM, the preparation steps taken before its release, and some real-world incidents it has already helped us uncover.

How the model works in Kaspersky SIEM

The model’s operation generally boils down to a step-by-step check of all DLL libraries loaded by processes in the system, followed by validation in the Kaspersky Security Network (KSN) cloud. This approach allows local attributes (path, process name, and file hashes) to be combined with a global knowledge base and behavioral indicators, which significantly improves detection quality and reduces the probability of false positives.

The model can run in one of two modes: on a correlator or on a collector. A correlator is a SIEM component that performs event analysis and correlation based on predefined rules or algorithms. If detection is configured on a correlator, the model checks events that have already triggered a rule. This reduces the volume of KSN queries and the model’s response time.

This is how it looks:

A collector is a software or hardware component of a SIEM platform that collects and normalizes events from various sources, and then delivers these events to the platform’s core. If detection is configured on a collector, the model processes all events associated with various processes loading libraries, provided these events meet the following conditions:

  • The path to the process file is known.
  • The path to the library is known.
  • The hashes of the file and the library are available.

This method consumes more resources, and the model’s response takes longer than it does on a correlator. However, it can be useful for retrospective threat hunting because it allows you to check all events logged by Kaspersky SIEM. The model’s workflow on a collector looks like this:

It is important to note that the model is not limited to a binary “malicious/non-malicious” assessment; it ranks its responses by confidence level. This allows it to be used as a flexible tool in SOC practice. Examples of possible verdicts:

  • 0: data is being processed.
  • 1: maliciousness not confirmed. This means the model currently does not consider the library malicious.
  • 2: suspicious library.
  • 3: maliciousness confirmed.

A Kaspersky SIEM rule for detecting DLL hijacking would look like this:

N.KL_AI_DLLHijackingCheckResult > 1

Embedding the model into the Kaspersky SIEM correlator automates the process of finding DLL-hijacking attacks, making it possible to detect them at scale without having to manually analyze hundreds or thousands of loaded libraries. Furthermore, when combined with correlation rules and telemetry sources, the model can be used not just as a standalone module but as part of a comprehensive defense against infrastructure attacks.

Incidents detected during the pilot testing of the model in the MDR service

Before being released, the model (as part of the Kaspersky SIEM platform) was tested in the MDR service, where it was trained to identify attacks on large datasets supplied by our telemetry. This step was necessary to ensure that detection works not only in lab settings but also in real client infrastructures.

During the pilot testing, we verified the model’s resilience to false positives and its ability to correctly classify behavior even in non-typical DLL-loading scenarios. As a result, several real-world incidents were successfully detected where attackers used one type of DLL hijacking — the DLL Sideloading technique — to gain persistence and execute their code in the system.

Let us take a closer look at the three most interesting of these.

Incident 1. ToddyCat trying to launch Cobalt Strike disguised as a system library

In one incident, the attackers successfully leveraged the vulnerability CVE-2021-27076 to exploit a SharePoint service that used IIS as a web server. They ran the following command:

c:\windows\system32\inetsrv\w3wp.exe -ap "SharePoint - 80" -v "v4.0" -l "webengine4.dll" -a \\.\pipe\iisipmd32ded38-e45b-423f-804d-34471928538b -h "C:\inetpub\temp\apppools\SharePoint - 80\SharePoint - 80.config" -w "" -m 0

After the exploitation, the IIS process created files that were later used to run malicious code via the DLL sideloading technique (T1574.001 Hijack Execution Flow: DLL):

C:\ProgramData\SystemSettings.exe
C:\ProgramData\SystemSettings.dll

SystemSettings.dll is the name of a library associated with the Windows Settings application (SystemSettings.exe). The original library contains code and data that the Settings application uses to manage and configure various system parameters. However, the library created by the attackers has malicious functionality and is only pretending to be a system library.

Later, to establish persistence in the system and launch a DLL sideloading attack, a scheduled task was created, disguised as a Microsoft Edge browser update. It launches a SystemSettings.exe file, which is located in the same directory as the malicious library:

Schtasks  /create  /ru "SYSTEM" /tn "\Microsoft\Windows\Edge\Edgeupdates" /sc DAILY /tr "C:\ProgramData\SystemSettings.exe" /F

The task is set to run daily.

When the SystemSettings.exe process is launched, it loads the malicious DLL. As this happened, the process and library data were sent to our model for analysis and detection of a potential attack.

Example of a SystemSettings.dll load event with a DLL Hijacking module verdict in Kaspersky SIEM

Example of a SystemSettings.dll load event with a DLL Hijacking module verdict in Kaspersky SIEM

The resulting data helped our analysts highlight a suspicious DLL and analyze it in detail. The library was found to be a Cobalt Strike implant. After loading it, the SystemSettings.exe process attempted to connect to the attackers’ command-and-control server.

DNS query: connect-microsoft[.]com
DNS query type: AAAA
DNS response: ::ffff:8.219.1[.]155;
8.219.1[.]155:8443

After establishing a connection, the attackers began host reconnaissance to gather various data to develop their attack.

C:\ProgramData\SystemSettings.exe
whoami /priv
hostname
reg query HKLM\SOFTWARE\Microsoft\Cryptography /v MachineGuid
powershell -c $psversiontable
dotnet --version
systeminfo
reg query "HKEY_LOCAL_MACHINE\SOFTWARE\VMware, Inc.\VMware Drivers"
cmdkey /list
REG query "HKLM\SYSTEM\CurrentControlSet\Control\Terminal Server\WinStations\RDP-Tcp" /v PortNumber
reg query "HKEY_CURRENT_USER\Software\Microsoft\Terminal Server Client\Servers
netsh wlan show profiles
netsh wlan show interfaces
set
net localgroup administrators
net user
net user administrator
ipconfig /all
net config workstation
net view
arp -a
route print
netstat -ano
tasklist
schtasks /query /fo LIST /v
net start
net share
net use
netsh firewall show config
netsh firewall show state
net view /domain
net time /domain
net group "domain admins" /domain
net localgroup administrators /domain
net group "domain controllers" /domain
net accounts /domain
nltest / domain_trusts
reg query HKEY_LOCAL_MACHINE\SOFTWARE\Microsoft\Windows\CurrentVersion\Run
reg query HKEY_CURRENT_USER\Software\Microsoft\Windows\CurrentVersion\RunOnce
reg query HKEY_LOCAL_MACHINE\Software\Microsoft\Windows\CurrentVersion\Policies\Explorer\Run
reg query HKEY_LOCAL_MACHINE\Software\Wow6432Node\Microsoft\Windows\CurrentVersion\Run
reg query HKEY_CURRENT_USER\Software\Wow6432Node\Microsoft\Windows\CurrentVersion\RunOnce

Based on the attackers’ TTPs, such as loading Cobalt Strike as a DLL, using the DLL sideloading technique (1, 2), and exploiting SharePoint, we can say with a high degree of confidence that the ToddyCat APT group was behind the attack. Thanks to the prompt response of our model, we were able to respond in time and block this activity, preventing the attackers from causing damage to the organization.

Incident 2. Infostealer masquerading as a policy manager

Another example was discovered by the model after a client was connected to MDR monitoring: a legitimate system file located in an application folder attempted to load a suspicious library that was stored next to it.

C:\Program Files\Chiniks\SettingSyncHost.exe
C:\Program Files\Chiniks\policymanager.dll E83F331BD1EC115524EBFF7043795BBE

The SettingSyncHost.exe file is a system host process for synchronizing settings between one user’s different devices. Its 32-bit and 64-bit versions are usually located in C:\Windows\System32\ and C:\Windows\SysWOW64\, respectively. In this incident, the file location differed from the normal one.

Example of a policymanager.dll load event with a DLL Hijacking module verdict in Kaspersky SIEM

Example of a policymanager.dll load event with a DLL Hijacking module verdict in Kaspersky SIEM

Analysis of the library file loaded by this process showed that it was malware designed to steal information from browsers.

Graph of policymanager.dll activity in a sandbox

Graph of policymanager.dll activity in a sandbox

The file directly accesses browser files that contain user data.

C:\Users\<user>\AppData\Local\Google\Chrome\User Data\Local State

The library file is on the list of files used for DLL hijacking, as published in the HijackLibs project. The project contains a list of common processes and libraries employed in DLL-hijacking attacks, which can be used to detect these attacks.

Incident 3. Malicious loader posing as a security solution

Another incident discovered by our model occurred when a user connected a removable USB drive:

Example of a Kaspersky SIEM event where a wsc.dll library was loaded from a USB drive, with a DLL Hijacking module verdict

Example of a Kaspersky SIEM event where a wsc.dll library was loaded from a USB drive, with a DLL Hijacking module verdict

The connected drive’s directory contained hidden folders with an identically named shortcut for each of them. The shortcuts had icons typically used for folders. Since file extensions were not shown by default on the drive, the user might have mistaken the shortcut for a folder and launched it. In turn, the shortcut opened the corresponding hidden folder and ran an executable file using the following command:

"%comspec%" /q /c "RECYCLER.BIN\1\CEFHelper.exe [$DIGITS] [$DIGITS]"

CEFHelper.exe is a legitimate Avast Antivirus executable that, through DLL sideloading, loaded the wsc.dll library, which is a malicious loader.

Code snippet from the malicious file

Code snippet from the malicious file

The loader opens a file named AvastAuth.dat, which contains an encrypted backdoor. The library reads the data from the file into memory, decrypts it, and executes it. After this, the backdoor attempts to connect to a remote command-and-control server.

The library file, which contains the malicious loader, is on the list of known libraries used for DLL sideloading, as presented on the HijackLibs project website.

Conclusion

Integrating the model into the product provided the means of early and accurate detection of DLL-hijacking attempts which previously might have gone unnoticed. Even during the pilot testing, the model proved its effectiveness by identifying several incidents using this technique. Going forward, its accuracy will only increase as data accumulates and algorithms are updated in KSN, making this mechanism a reliable element of proactive protection for corporate systems.

IoC

Legitimate files used for DLL hijacking
E0E092D4EFC15F25FD9C0923C52C33D6 loads SystemSettings.dll
09CD396C8F4B4989A83ED7A1F33F5503 loads policymanager.dll
A72036F635CECF0DCB1E9C6F49A8FA5B loads wsc.dll

Malicious files
EA2882B05F8C11A285426F90859F23C6   SystemSettings.dll
E83F331BD1EC115524EBFF7043795BBE   policymanager.dll
831252E7FA9BD6FA174715647EBCE516   wsc.dll

Paths
C:\ProgramData\SystemSettings.exe
C:\ProgramData\SystemSettings.dll
C:\Program Files\Chiniks\SettingSyncHost.exe
C:\Program Files\Chiniks\policymanager.dll
D:\RECYCLER.BIN\1\CEFHelper.exe
D:\RECYCLER.BIN\1\wsc.dll

How attackers adapt to built-in macOS protection

If a system is popular with users, you can bet it’s just as popular with cybercriminals. Although Windows still dominates, second place belongs to macOS. And this makes it a viable target for attackers.

With various built-in protection mechanisms, macOS generally provides a pretty much end-to-end security for the end user. This post looks at how some of them work, with examples of common attack vectors and ways of detecting and thwarting them.

Overview of macOS security mechanisms

Let’s start by outlining the set of security mechanisms in macOS with a brief description of each:

  1. Keychain – default password manager
  2. TCC – application access control
  3. SIP – ensures the integrity of information in directories and processes vulnerable to attacks
  4. File Quarantine – protection against launching suspicious files downloaded from the internet
  5. Gatekeeper – ensures only trusted applications are allowed to run
  6. XProtect – signature-based anti-malware protection in macOS
  7. XProtect Remediator – tool for automatic response to threats detected by XProtect

Keychain

Introduced back in 1999, the password manager for macOS remains a key component in the Apple security framework. It provides centralized and secure storage of all kinds of secrets: from certificates and encryption keys to passwords and credentials. All user accounts and passwords are stored in Keychain by default. Access to the data is protected by a master password.

Keychain files are located in the directories ~/Library/Keychains/, /Library/Keychains/ and /Network/Library/Keychains/. Besides the master password, each of them can be protected with its own key. By default, only owners of the corresponding Keychain copy and administrators have access to these files. In addition, the files are encrypted using the reliable AES-256-GCM algorithm. This guarantees a high level of protection, even in the event of physical access to the system.

However, attacks on the macOS password manager still occur. There are specialized utilities, such as Chainbreaker, designed to extract data from Keychain files. With access to the file itself and its password, Chainbreaker allows an attacker to do a local analysis and full data decryption without being tied to the victim’s device. What’s more, native macOS tools such as the Keychain Access GUI application or the /usr/bin/security command-line utility can be used for malicious purposes if the system is already compromised.

So while the Keychain architecture provides robust protection, it is still vital to control local access, protect the master password, and minimize the risk of data leakage outside the system. Below is an example of a Chainbreaker command:

python -m chainbreaker -pa test_keychain.keychain -o output

As mentioned above, the security utility can be used for command line management, specifically the following commands:

  • security list-keychains – displays all available Keychain files
Keychain files available to the user

Keychain files available to the user

  • security dump-keychain -a -d – dumps all Keychain files
Keychain file dump

Keychain file dump

  • security dump-keychain ~/Library/Keychains/login.keychain-db – dumps a specific Keychain file (a user file is shown as an example)

To detect attacks of this type, you need to configure logging of process startup events. The best way to do this is with the built-in macOS logging tool, ESF. This allows you to collect necessary events for building detection logic. Collection of necessary events using this mechanism is already implemented and configured in Kaspersky Endpoint Detection and Response (KEDR).

Among the events necessary for detecting the described activity are those containing the security dump-keychain and security list-keychains commands, since such activity is not regular for ordinary macOS users. Below is an example of an EDR triggering on a Keychain dump event, as well as an example of a detection rule.

Example of an event from Kaspersky EDR

Example of an event from Kaspersky EDR

Sigma:

title: Keychain access
description: This rule detects dumping of keychain
tags:
    - attack.credential-access
    - attack.t1555.001
logsource:
    category: process_creation
    product: macos
detection:
    selection:
		cmdline: security
		cmdline: 
			-list-keychains
			-dump-keychain
    condition: selection
falsepositives:
    - Unknow
level: medium

SIP

System Integrity Protection (SIP) is one of the most important macOS security mechanisms, which is designed to prevent unauthorized interference in critical system files and processes, even by users with administrative rights. First introduced in OS X 10.11 El Capitan, SIP marked a significant step toward strengthening security by limiting the ability to modify system components, safeguarding against potential malicious influence.

The mechanism protects files and directories by assigning special attributes that block content modification for everyone except trusted system processes, which are inaccessible to users and third-party software. In particular, this makes it difficult to inject malicious components into these files. The following directories are SIP-protected by default:

  • /System
  • /sbin
  • /bin
  • /usr (except /usr/local)
  • /Applications (preinstalled applications)
  • /Library/Application Support/com.apple.TCC

A full list of protected directories is in the configuration file /System/Library/Sandbox/rootless.conf. These are primarily system files and preinstalled applications, but SIP allows adding extra paths.

SIP provides a high level of protection for system components, but if there is physical access to the system or administrator rights are compromised, SIP can be disabled – but only by restarting the system in Recovery Mode and then running the csrutil disable command in the terminal. To check the current status of SIP, use the csrutil status command.

Output of the csrutil status command

Output of the csrutil status command

To detect this activity, you need to monitor the csrutil status command. Attackers often check the SIP status to find available options. Because they deploy csrutil disable in Recovery Mode before any monitoring solutions are loaded, this command is not logged and so there is no point in tracking its execution. Instead, you can set up SIP status monitoring, and if the status changes, send a security alert.

Example of an event from Kaspersky EDR

Example of an event from Kaspersky EDR

Sigma:

title: SIP status discovery
description: This rule detects SIP status discovery
tags:
    - attack.discovery
    - attack.t1518.001
logsource:
    category: process_creation
    product: macos
detection:
    selection:
	cmdline: csrutil status
    condition: selection
falsepositives:
    - Unknow
level: low

TCC

macOS includes the Transparency, Consent and Control (TCC) framework, which ensures transparency of applications by requiring explicit user consent to access sensitive data and system functions. TCC is structured on SQLite databases (TCC.db), located both in shared directories (/Library/Application Support/com.apple.TCC/TCC.db) and in individual user directories (/Users/<username>/Library/Application Support/com.apple.TCC/TCC.db).

Contents of a table in the TCC database

Contents of a table in the TCC database

The integrity of these databases and protection against unauthorized access are implemented using SIP, making it impossible to modify them directly. To interfere with these databases, an attacker must either disable SIP or gain access to a trusted system process. This renders TCC highly resistant to interference and manipulation.

TCC works as follows: whenever an application accesses a sensitive function (camera, microphone, geolocation, Full Disk Access, input control, etc.) for the first time, an interactive window appears with a request for user confirmation. This allows the user to control the extension of privileges.

TCC access permission window

TCC access permission window

A potential vector for bypassing this mechanism is TCC Clickjacking – a technique that superimposes a visually altered window on top of the permissions request window, hiding the true nature of the request. The unsuspecting user clicks the button and grants permissions to malware. Although this technique does not exploit TCC itself, it gives attackers access to sensitive system functions, regardless of the level of protection.

Example of a superimposed window

Example of a superimposed window

Attackers are interested in obtaining Full Disk Access or Accessibility rights, as these permissions grant virtually unlimited access to the system. Therefore, monitoring changes to TCC.db and managing sensitive privileges remain vital tasks for ensuring comprehensive macOS security.

File Quarantine

File Quarantine is a built-in macOS security feature, first introduced in OS X 10.5 Tiger. It improves system security when handling files downloaded from external sources. This mechanism is analogous to the Mark-of-the-Web feature in Windows to warn users of potential danger before running a downloaded file.

Files downloaded through a browser or other application that works with File Quarantine are assigned a special attribute (com.apple.quarantine). When running such a file for the first time, if it has a valid signature and does not arouse any suspicion of Gatekeeper (see below), the user is prompted to confirm the action. This helps prevent running malware by accident.

Example of file attributes that include the quarantine attribute

Example of file attributes that include the quarantine attribute

To get detailed information about the com.apple.quarantine attribute, use the xattr -p com.apple.quarantine <File name> command. The screenshot below shows an example of the output of this command:

  • 0083 – flag for further Gatekeeper actions
  • 689cb865 – timestamp in hexadecimal format (Mac Absolute Time)
  • Safari – browser used to download the file
  • 66EA7FA5-1F9E-4779-A5B5-9CCA2A4A98F5 – UUID attached to this file. This is needed to database a record of the file
Detailed information about the com.apple.quarantine attribute

Detailed information about the com.apple.quarantine attribute

The information returned by this command is stored in a database located at ~/Library/Preferences/com.apple.LaunchServices.QuarantineEventsV2, where it can be audited.

Data in the com.apple.LaunchServices.QuarantineEventsV2 database

Data in the com.apple.LaunchServices.QuarantineEventsV2 database

To avoid having their files quarantined, attackers use various techniques to bypass File Quarantine. For example, files downloaded via curl, wget or other low-level tools that are not integrated with File Quarantine are not flagged with the quarantine attribute.

Bypassing quarantine using curl

Bypassing quarantine using curl

It is also possible to remove the attribute manually using the xattr -d com.apple.quarantine <filename> command.

Removing the quarantine attribute

Removing the quarantine attribute

If the quarantine attribute is successfully removed, no warning will be displayed when the file is run, which is useful in social engineering attacks or in cases where the attacker prefers to execute malware without the user’s knowledge.

Running a file without a File Quarantine check

Running a file without a File Quarantine check

To detect this activity, you need to monitor execution of the xattr command in conjunction with -d and com.apple.quarantine, which implies removal of the quarantine attribute. In an incident related to macOS compromise, also worth investigating is the origin of the file: if it got onto the host without being flagged by quarantine, this is an additional risk factor. Below is an example of an EDR triggering on a quarantine attribute removal event, as well as an example of a rule for detecting such events.

Example of an event from Kaspersky EDR

Example of an event from Kaspersky EDR

Sigma:

title: Quarantine attribute removal
description: This rule detects removal of the Quarantine attribute, that leads to avoid File Quarantine
tags:
    - attack.defense-evasion
    - attack.t1553.001
logsource:
    category: process_creation
    product: macos
detection:
    selection:
		cmdline: xattr -d com.apple.quarantine
    condition: selection
falsepositives:
    - Unknow
level: high

Gatekeeper

Gatekeeper is a key part of the macOS security system, designed to protect users from running potentially dangerous applications. First introduced in OS X Leopard (2012), Gatekeeper checks the digital signature of applications and, if the quarantine attribute (com.apple.quarantine) is present, restricts the launch of programs unsigned and unapproved by the user, thus reducing the risk of malicious code execution.

The spctl utility is used to manage Gatekeeper. Below is an example of calling spctl to check the validity of a signature and whether it is verified by Apple:

Spctl -a -t exec -vvvv <path to file>

Checking an untrusted file using spctl

Checking an untrusted file using spctl

Checking a trusted file using spctl

Checking a trusted file using spctl

Gatekeeper requires an application to be:

  • either signed with a valid Apple developer certificate,
  • or certified by Apple after source code verification.

If the application fails to meet these requirements, Gatekeeper by default blocks attempts to run it with a double-click. Unblocking is possible, but this requires the user to navigate through the settings. So, to carry out a successful attack, the threat actor has to not only persuade the victim to mark the application as trusted, but also explain to them how to do this. The convoluted procedure to run the software looks suspicious in itself. However, if the launch is done from the context menu (right-click → Open), the user sees a pop-up window allowing them to bypass the block with a single click by confirming their intention to use the application. This quirk is used in social engineering attacks: malware can be accompanied by instructions prompting the user to run the file from the context menu.

Example of Chropex Adware using this technique

Example of Chropex Adware using this technique

Let’s take a look at the method for running programs from the context menu, rather than double-clicking. If we double-click the icon of a program with the quarantine attribute, we get the following window.

Running a program with the quarantine attribute by double-clicking

Running a program with the quarantine attribute by double-clicking

If we run the program from the context menu (right-click → Open), we see the following.

Running a program with the quarantine attribute from the context menu

Running a program with the quarantine attribute from the context menu

Attackers with local access and administrator rights can disable Gatekeeper using the spctl –master disable or --global-disable command.

To detect this activity, you need to monitor execution of the spctl command with parameters –master disable or --global-disable, which disables Gatekeeper. Below is an example of an EDR triggering on a Gatekeeper disable event, as well as an example of a detection rule.

Example of an Kaspersky EDR event

Example of an Kaspersky EDR event

Sigma:

title: Gatekeeper disable
description: This rule detects disabling of Gatekeeper 
tags:
    - attack.defense-evasion
    - attack.t1562.001
logsource:
    category: process_creation
    product: macos
detection:
    selection:
	cmdline: spctl 
	cmdline: 
		- '--master-disable'
		- '--global-disable'
    condition: selection

Takeaways

The built-in macOS protection mechanisms are highly resilient and provide excellent security. That said, as with any mature operating system, attackers continue to adapt and search for ways to bypass even the most reliable protective barriers. In some cases when standard mechanisms are bypassed, it may be difficult to implement additional security measures and stop the attack. Therefore, for total protection against cyberthreats, use advanced solutions from third-party vendors. Our Kaspersky EDR Expert and Kaspersky Endpoint Security detect and block all the threats described in this post. In addition, to guard against bypassing of standard security measures, use the Sigma rules we have provided.

❌