Gemini can now help students prepare for the SAT using realistic mock tests, moving beyond generic AI questions and closer to the format and pressure of an actual standardized exam.
NASA Data Helps Maine Oyster Farmers Choose Where to Grow
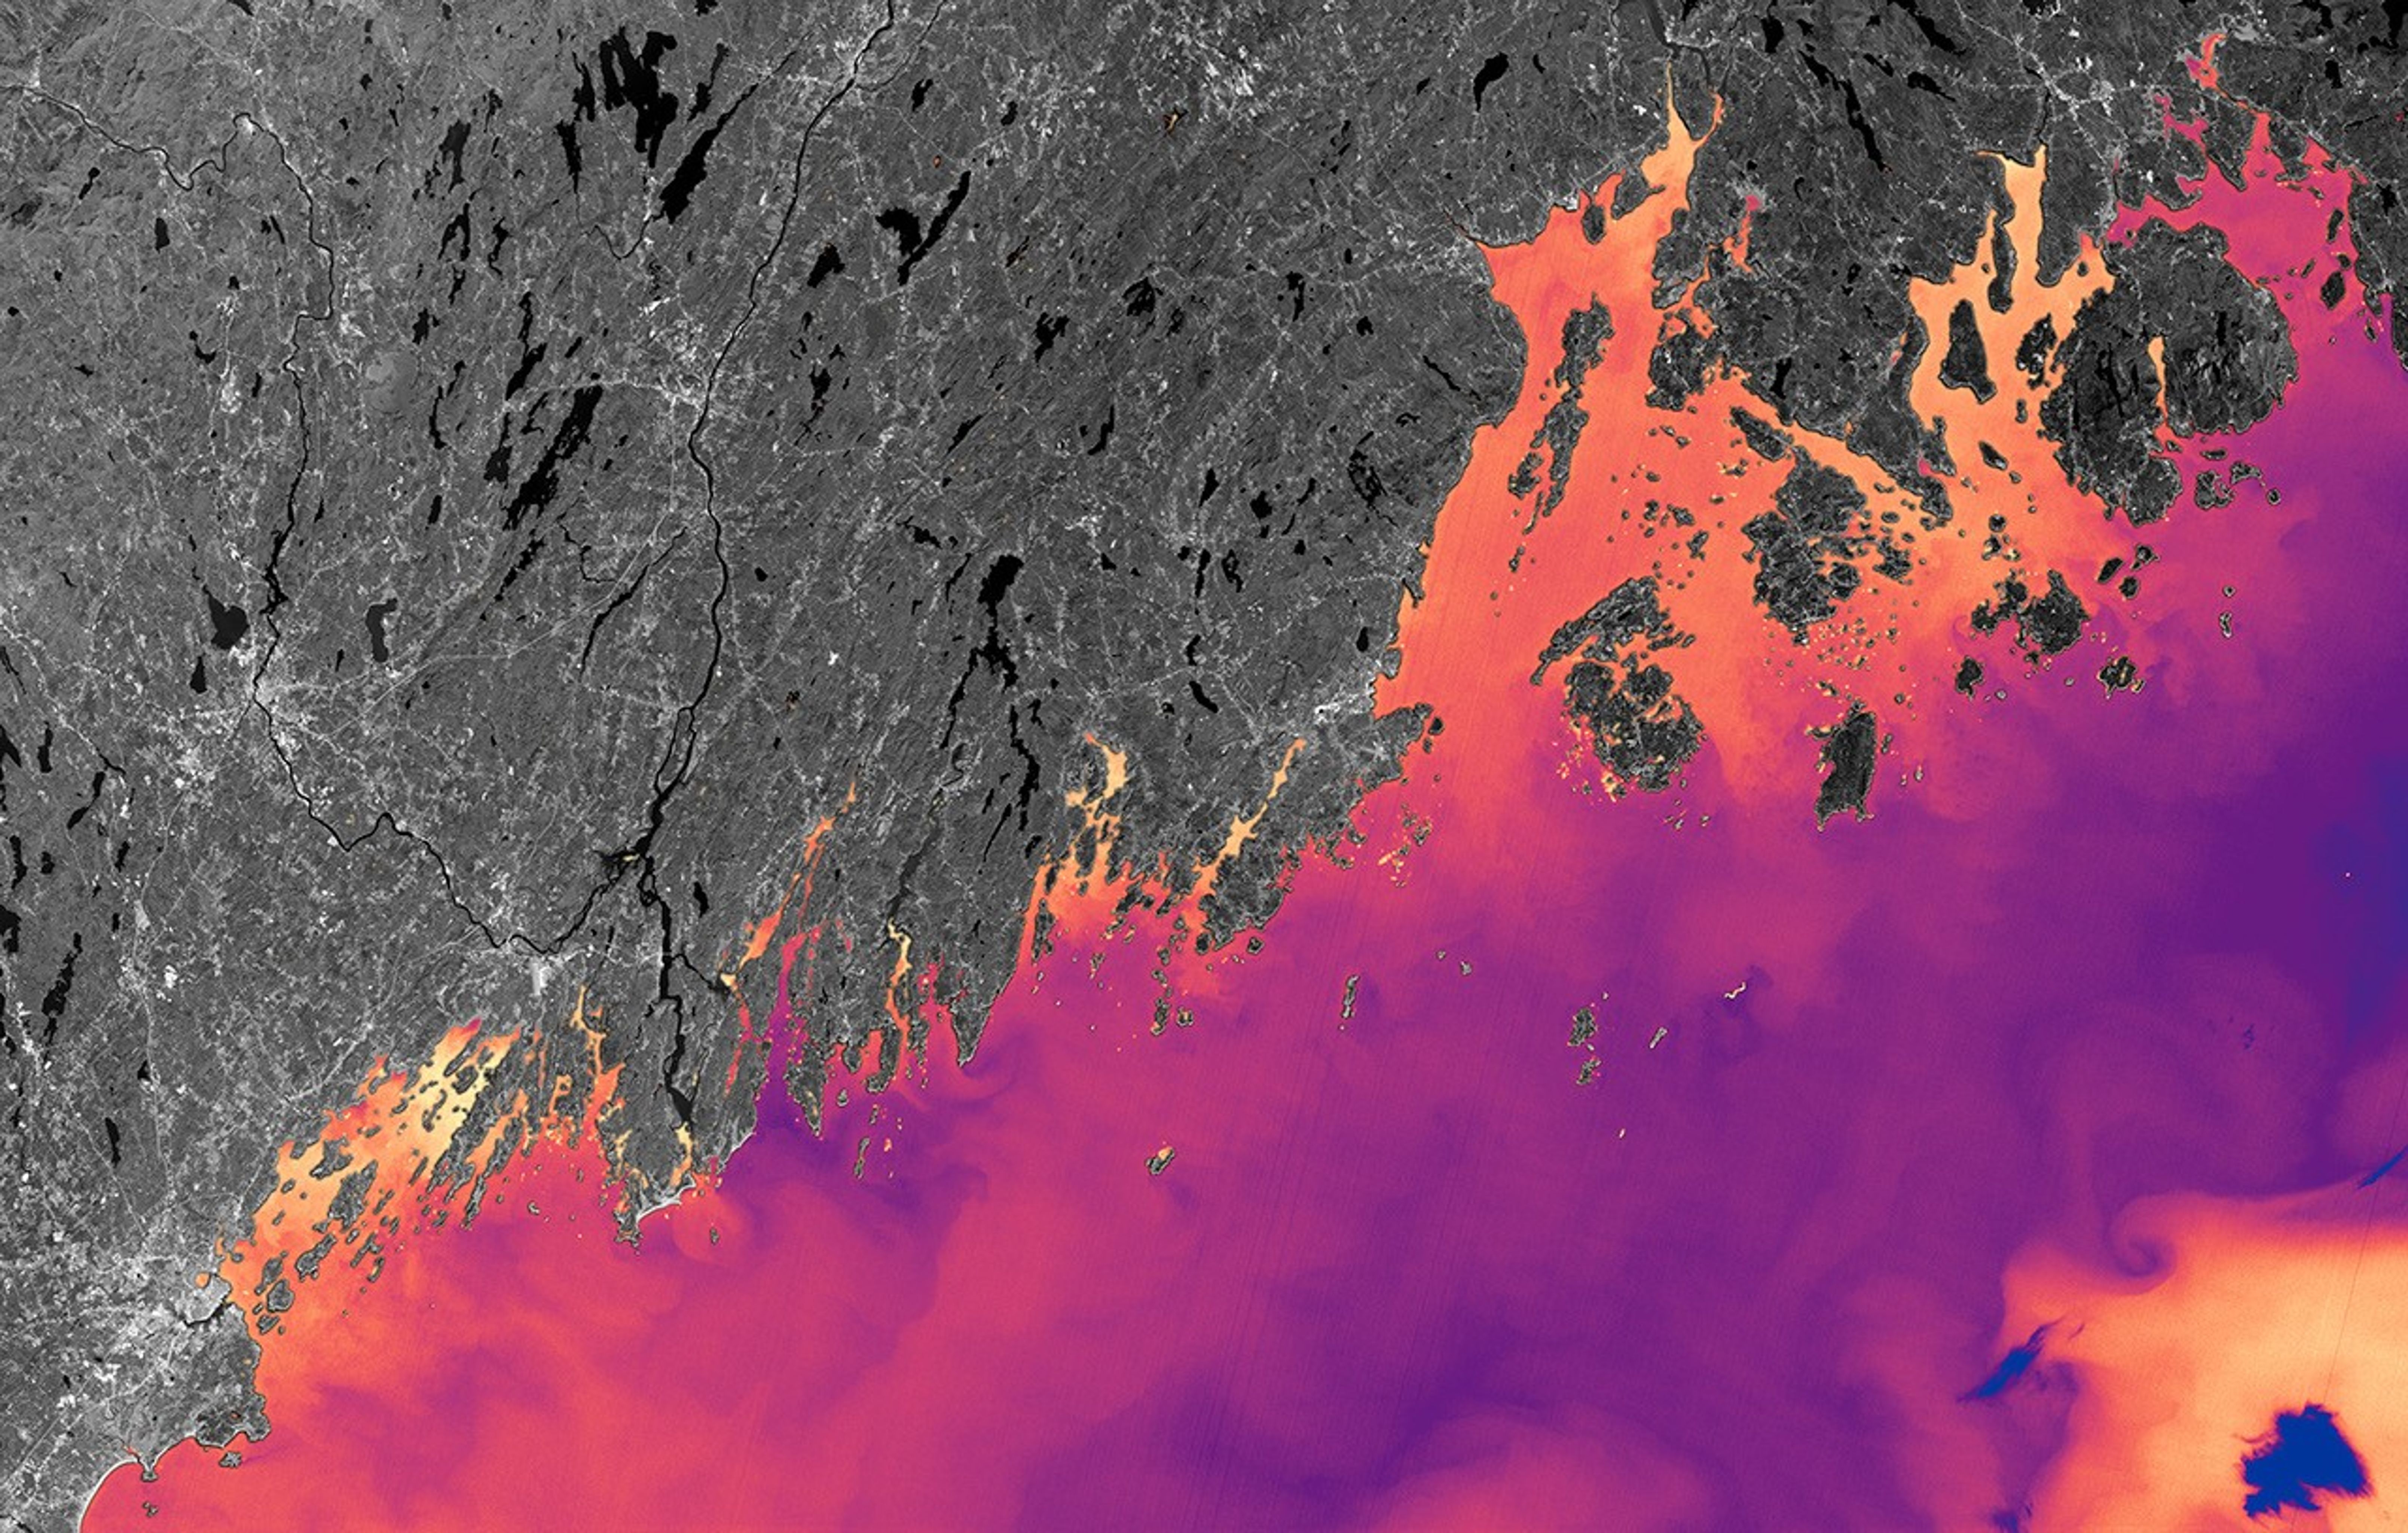
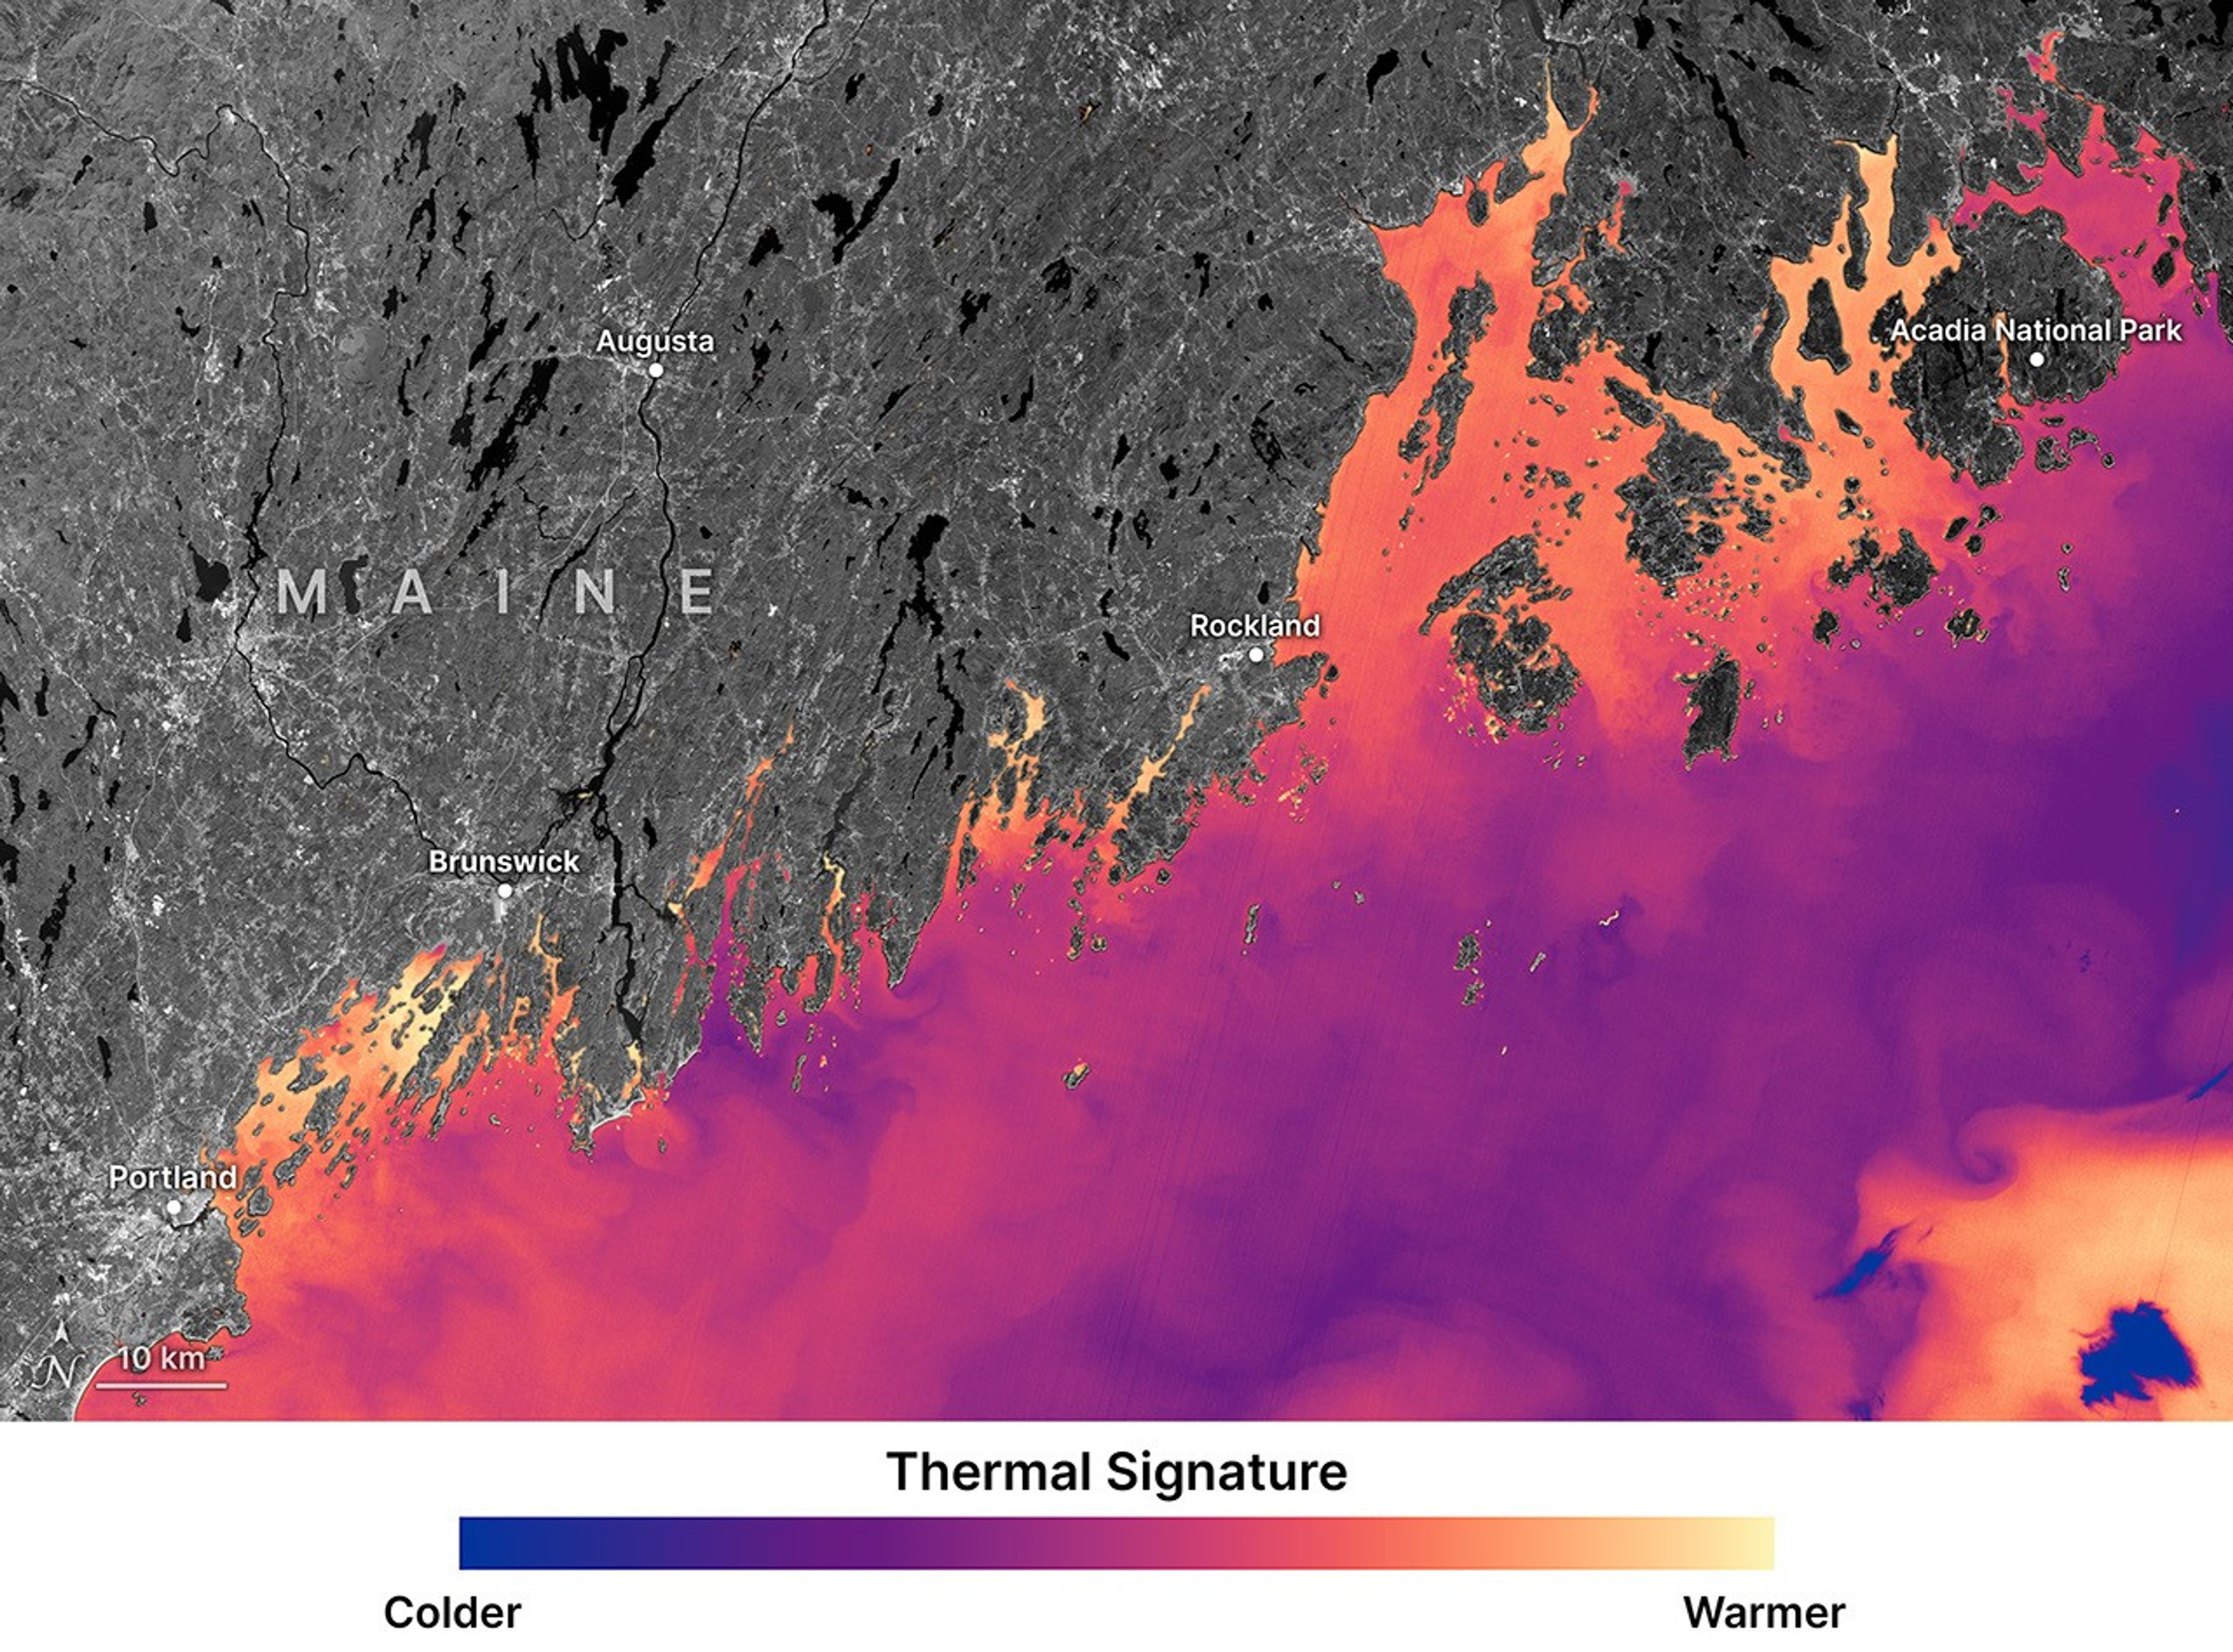
The Landsat satellites are helping oyster farmers in Maine see which coves run warmer or cooler from space.
Credits: NASA/Ross Walter and Allison Nussbaum
When oyster farmer Luke Saindon went looking for a place to grow shellfish in Maine, he knew that picking the wrong patch of water could sink the farm before it began. So Saindon did something oyster farmers couldn’t have done a generation ago: He used NASA satellite data to view the coastline from space.
“Starting a farm is a big venture,” said Saindon, the director for The World Is Your Oyster farm in Wiscasset, Maine. “If you choose the wrong spot, you can blow through a lot of money without ever bringing oysters to market.”
NASA satellites had been passing over these waters for years, recording temperatures and other conditions. Using a site-selection tool created by University of Maine researchers, Saindon examined satellite maps showing where water temperatures and food levels might be best for growing oysters. The maps pointed him toward a wide, shallow bay near his home. Four years later, the farm is still there — and the oysters are thriving.
Luke Saindon, director of The World Is Your Oyster farm in Wiscasset, Maine, checks oyster cages on the farm’s floating platform.
Saindon believes that using the satellite data to select his oyster farm site resulted in faster-than-average growth rates.
“This is an example of how NASA’s Earth science program supports our nation,” said Chris Neigh, the Landsat 8 and 9 project scientist at NASA’s Goddard Space Flight Center in Greenbelt, Maryland. “We collect global data, but its value grows when it’s used locally to help communities work smarter and make their livelihoods more sustainable.”
From orbit to oyster
That same satellite-based approach is now the foundation of a study published Jan. 15 in the journal Aquaculture. Led by University of Maine scientists Thomas Kiffney and Damian Brady, the research demonstrates how temperature data from Landsat — the joint NASA and U.S. Geological Survey mission — combined with European Sentinel-2 satellite estimates of oyster food availability, namely plankton, can predict how quickly eastern oysters (Crassostrea virginica) reach market size.
The team built a satellite data–driven model of how oysters divide their energy among growth, survival, and reproduction. Feed the model sea surface temperature and satellite estimates of chlorophyll and particulate organic matter — signals of how much plankton and other edible particles are in the water — and it predicts how fast oysters will grow, a big step beyond just spotting good or bad sites for farms.
“By showing where oysters grow faster, the model can help farmers plan ahead,” Kiffney said. “That could mean better decisions about when to seed, when to harvest, and how much product to expect, all of which reduces financial risk.”
That kind of insight is increasingly valuable in Maine, where oyster farming has grown rapidly over the last decade. From 2011 to 2021, the industry’s value increased 78%, rising from about $2.5 million to more than $10 million. As the sector scales up, understanding the finer details of Maine’s coastal waters has become essential — and that’s where NASA satellites come in.
The stakes are considerable. “It takes two to three years of scoping in order to get your permit to grow, and then it can take two years for those oysters to reach market,” Brady said. “So if you’ve chosen the wrong site, you’re four years in the hole right off the bat.”
Sharper eyes on coast
Maine’s coastline measures about 3,400 miles (5,500 kilometers) if you follow the tide line. It is a coast of drowned valleys and glacier-scoured granite. Water depth, temperature, and circulation can shift dramatically within a few miles. This complexity makes oyster site selection notoriously difficult, and some satellites that see the coast in broad strokes miss the small, patchy places where oysters live.
“What makes Landsat so powerful for aquaculture is its ability to see finer-scale patterns along the coast,” where farmers put oyster cages in the water, Neigh said.
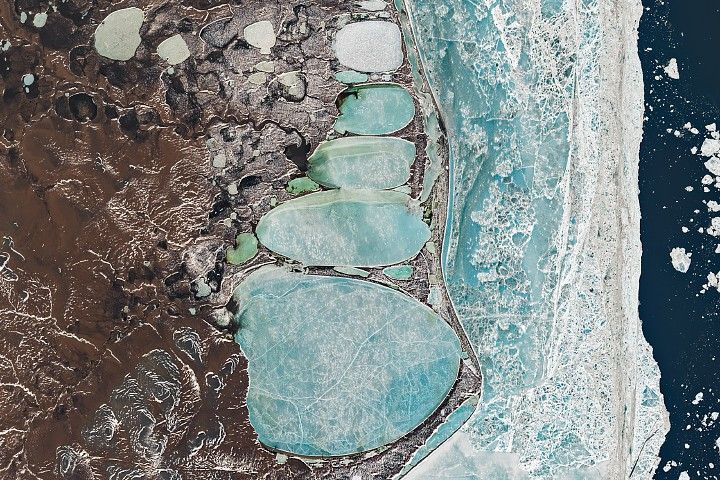
This false-color image from Landsat 9’s Thermal Infrared Sensor, acquired Oct. 11, 2025, shows the thermal signature of waters off the coast of Maine — revealing finer-scale temperature differences between neighboring coves. Cooler waters appear purple and blue, while warmer water shows up in orange and yellow.
NASA/Ross Walter and Allison Nussbaum
Landsat 8 and 9’s pixels — 98 to 328 feet (30 to 100 meters) across — are able to distinguish more subtle temperature differences between neighboring coves. For a cold-blooded oyster, those distinctions can translate into months of growth. Warm water accelerates feeding and shell development. Cold water slows both.
A challenge for satellites is clouds. Maine’s sky is frequently overcast, and together Landsat 8 and 9 pass over any given point only every eight days. To work around this, the research team analyzed 10 years of Landsat data (2013–2023) and built seasonal “climatologies,” or average temperature patterns for every 98-foot (30-meter) pixel along the coast. Sentinel-2 imagery added estimates of chlorophyll and particulate organic matter, the drifting microscopic food that oysters pull from the water column with rhythmic contractions of their gills.
Field tests at multiple sites showed the technique’s accuracy. “We validated the model against seven years of field data,” Brady said. “It’s a strong indication that these remotely sensed products can inform not just where to grow, but how long it will take to harvest.”
Turning satellite science into tools for growers
The University of Maine team is now developing an online tool to put this model into practice. A grower will be able to click on a coastal location and receive an estimate for time-to-market.
The researchers also assist with workshops through Maine’s Aquaculture in Shared Waters program, teaching farmers how to interpret temperature and water clarity data and apply them to their own sites.
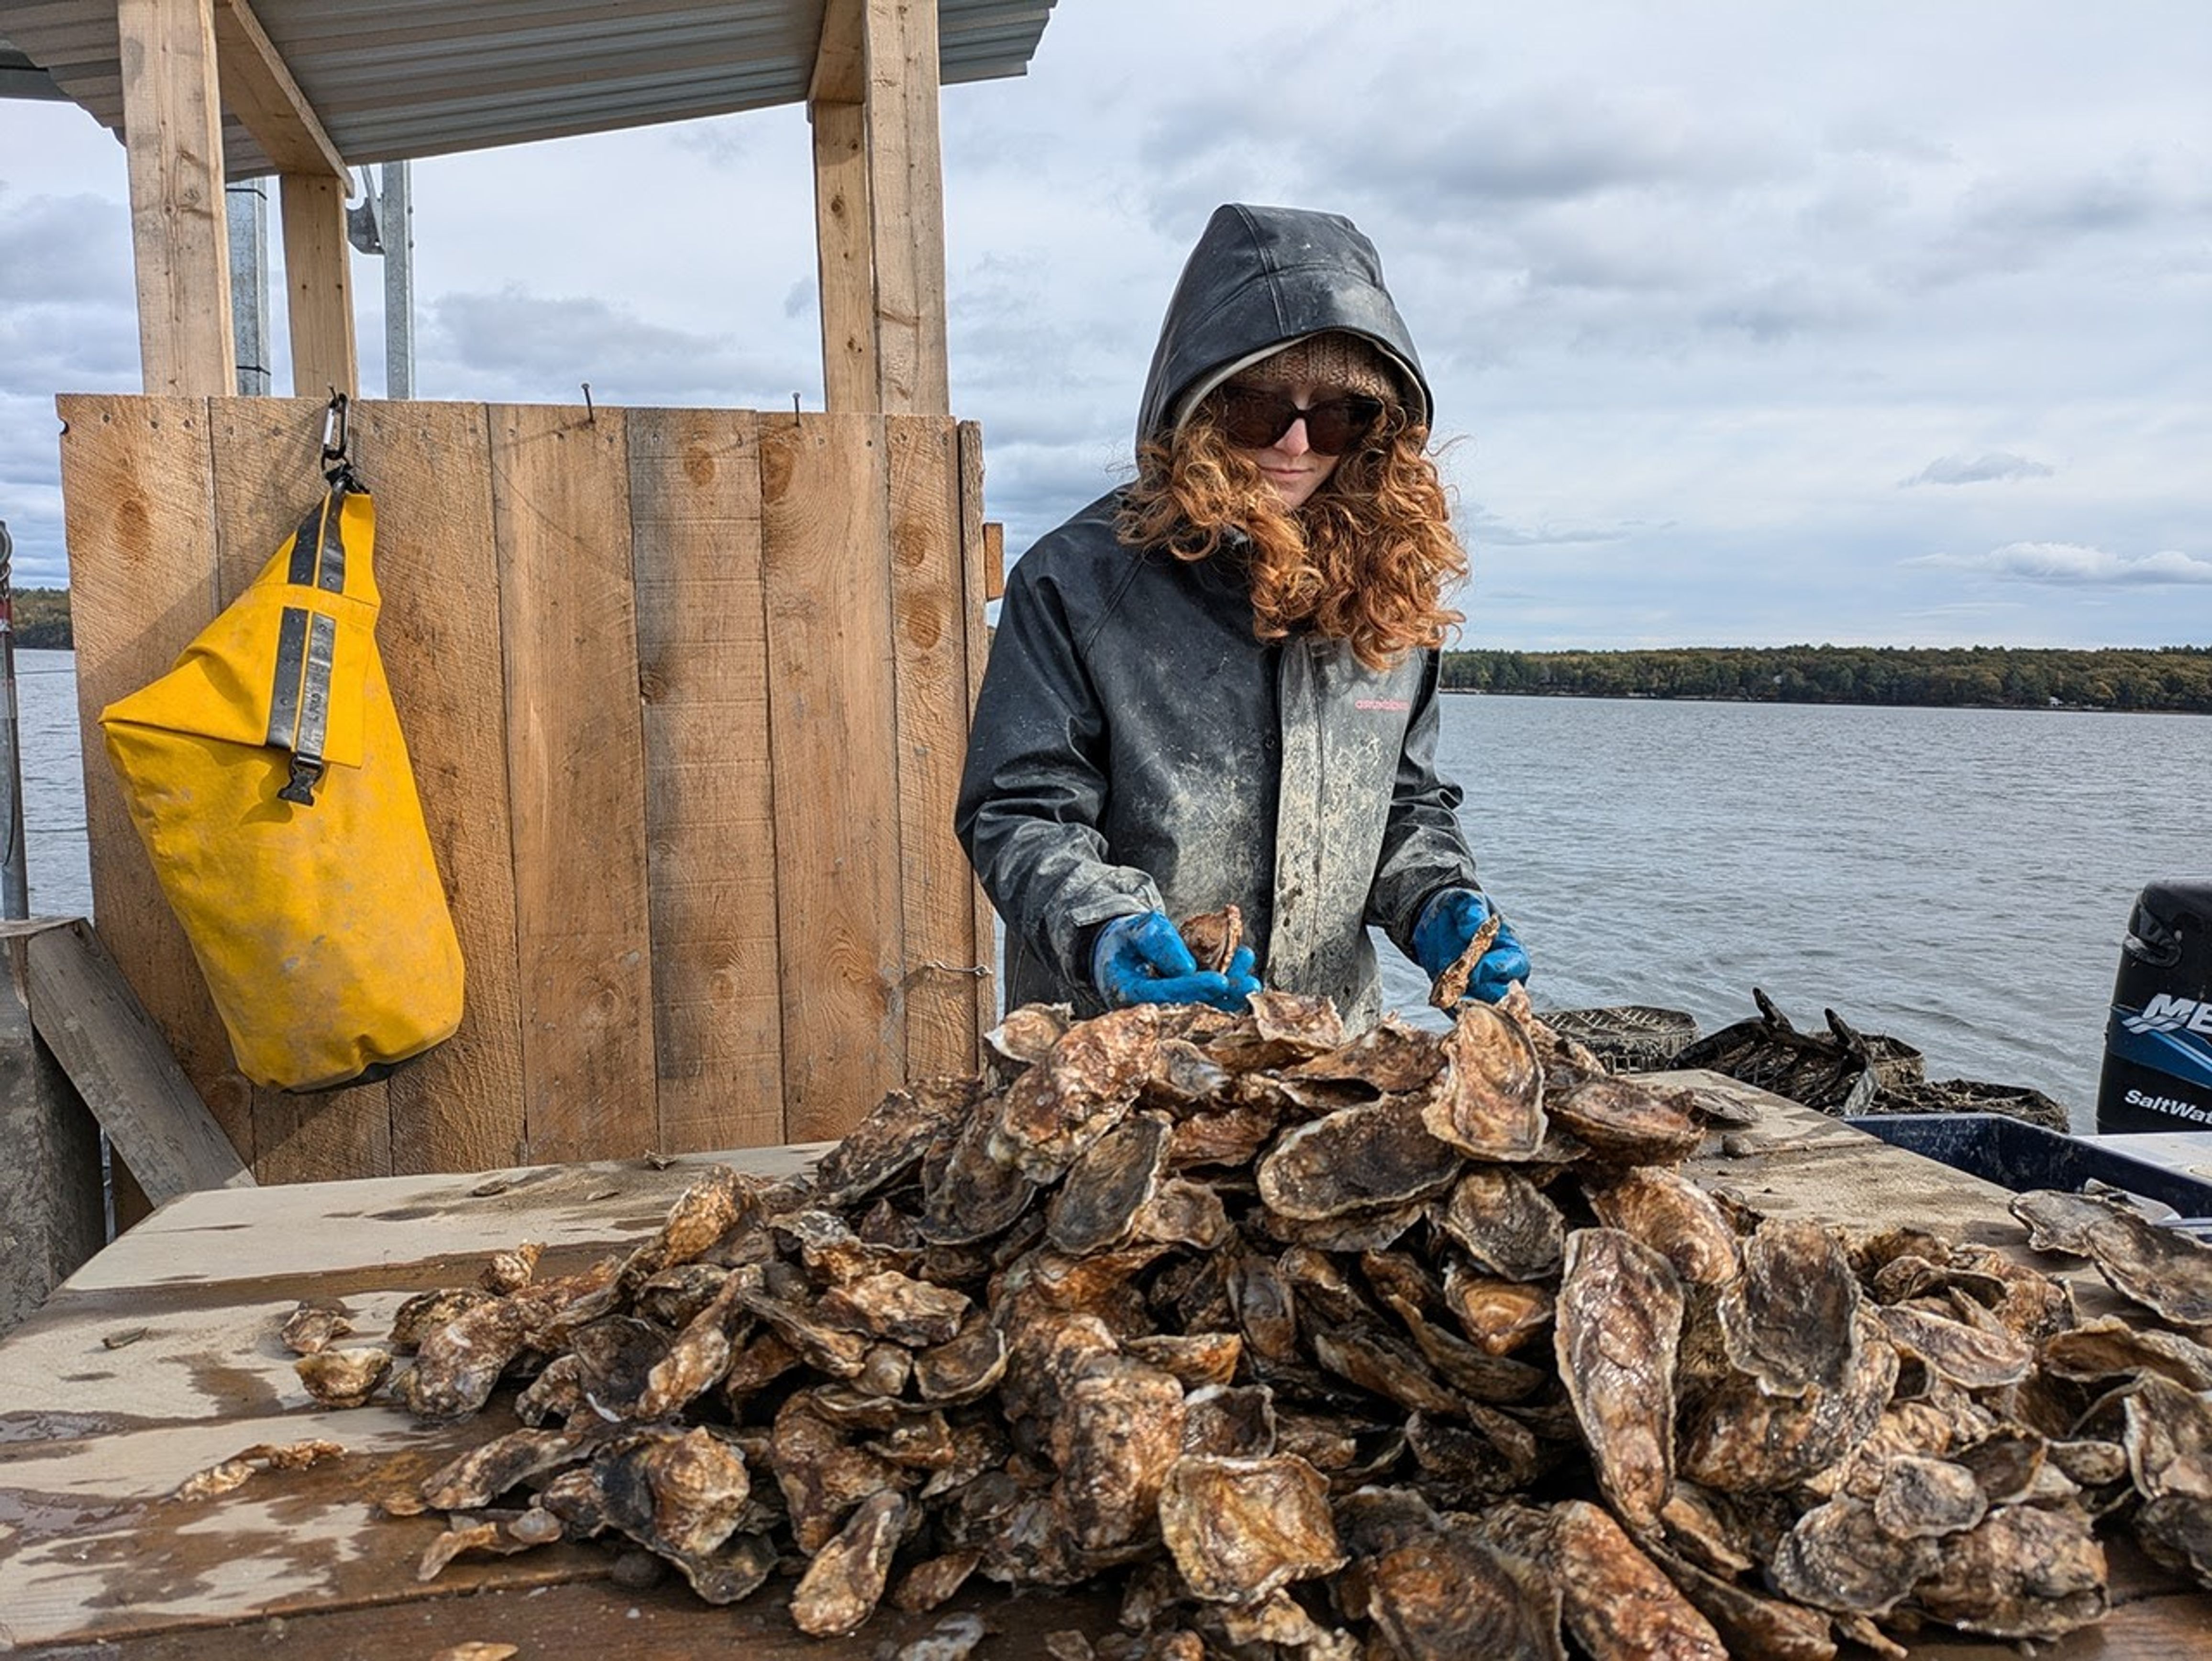
Monique Boutin, an aquaculture technician with The World Is Your Oyster farm, sorts oysters during harvest work on the water in Maine.
For farmers like Saindon, that translates into something simpler: confidence and efficiency. “Having these kinds of tools lowers the barrier for new people to get into aquaculture,” he said. “It gives you peace of mind that you’re not just guessing.”
The Maine project is helping pave the way for other NASA missions. The PACE satellite (Plankton, Aerosol, Cloud, ocean Ecosystem) launched in 2024 and is now delivering hyperspectral observations of coastal waters. Where earlier sensors could estimate how much plankton was present, PACE can begin to identify the different plankton species themselves. For oysters, mussels, and other filter feeders, that specificity matters. Not all plankton are equal food: Different kinds offer different nutrition, and some plankton are harmful to oysters.
A next step will be turning that richer picture of coastal life into forecasts people working on the water can use, helping farmers trade some of the coast’s mystery for evidence they can apply to their harvest.
By Emily DeMarco
NASA’s Goddard Space Flight Center, Greenbelt, Md.
The U.S. Geological Survey, in cooperation with NASA, has named the new Landsat Science Team that will support the world’s longest-running Earth observation mission for a planned 2026-2030 term.
The team brings together experts from universities, private industry, and federal and international agencies to help the U.S. Geological Survey (USGS) and NASA ensure Landsat continues delivering trusted, publicly available data that supports disaster response, agricultural management, water resources, land stewardship, and national security.
Science Focus Areas of the New Landsat Science Team (2026–2030)
The Landsat Science Team supports the USGS and NASA in maintaining scientific integrity, data quality, and mission continuity across the Landsat program. Their work informs mission planning and development and helps maximize the value of the Landsat archive through improved data products, expanded applications and strategic insight that helps the Landsat program continue to serve the public effectively.
The Landsat Science Team will provide collective analysis and advice on a range of priority issues as defined by the USGS and NASA. In addition, each team member will lead research on a variety of topical areas deemed to be of interest to the Landsat program.
Research areas include atmospheric correction and calibration methods to ensure consistent reflectance across the Landsat archive. Team members will also look at improving data processing pipelines and interoperability with international satellite systems to support integrated Earth observations. Several studies are focused on land-surface processes, including crop condition, evapotranspiration, soil and residue detection, and non-photosynthetic vegetation, which support agricultural monitoring and conservation.
Water cycle and aquatic focused research includes inland and coastal water-quality mapping, harmful algal bloom detection, and refined snow cover characterization. Additional studies address fire monitoring, volcanic activity, and geothermal systems. Other work is centered on developing tools that help translate Landsat data into actionable products for science, management, and policy.
The Landsat Science Team members and their planned research:
Atmospheric Correction and Calibration
Pathfinding the steps to ensure global analysis ready consistent reflectance from the Landsat MSS to Landsat Next era
Dr. David Roy (PI), Michigan State University
Dr. Hankui K. Zhang, South Dakota State University
Dr. Lin Yan, Michigan State University
Fully probabilistic atmospheric correction for Landsat
Dr. Nimrod Carmon (PI), University of California, Los Angeles
Dr. Gregory Okin, University of California, Los Angeles
Maintenance and Refinement of the Land Surface Reflectance Code (LaSRC) for Landsat and Sentinel 2
Dr. Eric Vermote (PI), NASA Goddard Space Flight Center
Towards a harmonized atmospheric correction for EnMAP, CHIME, Landsat archive, and Landsat Next observables
Dr. Raquel De Los Reyes (PI), The German Aerospace Center (DLR)
Interoperability and Data Processing
Synergistic data processing pipelines for Landsat and European satellite missions
Dr. David Frantz (PI), Trier University
Dr. Patrick Hostert, Humboldt University of Berlin
Dr. Sebastian van der Linden, University of Greifswald
Dr. Dirk Pflugmacher, Humboldt University of Berlin
Dr. Cornelius Senf, Technical University of Munich
Stronger together – next generation interoperability for Landsat and Copernicus
Dr. Peter Strobl (PI), European Commission
Maximizing the impact of interoperable Landsat Analysis-Ready Surface Reflectance for Operational Land, Water and Antarctic Monitoring
Medhavy Thankappan (PI), Geoscience Australia
Dr. Kimberlee Baldry, Geoscience Australia
Dr. Courtney Bright, Commonwealth Scientific and Industrial Research Organisation (CSIRO)
Agriculture, Vegetation, and Land Surface Processes
Developing non-photosynthetic vegetation cover capabilities for Landsat Next
Dr. Phillip Dennison (Co-PI), University of Utah
Dr Michael Campbell (Co-PI), University of Utah
Improving and synergizing Landsat evapotranspiration and albedo using multi-satellite observations
Dr. Yun Yang (PI), Cornell University
Dr. Zhuosen Wang, University of Maryland
OpenET: Supporting US sustainable water management with Landsat
Dr. Forrest Melton (PI), NASA Earth Science Division
From leaf to Landsat: A multi-scale approach to developing information for agricultural management from Landsat Next
Dr. Kyle Kipper (PI), USDA Agriculture Research Service
Dr. Martha Anderson, USDA Agriculture Research Service
Measuring Agricultural Conservation Land Cover with Next Generation Earth Observation: Detecting Green Vegetation, Crop Residue, and Soil in the Context of Surface Moisture Variability
Dr. Dean Hively (PI), USGS Lower Mississippi Water Science Center
Tracking Crop Growth and Condition in Near Real-time Using Harmonized Landsat and Sentinel-2 Data
Dr. Feng Gao (PI), USDA Agriculture Research Service
Water, Snow, and Aquatic Systems
Harmonizing inland and coastal water quality monitoring from the Landsat Program: Harmful algal blooms
Dr. Ryan O’Shea (PI), Science Systems and Applications, Inc
Next generation snow cover mapping and establishment of a long-term ground validation site
Dr. Edward Bair (PI), Leidos, Inc.
Fire and Disturbance
Advancing fire monitoring with Landsat Next and Canada’s WildFireSat
Dr. Morgan Crowley (PI), Canadian Forest Service
Volcanoes and Geothermal Systems
Characterizing/monitoring active volcanoes and geothermal systems with Landsat
Dr. Greg Vaughan (PI), USGS Astrogeology Science Center
Science Applications and User Engagement
From pixels to products to policy: Creating and sharing information to advance science and applications with Landsat
The Landsat Calibration and Validation (Cal/Val) group helps uphold Landsat’s reputation as the gold standard of satellite imagery. They ensure that the Operational Land Imager (OLI) and the Thermal Infrared Sensor (TIRS) aboard Landsats 8 and 9 provide high-quality scientific measurements to users around the world. In 2025, the Cal/Val group contributed over 60 pages to the second edition of “Comprehensive Remote Sensing” (Kaita et. al, 2026), organizing content from NASA, USGS, academia, and industry scientists. Cal/Val support staff authored multiple sections, including a summary of results from Landsat 9 and of the evolution of spectral, spatial, and radiometric characteristics throughout the Landsat missions.
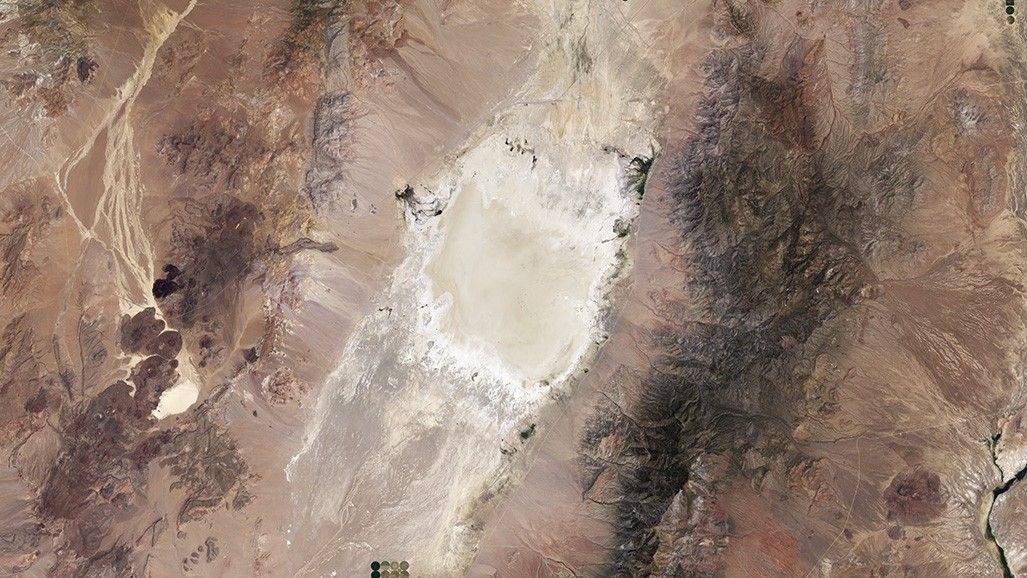
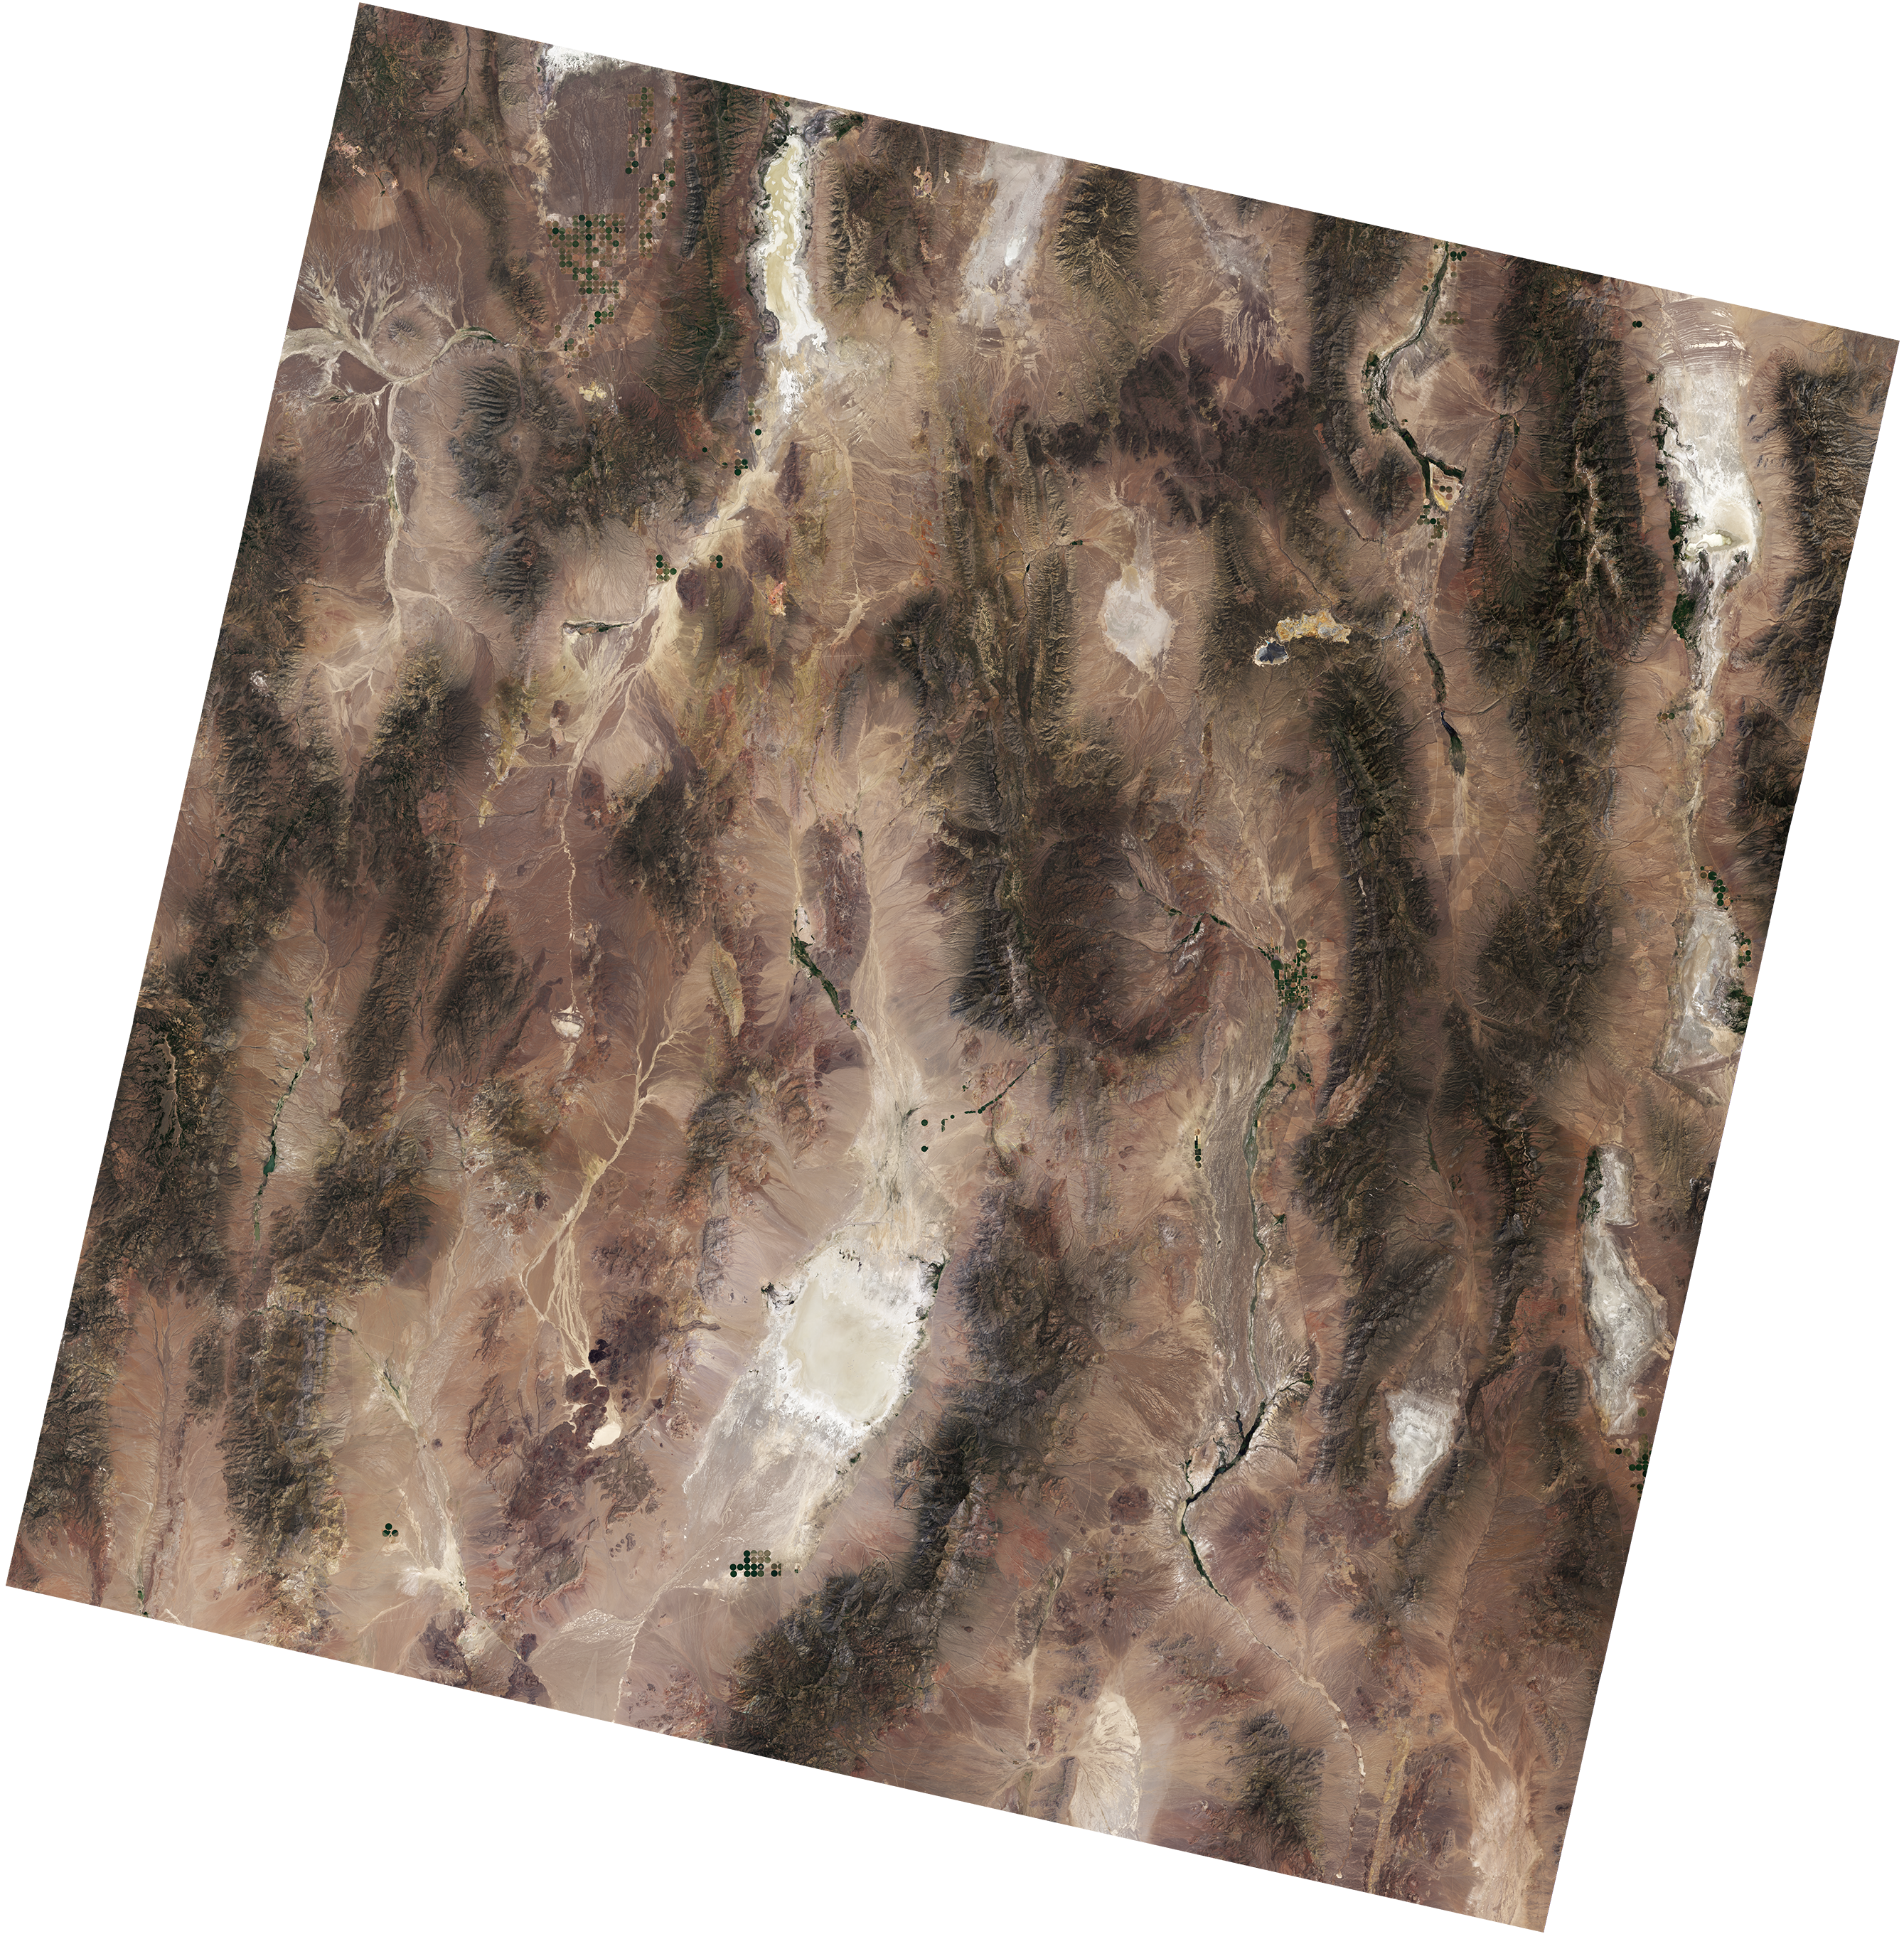
A natural-color Landsat 9 image of Railroad Valley Playa in Nevada, acquired on June 29, 2024. A portion of the playa is used as a radiometric calibration and validation site for various satellite sensors including Landsat 8 and 9’s OLI instruments.
NASA/USGS
The Cal/Val team at NASA Goddard Space Flight Center works closely with the Landsat Flight Operations Team to plan weekly calibration activities to maintain the radiometric accuracy of Landsat products. In October 2025, a Landsat 9 anomaly occurred related to its solar array drive assembly (SADA) potentiometer. The spacecraft and instruments were placed in a safehold, pausing data collections. The Cal/Val team assessed the instruments after they recovered from this anomaly, including monitoring the instrument telemetry, detector gains, and noise performance. The team identified a mis-loaded detector map and updated the calibration of both the reflective and thermal emissive bands to ensure consistent, accurate data. After six days in the safehold, the instrument resumed normal operations.
The NASA Cal/Val team supports their USGS counterparts with quarterly updates to the Calibration Parameter File (CPF) by providing inputs for relative and absolute gains as needed. This work involves collaborating with USGS scientists to ensure the consistency of the Combined Radiometric Model (CRaM). The CRaM approach integrates radiometric responses from on-board calibrators to enhance long-term calibration stability throughout mission lifetimes. The CRaM algorithm also provides an extensible framework for future satellite missions. A peer-reviewed publication detailing the CRaM’s approach and future applications was submitted to Science of Remote Sensing.
On January 14-16, 2025, the Landsat Cal/Val team organized and hosted the first semiannual Technical Information Meeting (TIM) at NASA Goddard Space Flight Center. NASA and USGS scientists welcomed collaborating scientists from South Dakota State University (SDSU), the University of Arizona Tucson, and Rochester Institute of Technology for presentations and discussions on Landsat imaging performance, algorithms, and instrument health. On May 28-29, 2025, the Cal/Val team attended the second semiannual TIM at SDSU.
The Landsat Cal/Val Team is validating the accuracy of the Harmonized Landsat and Sentinel-2 (HLS) v2.0 product, which combines data from multiple satellites to create a continuous record of Earth’s surface reflectance measurements since 2013. The team is testing the dataset using RadCalNet, a global network of automated ground stations that provide precise, standardized measurements. The team compared measurements from four RadCalNet sites, including the well-established Railroad Valley Playa site in Nevada, against near-simultaneous HLS data. Their analysis shows the satellite and ground measurements agree within expected uncertainty ranges—a strong validation of the HLS product’s accuracy.
The team presented these findings at the CEOS IVOS calibration meeting in Tucson, Arizona (September 1-5, 2025) and is currently preparing a peer-reviewed article to share the complete results.
Path Forward
The Cal/Val team applies lessons learned from Landsat missions to better plan calibration efforts for the next generation of instruments. Using instrument performance checklists from Landsat 8/9, the team is building a framework of in-house geometric and radiometric testing and extending algorithms for future Landsat instruments.
The Landsat Cal/Val Team is actively tackling a critical challenge in solar irradiance modeling. While new hyperspectral sensor technologies have made it possible to create highly accurate solar models with much lower uncertainty, the remote sensing community still lacks agreed-upon methods for applying these advanced models. A dedicated subgroup within the Landsat Cal/Val Team is now developing and testing standardized approaches to bridge this gap. Their goal is to create clear recommendations and best practices that the scientific community can refine together and implement consistently.
This work addresses a fundamental need—transforming promising hyperspectral solar modeling capabilities into practical, standardized tools that researchers can confidently use across different projects and applications.
Harmonized Landsat and Sentinel-2 PI Christopher Neigh shares milestones and a vision for the future
In 2025, the Harmonized Landsat and Sentinel-2 (HLS) program established itself as a cornerstone for global medium-resolution optical Earth observation and became one of NASA’s most downloaded products. The seamless, analysis-ready dataset is free for anyone to use and download on NASA Earthdata: HLSL30v2.0 and HLSS30v2.0. HLS version 2.0 (Ju et al., 2025), released in July, represents a major advancement in algorithm sophistication and dataset completeness. The improved surface reflectance dataset now extends globally back to 2013 (excluding Antarctica) and integrates observations from Landsat 8/9 and Sentinel-2A/B/C satellites, achieving an unprecedented median revisit interval of less than 1.6 days. This high frequency of observations transforms our ability to monitor Earth’s changing surface.
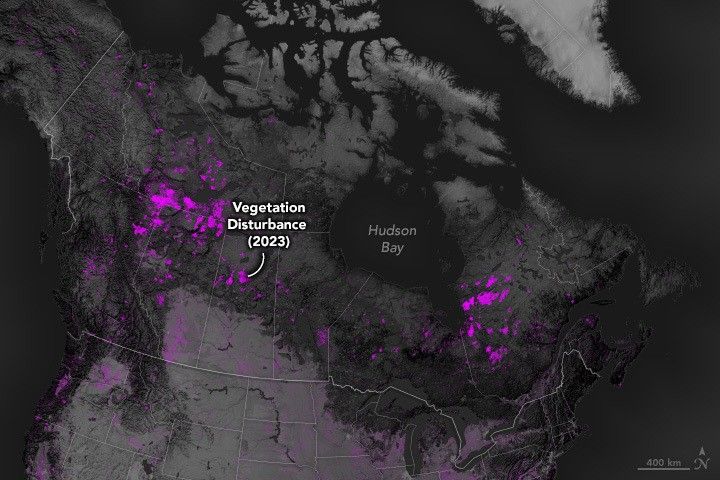
Patches of purple across Canada show where vegetation disturbances were detected in 2023.
NASA’s Earth Observatory/Wanmei Liang
June saw the first in-person HLS meeting between NASA headquarters, the Satellite Needs Working Group (SNWG), and representatives from NASA’s Goddard Space Flight Center and Marshall Space Flight Center, representing enhanced coordination and strategic alignment. The HLS project also serves as a critical steppingstone for advancing collaboration between NASA and the European Space Agency (ESA).
HLS’s frequent revisit is one of its key values to data users. Zhou et al. (2025) evaluated the cloud-free coverage of HLS V2.0 in 2022 and found that HLS data provided observations every 1.6 days at the global scale and 2.2 days in data-scarce tropical regions. This temporal resolution addresses one of the most persistent challenges in optical remote sensing: obtaining cloud-free observations for time-sensitive applications.
HLS Impacts
Already, scientists are putting HLS to use for practical and scientific applications. Zhou et al. (2025) evaluated the global consistency, reliability, and uncertainty of the newly-released suite of nine HLS vegetation indices. This assessment provides the scientific community with confidence in using HLS-derived vegetation indices for agriculture, forestry, ecosystem monitoring, and more.
Pickens et al. (2025) unveiled a global land change monitoring system, DIST-ALERT, based on HLS data. DIST-ALERT highlights HLS’s transformative impact on environmental monitoring, identifying new land change dynamics that are impossible to track with Landsat or Sentinel observations alone.
Vision for the Future
The HLS program continues to evolve to deliver high-quality, reliable data to its expanding user base. Shi et al. (2026, under review in Remote Sensing of Environment) developed Fmask version 5.0, employing a hybrid approach combining physical rules, machine learning, and deep learning for cloud masking. When released, this next-generation cloud detection algorithm will improve the accuracy and consistency of cloud/cloud-shadow screening—a critical component for maximizing usable observations in the HLS time series.
Looking forward, the HLS vision encompasses:
Enhanced Algorithms: Integrating Fmask v5.0 and refining harmonization algorithms to further reduce inter-sensor differences and improve accuracy across diverse conditions.
Meeting User Needs: Strengthening partnerships with operational agencies and downstream users to ensure HLS products effectively support applications including agriculture, water resources, disaster response, and climate adaptation.
Continuity and Sustainability: Planning for long-term data continuity as Landsat Next and future Sentinel missions come online, ensuring seamless transition and multi-decadal consistency.
Community Engagement: Expanding training, documentation, and outreach to maximize HLS adoption across the global user community, particularly in regions where frequent, free, analysis-ready data can transform environmental monitoring capabilities.
The HLS program exemplifies successful international collaboration in Earth observation, delivering on the promise of harmonized, frequent, global-scale monitoring. As we build on the foundation of HLS v2.0, the program is positioned to enable breakthrough science and operational applications that were previously impossible with individual satellite missions alone.