On January 22, 2026, CoinMarketCap’s most-viewed asset data reveals a market driven more by attention and reassessment than by short-term price strength.
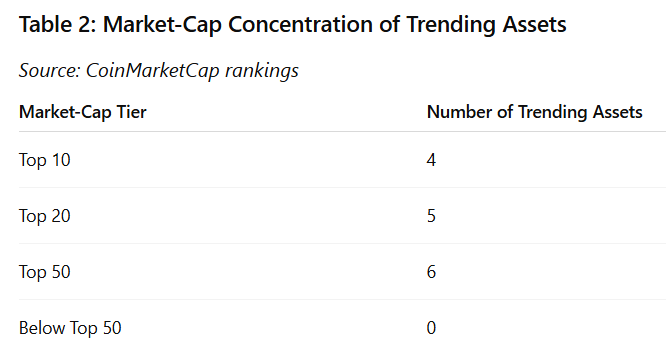
Using CoinMarketCap’s official definition of “most viewed” assets over the last seven days, and filtering strictly to cryptocurrencies ranked within the top 50 by market capitalization, six assets stand out as the most consistently watched by users:
Bitcoin (BTC)
Ethereum (ETH)
XRP (XRP)
Solana (SOL)
Monero (XMR)
Pi Network (PI)
CoinMarketCap’s “most viewed” metric does not indicate bullish momentum or price leadership. It reflects user attention, meaning which assets investors, traders, and researchers are actively monitoring.
This distinction is critical. Trending, in this context, means high informational demand, not performance. All six assets posted negative seven-day price performance, according to CoinMarketCap price data, while showing mixed or modest positive movement over the last 24 hours. This pattern strongly suggests that users are watching volatility, drawdowns, and narrative shifts rather than chasing gains.
Source for all ranking, pricing, and view-based metrics: CoinMarketCap official asset pages and trending lists https://coinmarketcap.com
Why Attention Is Concentrated in Large-Cap Cryptocurrencies
One of the most telling aspects of this week’s CoinMarketCap trending data is what it excludes.
There are no micro-caps. There are no newly launched tokens. There are no thin-liquidity speculative plays.
Every trending asset sits comfortably inside the top 50 by market capitalization, based on CoinMarketCap’s rankings.
This concentration reflects a broader behavioral shift that typically appears during periods of market stress or uncertainty. When volatility increases and correlations tighten, investors prioritize assets that offer:
Deep liquidity
Long operating histories
Broad exchange support
Established narratives
Large-cap cryptocurrencies function as information anchors during uncertain periods. Market participants track them to understand sentiment, liquidity conditions, and systemic risk.
CoinMarketCap’s view data confirms that users are not seeking novelty. They are seeking clarity.
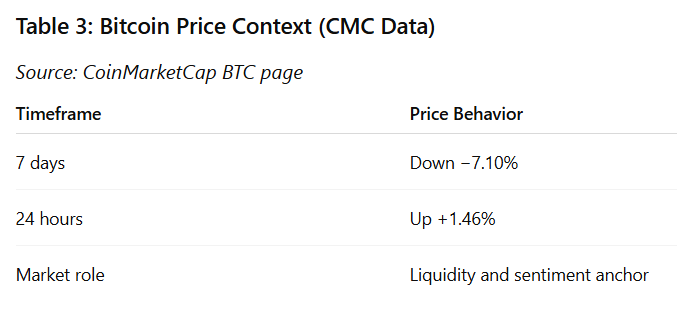
Bitcoin (BTC): The Market’s Primary Signal Asset
CMC Rank: 1
7-Day Price Change: −7.10%
24-Hour Price Change: +1.46%
Trending Signal: Top 10 most viewed assets on CoinMarketCap over the last 7 days
Source: CoinMarketCap BTC page
Bitcoin remains the most viewed asset in crypto markets, regardless of short-term price behavior. Its trending status reflects its role as the primary reference point for the entire digital asset ecosystem.
Over the past seven days, Bitcoin experienced a notable pullback, consistent with broader risk-off conditions across global markets. Despite this decline, the modest positive movement over the last 24 hours suggests stabilization rather than renewed momentum.
CoinMarketCap view data indicates that users are closely monitoring Bitcoin not because it is breaking out, but because it anchors:
Market-wide liquidity expectations
Correlation behavior with equities and commodities
Institutional positioning signals
During corrective phases, Bitcoin attracts heightened attention as participants assess whether price action represents temporary volatility or a deeper structural shift. The data suggests monitoring behavior, not speculative chasing.
Ethereum (ETH): Reassessment of Structure and Positioning
CMC Rank: 2
7-Day Price Change: −11.14%
24-Hour Price Change: +2.04%
Trending Signal: Top 10 most viewed assets on CoinMarketCap over the last 7 days
Source: CoinMarketCap ETH page
Ethereum’s sharper seven-day decline relative to Bitcoin helps explain its elevated view count. Larger drawdowns in major assets often trigger deeper analysis rather than immediate exit behavior.
Ethereum occupies a unique position in the crypto market. It combines elements of:
A settlement network
A smart contract platform
A yield-bearing asset via staking
When price declines accelerate, investors reassess these components together. CoinMarketCap’s trending data reflects this reassessment phase.
The positive 24-hour move suggests short-term stabilization, but the weekly decline keeps Ethereum firmly under scrutiny. View activity signals analysis and evaluation, not renewed bullish conviction.
XRP (XRP): Persistent Attention Without Momentum Leadership
CMC Rank: 5
7-Day Price Change: −8.69%
24-Hour Price Change: +1.96%
Trending Signal: Top 10 most viewed assets on CoinMarketCap over the last 7 days
Source: CoinMarketCap XRP page
XRP’s presence among the most viewed assets highlights how attention can persist independently of momentum.
Despite underperforming on a seven-day basis, XRP continues to attract interest due to its long-standing role in payment-focused blockchain discussions and its position among the largest crypto assets by market cap.
CoinMarketCap view data suggests that XRP is being monitored as part of broader portfolio reassessment rather than active accumulation. During market drawdowns, investors often revisit assets with distinct use-case narratives to evaluate relative resilience.
The data indicates curiosity and monitoring, not leadership.
Solana (SOL): High Beta Drives High Scrutiny
CMC Rank: 7
7-Day Price Change: −10.32%
24-Hour Price Change: +2.17%
Trending Signal: Top 10 most viewed assets on CoinMarketCap over the last 7 days
Source: CoinMarketCap SOL page
Solana’s trending status reflects its reputation as a high-beta large-cap asset. In volatile markets, Solana often experiences larger percentage moves than peers, which naturally increases attention.
The seven-day decline aligns with broader risk-off behavior, while the short-term rebound suggests tactical positioning rather than structural shift.
CoinMarketCap view data implies that traders and investors are closely watching Solana to gauge risk appetite within the crypto ecosystem. High view counts here reflect sensitivity to volatility rather than renewed optimism.
Monero (XMR): Attention Driven by Dislocation
CMC Rank: 12
7-Day Price Change: −30.24%
24-Hour Price Change: +2.12%
Trending Signal: Top 10 most viewed assets on CoinMarketCap over the last 7 days
Source: CoinMarketCap XMR page
Monero stands apart from the rest of the trending list.
Its seven-day drawdown is materially larger than that of any other asset discussed, yet it remains one of the most viewed cryptocurrencies on CoinMarketCap.
This pattern is typical when a major asset experiences a sharp, atypical move. Investors seek context, not momentum. They want to understand whether the move reflects liquidity pressure, regulatory concerns, or temporary dislocation.
The modest 24-hour recovery suggests stabilization, but the magnitude of the weekly decline keeps Monero under scrutiny. CoinMarketCap view data here reflects reassessment, not speculation.
Pi (PI): Edge-of-Top-50 Curiosity
CMC Rank: 48
7-Day Price Change: −9.77%
24-Hour Price Change: +4.67%
Trending Signal: Top 10 most viewed assets on CoinMarketCap over the last 7 days
Source: CoinMarketCap PI page
Pi is the lowest-ranked asset on this list, and that alone explains much of the attention it is receiving.
Assets near ranking thresholds often see elevated views during volatile periods, as investors evaluate whether they will gain or lose relative standing.
The stronger 24-hour rebound compared to peers adds to curiosity, but the negative seven-day performance places Pi firmly within the broader corrective trend.
CoinMarketCap view data suggests monitoring behavior rather than speculative enthusiasm.
What CoinMarketCap Trending Data Tells Us About the Market
Several conclusions emerge clearly from this dataset:
Trending reflects attention, not performance All six assets declined over seven days.
Large caps dominate focus Investors gravitate toward liquidity and durability.
Volatility increases informational demand Drawdowns drive research behavior.
Dislocations amplify attention Monero’s case is a clear example.
CoinMarketCap’s view metrics provide a valuable lens into investor psychology. Right now, that psychology is cautious, analytical, and defensive.
Final Takeaway
On January 22, 2026, CoinMarketCap trending data paints a picture of a market in evaluation mode.
Crypto is not being ignored. It is being examined closely.
When attention rises during drawdowns, it often signals preparation rather than panic. Investors are watching first, deciding later.
FAQs
1. What does “trending” mean on CoinMarketCap?
Trending refers to assets with the highest number of user views over a given period. It measures attention, not price performance.
2. Are trending coins always gaining in price?
No. Trending often increases during volatility or declines, when investors seek information.
3. Why are only large-cap coins trending right now?
During uncertain markets, users prioritize liquidity, longevity, and systemic relevance.
4. Why is Monero trending despite a sharp decline?
Large drawdowns in major assets typically trigger reassessment and research activity.
5. Does trending data predict future price moves?
No. It reflects interest, not direction.
6. Where does CoinMarketCap source its data?
CoinMarketCap aggregates price, volume, and user engagement data across major exchanges and platforms.
7. How should investors use trending data?
As a sentiment and attention indicator, not a trading signal.
Bitcoin’s current market behavior has confused even experienced participants. Price swings are sharp. Volatility appears suddenly. Headlines change tone daily. And yet, despite all of this motion, the market struggles to sustain a clean directional trend.
To some observers, this looks like weakness. To others, it looks like manipulation. To a smaller and more accurate group, it signals something far more consequential.
This distinction matters. Markets break when demand disappears, liquidity evaporates, or confidence collapses across participant classes. None of those conditions defines the current environment. Instead, Bitcoin is navigating a rare and complex redistribution phase, where large amounts of supply are changing hands between holders with fundamentally different incentives, time horizons, and risk tolerances.
This is not a trader-dominated market. It is a market governed by competing mandates.
At the center of this phase is a tug of war between different categories of Bitcoin whales. Some are deeply profitable long-term holders who accumulated years ago. Others are relatively new entrants, often institutional in nature, whose cost bases sit close to current prices. Their interaction, not news headlines or short-term indicators, is shaping Bitcoin’s price behavior.
Understanding this tug of war is essential for interpreting Bitcoin’s present without falling into narrative traps.
The Quiet Shift From Early Whales to Institutional Giants
For most of Bitcoin’s history, large holders shared a defining characteristic. They were early.
Early whales accumulated Bitcoin at prices that now feel almost fictional. Many mined or purchased BTC when it traded for tens, hundreds, or low thousands of dollars. Their cost bases granted them extraordinary psychological flexibility. Price volatility, even severe drawdowns, did not threaten their thesis or their solvency.
That era no longer defines Bitcoin’s marginal buyer.
Today, the dominant source of new demand comes from institutional entities. Corporate treasuries, regulated investment vehicles, exchange-traded products, and structured allocators now absorb a growing share of circulating supply. Their decision-making processes differ fundamentally from those of early adopters.
Institutional buyers operate under formal mandates. Capital deployment is governed by committees, risk frameworks, reporting requirements, and fiduciary obligations. These constraints shape behavior in ways that are less emotional but more complex.
Companies like MicroStrategy exemplify this transition. Their approach is explicit and unapologetically long-term. Accumulation is not a trade. It is a balance-sheet strategy. Newer entrants have gone further, openly stating that acquiring Bitcoin at scale is the primary objective, not a side allocation.
The importance of this shift cannot be overstated. Institutional capital does not behave like retail capital. It does not react reflexively to short-term price movements. It operates on conviction, policy alignment, and multi-year horizons.
As this cohort grows, Bitcoin’s market structure evolves with it.
Why New Whales Matter More Than Old Whales Right Now
Whales have always influenced Bitcoin. What has changed is which whales matter most at this stage of the cycle.
On-chain data shows that large holders with shorter holding periods now control more supply than long-term holders in the same size bracket. This represents a structural inflection point. Power over marginal price action has shifted toward participants whose exposure is newer and whose cost bases are higher.
These “new whales” differ from the old guard in several critical ways.
First, cost basis proximity. Many institutional positions were built during periods of elevated prices. Their average entry levels sit closer to current market values, which creates sensitivity. Price fluctuations matter more when unrealized losses or gains sit within reporting thresholds.
Second, accountability. Institutional holders answer to boards, shareholders, regulators, and investors. Even when conviction remains intact, drawdowns trigger internal review. Risk is not only financial. It is reputational.
Third, heterogeneity. New whales are not uniform. Some are long-only strategic accumulators. Others are flexible allocators who reassess exposure based on macro conditions, liquidity, or portfolio correlations.
This diversity within the cohort creates internal tension. Some absorb supply aggressively during dips. Others reduce exposure when uncertainty rises. The result is a constant exchange of supply rather than a one-sided flow.
That is the tug of war.
The market is not witnessing mass distribution or unified accumulation. It is experiencing selective selling met by selective buying, often at the same price levels.
The $6 Billion Question: Why Unrealized Losses Matter
Unrealized losses do not directly move markets. Behavior does.
When a large cohort of holders collectively sits on billions in unrealized losses, markets enter a phase of psychological stress testing. Every rally becomes a decision point. Every dip becomes a referendum on conviction.
For some new whales, lower prices represent opportunity. They view volatility as noise within a longer-term thesis. For others, the same price action introduces risk considerations related to capital allocation, portfolio balance, or governance oversight.
This asymmetry creates friction.
Sellers emerge not because belief collapses, but because tolerance differs. Buyers step in not because assets are cheap in absolute terms, but because supply becomes available.
This is why Bitcoin can move violently without establishing trend continuity. Supply rotates rather than exits the system.
Importantly, this behavior diverges sharply from bear market dynamics. In bear markets, demand retreats and liquidity thins. Here, demand remains present. What fluctuates is the willingness to absorb at specific price levels.
This process is slow, uneven, and frustrating. It is also constructive.
Why This Is Not a Bear Market Signal
It is tempting to interpret range-bound volatility as weakness. That interpretation misreads the underlying mechanics.
Demand remains active, particularly among long-term allocators. Liquidity, while volatile, remains accessible. Forced selling exists, but it is localized rather than systemic.
What we are witnessing is redistribution, not abandonment.
Markets often confuse discomfort with danger. This phase is uncomfortable because it resists simple narratives. It does not reward trend chasing or blind conviction. It rewards patience and structural understanding.
Macro Noise vs Structural Reality
Macroeconomic and geopolitical developments continue to influence Bitcoin’s short-term price movements. Tariff threats, rate expectations, and policy signaling inject volatility into all risk assets.
But volatility is not structure.
Macro events explain why price moves on a given day. Whale dynamics explain why the price struggles to trend over weeks and months.
When strategic buyers absorb dips while pressured sellers distribute into strength, the price oscillates. News becomes a catalyst rather than a driver.
This distinction prevents overreaction. It keeps focus on the deeper forces shaping the market rather than the surface-level triggers.
Why Volatility Spikes Without Follow-Through
Bitcoin’s recent price behavior follows a recurring pattern. Sharp declines trigger liquidations. Prices rebound quickly. Momentum fades. The market stalls.
This pattern reflects leverage reset rather than value discovery.
Liquidations remove excess positioning. Absorption stabilizes price. The absence of new marginal demand caps upside. The cycle repeats.
Each iteration transfers coins from weaker conviction to stronger hands. Over time, this reduces fragility. But the process is nonlinear and uneven.
Volatility without follow-through is not failure. It is digestion.
What Search Behavior Confirms About Market Psychology
Search data offers a revealing lens into investor psychology.
Interest has shifted away from speculative targets toward explanatory queries. Participants are asking why Bitcoin behaves this way, who is selling, and whether whales control the market.
This indicates a transition from belief-driven engagement to interpretation-driven engagement.
Historically, such phases precede resolution. Not immediately, but eventually. Markets pause to reassess before committing to the next directional move.
Scenario Analysis: How the Tug of War Resolves
Scenario One: Absorption Completes
In this scenario, pressured sellers finish distributing. Strategic buyers consolidate supply. Volatility compresses. Price stabilizes before regaining directional bias.
This outcome favors patience.
Scenario Two: Stress Forces Further Distribution
If price revisits lower levels, some new whales reduce exposure. Stronger hands absorb at scale. Ownership concentrates further.
This outcome favors discipline.
Scenario Three: Macro Shock Overrides Structure
A major policy or liquidity shock overwhelms internal dynamics. Correlations spike. Structure reasserts itself after the shock passes.
This outcome favors resilience.
None of these scenarios implies collapse.
What This Means for Investors, Not Traders
This market does not reward speed. It rewards understanding.
Investors should focus on:
Cost-basis distribution Liquidity sensitivity Time-horizon alignment Exposure sizing
This is not a moment to chase narratives. It is a moment to respect structure.
The Bottom Line: Bitcoin Is Scarce Because It Is Contested
Bitcoin’s current market is not directionless. It is deliberate.
It reflects a tug of war between old conviction and new capital, between strategic accumulation and tactical pressure, between time horizons that do not align.
The market is deciding who owns the next cycle’s supply.
That decision will not be made by headlines or predictions. It will be made through absorption.
And that process is already underway.
FAQs
1. Why is Bitcoin so volatile right now? Bitcoin is volatile because large holders with different time horizons are actively exchanging supply. This creates sharp moves without sustained trends. Volatility reflects redistribution, not collapse.
2. Are whales manipulating Bitcoin’s price? Whales influence price through size, not coordination. The current behavior reflects conflicting incentives rather than deliberate manipulation.
3. Why do rallies fail to continue? Rallies attract selective distribution from holders managing risk, while absorption prevents collapse. This creates range-bound behavior.
4. Is this a sign of a bear market? No. Demand remains active and liquidity intact. This phase reflects ownership transfer rather than demand destruction.
5. Why do institutional buyers matter so much now? Institutions control large capital pools and operate with long-term mandates, altering how supply reacts to price movements.
6. What role do unrealized losses play? Unrealized losses influence behavior by testing conviction and risk tolerance, especially for accountable institutions.
A macro stress test for global markets as risk appetite fractures
Global markets are sending a clear and uncomfortable signal. Stocks are selling off across major indices. Cryptocurrencies are falling faster and with greater volatility. Gold, meanwhile, is moving higher, absorbing capital that is actively exiting risk assets.
This divergence is not a short-term anomaly or a technical coincidence. It reflects a deeper shift in how investors are interpreting policy risk, liquidity conditions, and the durability of the current market regime. When equities and crypto fall together while gold rises, markets are not simply reacting to bad news. They are reassessing assumptions about stability, correlation, and protection.
Over the past several sessions, the alignment has been striking. U.S. equities recorded one of their sharpest single-day declines in months. Bitcoin slipped below key psychological levels, underperforming stocks on a relative basis. Crypto-linked equities, including miners and exchanges, sold off aggressively. At the same time, gold rallied to fresh highs, reinforcing its role as the preferred hedge during moments of macro uncertainty.
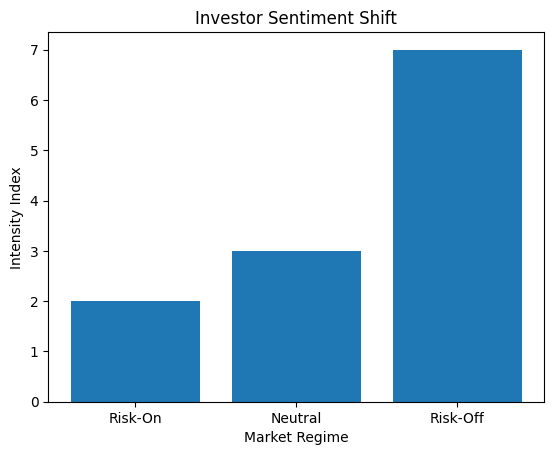
This pattern matters because it reveals how capital behaves when confidence weakens. Investors are not rotating within risk assets. They are exiting risk altogether. That distinction is critical.
The question now is not whether markets will remain volatile. Volatility is already here. The real question is whether this divergence marks a temporary stress episode or the early stages of a broader regime shift that could define asset performance for months ahead.
To answer that, we need to unpack what triggered this move, why stocks and crypto fell together, why gold diverged, and what the next set of outcomes could realistically look like.
The Trigger: Policy Shock Meets Fragile Positioning
Market selloffs rarely happen in a vacuum. They occur when a catalyst collides with vulnerability. In this case, renewed tariff threats from the U.S. administration acted as the spark, but the fire was already waiting.
The immediate trigger was a sharp escalation in trade rhetoric directed at several European economies, tied to broader geopolitical tensions. While tariff threats themselves are not new, the timing and tone mattered. Markets were already navigating a delicate balance between slowing growth, uncertain monetary policy, and elevated valuations across both equities and crypto assets.
In that environment, policy surprises carry outsized impact. Tariffs introduce multiple layers of uncertainty at once. They raise the risk of higher inflation by increasing import costs. They threaten growth by disrupting trade flows and corporate planning. And they complicate central bank decision-making by pulling inflation and growth in opposite directions.
This combination is particularly damaging for risk assets. Equities depend on earnings visibility and stable discount rates. Cryptocurrencies depend on liquidity, confidence, and speculative capital. Tariff-driven uncertainty undermines all three simultaneously.
What made the reaction sharper was positioning. Many investors entered this period with expectations of policy normalization, easing financial conditions, and continued institutional inflows. Instead, they were confronted with a reminder that geopolitical risk remains unresolved and unpredictable.
As a result, selling cascaded quickly. Equity markets repriced growth assumptions. Crypto markets, which tend to amplify moves due to leverage and thinner liquidity, experienced accelerated downside. Gold, by contrast, benefited immediately as capital sought assets perceived as insulated from policy missteps.
The key takeaway is that this was not a random selloff. It was a policy shock hitting markets that were already stretched and sensitive to disappointment.
Why Stocks and Crypto Fell Together
1. Risk assets now share the same liquidity backbone
One of the most important changes in modern markets is the increasing integration of cryptocurrencies into the traditional financial system. Bitcoin and major digital assets no longer operate on the fringes of global capital markets. They are embedded within them.
Over the past several years, institutional adoption has transformed crypto’s market structure. Spot ETFs, regulated custody solutions, derivatives markets, and prime brokerage services have brought crypto exposure into the same portfolios that hold equities, bonds, and commodities. As a result, crypto now responds to many of the same liquidity forces that drive stock prices.
When liquidity is abundant and risk appetite is strong, this integration works in crypto’s favor. Capital flows freely. Correlations compress. Prices rise together. But when liquidity tightens or uncertainty increases, the same integration becomes a vulnerability.
During this recent selloff, equities and crypto moved lower in tandem because they are drawing from the same pool of global risk capital. When investors de-risk, they reduce exposure across the entire risk spectrum. Crypto, with its higher volatility and leverage, often absorbs the largest impact.
This is why Bitcoin’s decline mirrored equity weakness rather than offsetting it. Crypto did not serve as a hedge. It behaved as a high-beta extension of the same risk trade.
Understanding this shift is essential. The idea that crypto automatically diversifies equity risk is outdated in the short term. In stress environments, correlation rises, not falls.
2. Tariffs revive inflation and growth fears at the same time
Tariffs are uniquely destabilizing because they attack markets from two directions. On one hand, they introduce inflationary pressure by raising the cost of imported goods and disrupting supply chains. On the other hand, they suppress growth by increasing uncertainty, reducing trade volumes, and discouraging investment.
For equities, this creates a valuation problem. Higher inflation pushes interest rates higher or delays rate cuts, increasing discount rates. Slower growth reduces earnings expectations. Together, they compress multiples and pressure prices.
For crypto, the impact is different but equally damaging. Crypto assets thrive in environments of expanding liquidity and speculative confidence. When tariffs threaten growth and complicate monetary policy, liquidity expectations weaken. Investors become more selective. Risk tolerance declines.
This dual effect explains why both markets sold off simultaneously. Investors were not choosing between stocks and crypto. They were choosing whether to remain exposed to risk at all.
Gold, by contrast, benefits from this exact setup. It does not depend on growth. It does not generate cash flows that need to be discounted. It thrives when inflation risk rises and confidence in policy coordination weakens.
3. Crypto-Specific Fragility Amplified the Move
While macro forces triggered the initial wave of selling, crypto’s internal market structure significantly intensified the downside. This was not a random or isolated breakdown. It reflected a market that had become structurally fragile beneath the surface, even as headline prices appeared stable.
In the weeks leading into the selloff, several warning signs were already present. Bitcoin and major altcoins had recently tested or exceeded prior highs, inviting profit-taking from early entrants and long-term holders. Momentum slowed, but positioning did not adjust accordingly. Derivatives markets remained heavily skewed toward long exposure, particularly in perpetual futures. Funding rates signaled optimism that had not yet been validated by fresh inflows.
At the same time, retail participation had thinned. Spot volumes declined relative to prior rallies, suggesting that price action relied increasingly on institutional flows and leveraged positioning rather than broad-based demand. This matters because institutional flows tend to be episodic, not continuous. When they pause or reverse, markets lose a critical stabilizing force.
Once prices began to slip, leverage became the accelerant. Liquidations triggered mechanically as margin thresholds were breached. Forced selling added pressure regardless of fundamentals or longer-term conviction. Support levels failed more rapidly than in equity markets, where circuit breakers, passive flows, and diversified ownership structures slow declines.
Crypto markets remain reflexive by design. Price declines trigger liquidations, liquidations trigger further declines, and feedback loops emerge quickly. This reflexivity has diminished over time but has not disappeared. Even as infrastructure matures and institutional participation grows, leverage remains deeply embedded in market behavior.
This dynamic does not imply that crypto is inherently unstable. It does mean that volatility amplification remains a defining risk characteristic. In moments of macro stress, crypto often absorbs pressure faster and more violently than traditional assets. Understanding this mechanical reality is essential for interpreting price moves without overreacting to them.
Why Gold Stayed Green While Everything Else Turned Red
Gold Responds to Policy Credibility Risk, Not Momentum
Gold’s resilience during this selloff had little to do with technical patterns or speculative enthusiasm. It reflected a deeper function that gold has served for centuries. Gold responds to credibility risk in policy and governance, not to short-term momentum or earnings expectations.
Tariff threats strike at the foundation of global economic coordination. They introduce uncertainty into trade relationships, supply chains, and inflation management. When investors sense that policy direction may become unpredictable or confrontational, they seek assets that sit outside the policy framework entirely.
Gold fits that role uniquely. It carries no counterparty risk. It does not depend on corporate profits, growth forecasts, or monetary accommodation. It is not issued by any government and cannot be diluted by policy decisions. It exists independently of the systems that are being questioned.
In moments when investors reassess trust rather than chase returns, gold becomes the first destination for defensive capital. This explains why gold often rises not during recessions themselves, but during periods when confidence in decision-making erodes.
Importantly, gold’s strength does not require a crisis narrative. It does not rely on fear alone. It benefits from uncertainty, ambiguity, and policy friction. That is precisely the environment created by escalating tariff rhetoric and geopolitical tension.
This distinction helps explain why gold can rise even as equities and crypto fall together. Stocks and digital assets remain embedded within the economic system. Gold stands apart from it.
Central Bank Behavior Reinforces Gold’s Role
Another powerful force supporting gold is sustained central bank demand. Over the past several years, central banks have accumulated gold at some of the fastest rates seen in decades. This behavior is deliberate and strategic, not reactive.
Central banks buy gold to diversify reserves, reduce exposure to any single currency, and hedge against geopolitical fragmentation. These motivations align closely with the current global environment, where economic blocs are becoming more fragmented and policy coordination is less certain.
Unlike speculative flows, central bank buying creates a steady, price-insensitive bid. These institutions are not trading volatility. They are managing long-term reserve stability. As a result, gold prices benefit from structural support even when broader markets experience stress.
This contrasts sharply with crypto markets, where flows remain more cyclical and sentiment-driven. While institutional crypto adoption has grown, it has not yet reached the level of strategic reserve allocation that gold enjoys.
The difference matters. Structural demand dampens volatility and anchors confidence. Cyclical demand amplifies moves in both directions.
The Digital Gold Narrative Failed Another Real-Time Test
Bitcoin is frequently described as digital gold, but this episode highlights an important and often misunderstood distinction. In moments of acute macro stress, Bitcoin still behaves like a high-beta risk asset rather than a defensive hedge.
That observation does not undermine Bitcoin’s long-term thesis as a scarce digital asset. It does not negate its potential role in a future monetary system. What it does clarify is Bitcoin’s current position in the market hierarchy.
Bitcoin remains highly sensitive to liquidity conditions, risk appetite, and policy expectations. When uncertainty rises sharply and capital prioritizes preservation over opportunity, Bitcoin tends to fall alongside equities rather than diverge from them.
Gold does not require belief or narrative reinforcement. Its role as a store of value is deeply institutionalized. Bitcoin’s role is still evolving. It attracts capital during periods of monetary expansion and confidence. It struggles when liquidity tightens and policy uncertainty rises.
This does not mean the digital gold thesis is invalid. It means it is incomplete. Bitcoin may serve as a long-term hedge against monetary debasement, but it has not yet proven itself as a short-term hedge against geopolitical or policy shocks.
Recognizing this distinction helps investors avoid misplaced expectations. It allows Bitcoin to be evaluated on its actual behavior rather than aspirational comparisons.
What Search Data and Market Behavior Are Telling Us
Search behavior offers a valuable window into investor psychology. At present, the dominant queries are not about upside targets or breakout predictions. They focus on explanation, causality, and risk assessment.
People are searching for why markets are moving together, why traditional hedges are diverging, and whether current conditions signal something more systemic. This shift in attention is meaningful.
It suggests that uncertainty, not greed, is driving engagement. Investors are not rushing to deploy capital. They are pausing to understand the environment. This behavior typically appears during reassessment phases rather than panic phases.
Market behavior reinforces this interpretation. While prices have fallen, there has been no widespread disorder. Liquidity remains intact. Credit markets have not seized. Volatility has risen, but not uncontrollably.
This combination of elevated concern and controlled behavior points to a market that is re-pricing risk rather than collapsing under it. In such environments, clear and disciplined analysis carries more value than bold forecasts.
For content creators and analysts, this moment rewards clarity over confidence and explanation over speculation.
What Happens Next?
Base Case: Volatility Persists, Leadership Remains Defensive
The most likely scenario is one of continued volatility without systemic crisis. Equities may stabilize but struggle to regain leadership. Crypto may remain under relative pressure as leverage resets and confidence rebuilds. Gold is likely to hold gains as long as policy uncertainty remains unresolved.
This environment favors patience and balance. It does not reward aggressive directional bets.
Downside Risk Case: Escalation and Liquidity Stress
If tariff rhetoric escalates into concrete policy actions, downside risks increase materially. Growth expectations would weaken. Inflation risk could rise. Central banks could face constrained policy choices.
In this scenario, risk assets could reprice lower in a more disorderly fashion. Crypto would likely underperform due to leverage sensitivity. Gold would benefit disproportionately as capital seeks insulation from systemic risk.
Upside Recovery Case: De-Escalation and Clarity
If tensions ease and policy signals stabilize, markets could recover. Equities may rebound selectively. Crypto could recover faster due to higher beta. Gold may consolidate rather than reverse sharply.
This outcome requires clarity, not optimism. Markets respond to reduced uncertainty more than to positive headlines.
What This Means for Investors
This environment does not reward impulsive decisions. It rewards understanding.
Investors should focus on correlation risk, liquidity sensitivity, time horizon alignment, and exposure sizing. This is a moment to reassess assumptions, not to double down on narratives.
Markets are signaling caution, not catastrophe. Those who listen carefully will be better positioned for whatever comes next.
FAQs
1. Why are stocks and crypto falling together? Stocks and cryptocurrencies are both sensitive to global liquidity, risk appetite, and policy expectations. When uncertainty rises around trade, geopolitics, or interest rates, investors reduce exposure to assets tied to growth and confidence. This causes correlations to rise. In these moments, diversification breaks down temporarily as capital moves away from risk across markets at the same time.
2. Why is gold rising while other assets fall? Gold tends to benefit when investors question policy credibility, geopolitical stability, or fiscal discipline. It carries no credit risk and does not rely on earnings or growth assumptions. Central bank accumulation also provides structural support. These factors make gold a preferred destination for defensive capital when uncertainty increases and confidence in risk assets weakens.
3. Is Bitcoin failing as an asset? No. Bitcoin is not failing, but it is behaving according to its current role in markets. In periods of stress, Bitcoin still trades like a high-beta risk asset rather than a safe haven. This does not invalidate its long-term scarcity thesis. It highlights that Bitcoin remains sensitive to liquidity conditions and investor confidence in the short to medium term.
4. Does this mean the digital gold narrative is wrong? The digital gold narrative is incomplete rather than wrong. Bitcoin may serve as a long-term hedge against monetary debasement, but it has not yet proven itself as a short-term hedge during geopolitical or policy-driven shocks. Gold has centuries of institutional trust, while Bitcoin’s role is still evolving within the global financial system.
5. Are markets signaling an upcoming crisis? At this stage, markets are signaling reassessment, not crisis. Liquidity remains functional, and there is no evidence of systemic breakdown. Volatility has increased, but price action reflects caution rather than panic. Investors are repricing risk and waiting for clearer policy signals before committing capital, which is typical during transitional phases.
6. What role is policy uncertainty playing in this selloff? Policy uncertainty is a central driver. Tariff threats, geopolitical tensions, and unclear monetary direction introduce unpredictability into growth and inflation expectations. Markets dislike ambiguity more than bad news. When policy signals lack clarity or consistency, investors reduce risk exposure until they gain better visibility into potential outcomes.
7. Why does crypto fall faster than equities during stress? Crypto markets still contain higher leverage and more reflexive mechanics than equity markets. When prices decline, liquidations can accelerate moves mechanically. Retail participation is also more volatile. These factors cause crypto to absorb shocks faster and more aggressively, even as institutional participation continues to grow.
8. Should investors expect continued volatility? Yes, continued volatility is likely until policy clarity improves. Markets are sensitive to headlines, macro data, and geopolitical developments. Until uncertainty fades or stabilizes, price swings across equities, crypto, and commodities may persist. Volatility does not imply collapse, but it does require disciplined risk management and patience.
9. What indicators matter most right now? Investors should focus on policy developments, interest rate expectations, inflation data, and cross-asset correlations. Gold behavior relative to equities, crypto performance versus stocks, and liquidity conditions offer more insight than short-term price targets. These indicators help assess whether markets are stabilizing or preparing for further repricing.
10. How should long-term investors approach this environment? Long-term investors should prioritize balance, position sizing, and time horizon alignment. This is a moment to reassess assumptions rather than chase narratives. Avoid overreacting to short-term moves. Markets are recalibrating, not resetting. Those who focus on fundamentals, risk control, and patience are better positioned for the next phase.
The Bottom Line
Markets are not broken. They are recalibrating.
What we are witnessing is not a systemic failure or a loss of control. It is a repricing of risk in response to rising uncertainty. When stocks and cryptocurrencies bleed red while gold stays green, markets are sending a clear message about where confidence stands. Capital is not chasing opportunity. It is prioritizing protection.
This shift reflects a change in investor psychology rather than panic. Participants are reassessing assumptions that had quietly become embedded during periods of stability and liquidity. Trade policy uncertainty, geopolitical friction, and questions around monetary direction have introduced enough ambiguity to warrant caution. In response, investors are reducing exposure to assets that depend on growth, liquidity, and confidence, and reallocating toward assets that offer insulation from policy risk.
Importantly, this behavior does not signal the end of the cycle. It signals a pause. Markets often move in phases where risk is priced aggressively, then reassessed, then selectively re-embraced. The current phase is one of reassessment. Investors are waiting for clearer signals before committing fresh capital.
What happens next will depend far less on short-term chart patterns and far more on policy behavior and communication. Markets are listening closely to governments, central banks, and geopolitical developments. Clarity can stabilize sentiment. Escalation can deepen caution.
For now, the message is unmistakable. When uncertainty rises, protection comes first. Growth opportunities do not disappear, but they take a back seat until confidence is rebuilt.
How ETFs, policy, and global liquidity reshaped Bitcoin’s market structure after the 2024 halving
I have spent years working across crypto content, research, and market analysis, watching narratives rise, harden into doctrine, and eventually fail under real market pressure.
Few ideas shaped Bitcoin investor behavior more than the four-year cycle. Halvings reduced supply. Prices surged. Crashes followed. The rhythm felt inevitable.
After the 2024 halving, that model stopped explaining what the market was doing.
Price broke prior highs early. Volatility compressed instead of expanding. Institutional capital, policy decisions, and global liquidity began exerting more influence than issuance mechanics alone.
This piece breaks down what changed, why the old cycle lost its timing power, and what actually drives Bitcoin’s market behavior heading into 2026.
Bitcoin’s four-year cycle has shaped how investors interpret crypto market behavior for more than a decade. Rooted in halving events that reduce mining rewards every 210,000 blocks, the cycle historically aligned with large price expansions followed by deep corrections. This framework guided market expectations through multiple bull and bear phases, creating what many considered a predictable rhythm in an otherwise chaotic asset class.
Following the April 19, 2024 halving at block 840,000, however, the familiar script began to diverge. Price action unfolded earlier than expected, volatility compressed instead of expanding, and traditional post-halving signals failed to materialize. For the first time in Bitcoin’s history, a post-halving year ended with negative returns — Bitcoin closed 2025 down more than 30% from its October all-time high of $126,080, marking an unprecedented deviation from historical patterns.
This question matters because the market environment has fundamentally changed. Institutional investors now hold Bitcoin through regulated vehicles that didn’t exist in previous cycles. Policy decisions exert measurable influence on demand through mechanisms like the Strategic Bitcoin Reserve. Global liquidity conditions increasingly dictate capital flows more than supply schedules. Against this backdrop, reassessing the relevance of the four-year cycle is not academic — it is necessary for anyone seriously analyzing Bitcoin markets.
The Foundation: How Bitcoin’s Four-Year Cycle Works
Bitcoin’s four-year cycle originates from a fixed monetary rule embedded in its protocol. Every 210,000 blocks, approximately once every four years, the block subsidy paid to miners is reduced by 50 percent. This halving mechanism slows the rate of new Bitcoin issuance and introduces programmed scarcity — a design feature Satoshi Nakamoto built into Bitcoin’s code from inception.
Historically, these supply reductions coincided with a recurring price pattern that became deeply embedded in investor psychology:
Pre-Halving Accumulation: Bitcoin tended to rally in anticipation of the halving event as market participants positioned for reduced supply. This anticipatory phase typically began 12–18 months before the halving date.
Post-Halving Acceleration: Within 12 to 18 months following halvings, Bitcoin experienced parabolic price acceleration. Historical data shows Bitcoin appreciated between 53.3% to 122.5% in the six months following previous halvings, with peak gains occurring roughly 12–18 months post-event.
Cycle Peak and Correction: After reaching new all-time highs, Bitcoin experienced sharp drawdowns ranging from 65% to 80% from peak levels. These corrections marked transitions from bull to bear markets.
Extended Bear Markets: Prolonged consolidation periods followed before the next cycle began, typically lasting 12–24 months until accumulation for the next halving started.
The 2013 cycle saw Bitcoin rise from under $13 to over $1,100 before retracing to near $200 — an 82% drawdown. In 2017, price advanced from roughly $650 to nearly $20,000, followed by an 84% decline to $3,200. The 2020 to 2021 cycle lifted Bitcoin from approximately $8,500 to $69,000 before falling 77% to around $15,500 by late 2022.
This repetition reinforced investor behavior. As awareness of the pattern spread, market participants positioned ahead of anticipated milestones, strengthening the cycle through collective expectation. That reflexivity proved powerful in markets dominated by retail capital and limited derivatives infrastructure — but it established dependencies that would later prove fragile.
The 2024 Halving: When the Script Changed
The April 2024 halving represented a structural inflection point that shattered historical precedent. For the first time, Bitcoin surpassed its prior all-time high before the halving occurred. Price reached approximately $73,000 in March 2024, exceeding the November 2021 peak of $69,000 while block rewards were still 6.25 BTC.
This early breakout signaled a fundamental shift in demand dynamics. The rally was not driven by retail speculation or leverage expansion typical of previous cycles. It was driven by institutional inflows following the January 11, 2024 approval of spot Bitcoin exchange-traded funds in the United States — a regulatory milestone that fundamentally transformed crypto accessibility.
Spot ETF demand altered the post-halving trajectory as well. Historically, Bitcoin appreciated between roughly 50% and 120% in the six months following prior halvings. In contrast, the six months following April 2024 delivered approximately 41% gains — from $63,762 on halving day to around $90,446 by mid-November. Price appreciation persisted, but without the parabolic acceleration typical of earlier cycles.
Instead of entering a speculative blow-off phase characterized by extreme volatility and euphoric sentiment, Bitcoin transitioned into a period of controlled, range-bound growth. Monthly Relative Strength Index (RSI) readings — a momentum indicator that measures overbought and oversold conditions — remained largely between 60 and 70 rather than reaching the extreme levels above 90 observed near past cycle peaks. This moderation suggested measured accumulation rather than speculative mania.
Most notably, Bitcoin entered 2025 trading below its opening price for the year, eventually closing 2025 down more than 30% from its October peak. This marked the first instance in which a post-halving year failed to close decisively higher — a deviation that fundamentally challenged the assumption that halvings alone dictate short-term price outcomes.
Institutional Capital: The Structural Shift Reshaping Markets
Institutional participation fundamentally reshaped Bitcoin’s market structure in ways that extend far beyond simple demand dynamics. Unlike retail traders who chase momentum and panic sell during corrections, institutions allocate capital based on portfolio construction frameworks, risk management mandates, and long-term macro views. Their behavior tends to dampen volatility and extend trend duration rather than amplify speculative extremes.
Spot Bitcoin ETFs removed operational and regulatory barriers that previously constrained institutional access. These products offered regulated custody through firms like Coinbase Prime, which held $245 billion in institutional assets under custody as of June 30, 2025, standardized reporting that satisfied compliance requirements, and seamless integration into existing investment systems that institutional investors already used.
This shift influenced market correlations in profound ways. Bitcoin’s return profile increasingly aligned with broader risk assets following ETF approval. Research examining the relationship between Bitcoin and the S&P 500 found that daily returns correlation measured 0.2 from January 2014 to April 2025, but when parsed into smaller three-year periods, correlations remained near zero in initial periods before jumping into positive territory in 2020 and sustaining higher levels over the past five years.
During periods of market stress, these correlations intensified further. CME Group analysis identified that higher positive correlations are frequently evident during stressed market environments, such as the February-March 2020 COVID-19 onset, the 2022 period when the Ukraine war started and the Federal Reserve increased interest rates, and the January to early April 2025 volatility spike. This asymmetrical correlation relationship meant positive correlation frequently increased when uncertainty rose, suggesting risk-off investor sentiment for Bitcoin resembled equity market behavior.
The implication was structural integration. Bitcoin began behaving less like an isolated alternative asset and more like a macro-sensitive instrument within the global financial system. This integration reduced tail-risk volatility — Fidelity Digital Assets research found Bitcoin’s realized volatility has declined substantially, with the asset now less volatile than 33 S&P 500 stocks — while increasing exposure to broader liquidity conditions that drive all risk assets.
Policy and Regulation as Primary Market Variables
Policy developments emerged as material price drivers in 2025 and early 2026, in many cases eclipsing traditional on-chain signals and halving-based expectations. Regulatory clarity, rather than halving schedules, increasingly shaped institutional participation and capital deployment decisions.
Executive actions by the U.S. administration marked a dramatic shift. On January 23, 2025, President Trump signed an executive order titled “Strengthening American Leadership in Digital Financial Technology” that established clear policy priorities including protection of self-custody rights, promotion of blockchain development, and prohibition of central bank digital currencies. The order also created the President’s Working Group on Digital Asset Markets within the National Economic Council, tasked with developing comprehensive federal regulatory frameworks.
Congressional action provided additional clarity. The GENIUS Act, passed in mid-2025, created the first comprehensive federal framework for dollar-backed stablecoins, imposing 100% reserve backing requirements and establishing audit standards. While focused on stablecoins, the law’s passage signaled growing political consensus around crypto regulation and demonstrated that legislative frameworks could move from proposal to law.
Market structure legislation progressed through Congress as well. White House crypto adviser David Sacks stated in early 2026 that lawmakers were “closer than ever” to passing landmark crypto market structure legislation. The proposed framework would end the jurisdictional dispute between the Securities and Exchange Commission and the Commodity Futures Trading Commission, providing clear rules for which agency regulates which digital assets — a clarity that institutional investors had demanded for years.
State governments joined the federal push. Texas established the first state-managed fund to hold Bitcoin in June 2025, allocating funds to BlackRock’s spot Bitcoin ETF with plans for direct BTC investment. Arizona and New Hampshire passed similar legislation, positioning themselves to announce cryptocurrency purchases as part of treasury strategy in 2026.
These policy developments influenced institutional thinking more than halving schedules. Regulatory clarity removed uncertainty that previously deterred conservative investors. The Strategic Bitcoin Reserve provided sovereign validation, positioning Bitcoin as a strategic asset alongside gold and petroleum reserves in the federal stockpile. Political support created confidence that crypto-friendly policies would persist regardless of short-term market conditions.
Global Liquidity: The Dominant Driver in Modern Bitcoin Markets
Bitcoin’s sensitivity to global liquidity conditions increased materially as institutional participation grew, fundamentally altering the asset’s price discovery mechanism. Analysis of historical price movements reveals relationships that eclipse the predictive power of halving schedules.
Bitcoin moves in the direction of global M2 money supply 83% of the time in any 12-month period — a correlation higher than virtually any other major asset class. This strong relationship makes Bitcoin an effective barometer for liquidity conditions in the global financial system, but it also means the asset responds more to central bank balance sheets than to its own supply schedule.
Global M2 expanded dramatically during the COVID-19 pandemic as central banks injected unprecedented liquidity. This monetary expansion coincided precisely with Bitcoin’s explosive bull run from March 2020 (when Bitcoin traded around $5,000) to November 2021 (when it peaked at $69,000) — a 1,280% increase. When central banks began tightening policy in 2022, raising interest rates aggressively and reducing balance sheets through quantitative tightening, Bitcoin declined 77% alongside other risk assets. The correlation was unmistakable: loose liquidity drove prices up, tight liquidity pushed prices down.
The relationship temporarily broke down in early 2024. Bitcoin rallied to new highs above $73,000 in March while M2 growth remained subdued and even negative in year-over-year terms. This decoupling reflected institutional demand through newly approved ETFs rather than broad liquidity expansion — a supply shock from ETF demand overwhelming modest liquidity headwinds. By late 2025, however, the liquidity correlation reasserted itself. Bitcoin’s price fell 30% from its $126,080 peak while global M2 growth remained stagnant, suggesting the market was resetting expectations and repricing assets based on actual liquidity availability rather than anticipated future easing.
Several factors explain Bitcoin’s exceptional sensitivity to liquidity conditions. Unlike stocks, which generate earnings and dividends that provide fundamental support independent of liquidity, Bitcoin lacks cash flows. Unlike bonds, which offer contractual repayment and coupon payments, Bitcoin provides no yield. Unlike gold, which serves as a traditional safe haven with thousands of years of precedent, Bitcoin remains primarily classified as a risk asset despite “digital gold” narratives. Without structural support from fundamentals, safe-haven demand, or yield, Bitcoin responds directly to the availability of capital in financial markets.
The Federal Reserve’s policy trajectory became crucial for Bitcoin’s 2026 outlook. After raising the federal funds rate from near zero in early 2022 to a peak of 5.25–5.50% by July 2023, the Fed began cutting rates with a 50-basis-point reduction in September 2024 followed by additional cuts. Market pricing in early 2026 indicated probability of unchanged rates through early quarters but better than two-thirds chance of at least two additional cuts by year-end. This easing cycle stood in stark contrast to the tightening periods of 2018 and 2022, when rising rates crushed Bitcoin and other risk assets.
Beyond interest rates, the Fed’s balance sheet matters tremendously. The central bank effectively initiated quantitative easing in late 2025, announcing plans to purchase Treasury Bills to stabilize short-term funding markets. While distinct from formal QE programs launched during crises, these operations nonetheless increased system liquidity at the margin. Historical precedent is striking: the last time significant QE began was March 2020 following COVID-19’s onset, and over the subsequent 12 months, Bitcoin surged more than 1,000%. While past performance doesn’t guarantee future results, the pattern highlighted Bitcoin’s sensitivity to central bank liquidity provision.
Global liquidity extends beyond U.S. monetary policy. BitMEX founder Arthur Hayes argued that Bitcoin’s four-year cycles tied directly to both U.S. Dollar and Chinese Yuan dynamics. He explained that the 2013 peak resulted from post-2008 financial crisis money printing, the 2017 peak stemmed from yuan devaluation against the dollar creating capital flight, and the 2021 peak followed post-COVID monetary expansion across major economies. This perspective emphasized that Bitcoin responds to global, not just domestic, liquidity conditions — and that understanding cross-border capital flows becomes essential for price forecasting.
The dollar’s trajectory provides another key indicator. The U.S. dollar index fell approximately 7–9% in 2025 against major currency baskets, with the euro gaining 13% and the pound rising 7–8%. Historically, sustained dollar weakness aligns with stronger Bitcoin performance as a softer dollar supports global liquidity conditions, eases financial conditions in emerging markets, and strengthens the narrative for scarce, non-sovereign assets that aren’t subject to debasement through monetary expansion.
Ryan Yoon, senior analyst at Seoul-based Tiger Research, told Decrypt: “Bitcoin reacts preemptively when markets expect quasi-QE. Since Bitcoin is highly sensitive to liquidity, it is expected to lead the market.” This forward-looking behavior explains why Bitcoin often moves before official policy announcements — market participants anticipate liquidity conditions and position accordingly, creating price movements that precede fundamental catalysts.
Market Structure: From Speculation to Systemic Integration
Bitcoin’s integration into traditional financial infrastructure represents perhaps the most profound structural shift in the asset’s history. Bitcoin no longer operates in isolation but connects deeply to existing financial markets through multiple channels that transmit information, liquidity, and risk bidirectionally.
Exchange-traded funds created the primary integration channel. With over $113.8 billion in assets under management across the U.S. spot Bitcoin ETF complex and cumulative net inflows of nearly $56.9 billion since January 2024, Bitcoin ETFs represent substantial daily trading volume. These flows influence spot market prices through arbitrage mechanisms operated by authorized participants. When ETF demand exceeds supply, APs purchase Bitcoin on spot markets to create new ETF shares, transmitting institutional buying pressure directly to underlying assets. When redemptions occur, the reverse happens. This arbitrage ensures ETF prices track spot markets while creating a direct transmission mechanism from traditional finance to crypto markets.
Derivatives markets expanded alongside spot products, adding complexity and interconnectedness. Bitcoin futures contracts traded on CME since December 2017 provide institutional investors with regulated derivative exposure. Options markets grew substantially, with record quarterly expirations reaching $23.7 billion in December 2025. These derivatives enable sophisticated trading strategies including hedging, leveraged exposure, and arbitrage, but they also introduce complexity whereby positioning across futures curves and options gamma dynamics influence spot prices in ways divorced from fundamental supply-demand dynamics.
Corporate adoption extended beyond direct Bitcoin purchases. Companies explored Bitcoin-backed credit facilities, with the first corporate loans collateralized by BTC emerging in major economies. Tokenized treasury strategies that use Bitcoin as part of broader digital collateral stacks showed how deeply the asset was being woven into financial infrastructure. This integration tends to compress volatility over time as multiple stabilizing mechanisms emerge, but it also means liquidity shocks can transmit more directly between Bitcoin and other risk markets, eliminating the isolation that previously characterized crypto during traditional market stress.
The custody industry matured significantly. Professional custodians like Coinbase, BitGo, and Fidelity Digital Assets now hold billions in client Bitcoin, providing institutional-grade security, insurance coverage, and regulatory compliance that remove operational barriers previously deterring institutional participation. However, this concentration creates new risks. Approximately 48% of all Bitcoin held by major custodians resides in U.S. ETFs, creating significant concentration reminiscent of the Mt. Gox era when a single exchange held substantial supply — though modern custody arrangements include far superior security and insurance frameworks.
Bitcoin’s realized volatility dropped substantially compared to earlier cycles. Fidelity Digital Assets research found Bitcoin is currently less volatile than 33 S&P 500 stocks, and as recently as late 2023, 92 S&P 500 stocks exhibited higher volatility than Bitcoin. The asset’s annualized volatility fell as much as 75% from peak historical levels by mid-2025. This stabilization resulted from deeper liquidity pools, the “strong hands” effect where large institutional investors prove less prone to panic selling during downturns, and the rise of regulated investment products bringing capital managed under traditional risk frameworks that mandate position limits and drawdown controls.
Fidelity’s hash rate data showed Bitcoin’s hash rate rose above one zettahash per second in April 2024, reflecting continued investment in mining infrastructure. The 30-day mean hash rate and difficulty increased roughly 40% within the year following the halving, potentially indicating sustained long-term confidence in the network despite hash price — the expected return for each hash a miner generates — falling approximately 60% since April 2024 as competition distributed reduced rewards across more participants.
Trading infrastructure evolved as well. Institutional-grade trading platforms now offer algorithmic execution, prime brokerage services connecting multiple liquidity venues, and sophisticated order types including time-weighted average price (TWAP) and volume-weighted average price (VWAP) algorithms. Market makers provide continuous two-sided liquidity, tightening bid-ask spreads from 50–100 basis points in early years to 1–5 basis points on major exchanges, dramatically reducing slippage for large orders. These improvements make Bitcoin more accessible to traditional investors accustomed to deep, liquid markets with tight execution.
The increasing sophistication means Bitcoin behaves more like a traditional macro asset than a niche speculative instrument. Price movements reflect positioning across futures curves, options gamma dynamics creating convexity effects, and cross-asset correlations driving systematic flows. This complexity makes simple halving-based predictions less reliable as multiple variables influence outcomes simultaneously, requiring analysis frameworks that incorporate derivatives positioning, institutional flows, macro conditions, and technical levels rather than relying solely on supply schedule changes.
The Case for Cycle Evolution Rather Than Death
Not everyone accepts that the four-year cycle has ended. Several analysts argue the pattern persists but expresses differently under current market conditions. They point to historical precedent showing cycles evolve as markets mature, fundamental supply dynamics that remain unchanged despite shifting demand composition, and on-chain metrics that continue exhibiting familiar patterns even as price behavior diverges from historical norms.
Supply constraints still matter fundamentally. Bitcoin’s issuance continues declining with each halving, creating long-term scarcity even as miners develop sophisticated financing options through hashrate derivatives and forward sales, and institutional holders lock up supply through custody arrangements and long-term allocation mandates. Over the next six years through 2030, miners will produce roughly 700,000 new Bitcoin based on the current issuance schedule. At prices around $100,000, that represents $70 billion in new supply. Meanwhile, institutional cryptocurrency demand could reach $3 trillion in the same period according to industry projections. This 40-to-one supply-demand imbalance suggests significant structural upward pressure on price regardless of short-term cycle deviations or tactical positioning.
Historical patterns provide important context. While the current cycle deviated from previous timelines in terms of when price peaked relative to the halving date, Bitcoin demonstrated similar multiplicative behavior when examined from cycle lows. From cycle lows, Bitcoin increased 5.72 times by late 2024, comparable to 5.18 times at the same point in the 2015–2018 cycle and 5.93 times in the 2018–2022 cycle. If patterns continue following previous cycle templates, price could increase approximately 15 times from cycle lows, implying potential appreciation toward $200,000–250,000 ranges during the next 12–18 months.
The timing argument remains viable when viewed through institutional lenses. Market participants stood roughly 18 months past the April 2024 halving by late 2025, matching the typical length of past bull runs measured from halving to peak. Yet no clear reversal into deep bear market had materialized. Instead of interpreting this as cycle death, some analysts view it as evidence the cycle extends longer under institutional influence. Where retail traders created parabolic spikes followed by panic-driven crashes compressing timeframes, institutional capital produces steadier, more sustainable appreciation extending cycle duration while reducing amplitude of both rallies and corrections.
On-chain metrics support continuation arguments. Supply held by long-term holders — addresses that haven’t moved Bitcoin in over a year — shows distribution patterns around psychological price levels like $100,000, but overall accumulation trends remain intact. The percentage of supply classified as long-term holdings continues rising, indicating conviction among holders. Miner capitulation events that typically mark cycle bottoms and force distribution of mining inventory haven’t occurred, suggesting the market hasn’t completed its distribution phase before entering the next accumulation period.
Network fundamentals stay strong independent of price action. Hash rate reaching all-time highs above one zettahash per second — the measure of computational power securing the network — continues even as hash price declined 60% post-halving. Transaction volumes remain robust despite price consolidation, with average daily transactions exceeding 400,000 consistently. These metrics indicate underlying network health and growing usage independent of price cycles, providing foundation for future appreciation when liquidity and sentiment conditions align favorably.
Bitcoin’s market dominance increased from 64% to 72% following the fourth halving, while Ethereum and Solana’s dominance fell 56% and 25% respectively. This relative strength suggests capital rotation toward Bitcoin as a macro asset during uncertain periods, potentially indicating investors view Bitcoin differently than alternative cryptocurrencies — treating it more like digital gold than a speculative technology bet.
The four-year cycle may not have died but rather evolved significantly. Institutional participation extends bullish trends beyond historical timeframes and reduces bearish extremes by providing stabilizing demand during corrections, creating longer cycles with lower volatility and less pronounced peaks and troughs. This represents maturation, not destruction, of the underlying supply-driven pattern that halvings create — a distinction with substantial implications for forecasting and portfolio management strategies.
The 2026 Outlook: What Current Data Suggests
Price predictions for Bitcoin in 2026 vary dramatically, reflecting genuine uncertainty about which forces will dominate market direction. Analysts cluster forecasts into distinct camps based on different assumptions about institutional adoption rates, regulatory clarity, and macroeconomic conditions — each supported by reasonable analytical frameworks but reaching different conclusions.
Ultra-bullish projections from prominent industry figures target $200,000 to $250,000. These forecasts rest on fixed supply dynamics, accelerating institutional adoption through ETFs and corporate treasuries, and assumptions that post-halving supply squeeze combined with sustained demand will overwhelm macro headwinds. Some tie this upside specifically to liquidity cycles, arguing that if global M2 money supply growth accelerates meaningfully and the Federal Reserve maintains accommodative stance, Bitcoin could clear $200,000 by mid-to-late 2026 following historical liquidity correlation patterns.
Moderate institutional forecasts cluster in the mid-six-figure range with more nuanced conditioning. Several large financial institutions point to end-2026 ranges around $140,000–160,000 as base cases, framing these as realistic outcomes after
If you’re interested in how crypto markets are evolving beyond legacy narratives, I’ll be publishing more long-form analysis here.
The Digital Asset Market CLARITY Act of 2025, widely referred to as the CLARITY Act, stands as one of the most consequential pieces of cryptocurrency legislation ever proposed in the United States. Designed to resolve long-standing regulatory uncertainty about how digital assets should be treated under U.S. law, the CLARITY Act aims to create a clear, functional framework for regulating cryptocurrencies, digital commodities, and intermediaries such as exchanges and brokers. If enacted, it could significantly influence the development, adoption, and global competitive position of the U.S. crypto market.
This article explores every important angle of the CLARITY Act — from its origins and provisions to the potential market and legal impacts that may unfold as it moves through Congress and into implementation.
1. The Need for Regulatory Clarity
Historical Background
For nearly a decade, digital assets like Bitcoin, Ethereum, stablecoins, and DeFi tokens have operated in a regulatory gray zone in the United States. The primary federal regulators involved in crypto oversight are the Securities and Exchange Commission (SEC) and the Commodity Futures Trading Commission (CFTC):
The SEC has maintained that many digital assets are securities under federal law, applying the century-old Howey Test to determine what qualifies as an investment contract.
The CFTC regards cryptocurrencies with commodity-like characteristics (such as Bitcoin) as commodities and seeks authority over their trading markets.
This lack of clear division has led to overlapping enforcement actions, litigation, uncertainty for institutional investors, and caution among regulated financial institutions. Partly as a result, U.S. crypto firms have complained of stunted innovation and capital flight to jurisdictions with clearer rules.
2. What Is the CLARITY Act?
The CLARITY Act is a federal legislative bill introduced in the U.S. House of Representatives on May 29, 2025 by Rep. French Hill (R-AR) and co-sponsors across the political spectrum. Its purpose is to provide a durable legal framework for digital asset markets, to clearly categorize different classes of digital assets, and to allocate regulatory authority between the SEC and the CFTC.
The Act achieved bipartisan approval in the House on July 17, 2025, with a vote of 294–134, and as of late 2025 it is being reviewed and advanced through the U.S. Senate with markup sessions underway.
The legislation is not yet law but is a central component of a broader push in Congress to modernize regulatory frameworks for the digital economy.
3. Core Concept: Functional Asset Classification
One of the CLARITY Act’s key innovations is how it classifies digital assets based on real-world attributes, including the degree of decentralization and how the asset functions in practice. Instead of relying on the Howey Test alone, the Act introduces new statutory definitions that align more closely with the technical and economic realities of blockchain systems.
Primary Categories
Under the CLARITY Act, digital assets are divided into three main buckets:
Digital Commodities
Assets whose value derives from or is reasonably expected to derive from use of a decentralized blockchain.
2. Restricted Digital Assets
Assets similar to investment contracts or not sufficiently decentralized; these remain within the SEC’s authority under securities laws.
3. Stablecoins
Pegged assets like USD-backed tokens; while covered under the independent GENIUS Act of 2025, stablecoins still intersect with the CLARITY Act’s objectives in legal certainty and oversight.
These new, technology-informed definitions aim to simplify legal determinations and reduce litigation risks for issuers, exchanges, and institutional participants.
4. Dividing Regulatory Authority: SEC vs. CFTC
Perhaps the most impactful element of the CLARITY Act is how it proposes to allocate regulatory jurisdiction between the SEC and CFTC based on clear asset categories.
CFTC’s Expanded Role
Under the Act, the CFTC would assume exclusive jurisdiction over digital commodities, giving it authority over:
Spot markets and exchanges trading digital commodities
Digital commodity brokers and dealers
Custody and trading infrastructure for digital commodities
This applies even to cash-market trading activities — something the CFTC has historically lacked clear statutory authority to regulate.
This expanded role is intended to consolidate regulatory responsibility for assets like Bitcoin and Ethereum, reducing regulatory ambiguity and encouraging robust, regulated market infrastructure.
SEC’s Continued Oversight
The SEC would maintain authority over:
Restricted Digital Assets (assets that function as securities)
Activities tied to primary-market issuance and capital formation
Broker-dealers, alternative trading systems, and clearing agencies dealing with security-like assets
Under this split, regulated entities must comply with registration, disclosure, and compliance obligations that correspond with the classification of the assets they handle.
5. Key Provisions and Mechanics of the Act
Digital Commodity Definition and Certification
The CLARITY Act defines a Digital Commodity as an asset whose value is intrinsically linked to a blockchain system, provided the blockchain is sufficiently decentralized. Issuers may self-certify or seek formal determination from regulators about their classification.
To qualify as a digital commodity and fall under CFTC jurisdiction, an asset must operate on a decentralized system where no person or group can unilaterally control protocol governance.
Mature Blockchain System Pathway
The Act introduces a concept called Mature Blockchain System, defined as a blockchain not controlled by any person or group. Assets tied to such systems may enjoy certain regulatory benefits and exemptions, including a tailored registration regime with the CFTC for offerings of up to $75 million per year without triggering full securities registration requirements.
Registration and Compliance Rules
Entities operating digital commodity markets, including exchanges, brokers, and dealers, must register with the CFTC and implement:
For restricted digital assets, similar compliance and registration requirements apply to entities operating under SEC oversight.
6. How the CLARITY Act Interacts With Other Legislation
The digital asset regulatory framework of 2025 encompasses multiple pieces of legislation — each targeting different segments of the market:
GENIUS Act
The GENIUS Act (Guiding and Establishing National Innovation for U.S. Stablecoins Act) was signed into law in July 2025. It focuses on stablecoin issuance standards, requiring backing with high-quality collateral such as U.S. dollars or treasuries.
The CLARITY Act complements the GENIUS Act by addressing all non-stablecoin digital assets, including how they should be classified and regulated.
Anti-CBDC and Other Bills
Other legislative efforts like the Anti-CBDC Act run parallel to the CLARITY Act and GENIUS Act, shaping a broader architecture for digital innovation.
7. Potential Market and Economic Impact
Regulatory Certainty
One of the most consistent criticisms of the current U.S. regulatory environment for crypto has been uncertainty — whether an asset is a security, who has jurisdiction, and which rules apply. The CLARITY Act aims to remove these ambiguities and provide a clearly defined framework for market participants and investors.
Institutional Participation
By clarifying legal treatment and regulatory boundaries, proponents argue the Act could unlock broader participation from banks, asset managers, and institutional liquidity providers who have avoided the space due to legal risk.
Innovation and Global Competitiveness
Supporters believe the Act will help the U.S. retain global leadership in digital asset innovation, particularly compared to regions like the EU (with MiCA — Markets in Crypto-Assets Regulation) and other forward-looking jurisdictions.
Market Pricing and Adoption Trends
Industry voices, including analysts like Bitwise CIO Matt Hougan, suggest that the existence and progress of the CLARITY Act could trigger improved market sentiment and confidence, potentially ending long crypto “bear markets” by reducing regulatory drag and increasing institutional inflows.
8. Challenges, Criticisms, and Risks
While many in the industry applaud the CLARITY Act, it has also garnered criticism on several fronts:
Regulatory Gaps and AML Concerns
Security and transparency organizations have warned that without robust AML enforcement — particularly for decentralized finance and peer-to-peer platforms — there may be loopholes that bad actors could exploit for illicit finance, sanctions evasion, or money laundering.
Implementation Complexity
Crafting clear technical standards for decentralization, maturity, and governance — and then translating those into enforceable regulatory requirements — presents real challenges for regulators and industry alike.
Potential for Double-Registration Burdens
Entities operating across asset categories may face complex dual registration and compliance obligations with both the SEC and CFTC, though the Act attempts to coordinate these requirements to avoid duplicative regulation.
9. Global Implications
Although the CLARITY Act is a U.S. law, its impact will extend beyond national borders. As the United States is one of the largest financial markets in the world, a clear and stable regulatory framework for digital assets would influence:
International regulatory harmonization
Global capital flows into crypto markets
Cross-border compliance standards
Competitive positions of other jurisdictions seeking innovation leadership
10. Where It Stands Now and What’s Next
As of early 2026:
The CLARITY Act has passed the U.S. House with bipartisan support.
It is undergoing Senate review and markup sessions in key committees.
Key regulatory players like the SEC and CFTC are collaborating under broader crypto policy initiatives to operationalize frameworks that could align with CLARITY Act goals.
The final text may be amended before becoming law, and its ultimate scope will depend on legislative negotiations, regulator rulemaking, and industry engagement.
Conclusion
The CLARITY Act represents a defining moment for U.S. crypto policy and digital financial innovation. By moving beyond outdated legal tests and creating a functional, technology-aligned regulatory scheme, it marks a bold attempt to bring legal certainty to a market sorely in need of it. If enacted and efficiently implemented, it could unlock institutional capital, accelerate adoption, and position the United States as a global leader in the emerging digital economy.
At the same time, challenges remain — from AML enforcement to classification complexity and coordination between agencies. The Act’s ultimate legacy will depend not just on its passage, but on how regulators, lawmakers, and industry participants work together in the years ahead to translate legislative intent into workable, effective oversight.