โŒ

Reading view

There are new articles available, click to refresh the page.

Dogecoin (DOGE) Positive Indicators Emerge, But Recovery Still Fragile

Dogecoin started a recovery wave above the $0.120 zone against the US Dollar. DOGE is now facing hurdles near $0.1280 and might struggle to continue higher.

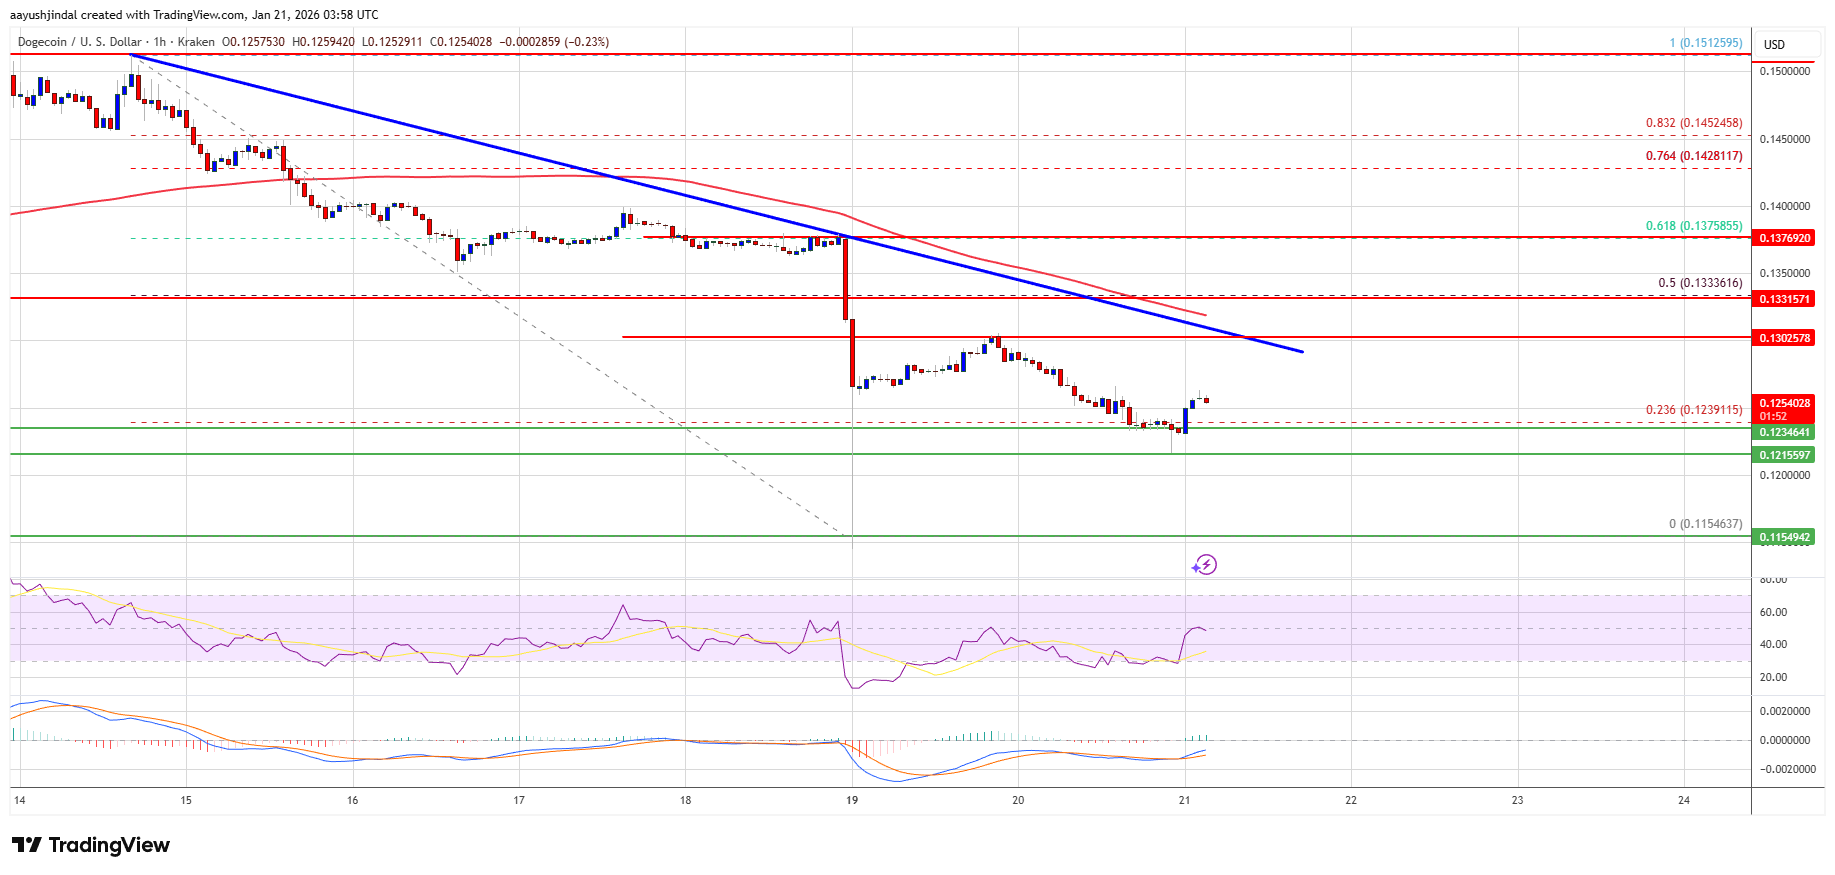
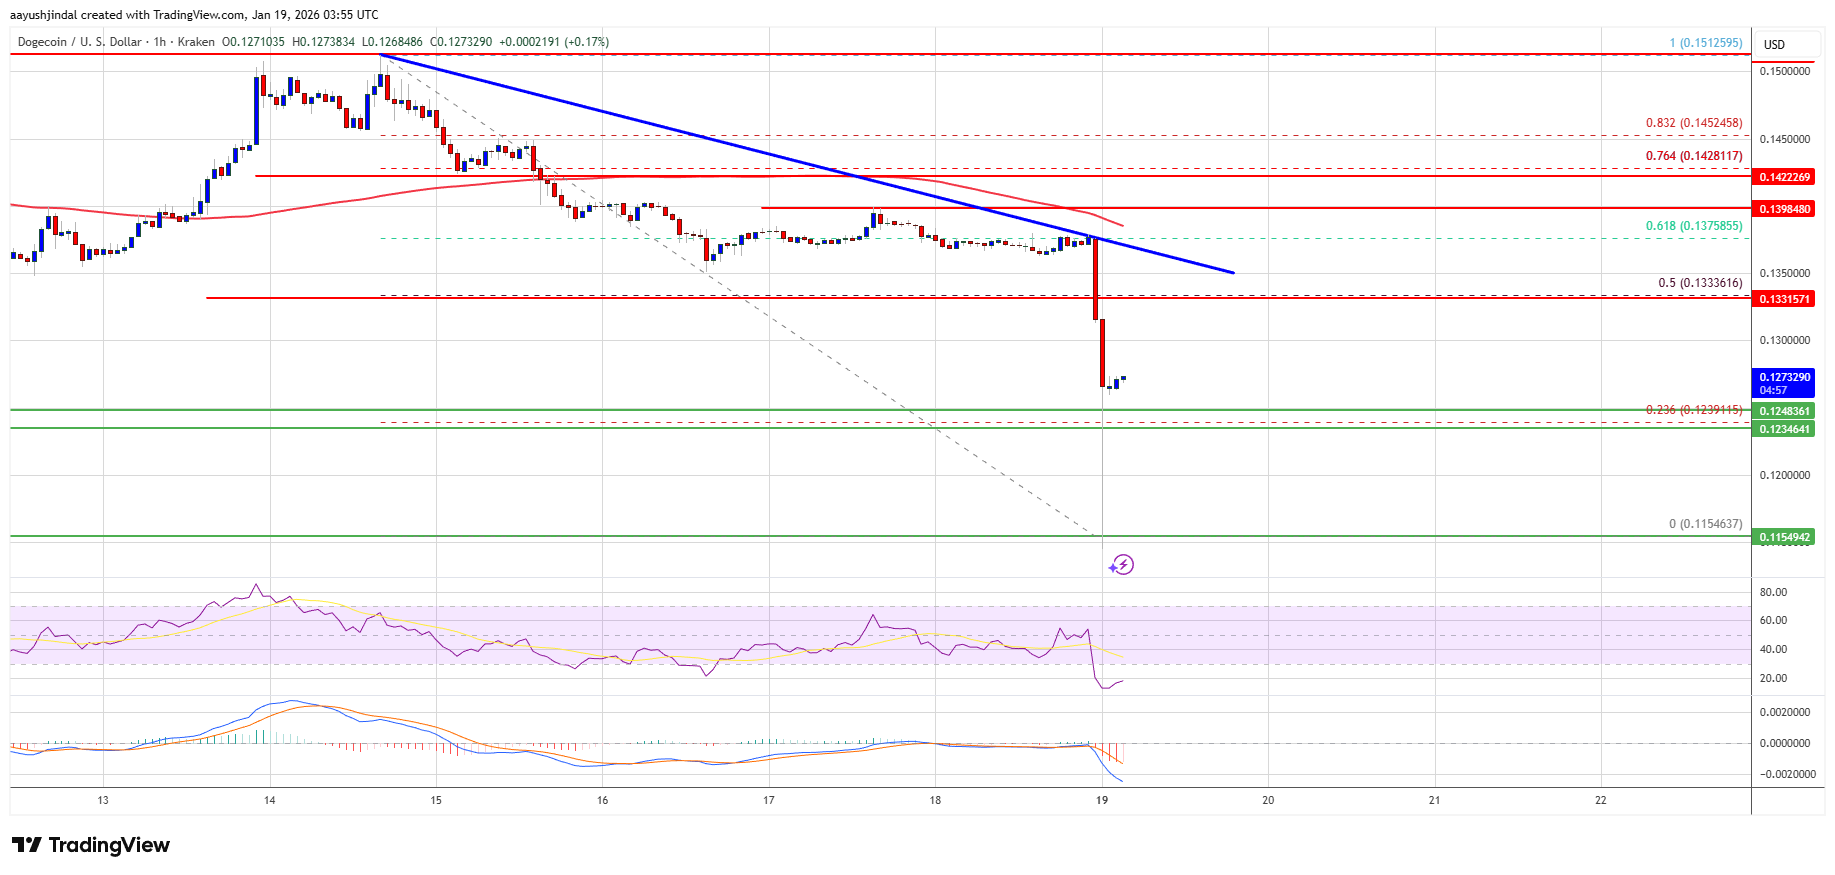
  • DOGE price started a recovery wave from $0.1150 and climbed above $0.120.
  • The price is trading below the $0.130 level and the 100-hourly simple moving average.
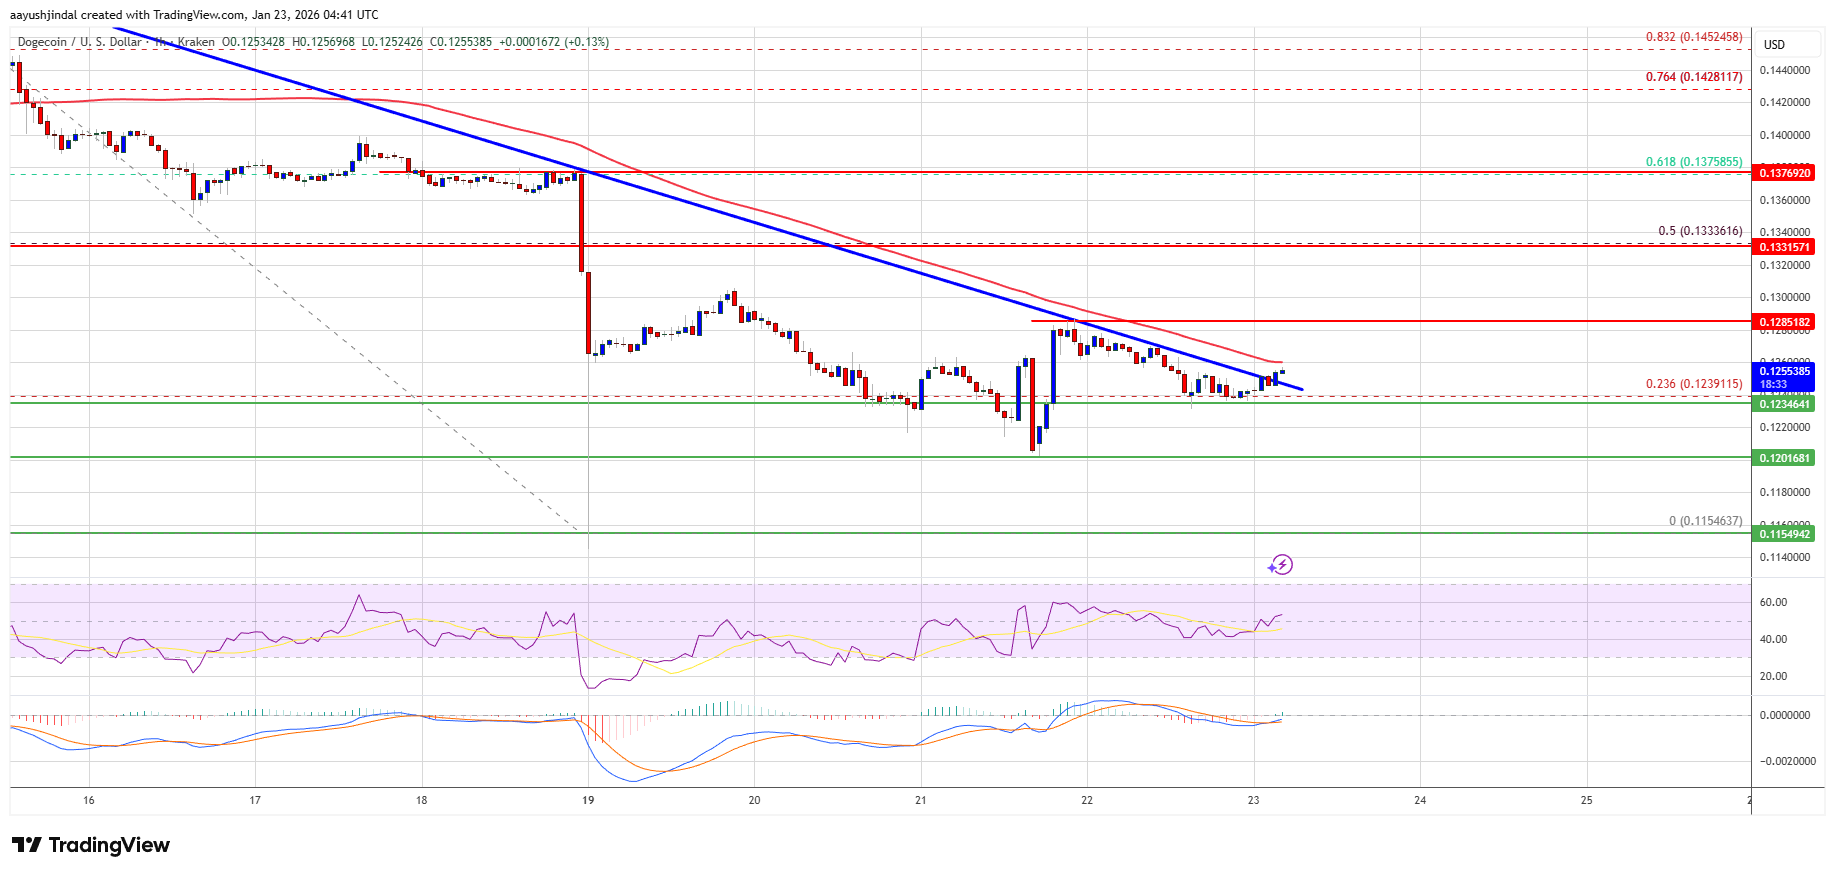
  • There was a break above a key bearish trend line with resistance at $0.1240 on the hourly chart of the DOGE/USD pair (data source from Kraken).
  • The price could continue to move up if it stays above $0.120.

Dogecoin Price Faces Resistance

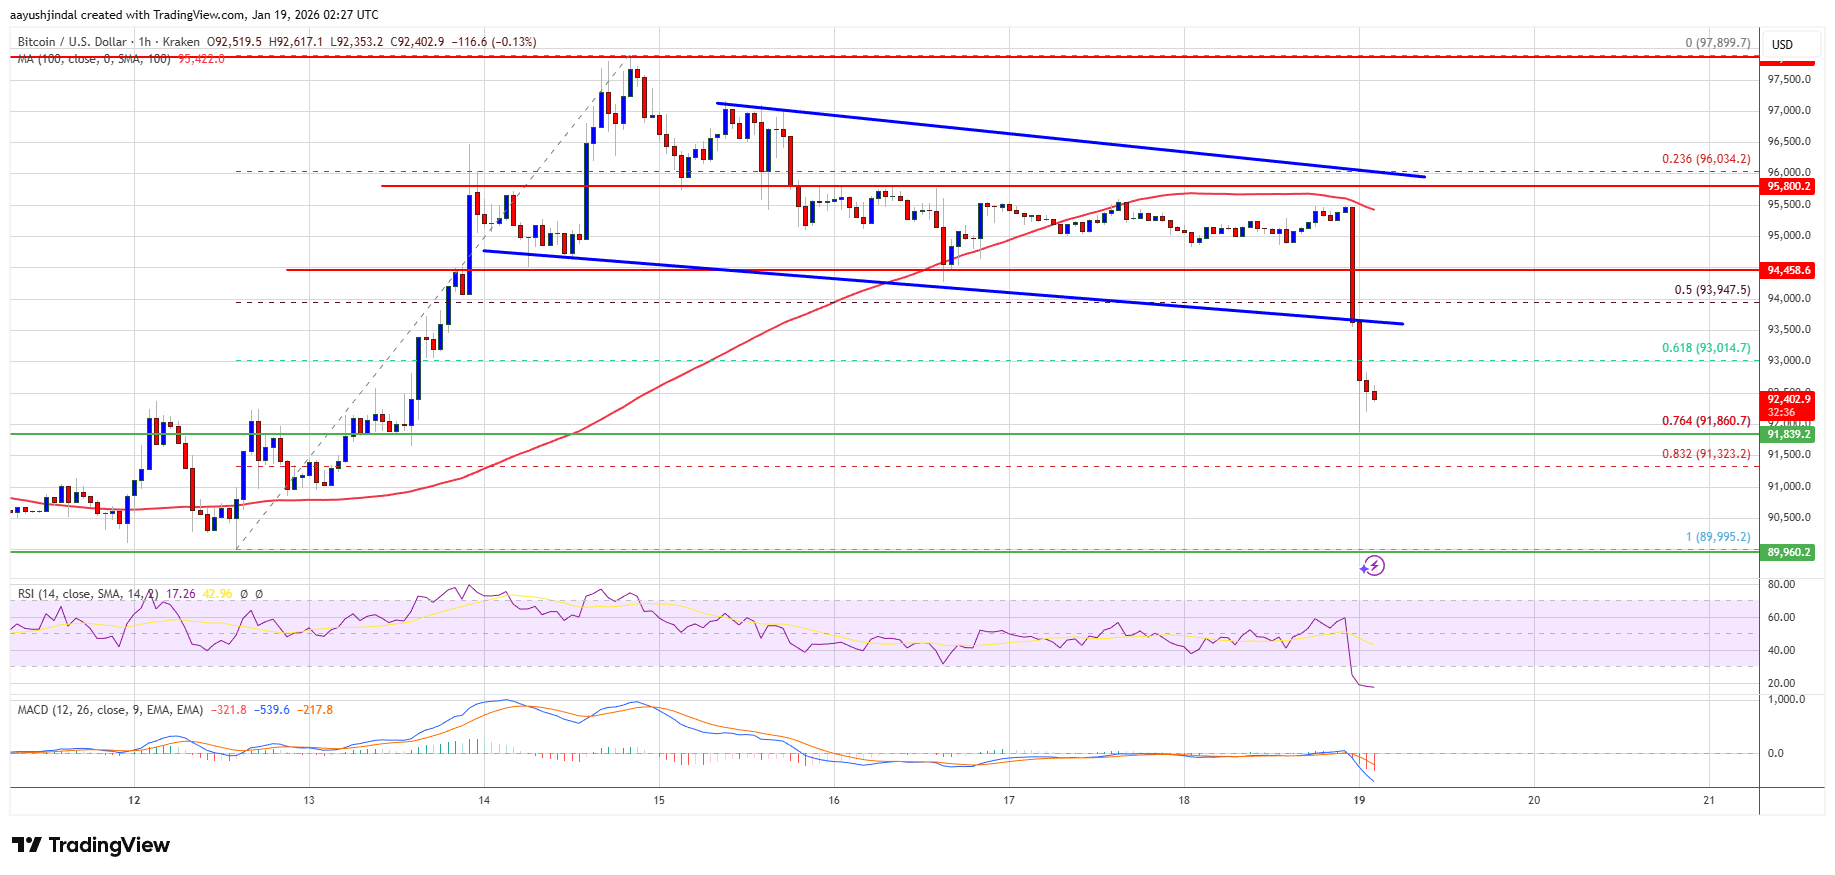
Dogecoin price started a recovery wave from the $0.1150 zone, like Bitcoin and Ethereum. DOGE climbed above the $0.1180 and $0.120 resistance levels.

There was a decent upward move above the 23.6% Fib retracement level of the downward move from the $0.1512 swing high to the $0.1154 low. Besides, there was a break above a key bearish trend line with resistance at $0.1240 on the hourly chart of the DOGE/USD pair.

Dogecoin price is now trading below the $0.130 level and the 100-hourly simple moving average. If there is a recovery wave, immediate resistance on the upside is near the $0.1260 level. The first major resistance for the bulls could be near the $0.1285 level.

Dogecoin Price

The next major resistance is near the $0.1330 level and the 50% Fib retracement level of the downward move from the $0.1512 swing high to the $0.1154 low. A close above the $0.1330 resistance might send the price toward the $0.1420 resistance. Any more gains might send the price toward the $0.150 level. The next major stop for the bulls might be $0.1550.

Another Decline In DOGE?

If DOGEโ€™s price fails to climb above the $0.1280 level, it could continue to move down. Initial support on the downside is near the $0.1230 level. The next major support is near the $0.120 level.

The main support sits at $0.1150. If there is a downside break below the $0.1150 support, the price could decline further. In the stated case, the price might slide toward the $0.1080 level or even $0.1050 in the near term.

Technical Indicators

Hourly MACD โ€“ The MACD for DOGE/USD is now losing momentum in the bearish zone.

Hourly RSI (Relative Strength Index) โ€“ The RSI for DOGE/USD is now above the 50 level.

Major Support Levels โ€“ $0.1200 and $0.1150.

Major Resistance Levels โ€“ $0.1280 and $0.1330.

XRP Price Signals Trouble As Bears Prepare Another Push Lower

XRP price extended losses and traded below $1.920. The price is now consolidating and might decline further if it remains below $1.980.

  • XRP price started a fresh decline below the $1.920 zone.
  • The price is now trading below $1.9250 and the 100-hourly Simple Moving Average.
  • There are two bearish trend lines forming with resistance at $1.95 and $2.00 on the hourly chart of the XRP/USD pair (data source from Kraken).
  • The pair could continue to move down if it stays below $1.950.

XRP Price Dips Again

XRP price failed to stay above $2.00 and started a fresh decline, like Bitcoin and Ethereum. The price declined below $1.950 and $1.9350 to enter a short-term bearish zone.

The price even spiked below $1.920. A low was formed at $1.90, and the price is now consolidating losses. There was a recovery wave above $1.9120. The price cleared the 23.6% Fib retracement level of the downward move from the $1.987 swing high to the $1.90 low, but the bears remained active.

The price is now trading below $1.950 and the 100-hourly Simple Moving Average. If there is a fresh upward move, the price might face resistance near the $1.9450 level and the 50% Fib retracement level of the downward move from the $1.987 swing high to the $1.90 low. There are also two bearish trend lines forming with resistance at $1.95 and $2.00 on the hourly chart of the XRP/USD pair.

XRP Price

The first major resistance is near the $2.00 level and the second trend line. A close above $2.00 could send the price to $2.050. The next hurdle sits at $2.10. A clear move above the $2.10 resistance might send the price toward the $2.120 resistance. Any more gains might send the price toward the $2.150 resistance. The next major hurdle for the bulls might be near $2.20.

Downside Break?

If XRP fails to clear the $1.95 resistance zone, it could start a fresh decline. Initial support on the downside is near the $1.90 level. The next major support is near the $1.870 level.

If there is a downside break and a close below the $1.870 level, the price might continue to decline toward $1.8480. The next major support sits near the $1.820 zone, below which the price could continue lower toward $1.7880.

Technical Indicators

Hourly MACD โ€“ The MACD for XRP/USD is now gaining pace in the bearish zone.

Hourly RSI (Relative Strength Index) โ€“ The RSI for XRP/USD is now below the 50 level.

Major Support Levels โ€“ $1.90 and $1.870.

Major Resistance Levels โ€“ $1.950 and $2.00.

Ethereum Bulls Must Conquer $3,050 Or Momentum Quickly Fades

Ethereum price started a minor recovery wave from the $2,865 zone. ETH is now consolidating losses and might aim for a recovery if it clears $3,050.

  • Ethereum started a consolidation phase below $3,050.
  • The price is trading below $3,040 and the 100-hourly Simple Moving Average.
  • There was a break above a contracting triangle with resistance at $2,950 on the hourly chart of ETH/USD (data feed via Kraken).
  • The pair could start a fresh increase if it stays above the $2,900 zone.

Ethereum Price Aims Recovery

Ethereum price failed to remain stable above $3,050 and extended losses, like Bitcoin. ETH price declined below $3,000 and $2,920 to enter a bearish zone.

The bears even pushed the price below $2,880. The price finally tested $2,865 and is currently consolidating losses. There was a minor upside above the 23.6% Fib retracement level of the downward wave from the $3,365 swing high to the $2,865 swing low.

Besides, there was a break above a contracting triangle with resistance at $2,950 on the hourly chart of ETH/USD. Ethereum price is now trading below $3,040 and the 100-hourly Simple Moving Average. If the bulls can protect more losses below $2,900, the price could attempt another increase.

Immediate resistance is seen near the $3,050 level. The first key resistance is near the $3,110 level or the 50% Fib retracement level of the downward wave from the $3,365 swing high to the $2,865 swing low. The next major resistance is near the $3,175 level. A clear move above the $3,175 resistance might send the price toward the $3,220 resistance.

Ethereum Price

An upside break above the $3,220 region might call for more gains in the coming days. In the stated case, Ether could rise toward the $3,280 resistance zone or even $3,300 in the near term.

Another Drop In ETH?

If Ethereum fails to clear the $3,050 resistance, it could start a fresh decline. Initial support on the downside is near the $2,910 level. The first major support sits near the $2,880 zone.

A clear move below the $2,880 support might push the price toward the $2,865 support. Any more losses might send the price toward the $2,820 region. The main support could be $2,750.

Technical Indicators

Hourly MACD โ€“ The MACD for ETH/USD is losing momentum in the bearish zone.

Hourly RSI โ€“ The RSI for ETH/USD is now above the 50 zone.

Major Support Level โ€“ $2,880

Major Resistance Level โ€“ $3,050

Bitcoin Price Stability Sparks Recovery Hopes, But Hurdles Loom

Bitcoin price started a consolidation phase below $90,500. BTC is consolidating losses and might attempt a recovery wave if it clears $91,500.

  • Bitcoin started a minor recovery wave from the $87,200 level.
  • The price is trading below $90,500 and the 100 hourly Simple moving average.
  • There was a break above a short-term bearish trend line with resistance at $89,700 on the hourly chart of the BTC/USD pair (data feed from Kraken).
  • The pair might recover if it manages to settle above $90,500 and $91,500.

Bitcoin Price Eyes Recovery

Bitcoin price failed to stay above the $90,000 support and extended losses. BTC declined sharply below the $89,500 and $88,000 support levels.

The bears even pushed the price below $87,500. A low was formed at $87,200, and the price is now attempting a recovery wave. There was a move above the 23.6% Fib retracement level of the downward move from the $95,475 swing high to the $87,200 low.

Besides, there was a break above a short-term bearish trend line with resistance at $89,700 on the hourly chart of the BTC/USD pair. Bitcoin is now trading below $90,500 and the 100 hourly Simple moving average.

If the price remains stable above $89,000, it could attempt a fresh increase. Immediate resistance is near the $90,300 level. The first key resistance is near the $91,500 level since it is close to the 50% Fib retracement level of the downward move from the $95,475 swing high to the $87,200 low.

Bitcoin Price

A close above the $91,500 resistance might send the price further higher. In the stated case, the price could rise and test the $92,300 resistance. Any more gains might send the price toward the $93,000 level. The next barrier for the bulls could be $95,000 and $95,500.

Another Drop In BTC?

If Bitcoin fails to rise above the $91,500 resistance zone, it could start another decline. Immediate support is near the $89,000 level. The first major support is near the $88,200 level.

The next support is now near the $87,500 zone. Any more losses might send the price toward the $86,500 support in the near term. The main support sits at $85,500, below which BTC might accelerate lower in the near term.

Technical indicators:

Hourly MACD โ€“ The MACD is now losing pace in the bearish zone.

Hourly RSI (Relative Strength Index) โ€“ The RSI for BTC/USD is now above the 50 level.

Major Support Levels โ€“ $89,000, followed by $88,200.

Major Resistance Levels โ€“ $90,300 and $91,500.

Solana (SOL) Recovery At Risk With Bears Guarding Resistance

Solana failed to settle above $140 and nosedived. SOL price is now consolidating losses below $135 and might struggle to start a recovery wave.

  • SOL price started a fresh decline below $136 and $135 against the US Dollar.
  • The price is now trading below $135 and the 100-hourly simple moving average.
  • There is a key bearish trend line forming with resistance at $138 on the hourly chart of the SOL/USD pair (data source from Kraken).
  • The price could start a recovery wave if the bulls defend $128 or $125.

Solana Price Dips Further

Solana price failed to remain stable above $140 and started a fresh decline, like Bitcoin and Ethereum. SOL declined below the $138 and $135 support levels.

The price gained bearish momentum below $132. A low was formed at $124, and the price is now consolidating losses. The price recovered a few points and climbed above the 23.6% Fib retracement level of the downward move from the $143 swing high to the $124 low.

Solana is now trading below $135 and the 100-hourly simple moving average. On the upside, immediate resistance is near the $134 level or the 50% Fib retracement level of the downward move from the $143 swing high to the $124 low.

Solana Price

The next major resistance is near the $136 level. The main resistance could be $138. There is also a key bearish trend line forming with resistance at $138 on the hourly chart of the SOL/USD pair. A successful close above the $138 resistance zone could set the pace for another steady increase. The next key resistance is $144. Any more gains might send the price toward the $150 level.

Another Decline In SOL?

If SOL fails to rise above the $133 resistance, it could continue to move down. Initial support on the downside is near the $129 zone. The first major support is near the $125 level.

A break below the $125 level might send the price toward the $120 support zone. If there is a close below the $120 support, the price could decline toward the $112 support in the near term.

Technical Indicators

Hourly MACD โ€“ The MACD for SOL/USD is losing pace in the bearish zone.

Hourly Hours RSI (Relative Strength Index) โ€“ The RSI for SOL/USD is above the 50 level.

Major Support Levels โ€“ $129 and $125.

Major Resistance Levels โ€“ $133 and $138.

XRP Price Recovery Meets Strong Resistance, Upside Under Threat

XRP price started a recovery wave above $1.950 but failed near $2.00. The price is now showing a few bearish signs and might decline below $1.920.

  • XRP price started a recovery wave above the $1.950 zone.
  • The price is now trading below $2.00 and the 100-hourly Simple Moving Average.
  • There is a bearish trend line forming with resistance at $2.00 on the hourly chart of the XRP/USD pair (data source from Kraken).
  • The pair could continue to move down if it settles below $1.920.

XRP Price Faces Key Hurdle

XRP price remained supported above $1.8650 and started a recovery wave, like Bitcoin and Ethereum. The price was able to climb above $1.90 and $1.920 to enter a short-term positive zone.

There was also a move above the 50% Fib retracement level of the downward move from the $2.028 swing high to the $1.868 low. The price even spiked above $1.980 before the bears appeared. The bulls failed to clear the $2.00 resistance. There is also a bearish trend line forming with resistance at $2.00 on the hourly chart of the XRP/USD pair.

The price is now trading below $2.00 and the 100-hourly Simple Moving Average. If there is a fresh upward move, the price might face resistance near the $1.990 level or the 76.4% Fib retracement level of the downward move from the $2.028 swing high to the $1.868 low.

XRP Price

The first major resistance is near the $2.00 level. A close above $2.00 could send the price to $2.0650. The next hurdle sits at $2.10. A clear move above the $2.10 resistance might send the price toward the $2.150 resistance. Any more gains might send the price toward the $2.20 resistance. The next major hurdle for the bulls might be near $2.250.

Another Drop?

If XRP fails to clear the $2.00 resistance zone, it could start a fresh decline. Initial support on the downside is near the $1.920 level. The next major support is near the $1.90 level.

If there is a downside break and a close below the $1.90 level, the price might continue to decline toward $1.8650. The next major support sits near the $1.820 zone, below which the price could continue lower toward $1.750.

Technical Indicators

Hourly MACD โ€“ The MACD for XRP/USD is now losing pace in the bullish zone.

Hourly RSI (Relative Strength Index) โ€“ The RSI for XRP/USD is now above the 50 level.

Major Support Levels โ€“ $1.920 and $1.90.

Major Resistance Levels โ€“ $2.00 and $2.065.

Ethereum Price Attempts Bounce While $3,000 Separates Bulls And Bears

Ethereum price started a fresh decline from the $3,000 resistance. ETH is now consolidating losses and might aim for a recovery if it clears $3,120.

  • Ethereum started another decline and traded below $2,920.
  • The price is trading below $3,050 and the 100-hourly Simple Moving Average.
  • There was a break above a key bearish trend line with resistance at $3,000 on the hourly chart of ETH/USD (data feed via Kraken).
  • The pair could start a fresh increase if it stays above the $2,900 zone.

Ethereum Price Attempts Recovery

Ethereum price failed to remain stable above $3,050 and started a fresh decline, like Bitcoin. ETH price declined below $3,020 and $3,000 to enter a bearish zone.

The bears even pushed the price below $2,920. The price finally tested $2,865 and is currently consolidating losses. There was a minor upside above the 23.6% Fib retracement level of the recent downward move from the $3,366 swing high to the $2,865 swing low. Besides, there was a break above a key bearish trend line with resistance at $3,000 on the hourly chart of ETH/USD.

Ethereum price is now trading below $3,050 and the 100-hourly Simple Moving Average. If the bulls can protect more losses below $2,900, the price could attempt another increase.

Immediate resistance is seen near the $3,065 level. The first key resistance is near the $3,100 level. The next major resistance is near the $3,120 level and the 50% Fib retracement level of the recent downward move from the $3,366 swing high to the $2,865 swing low. A clear move above the $3,120 resistance might send the price toward the $3,175 resistance.

Ethereum Price

An upside break above the $3,175 region might call for more gains in the coming days. In the stated case, Ether could rise toward the $3,220 resistance zone or even $3,300 in the near term.

Another Decline In ETH?

If Ethereum fails to clear the $3,065 resistance, it could start a fresh decline. Initial support on the downside is near the $2,980 level. The first major support sits near the $2,900 zone.

A clear move below the $2,900 support might push the price toward the $2,840 support. Any more losses might send the price toward the $2,780 region. The main support could be $2,720.

Technical Indicators

Hourly MACD โ€“ The MACD for ETH/USD is losing momentum in the bearish zone.

Hourly RSI โ€“ The RSI for ETH/USD is now above the 50 zone.

Major Support Level โ€“ $2,900

Major Resistance Level โ€“ $3,065

Bitcoin Price Defends Support As Traders Question Next Upside Push

Bitcoin price started a fresh decline below $89,500. BTC is consolidating losses and might attempt a recovery wave if it clears $92,000.

  • Bitcoin started another drop below $90,000 and $89,000.
  • The price is trading below $90,500 and the 100 hourly Simple moving average.
  • There are two bearish trend lines forming with resistance at $90,300 and $93,000 on the hourly chart of the BTC/USD pair (data feed from Kraken).
  • The pair might continue to move down if it stays below the $92,000 zone.

Bitcoin Price Dips To New Weekly Lows

Bitcoin price failed to stay above the $91,000 support and started a fresh decline. BTC declined sharply below the $90,000 and $89,500 support levels.

The bears even pushed the price below $88,000. A low was formed at $87,200, and the price is now consolidating losses. There was a minor recovery wave above $89,200 and the 23.6% Fib retracement level of the recent decline from the $95,475 swing high to the $87,200 low.

Bitcoin is now trading below $90,500 and the 100 hourly Simple moving average. If the price remains stable above $88,000, it could attempt a fresh increase. Immediate resistance is near the $90,500 level. Besides, there are two bearish trend lines forming with resistance at $90,300 and $93,000 on the hourly chart of the BTC/USD pair.

Bitcoin Price

The first key resistance is near the $91,000 level. The next resistance could be $91,350 or the 50% Fib retracement level of the recent decline from the $95,475 swing high to the $87,200 low. A close above the $91,350 resistance might send the price further higher. In the stated case, the price could rise and test the $93,000 resistance. Any more gains might send the price toward the $94,000 level. The next barrier for the bulls could be $95,000 and $95,500.

Another Decline In BTC?

If Bitcoin fails to rise above the $91,350 resistance zone, it could start another decline. Immediate support is near the $89,150 level. The first major support is near the $88,000 level.

The next support is now near the $87,200 zone. Any more losses might send the price toward the $86,500 support in the near term. The main support sits at $85,500, below which BTC might accelerate lower in the near term.

Technical indicators:

Hourly MACD โ€“ The MACD is now losing pace in the bearish zone.

Hourly RSI (Relative Strength Index) โ€“ The RSI for BTC/USD is now above the 50 level.

Major Support Levels โ€“ $89,150, followed by $88,000.

Major Resistance Levels โ€“ $91,350 and $92,000.

Dogecoin (DOGE) Rebound Looks Fragile With Multiple Hurdles Ahead

Dogecoin started a fresh decline below the $0.1280 zone against the US Dollar. DOGE is now consolidating losses and might face hurdles near $0.130.

  • DOGE price started a fresh decline below the $0.120 level.
  • The price is trading below the $0.1280 level and the 100-hourly simple moving average.
  • There is a key bearish trend line forming with resistance at $0.130 on the hourly chart of the DOGE/USD pair (data source from Kraken).
  • The price could extend losses if it stays below $0.1300 and $0.1320.

Dogecoin Price Dives Below Support

Dogecoin price started a fresh decline after it closed below $0.1320, like Bitcoin and Ethereum. DOGE declined below the $0.1280 and $0.1220 support levels.

The price even traded below $0.1180. A low was formed near $0.1155, and the price is now showing bearish signs. There was a recovery wave above $0.120. The price climbed above the 23.6% Fib retracement level of the downward move from the $0.1512 swing high to the $0.1155 low.

Dogecoin price is now trading below the $0.1280 level and the 100-hourly simple moving average. If there is a recovery wave, immediate resistance on the upside is near the $0.1280 level.

The first major resistance for the bulls could be near the $0.130 level and the trend line. The next major resistance is near the $0.1330 level or the 50% Fib retracement level of the downward move from the $0.1512 swing high to the $0.1155 low.

Dogecoin Price

A close above the $0.1330 resistance might send the price toward the $0.1375 resistance. Any more gains might send the price toward the $0.140 level. The next major stop for the bulls might be $0.1420.

Another Decline In DOGE?

If DOGEโ€™s price fails to climb above the $0.1300 level, it could continue to move down. Initial support on the downside is near the $0.1215 level. The next major support is near the $0.120 level.

The main support sits at $0.1150. If there is a downside break below the $0.1150 support, the price could decline further. In the stated case, the price might slide toward the $0.1120 level or even $0.1050 in the near term.

Technical Indicators

Hourly MACD โ€“ The MACD for DOGE/USD is now losing momentum in the bearish zone.

Hourly RSI (Relative Strength Index) โ€“ The RSI for DOGE/USD is now below the 50 level.

Major Support Levels โ€“ $0.1215 and $0.1200.

Major Resistance Levels โ€“ $0.1300 and $0.1330.

XRP Price Under Pressure As Bears Control The Trend

XRP price extended losses and traded below $1.950. The price is now consolidating and might decline further if it remains below $2.00.

  • XRP price started a fresh decline below the $1.950 zone.
  • The price is now trading below $1.9350 and the 100-hourly Simple Moving Average.
  • There is a bearish trend line forming with resistance at $2.00 on the hourly chart of the XRP/USD pair (data source from Kraken).
  • The pair could continue to move down if it stays below $2.00.

XRP Price Dips Sharply

XRP price failed to stay above $2.050 and started a fresh decline, like Bitcoin and Ethereum. The price declined below $2.00 and $1.950 to enter a short-term bearish zone.

The price even spiked below $1.880. A low was formed at $1.8681, and the price is now consolidating losses. There was a recovery wave above $1.90. The price even tested the 23.6% Fib retracement level of the downward move from the $2.028 swing high to the $1.8681 low, but the bears remained active.

The price is now trading below $1.920 and the 100-hourly Simple Moving Average. If there is a fresh upward move, the price might face resistance near the $1.950 level and the 50% Fib retracement level of the downward move from the $2.028 swing high to the $1.8681 low.

XRP Price

The first major resistance is near the $2.00 level and the trend line. A close above $2.00 could send the price to $2.050. The next hurdle sits at $2.10. A clear move above the $2.10 resistance might send the price toward the $2.120 resistance. Any more gains might send the price toward the $2.150 resistance. The next major hurdle for the bulls might be near $2.20.

More Losses?

If XRP fails to clear the $1.95 resistance zone, it could start a fresh decline. Initial support on the downside is near the $1.880 level. The next major support is near the $1.850 level.

If there is a downside break and a close below the $1.850 level, the price might continue to decline toward $1.820. The next major support sits near the $1.80 zone, below which the price could continue lower toward $1.7650.

Technical Indicators

Hourly MACD โ€“ The MACD for XRP/USD is now gaining pace in the bearish zone.

Hourly RSI (Relative Strength Index) โ€“ The RSI for XRP/USD is now below the 50 level.

Major Support Levels โ€“ $1.880 and $1.850.

Major Resistance Levels โ€“ $1.950 and $2.00.

Ethereum Price Breaks Under $3K, Charts Flash Fresh Warnings

Ethereum price started a fresh decline from the $3,200 resistance. ETH is now consolidating losses and is at risk of more losses below $2,880.

  • Ethereum started a sharp downside correction below $3,000.
  • The price is trading below $3,000 and the 100-hourly Simple Moving Average.
  • There is a key bearish trend line forming with resistance at $3,020 on the hourly chart of ETH/USD (data feed via Kraken).
  • The pair could start a fresh increase if it stays above the $2,880 zone.

Ethereum Price Dips Over 5%

Ethereum price failed to remain stable above $3,200 and started a fresh decline, like Bitcoin. ETH price declined below $3,150 and $3,120 to enter a bearish zone.

The bears even pushed the price below $3,000. The price finally tested $2,910 and is currently consolidating losses below the 23.6% Fib retracement level of the recent downward move from the $3,367 swing high to the $2,910 swing low. There is also a key bearish trend line forming with resistance at $3,020 on the hourly chart of ETH/USD.

Ethereum price is now trading below $3,000 and the 100-hourly Simple Moving Average. If the bulls can protect more losses below $2,880, the price could attempt another increase.

Immediate resistance is seen near the $3,020 level. The first key resistance is near the $3,080 level. The next major resistance is near the $3,120 level. A clear move above the $3,120 resistance might send the price toward the $3,150 resistance or the 50% Fib retracement level of the recent downward move from the $3,367 swing high to the $2,910 swing low.

Ethereum Price

An upside break above the $3,150 region might call for more gains in the coming days. In the stated case, Ether could rise toward the $3,220 resistance zone or even $3,300 in the near term.

Downside Continuation In ETH?

If Ethereum fails to clear the $3,020 resistance, it could start a fresh decline. Initial support on the downside is near the $2,920 level. The first major support sits near the $2,880 zone.

A clear move below the $2,880 support might push the price toward the $2,800 support. Any more losses might send the price toward the $2,750 region. The main support could be $2,650.

Technical Indicators

Hourly MACD โ€“ The MACD for ETH/USD is gaining momentum in the bearish zone.

Hourly RSI โ€“ The RSI for ETH/USD is now below the 50 zone.

Major Support Level โ€“ $2,880

Major Resistance Level โ€“ $3,020

Bitcoin Price Loses $90K, Traders Brace for a Volatile Next Move

Bitcoin price started a fresh decline below $90,000. BTC is consolidating losses and remains at risk of more losses if it dips below $88,000.

  • Bitcoin started a sharp decline below $92,000 and $90,000.
  • The price is trading below $90,000 and the 100 hourly Simple moving average.
  • There is a bearish trend line forming with resistance at $94,200 on the hourly chart of the BTC/USD pair (data feed from Kraken).
  • The pair might continue to move down if it stays below the $92,000 zone.

Bitcoin Price Dips 5%

Bitcoin price failed to stay above the $92,500 support and started a fresh decline. BTC declined sharply below the $91,000 and $90,500 support levels.

The bears even pushed the price below $90,000. A low was formed at $87,784, and the price is now consolidating losses. There was a minor recovery wave above $88,500, but the price stayed below the 23.6% Fib retracement level of the recent decline from the $95,475 swing high to the $87,784 low.

Bitcoin is now trading below $90,000 and the 100 hourly Simple moving average. If the price remains stable above $88,000, it could attempt a fresh increase. Immediate resistance is near the $89,600 level. The first key resistance is near the $90,000 level.

The next resistance could be $91,650 or the 50% Fib retracement level of the recent decline from the $95,475 swing high to the $87,784 low. A close above the $91,650 resistance might send the price further higher. In the stated case, the price could rise and test the $92,000 resistance.

Bitcoin Price

Any more gains might send the price toward the $94,000 level. There is also a bearish trend line forming with resistance at $94,200 on the hourly chart of the BTC/USD pair. The next barrier for the bulls could be $95,000 and $95,500.

More Losses In BTC?

If Bitcoin fails to rise above the $91,650 resistance zone, it could start another decline. Immediate support is near the $88,800 level. The first major support is near the $88,000 level.

The next support is now near the $87,500 zone. Any more losses might send the price toward the $86,200 support in the near term. The main support sits at $85,000, below which BTC might accelerate lower in the near term.

Technical indicators:

Hourly MACD โ€“ The MACD is now gaining pace in the bearish zone.

Hourly RSI (Relative Strength Index) โ€“ The RSI for BTC/USD is now below the 50 level.

Major Support Levels โ€“ $88,800, followed by $88,000.

Major Resistance Levels โ€“ $91,650 and $92,000.

Solana (SOL) Loses Its Footing, Setting the Stage for Another Dive

Solana failed to settle above $145 and nosedived. SOL price is now consolidating losses below $135 and might decline further below $130.

  • SOL price started a fresh decline below $138 and $135 against the US Dollar.
  • The price is now trading below $135 and the 100-hourly simple moving average.
  • There is a key bearish trend line forming with resistance at $140 on the hourly chart of the SOL/USD pair (data source from Kraken).
  • The price could start a recovery wave if the bulls defend $132 or $130.

Solana Price Dips Again

Solana price failed to remain stable above $142 and started a fresh decline, like Bitcoin and Ethereum. SOL declined below the $140 and $138 support levels.

The price gained bearish momentum below $135. A low was formed at $130, and the price is now consolidating losses. The price recovered a few points and climbed above the 23.6% Fib retracement level of the downward move from the $143 swing high to the $130 low.

Solana is now trading below $135 and the 100-hourly simple moving average. On the upside, immediate resistance is near the $135 level. The next major resistance is near the $136 level or the 50% Fib retracement level of the downward move from the $143 swing high to the $130 low.

Solana Price

The main resistance could be $140. There is also a key bearish trend line forming with resistance at $140 on the hourly chart of the SOL/USD pair. A successful close above the $140 resistance zone could set the pace for another steady increase. The next key resistance is $144. Any more gains might send the price toward the $150 level.

Another Decline In SOL?

If SOL fails to rise above the $136 resistance, it could continue to move down. Initial support on the downside is near the $132 zone. The first major support is near the $130 level.

A break below the $130 level might send the price toward the $122 support zone. If there is a close below the $122 support, the price could decline toward the $115 support in the near term.

Technical Indicators

Hourly MACD โ€“ The MACD for SOL/USD is gaining pace in the bearish zone.

Hourly Hours RSI (Relative Strength Index) โ€“ The RSI for SOL/USD is below the 50 level.

Major Support Levels โ€“ $132 and $130.

Major Resistance Levels โ€“ $136 and $140.

XRP Price Hits Resistance on Recovery, Bulls Lose Momentum

XRP price started a recovery wave above $2.00 but failed near $2.020. The price is now showing a few bearish signs and might decline below $1.95.

  • XRP price started a recovery wave above the $1.920 zone.
  • The price is now trading below $2.00 and the 100-hourly Simple Moving Average.
  • There is a new bearish trend line forming with resistance at $2.030 on the hourly chart of the XRP/USD pair (data source from Kraken).
  • The pair could continue to move down if it settles below $1.950.

XRP Price Dips Again

XRP price remained supported above $1.850 and started a recovery wave, like Bitcoin and Ethereum. The price was able to climb above $1.950 and $1.980 to enter a short-term positive zone.

There was also a move above the 50% Fib retracement level of the downward move from the $2.065 swing high to the $1.847 low. The price even spiked above $2.00 before the bears appeared. The bulls failed to clear the $2.020 resistance. There is also a new bearish trend line forming with resistance at $2.030 on the hourly chart of the XRP/USD pair.

The price is now trading below $2.00 and the 100-hourly Simple Moving Average. If there is a fresh upward move, the price might face resistance near the $2.00 level. The first major resistance is near the $2.020 level or the 83.2% Fib retracement level of the downward move from the $2.065 swing high to the $1.847 low.

XRP Price

A close above $2.020 could send the price to $2.0650. The next hurdle sits at $2.10. A clear move above the $2.10 resistance might send the price toward the $2.150 resistance. Any more gains might send the price toward the $2.20 resistance. The next major hurdle for the bulls might be near $2.250.

Another Drop?

If XRP fails to clear the $2.020 resistance zone, it could start a fresh decline. Initial support on the downside is near the $1.950 level. The next major support is near the $1.9320 level.

If there is a downside break and a close below the $1.9320 level, the price might continue to decline toward $1.850. The next major support sits near the $1.820 zone, below which the price could continue lower toward $1.750.

Technical Indicators

Hourly MACD โ€“ The MACD for XRP/USD is now gaining pace in the bearish zone.

Hourly RSI (Relative Strength Index) โ€“ The RSI for XRP/USD is now below the 50 level.

Major Support Levels โ€“ $1.950 and $1.9320.

Major Resistance Levels โ€“ $2.00 and $2.020.

Ethereum Price Trapped Under $3,250, Momentum Tilts Lower

Ethereum price started a fresh decline from the $3,300 resistance. ETH is now consolidating losses and is at risk of more losses below $3,150.

  • Ethereum started a sharp downside correction below $3,250.
  • The price is trading below $3,220 and the 100-hourly Simple Moving Average.
  • There is a short-term declining channel forming with resistance at $3,210 on the hourly chart of ETH/USD (data feed via Kraken).
  • The pair could start a fresh increase if it stays above the $3,160 zone.

Ethereum Price Struggles Below Resistance

Ethereum price failed to remain stable above $3,280 and started a fresh decline, like Bitcoin. ETH price declined below $3,250 and $3,220 to enter a bearish zone.

The bears even pushed the price below the 61.8% Fib retracement level of the recent wave from the $3,060 swing low to the $3,402 high. The price finally tested $3,160 and is currently consolidating losses. There is also a short-term declining channel forming with resistance at $3,210 on the hourly chart of ETH/USD.

Ethereum price is now trading below $3,220 and the 100-hourly Simple Moving Average. If the bulls can protect more losses below $3,160, the price could attempt another increase.

Ethereum Price

Immediate resistance is seen near the $3,220 level. The first key resistance is near the $3,260 level. The next major resistance is near the $3,280 level. A clear move above the $3,280 resistance might send the price toward the $3,320 resistance. An upside break above the $3,320 region might call for more gains in the coming days. In the stated case, Ether could rise toward the $3,400 resistance zone or even $3,450 in the near term.

Downside Continuation In ETH?

If Ethereum fails to clear the $3,220 resistance, it could start a fresh decline. Initial support on the downside is near the $3,160 level. The first major support sits near the $3,140 zone or the 76.4% Fib retracement level of the recent wave from the $3,060 swing low to the $3,402 high.

A clear move below the $3,140 support might push the price toward the $3,080 support. Any more losses might send the price toward the $3,050 region. The main support could be $3,000.

Technical Indicators

Hourly MACD โ€“ The MACD for ETH/USD is gaining momentum in the bearish zone.

Hourly RSI โ€“ The RSI for ETH/USD is now below the 50 zone.

Major Support Level โ€“ $3,160

Major Resistance Level โ€“ $3,220

Bitcoin Price Action Turns Unsteady, Downside Threat Grow

Bitcoin price started a fresh decline below $94,000. BTC is consolidating losses and remains at risk of more losses if it dips below $91,500.

  • Bitcoin started a sharp decline below $94,000 and $93,000.
  • The price is trading below $93,000 and the 100 hourly Simple moving average.
  • There is a bearish trend line forming with resistance at $94,600 on the hourly chart of the BTC/USD pair (data feed from Kraken).
  • The pair might continue to move down if it stays below the $94,000 zone.

Bitcoin Price Turns Red

Bitcoin price failed to stay above the $93,500 support and started a fresh decline. BTC declined sharply below the $93,000 and $92,500 support levels.

The bears even pushed the price below $92,000. A low was formed at $91,866, and the price is now consolidating losses. There was a minor recovery wave above the 23.6% Fib retracement level of the recent decline from the $95,475 swing high to the $91,866 low.

However, the bears remained active near $93,200. Besides, there is a bearish trend line forming with resistance at $94,600 on the hourly chart of the BTC/USD pair.

Bitcoin is now trading below $93,000 and the 100 hourly Simple moving average. If the price remains stable above $92,000, it could attempt a fresh increase. Immediate resistance is near the $92,800 level. The first key resistance is near the $93,200 level.

Bitcoin Price

The next resistance could be $93,650 or the 50% Fib retracement level of the recent decline from the $95,475 swing high to the $91,866 low. A close above the $93,650 resistance might send the price further higher. In the stated case, the price could rise and test the $94,000 resistance. Any more gains might send the price toward the $94,500 level. The next barrier for the bulls could be $95,000 and $95,500.

Downside Break In BTC?

If Bitcoin fails to rise above the $93,650 resistance zone, it could start another decline. Immediate support is near the $92,000 level. The first major support is near the $91,800 level.

The next support is now near the $91,200 zone. Any more losses might send the price toward the $90,500 support in the near term. The main support sits at $90,000, below which BTC might accelerate lower in the near term.

Technical indicators:

Hourly MACD โ€“ The MACD is now gaining pace in the bearish zone.

Hourly RSI (Relative Strength Index) โ€“ The RSI for BTC/USD is now below the 50 level.

Major Support Levels โ€“ $92,000, followed by $91,800.

Major Resistance Levels โ€“ $93,650 and $94,000.

Dogecoin (DOGE) Red Prints Return, Resistance Could Cap Any Recovery

Dogecoin started a fresh decline below the $0.1320 zone against the US Dollar. DOGE is now consolidating losses and might face hurdles near $0.1350.

  • DOGE price started a fresh decline below the $0.1250 level.
  • The price is trading below the $0.130 level and the 100-hourly simple moving average.
  • There is a connecting bearish trend line forming with resistance at $0.1350 on the hourly chart of the DOGE/USD pair (data source from Kraken).
  • The price could extend losses if it stays below $0.1300 and $0.1350.

Dogecoin Price Dives Below Support

Dogecoin price started a fresh decline after it closed below $0.1350, like Bitcoin and Ethereum. DOGE declined below the $0.1300 and $0.1250 support levels.

The price even traded below $0.120. A low was formed near $0.1154, and the price is now showing bearish signs. There was a recovery wave above $0.1220. The price cleared the 23.6% Fib retracement level of the downward move from the $0.1512 swing high to the $0.1154 low.

Dogecoin price is now trading below the $0.130 level and the 100-hourly simple moving average. If there is a recovery wave, immediate resistance on the upside is near the $0.130 level.

The first major resistance for the bulls could be near the $0.1330 level or the 50% Fib retracement level of the downward move from the $0.1512 swing high to the $0.1154 low. The next major resistance is near the $0.1350 level and trend line.

Dogecoin Price

A close above the $0.1350 resistance might send the price toward the $0.1380 resistance. Any more gains might send the price toward the $0.140 level. The next major stop for the bulls might be $0.1420.

More Losses In DOGE?

If DOGEโ€™s price fails to climb above the $0.1300 level, it could continue to move down. Initial support on the downside is near the $0.1250 level. The next major support is near the $0.1220 level.

The main support sits at $0.120. If there is a downside break below the $0.120 support, the price could decline further. In the stated case, the price might slide toward the $0.1150 level or even $0.1135 in the near term.

Technical Indicators

Hourly MACD โ€“ The MACD for DOGE/USD is now losing momentum in the bearish zone.

Hourly RSI (Relative Strength Index) โ€“ The RSI for DOGE/USD is now below the 50 level.

Major Support Levels โ€“ $0.1250 and $0.1220.

Major Resistance Levels โ€“ $0.1300 and $0.1350.

XRP Price Stabilizes After Flash Crash, Market Watches Closely

XRP price extended losses and traded dived $2.00. The price is now consolidating and might decline further if it remains below $2.00.

  • XRP price started a fresh decline below the $2.00 zone.
  • The price is now trading below $2.00 and the 100-hourly Simple Moving Average.
  • There was a break below a contracting triangle with support at $2.050 on the hourly chart of the XRP/USD pair (data source from Kraken).
  • The pair could continue to move down if it stays below $2.00.

XRP Price Dips Sharply

XRP price failed to stay above $2.10 and started a fresh decline, like Bitcoin and Ethereum. The price declined below $2.020 and $2.00 to enter a short-term bearish zone.

There was a break below a contracting triangle with support at $2.050 on the hourly chart of the XRP/USD pair. The price even spiked below $1.880. A low was formed at $1.847, and the price is now consolidating losses. There was a recovery wave above $1.920. The price even tested the 50% Fib retracement level of the downward move from the $2.065 swing high to the $1.847 low, but the bears remained active.

The price is now trading below $2.00 and the 100-hourly Simple Moving Average. If there is a fresh upward move, the price might face resistance near the $1.980 level and the 61.8% Fib retracement level of the downward move from the $2.065 swing high to the $1.847 low.

XRP Price

The first major resistance is near the $2.00 level. A close above $2.00 could send the price to $2.065. The next hurdle sits at $2.10. A clear move above the $2.10 resistance might send the price toward the $2.120 resistance. Any more gains might send the price toward the $2.150 resistance. The next major hurdle for the bulls might be near $2.20.

More Losses?

If XRP fails to clear the $2.00 resistance zone, it could start a fresh decline. Initial support on the downside is near the $1.9320 level. The next major support is near the $1.90 level.

If there is a downside break and a close below the $1.90 level, the price might continue to decline toward $1.850. The next major support sits near the $1.820 zone, below which the price could continue lower toward $1.80.

Technical Indicators

Hourly MACD โ€“ The MACD for XRP/USD is now losing pace in the bearish zone.

Hourly RSI (Relative Strength Index) โ€“ The RSI for XRP/USD is now below the 50 level.

Major Support Levels โ€“ $1.920 and $1.90.

Major Resistance Levels โ€“ $1.980 and $2.00.

Ethereum Price Falls Back to $3,200, Recovery Faces Its First Real Test

Ethereum price started a fresh decline from the $3,400 resistance. ETH is now consolidating losses and holding the key support at $3,200.

  • Ethereum started a sharp downside correction below $3,320.
  • The price is trading below $3,250 and the 100-hourly Simple Moving Average.
  • There was a break below a bullish trend line with support at $3,220 on the hourly chart of ETH/USD (data feed via Kraken).
  • The pair could start a fresh increase if it stays above the $3,180 zone.

Ethereum Price Dips To Support

Ethereum price failed to remain stable above $3,300 and started a fresh decline, like Bitcoin. ETH price declined below $3,280 and $3,250 to enter a bearish zone.

There was a break below a bullish trend line with support at $3,220 on the hourly chart of ETH/USD. The pair even declined below the 50% Fib retracement level of the recent wave from the $3,060 swing low to the $3,402 high. The price finally tested $3,180.

Ethereum price is now trading below $3,250 and the 100-hourly Simple Moving Average. If the bulls can protect more losses below $3,180 or the 61.8% Fib retracement level of the recent wave from the $3,060 swing low to the $3,402 high, the price could attempt another increase.

Ethereum Price

Immediate resistance is seen near the $3,230 level. The first key resistance is near the $3,250 level. The next major resistance is near the $3,280 level. A clear move above the $3,280 resistance might send the price toward the $3,320 resistance. An upside break above the $3,320 region might call for more gains in the coming days. In the stated case, Ether could rise toward the $3,400 resistance zone or even $3,450 in the near term.

More Losses In ETH?

If Ethereum fails to clear the $3,250 resistance, it could start a fresh decline. Initial support on the downside is near the $3,200 level. The first major support sits near the $3,180 zone.

A clear move below the $3,180 support might push the price toward the $3,120 support. Any more losses might send the price toward the $3,050 region. The main support could be $3,000.

Technical Indicators

Hourly MACD โ€“ The MACD for ETH/USD is losing momentum in the bearish zone.

Hourly RSI โ€“ The RSI for ETH/USD is now below the 50 zone.

Major Support Level โ€“ $3,180

Major Resistance Level โ€“ $3,280

Bitcoin Price Sharp Pullback Raises One Question: Will $92K Hold?

Bitcoin price started a fresh decline below $95,000. BTC is consolidating losses and remains at risk of more losses if it dips below $92,000.

  • Bitcoin started a sharp decline below $95,000 and $94,000.
  • The price is trading below $93,500 and the 100 hourly Simple moving average.
  • There was a break below a declining channel with support at $93,550 on the hourly chart of the BTC/USD pair (data feed from Kraken).
  • The pair might continue to move down if it stays below the $954000 zone.

Bitcoin Price Dips Sharply

Bitcoin price failed to stay above the $94,500 support and started a fresh decline. BTC declined sharply below the $94,000 and $93,500 support levels.

There was a move below the 61.8% Fib retracement level of the recent wave from the $89,995 swing low to the $97,898 high. Besides, there was a break below a declining channel with support at $93,550 on the hourly chart of the BTC/USD pair.

The price even spiked below $92,000. It tested the 76.4% Fib retracement level of the recent wave from the $89,995 swing low to the $97,898 high. Bitcoin is now trading below $93,500 and the 100 hourly Simple moving average.

If the price remains stable above $92,000, it could attempt a fresh increase. Immediate resistance is near the $93,000 level. The first key resistance is near the $93,500 level.

Bitcoin Price

The next resistance could be $94,000. A close above the $94,000 resistance might send the price further higher. In the stated case, the price could rise and test the $95,000 resistance. Any more gains might send the price toward the $95,500 level. The next barrier for the bulls could be $96,200 and $96,400.

Downside Continuation In BTC?

If Bitcoin fails to rise above the $93,500 resistance zone, it could start another decline. Immediate support is near the $92,000 level. The first major support is near the $91,800 level.

The next support is now near the $91,300 zone. Any more losses might send the price toward the $90,500 support in the near term. The main support sits at $90,000, below which BTC might accelerate lower in the near term.

Technical indicators:

Hourly MACD โ€“ The MACD is now losing pace in the bearish zone.

Hourly RSI (Relative Strength Index) โ€“ The RSI for BTC/USD is now below the 50 level.

Major Support Levels โ€“ $92,000, followed by $91,800.

Major Resistance Levels โ€“ $93,000 and $93,500.

โŒ