Analyst Says You’re Not Bullish Enough On Ethereum – What Does He Mean?
A growing number of analysts believe Ethereum’s current price action is being misunderstood. Although frustration is growing due to Ethereum’s inability to hold above $3,000, some technical analysts are quick to point out that the structure forming beneath the surface tells a very different story. According to one analyst, the real risk right now is not being bullish on Ethereum and trying to short in anticipation of a downside breakout.
Higher Lows And A Structure That Keeps Tightening
The analyst’s technical view on Ethereum is focused less on short-term momentum and more on the structure developing on the chart, which he argues is even clearer than what is currently visible on Bitcoin’s chart.
Notably, Ethereum’s price action is carving out a series of higher lows on the daily candlestick timeframe chart to form a tightening triangular pattern since December 2025. This kind of behavior shows that each pullback is being absorbed at progressively higher levels, which is how strong trends reset before continuation.
Ethereum needs to avoid a breakdown below key support zones in order for this trend continuation setup to still be valid. According to the analyst, a dip under $2,860 would begin to weaken the pattern, while a close below $2,780 would invalidate the higher-low structure.
At the time of writing, Ethereum is trading around $2,950, which is dangerously close to the lower boundary of this setup. Therefore, some traders will be tempted to short Ethereum at this level, but the analyst called it the dumbest thing to do here.
As long as those levels ($2,860 and $2,780) hold, the analyst sees no technical justification for betting against ETH, especially near the lower boundary of the channel where buyers have repeatedly stepped in.
If support holds, the next move would be a gradual return to the upper trendline of the channel, which is just below $3,340. A move into that region would bring price back into direct contact with overhead resistance and set the stage for a breakout if buying pressure continues to increase.
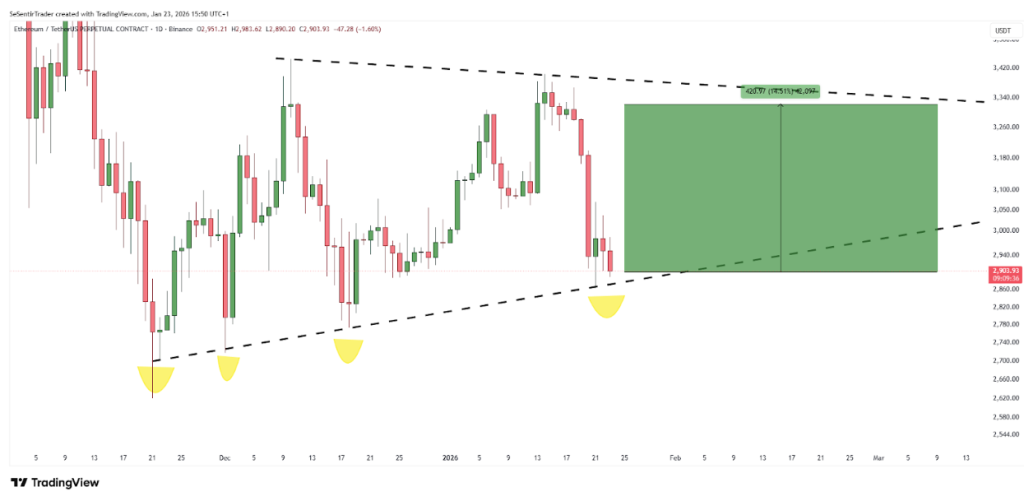
Ethereum Price Chart. Source: @Tryrexcrypto on X
The Bigger Picture Behind Ethereum’s Price Action
Ethereum is entering 2026 without clear bullish momentum, a reality that has dampened sentiment across the spot and derivatives markets. Spot ETF inflows into Ethereum and Bitcoin have slowed down, and issuers have been highlighted with consistent days of outflows.
Nonetheless, major asset managers are still holding huge amounts of Ethereum and are working on diversifying their activities on Ethereum. BlackRock, for example, filed with the SEC in December to launch a staked Ethereum exchange-traded fund, a move that will bring in more institutional investors into the Ethereum ecosystem.
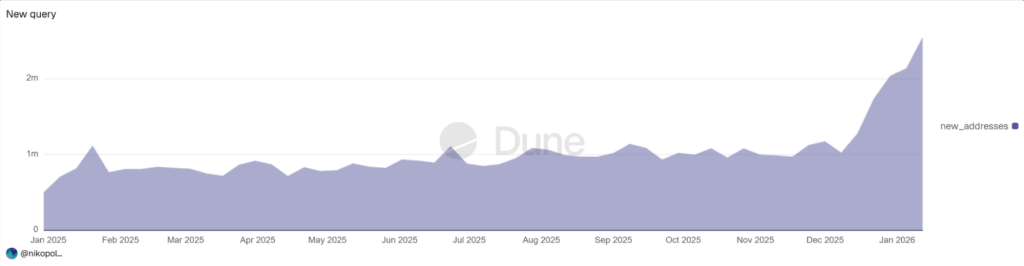
Speaking of staking, BitMine Technologies recently amped up its ETH staking to over $5.71 billion worth of Ethereum. On-chain data from Arkham Intelligence shows that the firm has staked an additional 171,264, worth $503.2 million, pushing its total stake to over 1.94 million ETH.
Featured image from Unsplash, chart from TradingView


 (@DonWedge)
 ChartNerd
  (@ChartNerdTA)
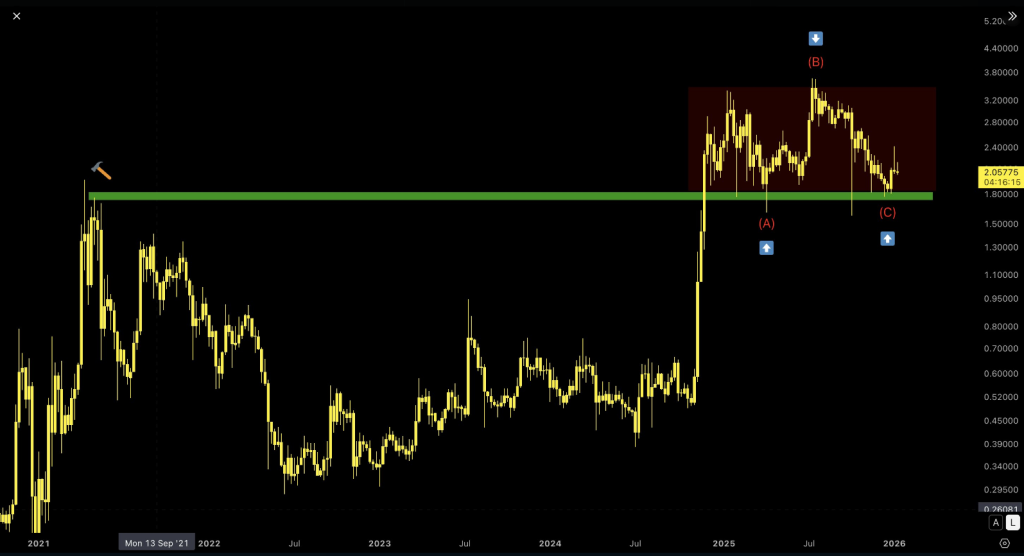

 What Regulators Might Ask